Macroeconomics
- 格式:doc
- 大小:254.00 KB
- 文档页数:10


宏观经济学英文名词宏观经济学(Macroeconomics)是经济学的一个分支,研究整个经济系统的总体行为和发展趋势。
它关注的是国家和地区整体经济,而不是个体经济主体的行为。
下面是一些与宏观经济学相关的英文名词和参考内容:1. GDP (Gross Domestic Product): GDP is the total value of all goods and services produced within a country's borders in a specific period of time. It is widely used as a measure of economic growth and is a key indicator of a country's overall economic performance.2. Inflation: Inflation refers to the increase in the general price level of goods and services over a period of time. It is usually measured by the Consumer Price Index (CPI) or the Producer Price Index (PPI). High inflation can erode purchasing power and lead to economic instability.3. Unemployment rate: The unemployment rate is the percentage of the labor force that is unemployed and actively seeking employment. It is an important indicator of the health of an economy and can have significant social and political implications.4. Fiscal policy: Fiscal policy refers to the use of government spending and taxation to influence the overall economy. It can be expansionary (increasing government spending or reducing taxes) or contractionary (reducing government spending or increasing taxes) depending on the state of the economy.5. Monetary policy: Monetary policy involves the control and regulation of the money supply and interest rates by a central bank, such as the Federal Reserve in the United States. It is used to stabilize the economy, control inflation, and promote economic growth.6. Exchange rate: The exchange rate is the value of one currency in terms of another currency. Changes in exchange rates can have a significant impact on international trade, investment, and economic competitiveness.7. Balance of trade: The balance of trade is the difference betweena country's exports and imports of goods and services. A positive balance of trade (exporting more than importing) is known as a trade surplus, while a negative balance of trade is known as a trade deficit. This indicator is important for measuring a country's international trade competitiveness.8. Economic growth: Economic growth refers to an increase in the production and consumption of goods and services in an economy over time. It is usually measured by the annual percentage change in real GDP. Sustainable economic growth is a key goal for most countries.9. Aggregate demand: Aggregate demand is the total demand for goods and services in an economy at a given price level and period of time. It is affected by factors such as consumer spending, investment, government spending, and net exports.10. Business cycle: The business cycle refers to the fluctuations ineconomic activity over time. It consists of four phases: expansion (growth), peak (highest point), contraction (slowdown), and trough (lowest point). Understanding the business cycle is important for predicting and managing economic fluctuations.These are just a few examples of the many concepts and terms used in the field of macroeconomics. They provide insights into the overall performance, trends, and policies that shape an economy.。
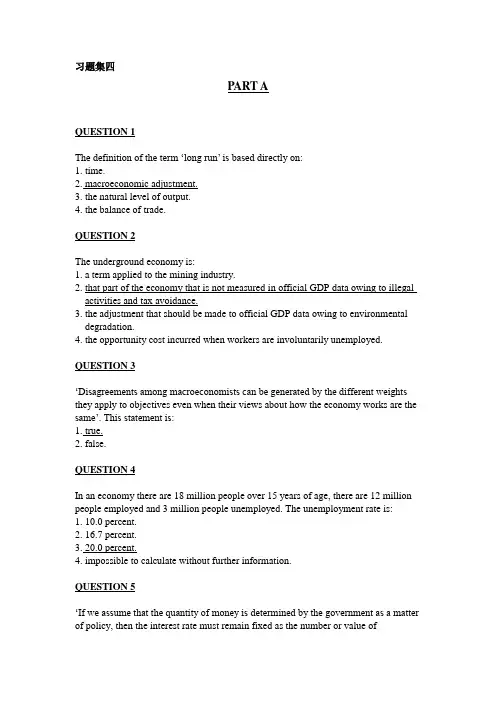
习题集四PART AQUESTION 1The definition of the term ‘long run’ is based directly on:1. time.2. macroeconomic adjustment.3. the natural level of output.4. the balance of trade.QUESTION 2The underground economy is:1. a term applied to the mining industry.2. that part of the economy that is not measured in official GDP data owing to illegal activities and tax avoidance.3. the adjustment that should be made to official GDP data owing to environmental degradation.4. the opportunity cost incurred when workers are involuntarily unemployed. QUESTION 3‘Disagreements among macroeconomists can be generated by the different weights they apply to objectives even when their views about how the economy works are the same’. This statement is:1. true.2. false.QUESTION 4In an economy there are 18 million people over 15 years of age, there are 12 million people employed and 3 million people unemployed. The unemployment rate is:1. 10.0 percent.2. 16.7 percent.3. 20.0 percent.4. impossible to calculate without further information.QUESTION 5‘If we assume that the quantity of money is determined by the government as a matter of policy, then the interest rate must remain fixed as the number or value oftransactions changes.’ This statement is:1. true.2. false.QUESTION 6If the net value of the autonomous and policy-determined expenditures in a closed economy is $200 billion and the marginal propensity to consume is 0.8, then equilibrium output is:1. $200 billion.2. $250 billion.3. $800 billion.4. $1,000 billion.5. impossible to calculate without further information, but must be greater than $200 billion.Note: Y = Z(equilibium condition of goods market)→Y = Z C + I + G = c0 + c1(Y-T) + I + G→(1- c1)Y= c0 + I + G - c1T→Y =〔1/ (1- c1) 〕(c0 + I + G - c1T )(c0+ I + G - c1T ) is the net value of the autonomous and policy-determined expenditure.So, Y =〔1/ (1- c1) 〕(c0 + I + G - c1T )=〔1/ (1- 0.8) 〕* ( 200)=1000QUESTION 7For the economy in question 6 above, if income tax levied by the government is a lump sum of $200 billion (T = 200), then equilibrium consumption is:1. $160 billion.2. $200 billion.3. $360 billion.4. $800 billion.5. impossible to calculate without further information, but must be at least equal to $640 billion.Note: C= c0+c1(Y-T)= c0+0.8(1000-200)= c0+640QUESTION 8Macroeconomic models that allow for adjustment over time are called:1. simulation models.2. regression models.3. dynamic models.4. equilibrium models.5. econometric models.QUESTION 9Which of the following lists contains variables that are all stock variables?1. Income, saving, investment.2. Wealth, saving, investment.3. Wealth, savings, quantity of money.4. Savings, quantity of money, investment.QUESTION 10Which of the following statements is true when wealth can be held as money or bonds only and consumption is determined by current income only?1. Demand for money and demand for bonds are independent of each other.2. Other things being equal, an increase in wealth causes the demand for money to increase.3. Other things being equal, an increase in the interest rate leads to an increase in the demand for bonds.4. More than one of the statements above is true.5. None of the above statements is true.QUESTION 11If the central bank purchases government bonds on the open market (open market operations), a macroeconomist would conclude that it wishes to impact:1. aggregate demand.2. real income.3. the nominal interest rate.4. the real interest rate.QUESTION 12The IS relation identifies all combinations of real interest rate and real income at which the:1. goods market is in equilibrium.2. money market is in equilibrium.3. bond market is in equilibrium.4. both the goods and money markets are in equilibrium.5. all of the goods, money and bond markets are in equilibrium.QUESTION 13A decision by a government to increase income tax and reduce government spending simultaneously is:1. fiscal contraction.2. monetary contraction.3. fiscal expansion.4. monetary expansion.QUESTION 14In the IS–LM model an increase in income will cause:1. an increase in consumption.2. an increase in investment.3. an increase in the demand for money.4. both 1 and 2 above.5. all of 1, 2 and 3 above.QUESTION 15‘If the government of a closed economy wished to reduce the interest rate with little or no decline in output, it would combine monetary expansion with fiscal contraction.’ This statement is:1. true.2. false.QUESTION 16In the table below data are provided for selected macroeconomic variables for the former West Germany around the time of unification.Data in the table are consistent with:1. contractionary monetary policy.2. expansionary monetary policy.3. neutral monetary policy.QUESTION 17In the dynamic IS–LM model it is normally assumed that the interest rate:1. and output both adjust slowly.2. and output both adjust quickly.3. adjusts slowly, but output adjusts quickly.4. adjusts quickly, but output adjusts slowly.QUESTION 18If the inflation rate in Australia in 2000 is expected to be 5.5 percent and the nominal interest rate is expected to be 7.5 percent per year, the real interest rate is expected to be approximately:1. –2.0 percent per year.2. zero.3. 2.0 percent per year.4. 5.5 percent per year.5. 7.5 percent per year.QUESTION 19If a shareholder in a business is expecting a real dividend of $550 one year from now, what is the expected present discounted real value of that dividend if the real rate of interest is 10 percent per year now and is expected to remain at that rate?1. $495.2. $500.3. $550.4. it is impossible to calculate expected present discounted real value without knowing the expected rate of inflation.QUESTION 20Other things being equal, in the short run an increase in expected inflation is associated with:1. a decrease in output.2. an increase in output.3. either a decrease or an increase in output depending on the size of the increase in expected inflation.QUESTION 21Which of the following statements may be assumed to be true in macroeconomic modelling?1. Both the IS and LM relations depend on the nominal interest rate.2. The difference between the real interest rates on money and bonds is normally less than the expected inflation rate.3. Money has a zero real interest rate.4. More than one of the statements above is true.5. None of statements above is true.QUESTION 22Consumption is likely to fluctuate:1. less than investment.2. more than investment.3. about as much as investment.QUESTION 23If the expected present discounted present value of a planned investment project is less than the cost of that investment project, a business firm should:1. borrow and proceed with the project.2. proceed with the project only if there are sufficient internal funds to finance the project.3. not proceed with the project.QUESTION 24‘The user cost of capital is equivalent to the initial purchase price of that capital.’ This statement is:1. true.2. false.QUESTION 25In comparing bonds carrying identical risk of default, but having different maturity dates, it is necessary to consider their:1. interest rates.2. yields to maturity.3. yield curves.4. coupon payments.QUESTION 26In recent years share prices on the major stock exchanges around the world have:1. been close to their fundamental values.2. often deviated from their fundamental values.3. been explicable only in terms of fads.4. been explicable only in terms of rational speculative bubbles.QUESTION 27Introducing expectations into the IS–LM model can be expected to make:1. the IS curve steeper without affecting the LM curve.2. the IS curve flatter without affecting the LM curve.3. both the IS curve and the LM curve shift.QUESTION 28The real exchange rate is defined as the:1. price of foreign currency in terms of domestic currency.2. price of foreign goods in terms of domestic goods.3. price of foreign goods divided by the price of domestic goods4. nominal exchange rate divided by the domestic price index.QUESTION 29In the following table some data on the balance of payments for an economy are provided.The current account balance for the economy is:1. –$0.2 billion.2. –$2.2 billion.3. –$2.4 billion.4. +$0.6 billion.5. +$3.0 billion.QUESTION 30If a country with a floating exchange rate has a current account surplus it will have a capital account balance that is:1. positive.2. negative.3. equal to zero.QUESTION 31Assume that the interest parity relation holds. If the interest rate on domestic bonds is less than the interest rate on foreign bonds, the:1. domestic currency is expected to appreciate.2. domestic currency is expected to depreciate.3. expected return on foreign bonds is greater than the expected return on domestic bonds.4. expected return on foreign bonds is less than the expected return on domestic bonds.QUESTION 32If a real depreciation of the exchange rate is to improve the trade balance, it is necessary that the quantity of:1. exports increase.2. imports decrease.3. exports increase and the quantity of imports decrease by enough to compensate for the increase in the price of imports.4. exports increase and the quantity of imports decrease by enough to compensate for the increase in the price of imports and the increase in the government budget deficit.QUESTION 33If total saving and investment in an economy are equal to each other, then net exports will be:1. positive.2. negative.3. zero.4. either positive or negative depending on the nominal exchange rate.Note: NX = S + (T - G) - IQUESTION 34Compared to the closed economy IS curve, the open economy IS curve is:1. steeper.2. flatter.3. neither steeper nor flatter.QUESTION 35In most high income economies wages are determined by:1. the interaction of labour supply and demand.2. the reservation wage.3. relative bargaining power of workers and employers.4. a combination of 1 and 2 above.5. a combination of 2 and 3 above.QUESTION 36If individual goods markets are not perfectly competitive, it can be assumed that the markup will be:1. positive.2. negative.3. zero.4. any one of the above depending on the Q ratios of firms in individual goods markets.QUESTION 37If the expected price level increases:1. there will be a one-for-one increase in output.2. there will be a one-for-one increase in the price level.3. the aggregate demand curve will shift down.4. the aggregate demand curve will become steeper.5. more than one, but not all, of the above will occur.QUESTION 38A change in the nominal stock of money will be associated with a change in output in:1. the short run only.2. the long run only.3. both the short and long run.QUESTION 39Olivier Blanchard has estimated that the relationship between changes in the inflation rate (πt –πt-1) and the rate of unemployment (u t) in the USA as (πt –πt-1) = 7.5 –1.15u t. If the rate of unemployment in the USA falls from 7.5 to 5.5 percent, the rate of inflation can be expected to:1. increase by2.3 percentage points.2. decrease by 2.3 percentage points.3. remain constant.4. increase by5.2 percent.5. decrease by 5.2 percentage points.Note: (πt –πt-1) = 7.5 – 1.15u t = – 1.15(u t–7.5/1.15)QUESTION 40Uncertainty of knowledge in macroeconomics should cause policy makers to use:1. more active policies than they otherwise would.2. less active policies than they otherwise would.3. monetary policy in preference to fiscal policy.4. fiscal policy in preference to monetary policy.PART BQUESTION 41Define both of the following terms:(a) Eurosclerosis: p637 of text book.( “欧洲硬化症”: 用来描述欧洲经济萎靡不振,欧洲经济为高失业率和低增长率所困扰。
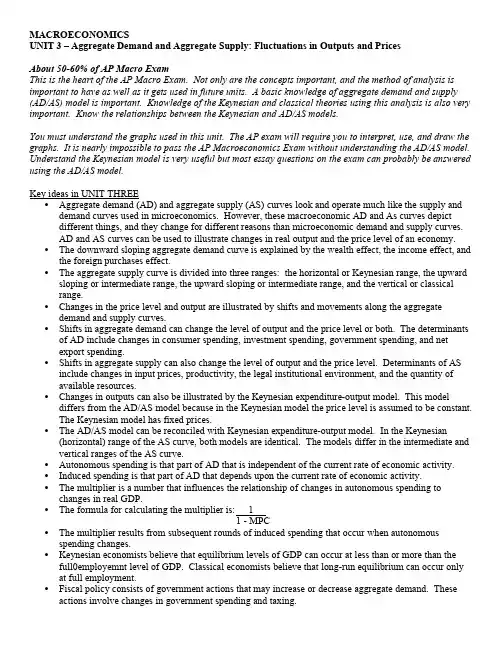
MACROECONOMICSUNIT 3 – Aggregate Demand and Aggregate Supply: Fluctuations in Outputs and PricesAbout 50-60% of AP Macro ExamThis is the heart of the AP Macro Exam. Not only are the concepts important, and the method of analysis is important to have as well as it gets used in future units. A basic knowledge of aggregate demand and supply (AD/AS) model is important. Knowledge of the Keynesian and classical theories using this analysis is also very important. Know the relationships between the Keynesian and AD/AS models.You must understand the graphs used in this unit. The AP exam will require you to interpret, use, and draw the graphs. It is nearly impossible to pass the AP Macroeconomics Exam without understanding the AD/AS model. Understand the Keynesian model is very useful but most essay questions on the exam can probably be answered using the AD/AS model.Key ideas in UNIT THREE•Aggregate demand (AD) and aggregate supply (AS) curves look and operate much like the supply and demand curves used in microeconomics. However, these macroeconomic AD and As curves depictdifferent things, and they change for different reasons than microeconomic demand and supply curves.AD and AS curves can be used to illustrate changes in real output and the price level of an economy.•The downward sloping aggregate demand curve is explained by the wealth effect, the income effect, and the foreign purchases effect.•The aggregate supply curve is divided into three ranges: the horizontal or Keynesian range, the upward sloping or intermediate range, the upward sloping or intermediate range, and the vertical or classicalrange.•Changes in the price level and output are illustrated by shifts and movements along the aggregate demand and supply curves.•Shifts in aggregate demand can change the level of output and the price level or both. The determinants of AD include changes in consumer spending, investment spending, government spending, and netexport spending.•Shifts in aggregate supply can also change the level of output and the price level. Determinants of AS include changes in input prices, productivity, the legal institutional environment, and the quantity ofavailable resources.•Changes in outputs can also be illustrated by the Keynesian expenditure-output model. This model differs from the AD/AS model because in the Keynesian model the price level is assumed to be constant.The Keynesian model has fixed prices.•The AD/AS model can be reconciled with Keynesian expenditure-output model. In the Keynesian (horizontal) range of the AS curve, both models are identical. The models differ in the intermediate and vertical ranges of the AS curve.•Autonomous spending is that part of AD that is independent of the current rate of economic activity.•Induced spending is that part of AD that depends upon the current rate of economic activity.•The multiplier is a number that influences the relationship of changes in autonomous spending to changes in real GDP.•The formula for calculating the multiplier is: 11 - MPC•The multiplier results from subsequent rounds of induced spending that occur when autonomous spending changes.•Keynesian economists believe that equilibrium levels of GDP can occur at less than or more than the full0employemnt level of GDP. Classical economists believe that long-run equilibrium can occur only at full employment.•Fiscal policy consists of government actions that may increase or decrease aggregate demand. These actions involve changes in government spending and taxing.•The government uses an expansionary fiscal policy to try to increase aggregate demand during a recession. The government may decrease taxes, increase spending, or do a combination of the two. •The government uses a contractionary fiscal policy to try to decrease aggregate demand during a period of inflation. The government may increase taxes, decrease spending, or do a combination of the two. •Discretionary fiscal policy means the federal government must take deliberate action or pass a new law changing taxes or spending. The automatic or built-in stabilizers change government spending or taxes without new laws being passed or deliberate action being taken.•The balanced budget multiplier indicates that equal increases or decreases in taxes and government spending increase or decrease equilibrium GDP by an amount equal to that increase or decrease. •Stagflation can be explained by a decrease in aggregate supply.。
宏观经济学(Macroeconomics),是使用国民收入、国民经济统计等宏观经济学数,对一个国家的经济活动开展研究。
宏观经济学是相对于微观经济学之中的各个学派以国民生产总值以及国民收入主要指标的研究视角,国民经济学、太阳经济学都被认为是宏观经济学研究领域之一。
宏观经济学是现代经济学科学体系中重要的学科,宏观经济学来源于法国魁奈的《农业经济管理论》(1613)和英国坎蒂隆的《商业性质概论》(1758)。
首次使用“宏观经济学”一词的是1893年一位英国经济学家创造出来的。
宏观经济学的英文介绍如下:Macroeconomics is a field of economics that studies the performance of the economy as a whole. It focuses on aggregate variables such as national income, output, employment, and inflation, and explores how these variables interact and respond to policy changes. Macroeconomics also examines the role of government policies in stabilizing the economy and achieving economic growth.The key theories and models in macroeconomics include the Keynesian model, which emphasizes the role of government spending and taxation in stabilizing the economy; the monetarist model, which emphasizes the role of money supply and inflation in macroeconomic performance; and the supply-side model, which emphasizes the role of supply-side factors such as labor supply and capital in economic growth.Macroeconomists also study international macroeconomics, which explores how countries' economies interact with each other through trade, exchange rates, and financial markets. They also study macroeconomic policies such as fiscal policy (taxes and government spending) and monetary policy (changes in interest rates and money supply) and how they can be used to achieve economic stability and growth.希望以上信息对您有所帮助。
经济学(Economics):研究人和社会对具有不同用途的稀缺资源配置并加以选择的科学;其目标是有效利用稀缺资源来生产商品和劳务,并在现在或将来把它们合理地分配给社会成员或集团以供消费之用。
微观经济学(Microeconomics):研究微观(Micro)、或“小型”经济单位的经济行为,如单个消费者、生产者和单一市场的经济行为。
宏观经济学(Macroeconomics):研究社会总体的经济行为及其后果,即对整个社会的消费、投资、生产、收入等进行分析研究。
经济人(Economic man):作出决策的出发点是个人利益,寻求个人利益最大化。
需求(Demand):一种商品的需求是指消费者在一定时期内在各种可能的价格下愿意而且能够购买的该种商品的数量。
需求函数(Demand function):用来表示一种商品的需求数量和影响该需求数量的各种因素之间相关关系的数学表达式。
供给(Supply):一种商品的供给是指生产者在一定时期内在各种可能的价格下愿意而且能够提供出售的该种商品的数量。
供给函数(Supply function):用来表示一种商品的供给数量和影响该供给数量的各种因素之间相关关系的数学表达式。
均衡(Equilibrium):指各个经济决策者(消费者、厂商)所作出的决策正好相容,在外界条件不变的情况下,每个人都不愿意再调整自己的决策,是一种相对静止的状态。
均衡价格(Equilibrium price):指商品的市场需求量和市场供给量相等时候的价格。
均衡数量(Equilibrium quantity):在均衡价格水平下相等的供求数量。
均衡点(Equilibrium point):一种商品的市场需求曲线和市场供给曲线的交点。
需求量的变动(Variation of demand quantity):仅仅因价格因素的变动而引起的需求数量的变动,是一种线上运动。
需求的变动(Variation od demand):由于价格以外的因素的变动而引起的需求数量的变动,是一种线的移动。
衰退名词解释宏观经济学
宏观经济学,英文名称Macroeconomics,是使用国民收入、经济整体的投资和消费等总体性的统计概念来分析经济运行规律的一个经济学领域。
经济衰退(Economicrecession),指经济出现停滞或负增长的时期。
不同的国家对衰退有不同的定义,但美国以经济连续两个季度出现负增长为衰退的定义被人们广泛使用。
而在宏观经济学上通常定义为“在一年中,一个国家的国内生产总值(GDP)增长连续两个或两个以上季度出现下跌”。
但是这个定义并未被全世界各国广泛接受。
比如,美国国家经济研究局就将经济衰退定义成更为模糊的“大多数经济领域内的经济活动连续几个月出现下滑”。
凯恩斯认为对商品总需求的减少是经济衰退的主要原因。
宏经名词解释1.Macroeconomics:The study of the economy as a whole.宏观经济学:把经济视为一个整体而进行的研究。
2.Gross domestic product (GDP):The total income earned domestically, including theincome earned by foreign-owned factors of production; the total expenditure on domestically produced goods and services.国内生产总值:国内所获得的总收入,包括在国外使用的生产要素带来的收入;对一国产品与服务产出的总支出。
3.Value added:The value of a firm’s output minus the value of the intermediate goods thefirm purchased.增加值:企业产出的价值减去企业购买的中间产品的价值。
4.Real GDP :The value of goods and services measured using a constant set of prices.实际GDP:用一组不变价格衡量的产品与服务的价值。
5.GDP deflator:The ratio of nominal GDP to real GDP; a measure of the overall level ofprices that shows the cost of the currently produced basket of goods relative to the cost of that basket in a base year.GDP平减指数:名义GDP与实际GDP比率;衡量总体价格水平的指标,表现现期生产的一篮子物品的成本相对于基年生产的同一篮子物品的成本的值。
宏观经济学原理曼昆名词解释微观经济学〔microeconomics〕,研究家庭和企业如何做出决策,以及它们如何在市场上互相影响。
宏观经济学〔macroeconomics〕,研究整体经济现象,包括通货膨胀、失业和经济增长。
国内消费总值GDP〔gross domestic product〕,在某一既定时期,一个国家内消费的所有最终物品与效劳的市场价值。
消费〔consumption〕,家庭除购置新住房之外,用于物品与效劳的支出。
投资〔investment〕,用于资本设备、存货和建筑物的支出,包括家庭用于购置新住房的支出。
政府购置〔government purchase〕,地方、州和联邦政府用于物品与效劳的支出。
净出口〔net export〕,外国人对国内消费的物品的支出〔出口〕,减国内居民对外国物品的支出〔进口〕。
名义GDP〔nominal GDP〕,按现期价格评价的物品与效劳的消费。
真实GDP〔real GDP〕,按不变价格评价的物品与效劳的消费。
〔总之,名义GDP是用当年价格来评价经济中物品与效劳消费的价值,真实GDP是用不变的基年价格来评价经济中物品与效劳消费的价值。
〕GDP平减指数〔GDP, deflator〕,用名义GDP与真实GDP的比率乘以100计算的物价程度衡量指标。
消费物价指数CPI〔consumer price index〕,普通消费者所购置的物品与效劳的总费用的衡量指标。
通货膨胀率〔inflation rate〕,从前一个时期以来,物价指数变动的百分比。
消费物价指数〔producer price index〕,企业所购置的一篮子物品运效劳的费用的衡量指标。
指数化〔indexation〕,根据法律或合同按照通货膨胀的影响,对货币数量的自动调整。
名义利率〔nominal interest rate〕,通常公布的、未根据通货膨胀的影响,校正的利率。
真实利率〔real interest rate〕,根据通货膨胀的影响校正过的利率。
Macroeconomics 宏观经济学The study of the overall aspects and workings of a national economy, such as income, output, and the interrelationship among diverse economic sectors.研究国民收入的各方面。
Microeconomics 微观经济学The study of the operations of the components of a national economy, such as individual firms, households, and consumers.研究经济中单个因素行为的分析。
GDP 国内生产总值(Gross Domestic Product)The total market value of all final goods and services produced within the borders of a nation during a specified period.一国国民在各行业中一年内生产的最终产品和最终服务价值总和。
It is often seen as an indicator of the standard of living in a country.Gross Domestic Product=consumption + investment goods + government purchases + net exportsEconomic Growth 经济增长steady growth in the productive capacity of the economy (and so a growth of national income)Real Economic Growth Rate 实际经济增长率A measure of economic growth from one period to another expressed as a percentage and adjusted for inflation (i.e. expressed in real as opposed to nominal terms). The real economic growth rate is a measure of the rate of change that a nation's gross domestic product (GDP) experiences from one year to another. Gross national product (GNP) can also be used if a nation's economy is heavily dependent on foreign earnings. The real economic growth rate builds onto the economic growth rate by taking into account the effect that inflation has on the economy. The real economic growth rate is a "constant dollar" and therefore a more accurate look at the rate of economic growth because the real rate is not distorted by the effects of extreme inflation or deflation.GDP deflator GDP指数In economics the GDP deflator (implicit price deflator for GDP) is a measure of the change in prices of all new, domestically produced, final goods and services in an economy. GDP stands for gross domestic product the total value of all goods and services produced within that economy during a specified period.Nominal GDP 名义GDPA gross domestic product (GDP) figure that has not been adjusted for inflation.Real GDP 实际GDPThis inflation-adjusted measure that reflects the value of all goods and services produced in a given year, expressed in base-year prices. Often referred to as "constant-price", "inflation-corrected" GDP or "constant dollar GDP". Unlike nominal GDP, real GDP can account for changes in the price level, and provide a more accurate figure.Potential output 潜在产量/潜在GDPIn economics, potential output (also refered to as "natural real gross domestic product") refers to the highest level of real Gross Domestic Product output that can be sustained over the long term.GDP Gap GDP缺口The forfeited output of an country's economy resulting from the failure to create sufficient jobs for all those willing to work. A GDP gap denotes the amount of production that is irretrievably lost. The potential for higher production levels is wasted because there aren't enough jobs supplied.(与书异)Net Exports 净出口The value of a country's total exports minus the value of its total imports. It is used to calculate a country's aggregate expenditures, or GDP, in an open economy. In other words, net exports is the amount by which foreign spending on a home country's goods and services exceeds the home country's spending on foreign goods and services.Recession 经济衰退A significant decline in activity spread across the economy, lasting longer than a few months. It is visible in industrial production, employment, real income, and wholesale-retail trade. The technical indicator of a recession is two consecutive quarters of negative economic growth as measured by a country's GDP.Notes:Recession is a normal (albeit unpleasant) part of the business cycle. A recession generally lasts from six to eighteen months. Interest rates usually fall in recessionary times to stimulate the economy by offering cheap rates at which to borrowDepression 经济萧条A severe and prolonged recession characterized by inefficient economic productivity, high unemployment, and falling price levels. In times of depression, consumer's confidence and investments decrease, causing the economy to shutdown.Value Added 附加值The enhancement a company gives its product or service before offering the product to customers. This can either increase the products price or value.(与书异)Gross National Product – GNP 国民生产总值An economic statistic that includes GDP, plus any income earned by residents from overseas investments, minus income earned within the domestic economy by overseas residents. GNP is a measure of a country's economic performance, or what its citizens produced (i.e. goods and services) and whether they produced these items within its borders.Disposable Income 可支配收入The amount of after-tax income that is available to divide between spending and personal savings. This also known as your take home pay.Unemployment Rate 失业率The percentage of the total labor force that is unemployed but actively seeking employment and willing to work.Labor force 劳动力the group of people who have a potential for being employed.Frictional Unemployment 摩擦性事业Unemployment that is always present in the economy, resulting from temporary transitions made by workers and employers or from workers and employers having inconsistent or incomplete information.Structural Unemployment 结构性失业Unemployment resulting from changes in the basic composition of the economy. These changes simultaneously open new positions for trained workers.Cyclical Unemployment 周期性失业Unemployment resulting from changes in the business cycle.Natural Unemployment 自然失业率(与书异)The lowest rate of unemployment that an economy can sustain over the long run. Keynesians believe that a government can lower the rate of unemployment (i.e. employ more people) if it were willing to accept a higher level of inflation (the idea behind the Phillips Curve). However, critics of this say that the effect is temporary and that unemployment would bounce back up but inflation would stay high. Thus, the natural, or equilibrium, rate is the lowest level of unemployment at which inflation remains stable. Also known as the "non-accelerating inflation rate of unemployment" (NAIRU).Notes:When the economy is said to be at full employment, it is at its natural rate of unemployment. Economists debate how the natural rate might change. For example, some economists think that increasing labor-market flexibility will reduce the natural rate. Other economists dispute the existence of a natural rate altogether!Frictional unemployment — This reflects the fact that it takes time for people to find and settle into new jobs. If 12 individuals each take one month before they start a new job, the aggregate unemployment statistics will record this as a single unemployed worker. Technological change often reduces frictional unemployment, for example: the internet made job searches cheaper and more comprehensive.Structural unemployment —This reflects a mismatch between the skills and other attributes of the labour force and those demanded by employers. If 4 workers each take six months off to re-train before they start a new job, the aggregate unemployment statistics will record this as two unemployed workers. Technological change often increases structural unemployment, for example: technological change might require workers to re-train.Natural rate of unemployment —This is the summation of frictional and structural unemployment. It is the lowest rate of unemployment that a stable economy can expect to achieve, seeing as some frictional and structural unemployment is inevitable. Economists do not agree on the natural rate, with estimates ranging from 1% to 5%, or on its meaning — some associate it with "non-accelerating inflation.The estimated rate varies from country to country and from time to time.Demand deficient unemployment — In Keynesian economics, any level of unemployment beyond the natural rate is most likelydue to insufficient demand in the overall economy. During a recession, aggregate expenditure is deficient causing the underutilization of inputs (including labour). Aggregate expenditure (AE) can be increased, according to Keynes, by increasing consumption spending (C), increasing investment spending (I), increasing government spending (G), or increasing the net of exports minus imports (X−M).{AE = C + I + G + (X−M)}Okun's Law 奥昆法则A relationship between an economy's GDP gap and the actual unemployment rate. The relationship is represented by a ratio of 1 to 2.5. Thus, for every 1% excess of the natural unemployment rate, a 2.5% GDP gap is predicted.Inflation 通货膨胀The rate at which the general level of prices for goods and services is rising, and, subsequently, purchasing power is falling. Deflation 通货紧缩steadily falling pricesA general decline in prices, often caused by a reduction in the supply of money or credit. Deflation can be caused also by a decrease in government, personal or investment spending. The opposite of inflation, deflation has the side effect of increased unemployment since there is a lower level of demand in the economy, which can lead to an economic depression. Hyperinflation 超级通货膨胀Extremely rapid or out of control inflation.Inflation rate 通货膨胀率In economics, the inflation rate is the rate of increase of the average price level (a measure of inflation). If one likes analogies, the size of a balloon is like the price level, while the inflation rate is how quickly it grows in size. Alternatively, the inflation rate is the rate of decrease in the purchasing power of money.Consumer Price Index (CPI) 消费价格指数The CPI, as it is called, measures the prices of consumer goods and services and is a measure of the pace of US inflation. The US Department of Labor publishes the CPI every month.Demand-pull inflation 需求拉动型通货膨胀inflation due to high demand for GDP and low unemployment, also known as Phillips Curve inflation.Cost-push inflation 成本推动型通货膨胀nowadays termed "supply shock inflation", due to an event such as a sudden increase in the price of oil.Built-in inflation - induced by adaptive expectations, often linked to the "price/wage spiral" because it involves workers trying to keep their wages up with prices and then employers passing higher costs on to consumers as higher prices as part of a "vicious circle". Built-in inflation reflects events in the past, and so might be seen as hangover inflation. It is also known as "inertial" inflation, "inflationary momentum", and even "structural inflation".Indexing 指数化The adjustment of the weights of assets in an investment portfolio so that its performance matches that of an index.Linking movements of rates to the performance of an index.Notes:1. Indexing is a passive investment strategy. An investor can achieve the same risk and return of an index also by investing in an index fund.2. Types of rates that could be linked to the performance of an index are wage or tax rates.Phillips Curve 菲利普斯曲线An economic concept developed by A. W. Phillips stating that inflation and unemployment have a stable and inverse relationship. The theory states that with economic growth comes inflation, which in turn should lead to more jobs and less unemployment. The concept has been proven empirically and some government policies are directly influenced by it.第二章Aggregate Demand 总需求The total amount of goods and services demanded in the economy at a given overall price level and in a given time period. It is represented by the aggregate-demand curve, which describes the relationship between price levels and the quantity of output that firms are willing to provide. Normally there is a negative relationship between aggregate demand and the price level. Alsoknown as "total spending".Notes:Aggregate demand is the demand for the gross domestic product (GDP) of a country, and is represented by this formula: Aggregate Demand (AD) = C + I + G (X-M)C = Consumers' expenditures on goods and services.I = Investment spending by companies on capital goods.G = Government expenditures on publicly provided goods and services.X = Exports of goods and services.M = Imports of goods and services.Aggregate Supply 总供给The total supply of goods and services produced within an economy at a given overall price level in a given time period. It is represented by the aggregate-supply curve, which describes the relationship between price levels and the quantity of output that firms are willing to provide. Normally, there is a positive relationship between aggregate supply and the price level. Rising prices are usually signals for businesses to expand production to meet a higher level of aggregate demand. Also known as "total output".Notes:A shift in aggregate supply can be attributed to a number of variables. These include changes in the size and quality of labor, technological innovations, increase in wages, increase in production costs, changes in producer taxes and subsidies, and changes in inflation. In the short run, aggregate supply responds to higher demand (and prices) by bringing more inputs into the production process and increasing utilization of current inputs. In the long run, however, aggregate supply is not affected by the price level and is driven only by improvements in productivity and efficiency.Exogenous Variable 外生变量A variable whose value is determined outside the model in which it is used.An economic variable that is related to other economic variables and determines their equilibrium levels. For example, rainfall is exogenous to the causal system constituting the process of farming and crop output. An exogenous variable by definition is one whose value is wholly causally independent from other variables in the system.Endogenous Variable 内生变量A value determined within the context of a model.An economic variable which is independent of the relationships determining the equilibrium levels, but nonetheless affects the equilibrium.Consumption 消费in economics, direct utilization of goods and services by consumers, not including the use of means of production, such as machinery and factories (see capital). Consumption can be divided into public and private sectors.Investment 投资An asset or item that is purchased with the hope that it will generate income or appreciate in the future. In an economic sense, an investment is the purchase of goods that are not consumed today but are used in the future to create wealth. In finance, an investment is a monetary asset purchased with the idea that the asset will provide income in the future or appreciate and be sold at a higher price. In the financial sense investments include the purchase of bonds, stocks or real estate property. Government Purchases 政府购买Expenditures made in the private sector by all levels of government, such as when a government entity contracts a construction company to build office space or pave highways. A component of Keynesian expenditures, government purchases can be used as a tool for a government to influence the business cycle and provide economic stimulation when it is deemed necessary. Keynesian Economics 凯恩斯经济An economic theory stating that active government intervention in the marketplace and monetary policy is the best method of ensuring economic growth and stability. A supporter of Keynesian economics believes it is the government's job to smooth out the bumps in business cycles. Intervention would come in the form of government spending and tax breaks in order to stimulate the economy, and government spending cuts and tax hikes in good times, in order to curb inflation.Classical Economics 古典经济学Classical Economics refers to work done by a group of economists in the 18th and 19th centuries. They developed theories about the way markets and market economies work. The study was primarily concerned with the dynamics of economic growth. It stressed economic freedom and promoted ideas such as laissez-faire and free competition. Famous economists of this thinking include Adam Smith, David Ricardo, Thomas Malthus, and John Stuart Mill.Equilibrium of AD and AS 总供给和总需求的均衡supply and demand result in an equilibrium price (the interest rate)Stagflation 滞胀A condition of slow economic growth and relatively high unemployment - a time of stagnation - accompanied by a rise in prices, or inflation.第三章Fiscal Policy 财政政策Government spending policies that influence macroeconomic conditions. These policies affect tax rates, interest rates, and government spending, in an effort to control the economy.Government spending 政府支出consists of government purchases, including transfer payments, which can be financed by seigniorage (the creation of money for government funding), taxes, or government borrowing It is considered to be one of the major components of gross domestic product.Multiplier Effect 乘数效应The expansion of a country's money supply that results from banks being able to lend. The size of the multiplier effect depends on the percentage of deposits that banks are required to hold on reserves. In other words, it is money used to create more money and calculated by dividing total bank deposits by the reserve requirement.The multiplier effect depends on the set reserve requirement. The higher the reserve requirement, the tighter the money supply, which results in a lower multiplier effect for every dollar deposited. The lower the reserve requirement, the larger the money supply, which means more money is being created for every dollar deposited.Crowding Out Effect 挤出效应An economic theory explaining an increase in interest rates due to rising government borrowing in the money market.Notes:Governments often borrow money (by issuing bonds) to fund additional spending. The problem occurs when government debt 'crowds out' private companies and individuals from the lending market. Increased government borrowing tends to increase market interest rates. The problem is that the government can always pay the market interest rate, but there comes a point when corporations and individuals can no longer afford to borrow.Marginal propensity to consume (MPC)边际消费倾向refers to the increase in personal consumer spending (consumption) that occurs with an increase in disposable income (income after taxes and transfers). For example, if a household earns one extra dollar of disposable income, and the marginal propensity to consume is 0.65, then of that dollar, the family will spend 65 cents and save 35 cents.Mathematically, the marginal propensity to consume (MPC) function is expressed as the derivative of the consumption (C) function with respect to disposable income (Y).In other words, the marginal propensity to consume is measured as the ratio of the change in consumption to the change in income, thus giving us a figure between 0 and 1. One minus the MPC equals the marginal propensity to save.Marginal propensity to save (MPS) 边际储蓄倾向refers to the increase in saving (non-purchase of current goods and services) that results from an increase in income. For example, if a family earns one extra dollar, and the marginal propensity to save is 0.35, then of that dollar, the family will spend 65 cents and save 35 cents. It can also go the other way, referring to the decrease in saving that results from a decrease in income. It is crucial to Keynesian economics and is the key variable determining the value of the multiplier. Mathematically, the marginal propensity to save (MPS) function is expressed as the derivative of the savings (S) function with respect to disposable income (Y).In other words, the marginal propensity to save is measured as the ratio of the change in saving to the change in income, thus giving us a figure between 0 and 1. It is the opposite of the marginal propensity to consume (MPC). In the example above, the marginal propensity to consume would be 0.65. In general MPS = 1 - MPC.Money Supply 货币供给(与书异)The entire quantity of bills, coins, loans, credit, and other liquid instruments in a country's economy. Money supply is divided into three categories--M1, M2, and M3--according to the type and size of account in which the instrument is kept. The money supply is important to economists trying to understand how policies will affect interest rates and growth.M1The category of the money supply that includes all physical money like coins and currency. It also includes demand deposits, which are checking accounts and NOW accounts. M1 is the narrowest idea of "money." This is used as a measurement for economists trying to quantify the amount of money in circulation.M2A category within the money supply that includes M1 in addition to all time-related deposits, savings deposits, andnon-institutional money-market funds. M2 is a broader classification of money than M1. Economists use M2 when looking to quantify the amount of money in circulation and trying to explain different economic monetary conditions.M3The category of the money supply that includes M2 as well as all large time deposits, institutional money-market funds, short-term repurchase agreements, along with other larger liquid assets. This is the broadest measure of money it is used by economists to estimate the entire supply of money within an economy.(书没有)Fiat Money 【美】(根据政府法令发行的)不兑现纸币Money that a government has declared to be legal tender, despite the fact that it has no intrinsic value and is not backed by reserves. Most of the world's paper money is fiat money.Legal tender 合法货币;偿付债务时债主必须接受的货币is payment that cannot be refused in settlement of a debt by virtue of law.Transactions demand交易性需求is the demand or foreign currency. It is used for purposes of business transactions and personal consumption. transactions demand is one of the determinants of demand for money (and credit).Speculative demand 投机性需求is the demand for financial assets, such as securities, money or foreign currency, or financing. It is one of the determinants of demand for money (and credit).Liquidity Preference Theory 流动性偏好理论The hypothesis that forward rates offer a premium over expected future spot rates. Proponents of this theory believe that, according to the term structure of interest rates, investors are risk-averse and will demand a premium for securities with longer maturities. A premium is offered by way of greater forward rates in order to attract investors to longer-term securities. The premium received normally increases at a decreasing rate due to downward pressure from the decreasing volatility of interest rates as the term to maturity increases. Also known as "liquidity preference hypothesis."Interest Rate 利率The monthly effective rate paid (or received if you are a creditor) on borrowed money. Expressed as a percentage of the sum borrowed.Nominal Interest Rate/the money interest rate名义利率The interest rate unadjusted for inflation. Not taking into account inflation gives a less realistic number.Real Interest Rate 实际利率The amount by which the nominal interest rate is higher than the inflation rate. The real rate of interest is approximated by taking the nominal interest rate and subtracting inflation. The real interest rate is the growth rate of purchasing power derived from an investment.Intermediate targets 中间目标An intermediate target is a variable (such as the money supply) that is not directly under the control of the central bank, but that does respond fairly quickly to policy actions, is observable frequently and bears a predictable relationship to the ultimate goals of policy.Open Market Operations 公开市场业务The buying and selling of government securities in the open market in order to expand or contract the amount of money in the banking system. Purchases inject money into the banking system and stimulate growth while sales of securities do the opposite. Notes: Open market operations are the principal tools of monetary policy. (The discount rate and reserve requirements are also used.) The U.S. Federal Reserve's goal in using this technique is to adjust the federal funds rate--the rate at which banks borrow reserves from each other.Discount Rate 贴现率The interest rate that an eligible depository institution is charged to borrow short-term funds directly from a Federal Reserve Bank. This type of borrowing from the Fed is fairly limited. Institutions will often seek other means of meeting short-term liquidity needs. The Federal funds discount rate is one of two interest rates the Fed sets, the other being the overnight lending rate, or the Fed funds rate.Lender of Last Resort 最后的贷款者/偿付者An institution, usually a country's central bank, that offers loans to banks or other eligible institutions that are experiencing financial difficulty or are considered highly risky or near collapse. In the U.S. the Federal Reserve acts as the lender of last resort to institutions that do not have any other means of borrowing and whose failure to obtain credit would dramatically affect the economy.Notes: The lender of last resort functions both to protect individuals who have deposited funds, and to prevent panic withdrawing from banks who have temporary limited liquidity. Commercial banks usually try not to borrow from the lender of last resort because such action indicates that the bank is experiencing financial crisis. Critics of the lender-of-last-resort methodology suspect that the safety it provides inadvertently tempts qualifying institutions to acquire more risk than necessary - since they are more likely to perceive the potential consequences of risky actions to be less severe.Reserve Requirements 法定准备金Requirements regarding the amount of funds that banks must hold in reserve against deposits made by their customers. This money must be in the bank's vaults or at the closest Federal Reserve Bank.Notes: Set by the Fed's Board of Governors, reserve requirements are one of the three main tools of monetary policy. The other two tools are open market operations and the discount rate. Also known as required reserves.第四章Supply-side economics 供给经济学A theory of economics that reductions in tax rates will stimulate investment and in turn will benefit the entire society.Laffer Curve 拉弗尔曲线Invented by Arthur Laffer, this curve shows the relationship between tax rates and tax revenue collected by governments. The chart below shows the Laffer Curve:The curve suggests that, as taxes increase from low levels, tax revenue collected by the government also increases. It also shows that tax rates increasing after a certain point (T*) would cause people not to work as hard or not at all, thereby reducing tax revenue. Eventually, if tax rates reached 100% (the far right of the curve), then all people would choose not to work because everything they earned would go to the government.Notes: Governments would like to be at point T*, because it is the point at which the government collects maximum amount of tax revenue while people continue to work hard.Tax revenue税收is the income that is gained by governments because of taxation of the peopleBudget deficit 联邦预算赤字The amount by which government spending exceeds government revenues.Unemployment benefits 失业救济are sums of money given to the unemployed by the government or a compulsory para-governmental insurance system. Depending on the jurisdiction and the status of the person, those sums may be meager, covering only basic needs (thus a form of basic welfare), or may compensate the lost pay somewhat proportionally to the previous earned salary. They often are part of a larger social security scheme. Unemployment benefits are generally given only to those registering as unemployed, and often on conditions ensuring that they seek work and do not currently have a job.Capital Stock 资本存量The common and preferred stock a company is authorized to issue, according to their corporate charter.Notes: Capital stock are normally listed on a company's balance sheet. In financial statement analysis, an increasing capital stock account tends to be a sign of economic health since the company can use the additional proceeds to invest in projects or machinery that will increase corporate profits and/or efficiency.i ncomes policies 收入政策are wage and price controls used to fight inflation.第五章Mercantilism 重商主义is the economic theory that a nation's prosperity depends upon its supply of capital and that the total volume of trade is unchangeable. The amount of capital, represented by bullion(金条), is best increased through a favourable balance of trade. Mercantilism suggests that the government should advance these goals by playing an active, protectionist role in the economy by encouraging exports and discouraging imports, especially through the use of tariffs. The economic policy that flourished in the early modern period is often referred to as the mercantile system.Trade deficit or surplus 贸易逆差或顺差The difference in the value of a nation's imports over exports (deficit) or exports over imports (surplus).Trade Surplus 贸易顺差/ export surplus出口顺差A nation's excess of exports over imports during a given time frame.Zero-Sum Game。
part IIntroductionC H A P T E R O N EThe Science of MacroeconomicsThe whole of science is nothing more than the refinement of everyday thinking.—Albert Einstein1-1 What Macroeconomists StudyWhy have some countries experienced rapid growth in incomes over the past century while others stay mired in poverty? Why do some countries have high rates of inflation while others maintain stable prices? Why do all countries experience recessions and depressions-recurrent periods of falling incomes and rising unemployment—and how can government policy reduce the frequency and severity of these episodes? Macroeconomics, the study of the economy as a whole, attempts to answer these and many related questions.To appreciate the importance of macroeconomics, you need only read the newspaper or listen to the news. Every day you can see headlines such as INCOME GROWTH SLOWS, FED MOVES TO COMBAT INFLATION, or STOCKS FALL AMID RECESSION FEARS. Although these macroeconomic events may seem abstract, they touch all of our lives. Business executives forecasting the demand for their products must guess how fast c onsumers’ incomes will grow. Senior citizens living on fixed incomes wonder how fast prices will rise. Recent college graduates looking for jobs hope that the economy will boom and that firms will be hiring.Because the state of the economy affects everyone, macroeconomic issues play a central role in political debate. Voters are aware of how the economy is doing, and they know that government policy can affect the economy in powerful ways. As a result, the popularity of the incumbent president rises when the economy is doing well and falls when it is doing poorly.Macroeconomic issues are also at the center of world politics. In recent years, Europe has moved toward a common currency, many Asian countries have experienced financial turmoil and capital flight, and the United States has financed large trade deficits by borrowing from abroad. When world leaders meet, these topics are often high on their agendas.Although the job of making economic policy falls to world leaders, the job of explaining how the economy as a whole works falls to macroeconomists. Toward this end, macroeconomists collect data on incomes, prices, unemployment, and many other variables from different time periods and different countries. They then attempt to formulate general theories that help to explain these data. Like astronomers studying the evolution of stars or biologists studying the evolution of species, macroeconomists cannot conduct controlled experiments. Instead, they must make use of the data that history gives them. Macroeconomists observe that economies differ from one another and that they change over time.These observations provide both the motivation for developing macroeconomic theories and the data for testing them.To be sure, macroeconomics is a young and imperfect science. The macroeconomist’s ability to predict the future course of economic events is no better than the meteorologist’s ability to predict next month’s weather. But, as you will see, macroeconomists do know quite a lot about how the economy works. This knowledge is useful both for explaining economic events and for formulating economic policy.Every era has its own economic problems. In the 1970s, Presidents Richard Nixon, Gerald Ford, and Jimmy Carter all wrestled in vain with a rising rate of inflation. In the 1980s, inflation subsided, but Presidents Ronald Reagan and George Bush presided over large federal budget deficits. In the 1990s, with President Bill Clinton inthe Oval Office, the budget deficit shrank and even turned into a budget surplus, but federal taxes as a share of national income reached a historic high. So it was no surprise that when President George W. Bush moved into the White House in 2001, he put a tax cut high on his agenda. The basic principles of macroeconomics do not change from decade to decade, but the macroeconomist must apply these principles with flexibility and creativity to meet changing circumstances.CASE STUDYThe Historical Performance of the U.S. EconomyEconomists use many types of data to measure the performance of an economy. Three macroeconomic variables are especially important: real gross domestic product (GDP), the inflation rate, and the unemployment rate. Real GDP measures the total income of everyone in the economy (adjusted for the level of prices).The inflation rate measures how fast prices are rising. The unemployment rate measures the fraction of the labor force that is out of work. Macroeconomists study how these variables are determined, why they change over time, and how they interact with one another.Figure 1-1 shows real GDP per person in the United States. Two aspects of this figure are noteworthy. First, real GDP grows over time. Real GDP per person is today about five times its level in 1900.This growth in average income allows us to enjoy a higher standard of living than our great-grandparents did. Second, although real GDP rises in most years, this growth is not steady. There are repeated periods during which real GDP falls, the most dramatic instance being the early 1930s. Such periods are called recessions if they are mild and depressions if they are more severe. Not surprisingly, periods of declining income are associated with substantial economic hardship.Figure 1-2 shows the U.S. inflation rate. You can see that inflation varies substantially. In the first half of the twentieth century, the inflation rate averaged only slightly above zero. Periods of falling prices, called deflation, were almost as common as periods of rising prices. In the past half century, inflation has been the norm. The inflation problem became most severe during the late 1970s, when prices rose at a rate of almost 10 percent per year. In recent years, the inflation rate has been about 2 or 3 percent per year, indicating that prices have been fairly stable.Figure 1-3 shows the U.S. unemployment rate. Notice that there is always some unemployment in our economy. In addition, although there is no long-term trend, the amount of unemployment varies from year to year. Recessions and depressions are associated with unusually high unemployment. The highest rates of unemployment were reached during the Great Depression of the 1930s.These three figures offer a glimpse at the history of the U.S. economy. In the chapters that follow, we firstdiscuss how these variables are measured and then develop theories to explain how they behave.1-2 How Economists ThinkAlthough economists often study politically charged issues, they try to address th ese issues with a scientist’s objectivity. Like any science, economics has its own set of tools—terminology, data, and a way of thinking—that can seem foreign and arcane to the layman. The best way to become familiar with these tools is to practice using them, and this book will afford you ample opportunity to do so. To make these tools less forbidding, however, let’s discuss a few of them here.Theory as Model BuildingYoung children learn much about the world around them by playing with toy versions of real objects. For instance, they often put together models of cars, trains, or planes. These models are far from realistic, but the model-builder learns a lot from them nonetheless. The model illustrates the essence of the real object it is designed to resemble.Economists also use models to understand the world, but an economist’s model is more likely to be made of symbols and equations than plastic and glue. Economists build their “toy economies” to help explain economic variables, such as GDP, inflation, and unemployment. Economic models illustrate, often in mathematical terms, the relationships among the variables. They are useful because they help us to dispense with irrelevant details and to focus on important connections.Models have two kinds of variables: endogenous variables and exogenous variables. Endogenous variables are those variables that a model tries to explain. Exogenous variables are those variables that a model takes as given. The purpose of a model is to show how the exogenous variables affect the endogenous variables. In other words, as Figure 1-4 illustrates, exogenous variables come from outside the model and serve as the model’s input, whereas endogenous variables are determined inside the model and are the model’s output.To make these ideas more concrete, let’s review the most celebrated of all economic models—the model of supply and demand. Imagine that an economist were interested in figuring out what factors influence the price of pizza and the quantity of pizza sold. He or she would develop a model that described the behavior of pizza buyers, the behavior of pizza sellers, and their interaction in the market for pizza. For example, the economist supposes that the quantity of pizza demanded by consumers Q d depends on the price of pizza P and on aggregate income Y. This relationship is expressed in the equationwhere D( ) represents the demand function. Similarly, the economist supposes that the quantity of pizza supplied by pizzerias Q s depends on the price of pizza P and on the price of materials P m, such as cheese, tomatoes, flour, and anchovies. This relationship is expressed aswhere S( ) represents the supply function. Finally, the economist assumes that the price of pizza adjusts to bring the quantity supplied and quantity demanded into balance:These three equations compose a model of the market for pizza.The economist illustrates the model with a supply-and-demand diagram, as in Figure 1-5. The demand curve shows the relationship between the quantity of pizza demanded and the price of pizza, while holding aggregate income constant. The demand curve slopes downward because a higher price of pizza encourages consumers to switch to other foods and buy less pizza. The supply curve shows the relationship between the quantity of pizza supplied and the price of pizza, while holding the price of materials constant. The supply curve slopes upward because a higher price of pizza makes selling pizza more profitable, which encourages pizzerias to produce more of it. The equilibrium for the market is the price and quantity at which the supply and demand curves intersect. At the equilibrium price, consumers choose to buy the amount of pizza that pizzerias choose to produce.This model of the pizza market has two exogenous variables and two endogenous variables. The exogenous variables are aggregate income and the price of materials. The model does not attempt to explain them but takes them as given (perhaps to be explained by another model). The endogenous variables are the price of pizza and the quantity of pizza exchanged. These are the variables that the model attempts to explain.The model can be used to show how a change in one of the exogenous variables affects both endogenous variables. For example, if aggregate income increases, then the demand for pizza increases, as in panel (a) of Figure 1-6. The model shows that both the equilibrium price and the equilibrium quantity of pizza rise. Similarly, if the price of materials increases, then the supply of pizza decreases, as in panel (b) of Figure 1-6. The model shows that in this case the equilibrium price of pizza rises and the equilibrium quantity of pizza falls. Thus, the model shows how changes in aggregate income or in the price of materials affect price and quantity in the market for pizza.Like all models, this model of the pizza market makes simplifying assumptions. The model does not take intoaccount, for example, that every pizzeria is in a different location. For each customer, one pizzeria is more convenient than the others, and thus pizzerias have some ability to set their own prices. Although the model assumes that there is a single price for pizza, in fact there could be a different price at every pizzeria.How should we react to the model’s lack of realism? Should w e discard the simple model of pizza supply and pizza demand? Should we attempt to build a more complex model that allows for diverse pizza prices? The answers to these questions depend on our purpose. If our goal is to explain how the price of cheese affects the average price of pizza and the amount of pizza sold, then the diversity of pizza prices is probably not important. The simple model of the pizza market does a good job of addressing that issue. Yet if our goal is to explain why towns with three pizzerias have lower pizza prices than towns with one pizzeria, the simple model is less useful.The art in economics is in judging when an assumption is clarifying and when it is misleading. Any model constructed to be completely realistic would be too complicated for anyone to understand. Simplification is a necessary part of building a useful model. Yet models lead to incorrect conclusions if they assume away features of the economy that are crucial to the issue at hand. Economic modeling therefore requires care and common sense.A Multitude of ModelsMacroeconomists study many facets of the economy. For example, they examine the role of saving in economic growth, the impact of labor unions on unemployment, the effect of inflation on interest rates, and the influence of trade policy on the trade balance and exchange rates. Macroeconomics is as diverse as the economy.Although economists use models to address all these issues, no single model can answer all questions. Just as carpenters use different tools for different tasks, economists uses different models to explain different economic phenomena. Students of macroeconomics, therefore, must keep in mind that there is no single “correct’’ model useful for all purposes. Instead, there are many models, each of which is useful for shedding light on a different facet of the economy. The field of macroeconomics is like a Swiss army knife—a set of complementary but distinct tools that can be applied in different ways in different circumstances.This book therefore presents many different models that address different questions and that make differentassumptions. Remember that a model is only as good as its assumptions and that an assumption that is useful for some purposes may be misleading for others. When using a model to address a question, the economist must keep in mind the underlying assumptions and judge whether these are reasonable for the matter at hand.Prices: Flexible Versus StickyThroughout this book, one group of assumptions will prove especially important-those concerning the speed with which wages and prices adjust. Economists normally presume that the price of a good or a service moves quickly to bring quantity supplied and quantity demanded into balance. In other words, they assume that a market goes to the equilibrium of supply and demand. This assumption is called market clearing and is central to the model of the pizza market discussed earlier. For answering most questions, economists use market-clearing models.Yet the assumption of continuous market clearing is not entirely realistic. For markets to clear continuously, prices must adjust instantly to changes in supply and demand. In fact, however, many wages and prices adjust slowly. Labor contracts often set wages for up to three years. Many firms leave their product prices the same for long periods of time—for example, magazine publishers typically change their newsstand prices only every three or four years. Although market-clearing models assume that all wages and prices are flexible, in the real world some wages and prices are sticky.The apparent stickiness of prices does not make market-clearing models useless. After all, prices are not stuck forever; eventually, they do adjust to changes in supply and demand. Market-clearing models might not describe the economy at every instant, but they do describe the equilibrium toward which the economy gravitates. Therefore, most macroeconomists believe that price flexibility is a good assumption for studying long-run issues, such as the growth in real GDP that we observe from decade to decade.For studying short-run issues, such as year-to-year fluctuations in real GDP and unemployment, the assumption of price flexibility is less plausible. Over short periods, many prices are fixed at predetermined levels. Therefore, most macroeconomists believe that price stickiness is a better assumption for studying the behavior of the economy in the short run.Microeconomic Thinking and Macroeconomic ModelsMicroeconomics is the study of how households and firms make decisions and how these decisionmakers interact in the marketplace. A central principle of microeconomics is that households and firms optimize—they do the best they can for themselves given their objectives and the constraints they face. In microeconomic models, households choose their purchases to maximize their level of satisfaction, which economists call utility, and firms make production decisions to maximize their profits.Because economy-wide events arise from the interaction of many households and many firms, macroeconomics and microeconomics are inextricably linked. When we study the economy as a whole, we must consider the decisions of individual economic actors. For example, to understand what determines total consumer spending, we must think about a family deciding how much to spend today and how much to save for the future. To understand what determines total investment spending, we must think about a firm deciding whether to build a new factory. Because aggregate variables are the sum of the variables describing many individual decisions, macroeconomic theory rests on a microeconomic foundation.Although microeconomic decisions always underlie economic models, in many models the optimizing behavior of households and firms is implicit rather than explicit. The model of the pizza market we discussed earlier is an example. Households’ decisions about how much pizza to buy underlie the demand for pizza, and pizzerias’ decisions about how much pizza to produce underlie the supply of pizza. Presumably, households make their decisions to maximize utility, and pizzerias make their decisions to maximize profit. Yet the model did not focus on these microeconomic decisions; it left them in the background. Similarly, in much of macroeconomics, the optimizing behavior of households and firms is left implicit.1-3 How This Book ProceedsThis book has six parts. This chapter and the next make up Part One, the Introduction. Chapter 2 discusses how economists measure economic variables, such as aggregate income, the inflation rate, and the unemployment rate.Part Two, “Classical Theory: The Economy in the Long Run,” presents the classical model of how the economy works. The key assumption of the classical model is that prices are flexible. That is, with rare exceptions, the classical model assumes market clearing. Because the assumption of price flexibility describes the economy only in the long run, classical theory is best suited for analyzing a time horizon of at least several years.Part Three, “Growth Theory:The Economy in the Very Long Run,” builds on the classical model. It maintains the assumption of market clearing but adds a new emphasis on growth in the capital stock, the labor force, and technological knowledge. Growth theory is designed to explain how the economy evolves over a period of several decades.Part Four, “Business Cycle Theory:The Economy in the Short Run,” examines the behavior of the economy when prices are sticky. The non-market-clearing model developed here is designed to analyze short-run issues, such as the reasons for economic fluctuations and the influence of government policy on those fluctuations. It is best suited to analyzing the changes in the economy we observe from month to month or from year to year.Part Five, “Macroeconomic Policy Debates,” builds on the previous analysis to consider what role the government should take in the economy. It considers how, if at all, the government should respond to short-run fluctuations in real GDP and unemployment. It also examines the various views on the effects of government debt.Part Six, “More on the Microeconomics Behind Macroeconomics,” presents some of the microeconomic models that are useful for analyzing macroeconomic issues. For example, it examines the household’s decisions regarding how much to consume and how much money to hold and the firm’s decision regarding how much to invest. These individual decisions together form the larger macroeconomic picture. The goal of studying these microeconomic decisions in detail is to refine our understanding of the aggregate economy.Summary1. Macroeconomics is the study of the economy as a whole—including growth in incomes, changes in prices, and the rate of unemployment. Macroeconomists attempt both to explain economic events and to devise policies to improve economic performance.2. To understand the economy, economists use models—theories that simplify reality in order to reveal how exogenous variables influence endogenous variables. The art in the science of economics is in judging whether a model captures the important economic relationships for the matter at hand. Becauseno single model can answer all questions, macroeconomists use different models to look at different issues.3. A key feature of a macroeconomic model is whether it assumes that prices are flexible or sticky. According to most macroeconomists, models with flexible prices describe the economy in the long run, whereas models with sticky prices offer a better description of the economy in the short run.4. Microeconomics is the study of how firms and individuals make decisions and how these decisionmakers interact. Because macroeconomic events arise from many microeconomic interactions, macroeconomists use many of the tools of microeconomics.。