Modelling spatial-temporal change of Poyang Lake using multitemporal Landsat imagery
- 格式:pdf
- 大小:740.81 KB
- 文档页数:19
第36卷 第4期2022年4月Vol.36 No.4Apr.,2022中国土地科学China Land Science1 引言优化国土空间开发保护格局和提升区域生态安全是生态文明建设的重要任务之一[1]。
粗放模式下的经济增长和城镇发展,常以牺牲生态安全和生态环境为代价,导致生物多样性减少、土地退化等问题日益突出,生态安全水平提升和生态保护修复迫在眉睫[2-4]。
新时代生态文明建设背景下,社会经济发展正在处于关键转型期,国内很多区域都面临生态保护和城乡建设双重压力。
构建生态安全格局(Ecological Security Pattern, ESP)对于提升区域生态系统的完整性具有重大意义[5-6],是控制生态空间萎缩、维护生态功能、保障生态底线、实现区域生态安全的重要途径,也是优化区域国土空间结构的有效方法[7]。
目前关于生态安全格局的研究内容多围绕景观格局优化[8]、生态红线[9]、生态敏感性[10]、生态系统服务价值[11]等,研究区尺度涵盖了全国[12]、省域[9]、城市群[13]、市域[14]和县域[11]多个等级。
由俞孔坚提出、后来研究者逐步完善和发展的“生态源地—生态阻力面—生态廊道”方法已经成为生态安全格局构建的基本模式[14-17]。
生态源地识别即提取对维护区域生态安全具有关键意义的生态用地,识别方法主要从生态功能重要性评价、生态适宜性评价等方面展开[18];传统方法从生态功能重要性或生态脆弱性等单一方面考虑,或借助已有的自然保护地等,而综合考虑生态系统服务、生态脆弱性及景观斑块结构[14]可以更全doi: 10.11994/zgtdkx.20220329.145618基于生态重要性和MSPA核心区连通性的生态安全格局构建——以桂江流域为例潘 越1,龚 健1,2,杨建新1,杨 婷1,王 玉1(1.中国地质大学(武汉)公共管理学院,湖北 武汉 430074;2.自然资源部法治研究重点实验室,湖北 武汉430074)摘要:研究目的:探索基于“生态重要性”和“形态学空间格局分析(Morphological Spatial Pattern Analysis, MSPA)核心区连通性”的生态安全格局构建方法,为国土空间生态保护修复和生态安全格局构建提供参考。
《河南水利与南水北调》2023年第6期水生态文明基于遥感技术的太湖蓝藻水华时空变化分析徐寅生,赵琳(中水北方勘测设计研究有限责任公司,天津300222)摘要:利用卫星遥感手段监测水环境具有大范围、长时序、周期性、快速、动态监测等优势,文章利用哨兵2号多光谱卫星遥感数据,对2017-2021年五年内的太湖蓝藻情况进行监测,提取湖区不同季节蓝藻水华信息,进而分析不同季节湖区水质的变化特征。
实验结果表明,近五年来,太湖蓝藻爆发时段主要集中在每年的5月份左右,蓝藻爆发区域主要集中在太湖西北部的竺山湖、西部沿岸区、梅梁湖等湖湾;湖心区蓝藻数量呈明显增长,需要引起关注。
关键词:多光谱;水质;太湖;叶绿素a;哨兵2号中图分类号:TP79文献标识码:A文章编号:1673-8853(2023)06-0005-02Analysis of Spatial and Temporal Changes of Cyanobacteria Bloom in Taihu Lake Based onRemote Sensing TechnologyXU Yinsheng,ZHAO Lin(China Water Resources Beifang Investigation,Design and Research CO.LTD.,Tianjin300222,China)Abstract:Monitoring water environment by means of satellite remote sensing has the advantages of large-scale,long-time sequence, periodicity,fast and dynamic monitoring.This article utilizes Sentinel-2multispectral satellite remote sensing data to monitor the blue-green algae situation in Taihu Lake from2017to2021.It extracts information on blue-green algal blooms in different seasons of the lake and analyzes the characteristics of water quality changes in different seasons.The results show that the blue-green algae outbreak in Taihu Lake has been mainly concentrated in May of each year for the past five years,and the algal blooms were mainly concentrated in Zhushan Lake,western coastal areas and Meiliang Lake in northwestern Tai Lake.The number of blue-green algae in the central lake area has shown a significant increase,which deserves attention.Key words:Multispectral;water quality;Tai Lake;chlorophyll a;Sentinel21理论基础浮游藻类指数的基本原理为水体在红光波段、近红外波段和短波红外波段表现出强烈的吸收作用,对于表面存在蓝藻水华的水体,在近红外波段表现为明显的反射峰,利用这一特点,通过相关波段的组合,构建FAI指数模型,具体计算公式如下。
第49卷第9期东 北 林 业 大 学 学 报Vol.49No.92021年9月JOURNALOFNORTHEASTFORESTRYUNIVERSITYSep.20211)“十三五”国家重点研发计划项目(2017YFD0600400)。
第一作者简介:杨丹,女,1997年4月生,西安科技大学测绘科学与技术学院,硕士研究生。
E-mail:2539381809@qq.com。
通信作者:李崇贵,西安科技大学测绘科学与技术学院,教授。
E-mail:864958361@qq.com。
收稿日期:2020年8月10日。
责任编辑:王广建。
应用U-Net模型和多时相Landsat-8影像对森林植被的分类1)杨丹 李崇贵 常铮 李煜 雷田旺 (西安科技大学,西安,710054) (西安交通工程学院) 摘 要 为了探讨深度学习全卷积神经网络模型(U-Net)在多时相Landsat-8影像上的森林植被分类效果,以黑龙江孟家岗林场为研究区,采用多时相的Landsat-8影像为数据源,根据各森林类别多时相的光谱曲线确定分类的最佳时相,并对优化后的U-Net模型进行训练并验证。
同时,进一步构建多时相植被指数特征,训练分类模型并对森林植被进行分类,比较优化后的U-Net分类方法和最大似然分类法的分类精度。
结果表明:加入多时相植被指数的U-Net模型分类精度为83.5%,比单一时相分类精度高6.1%;优化后的U-Net模型分类方法精度明显高于最大似然分类方法,说明加入多时相植被指数的U-Net模型分类方法可以有效的提高森林分类精度。
关键词 Landsat8多时相影像;U-Net模型;最大似然法;植被指数;森林分类分类号 S715.3ClassificationofForestVegetationBasedonU NetModelforMulti temporalLandsat 8Images//YangDan,LiChonggui,ChangZheng,LiYu(Xi’anUniversityofScienceandTechnology,Xi’an710054,P.R.China);LeiTianwang(Xi’anTrafficEngineeringInstitute)//JournalofNortheastForestryUniversity,2021,49(9):55-59,66.Inordertoexploretheeffectofdeeplearningfullyconvolutionalneuralnetworkmodel(U Net)onforestvegetationclassificationonmulti temporalLandsat 8images,MengjiagangForestFarminHeilongjiangwasusedastheresearcharea,andmulti temporalLandsat 8imageswereusedasthedatasource.Accordingtothemulti temporalspectrumcurvediagramofeachforestcategory,thebesttimeforclassificationwasdetermined,andtheoptimizedU Netmodelwastrainedandverified.Furtherconstructthefeaturesofmulti temporalvegetationindex(DVI,EVIandGVI),traintheclassificationmodelandclassifyforestvegetation,andusetheoptimizedU Netclassificationmethodandthemaximumlikelihoodclassi ficationmethodforsingle phaseimageandaddMulti temporalvegetationindeximageswereusedforcomparisonexperi ments.TheresultsshowthattheclassificationaccuracyoftheU Netmodelwithmulti temporalvegetationindexis83.5%,whichis6.1%higherthanthatofthesingle phaseclassification;theaccuracyoftheoptimizedU Netmodelclassificationmethodissignificantlyhigherthanthatofthemaximumlikelihoodclassificationmethod.TheU Netmodelclassificationmethodwithmulti temporalvegetationindexcaneffectivelyimprovetheaccuracyofforestclassification.Keywords Multi temporalLandsat 8image;U Netmodel;Maximumlikelihoodmethod;Vegetationindex;Forestclassification 森林作为地球上最大的陆地生态系统,对维系生态平衡起着至关重要的作用,也是人类赖以生存和发展的基础条件[1],因此,对森林资源的调查和实时监测显得尤为重要。
第38卷第13期2018年7月生态学报ACTAECOLOGICASINICAVol.38,No.13Jul.,2018基金项目:江西省重大生态安全问题监控协同创新中心专项项目(JXS⁃EW⁃08);2015测绘地理信息公益性行业科研专项项目(201512026);湖北省青年科技晨光计划(HBCG);国家自然科学基金项目(41601298)收稿日期:2017⁃06⁃28;㊀㊀网络出版日期:2018⁃03⁃16∗通讯作者Correspondingauthor.E⁃mail:xiaoling_chen@whu.edu.cnDOI:10.5846/stxb201706281169刘海,武靖,陈晓玲.丹江口水源区生态系统服务时空变化及权衡协同关系.生态学报,2018,38(13):4609⁃4624.LiuH,WuJ,ChenXL.Studyonspatial⁃temporalchangeandtrade⁃off/synergyrelationshipsofecosystemservicesintheDanjiangkouwatersourcearea.ActaEcologicaSinica,2018,38(13):4609⁃4624.丹江口水源区生态系统服务时空变化及权衡协同关系刘㊀海1,2,3,武㊀靖1,陈晓玲4,5,∗1湖北大学资源环境学院,武汉㊀4300622武汉大学遥感信息工程学院,武汉㊀4300793江西省基础地理信息中心,南昌㊀3302094武汉大学测绘遥感信息工程国家重点实验室,武汉㊀4300795江西师范大学鄱阳湖湿地与流域研究教育部重点实验室,南昌㊀330022摘要:研究区域多种生态系统服务之间的权衡协同关系特征,对不同生态系统服务㊁不同区域之间的协调发展,实现利益相关方效益最大化,达到区域发展与生态保护 双赢 具有重要意义㊂针对目前权衡协同定性分析㊁长时间动态变化研究不足的现状,以丹江口水源区为例,在采用 当量因子法 求得研究区生态系统服务价值的基础上,使用长时间整体分析占优的相关性分析方法和短时期动态变化分析占优的生态系统服务权衡协同度(ESTD)模型对研究区1990 2015年10种生态系统服务的权衡协同关系展开研究㊂结果表明:1990 1995年,丹江口水源区生态系统服务价值呈负增长,之后则呈不断上涨的时序变化趋势,增幅最大的生态系统服务为水资源供给㊂生态服务价值最高的用地类型为林地,其次为草地和水域㊂空间上,生态系统服务价值呈东南高西北低特征㊂在丹江口水源区生态系统服务之间相互关系中,协同关系占64%,是丹江口水源区生态系统服务之间的主导关系,权衡关系较少,且大多存在于供给服务与调节服务㊁文化服务㊁支持服务之间㊂丹江口大坝加高后,即2005年之后,水源区内生态系统服务之间的权衡协同方向有所改变,改变明显的生态服务有净化环境㊁水文调节和水资源供给㊂这3种生态系统服务与生态系统服务之间的权衡关系增多,除这3种生态系统服务外,其余几种单项生态系统服务与生态系统服务之间的权衡关系减少㊂关键词:丹江口水源区;生态系统服务价值;时空变化;权衡协同Studyonspatial⁃temporalchangeandtrade⁃off/synergyrelationshipsofecosystemservicesintheDanjiangkouwatersourceareaLIUHai1,2,3,WUJing1,CHENXiaoling4,5,∗1HubeiUniversity,FacultyofResourcesandEnvironmentScience,Wuhan430062,China2WuhanUniversity,SchoolofRemoteSensingandInformation,Wuhan430079,China3JiangxiProvincialGeomaticsCenter,Nanchang330209,China4StateKeyLaboratoryofInformationEngineeringinSurveying,MappingandRemoteSensing,WuhanUniversity,Wuhan430079,China5KeyLaboratoryofPoyangLakeWetlandandWatershedResearch,MinistryofEducation,JiangxiNormalUniversity,Nanchang330022,ChinaAbstract:Ecosystemmanagementthatattemptstomaximizetheproductionofoneecosystemservicemayresultinsubstantialdeclinesintheprovisionofotherecosystemservices.Forthisreason,understandingthetrade⁃offsandsynergiesofecosystemservicesisofconsiderablesignificancetobalancethecharacteristicsofmultipleecosystemservicesandmaximizethebenefitsofecosystemservices.Thecurrentsituationisthatthereisinsufficientresearchesonqualitative0164㊀生㊀态㊀学㊀报㊀㊀㊀38卷㊀analysisandlongtimeseriesofdynamicchangeamongthetrade⁃offsandsynergiesrelationship.Inaddition,theselectionofecosystemservicesareinadequate.TheDanjiangkouwatersourceareaisanimportantareaoftheSouth⁃to⁃NorthWaterDiversionProject,andclarifyingthetemporalandspatialvariationcharacteristicsandrelationshipsamongecosystemservicescanprovidereferenceguidanceforthesmoothprogressofthewatertransferprojectinthemiddlerouteoftheSouthtoNorthWaterTransferproject.Atpresent,analysisoftherelationshipsamongecosystemservicesintheDanjiangkouwatersourceareaisstillinsufficient.Giventhissituation,westudiedtheecosystemservicerelationshipsofalongtimeseriesintheDanjiangkouwatersourceareausingdifferentmethods.First,weusedtheequivalentfactormethodtoestimatetheecosystemservicevalue.Wethendiscussthespatial⁃temporaldifferenceandrelationshipofecosystemservicesinsixperiodsbycorrelationanalysisandusinganecosystemservicestrade⁃offdegree(ESTD)model.Correlationanalysishastheadvantageoverlongtimeseriesanalysis.TheESTDmodelhastheadvantageofdynamicchangeanalysisforshorttimeperiods.Theresultsshowedthatduringtheperiodof1990to1995,thevalueofecosystemservicesintheDanjiangkouwatersourceareashowedanegativegrowth.However,thevalueofecosystemservicessignificantlyimprovedfrom1995to2015.Thelargestincreaseinecosystemservicesoccurredinwatersupply,andforestlandprovidedthehighestvalueofecosystemservices.Ecosystemservicevalueincreasedfromnortheasttosouthwest.Correlationanalysisshowedthatsynergyisthedominaterelationshipamongecosystemservices,andthattherearefewtrade⁃offsintheDanjiangkouwatersourcearea.SincetheDanjiangkoudamwasheightened(after2005),therelationshipamongecosystemservicesinthewatersourceareahavechanged.Thetrade⁃offrelationshipsinthewatersourceareaincreasedamongwatersupply,hydrologicaladjusting,andenvironmentdepuration,andtrade⁃offswerereducedinotherecosystemservices.Humandisturbanceisthemostimportantfactorthatresultsinecosystemservicechange.KeyWords:Danjiangkouwatersourcearea;ecosystemservicevalue;spatial⁃temporalchange;trade⁃offsynergy生态系统服务是指人类从生态系统中直接或间接获取的所有利益,其中包括供给服务㊁调节服务㊁支持服务和文化服务四个方面[1⁃2]㊂该概念由Wilson于1970年首次提出,之后Daily,Costanza于1997年对生态系统服务进行了更深层次的研究[1⁃3]㊂生态系统服务作为生态系统评估的核心领域,成为生态学的研究热点[4]㊂2005年,随着千年生态系统评估工作完成[5],对生态系统服务研究从单纯的静态价值评估向着更加重视生态系统服务对人类福祉的影响方向发展[6]㊂随着城市化加剧,人类所需求的生态系统服务的数量和种类越来越多[7⁃9],人类对自然资源的利用已经超过了生态系统本身的提供限度,造成对某一服务功能的需求是以牺牲其他服务功能为代价,不同生态系统服务之间相互影响,导致很难甚至不可能同时达到利益最大化[10]㊂为了明晰区域多种生态系统服务之间的相互关联特征,兼顾多种生态系统服务不同生态系统服务之间㊁不同区域之间的协调发展,实现利益相关方效益最大化,优化生态系统服务管理政策[11],达到区域发展与生态保护 双赢 的目的[12],有必要对生态系统服务进行集成研究[13]㊂权衡 指某类型生态系统服务的供给由于其他类型生态系统服务使用的增加而减少的情形, 协同 指两种或多种生态系统服务同时增强或减少的情形[14]㊂各类生态系统服务之间的相互作用,在不同尺度(时间与空间)的利益需求不同,几乎所有生态系统服务的决策都涉及到利益权衡[15],因此权衡协同关系在全球范围内的生态系统服务之间普遍存在,但又表现出明显的地域差异性与动态变化性[16⁃17]㊂目前,主要采用地理学和生态学相关理论对生态系统服务权衡与协同进行定性分析㊂对生态系统服务效益量化的研究较少[18⁃19]㊂囿于数据获取㊁计算模型㊁指标构建等因素,选取的生态系统服务类型有限,对生态系统服务总体效益和单一服务效益之间动态关系的量化和评估研究不足[12]㊂南水北调中线工程是我国重要的跨流域调水工程,旨在解决我国华北地区的缺水困境,缓解北方城市的用水冲突,实现水资源的合理布局和分配[20]㊂丹江口水源区作为中线工程的重要组成,明晰流域生态系统服务价值变化情况以及生态系统服务之间权衡与协同关系变化特征,对分析中线调水工程对流域生态环境的影响,智慧调水以及生态补偿具有重要意义㊂目前对于水源区的生态系统服务价值以定性研究较多,且仅关注某一种生态系统类型的单一生态服务价值[21⁃22]㊂近年来,有较少学者以定量分析视角对水源区内的生态系统服务价值进行研究,但选取的生态系统服务有限,且未考虑单位面积生态服务价值当量的时空差异[23⁃24]㊂对于水源区的生态系统服务之间的权衡协同关系,研究也较少[25]㊂因此,本文以丹江口水源区为研究区,采用Costanza等提出的生态系统服务价值估算方法,与基于地理模型的计算方法相比,该方法具有数据易于计算,标准化的优点,可以对多种生态服务价值进行计算㊂考虑到生态系统服务在时间尺度上的动态变化性和空间上的异质性,本文在借鉴Costanza和谢高地团队的研究结果基础上,对丹江口水源区的当量因子进行区域修正和功能性系数修正,对研究区1990 2015年(1990年㊁1995年㊁2000年㊁2005年㊁2010年㊁2010年㊁2015)6个时期研究区10种生态系统服务价值及其时空变化特征进行估算分析㊂然后,基于以长时间整体分析占优的相关性分析方法和短时期动态变化分析占优的生态系统服务权衡协同度(EcosystemServicesTrade⁃offDegree,ESTD)模型,分析了不同时期水源区内各类型生态系统服务之间的权衡与协同关系㊂研究定量分析了总体效益与单一服务效益之间的关系,更清晰的展示了单一生态系统服务在整体效益中的作用,有利于决策者判断流域各生态服务起主导作用的服务类型,为流域生态系统服务的可持续增长提供方法支持;此外,研究以大坝加高的时间点为节点,分析了水源区内不同时期的各生态系统服务之间的权衡与协同关系,清晰的分析调水工程对水源区内生态系统服务的影响,为流域更科学的调水及生态补偿提供参考㊂1㊀研究区概况和数据来源汉江是长江中游最大的支流,发源于秦巴山地的宁强县,在武汉汇入长江㊂其干流全长1577km,流域面积约为1.59ˑ105km2[26⁃27]㊂其中丹江口以上为汉江上游,流域主要范围跨越陕西㊁湖北㊁河南,流域面积9.52万km2[27](图1)㊂研究区域位于秦岭山脉和大巴山脉之间,西部为中低山区,东部以平原丘陵为主㊂流域位于亚热带季风区,年均气温12 16ħ,年均降雨量约700 1800mm,主要地带性植被是落叶㊁常绿阔叶与针叶混交林[25]㊂流域水资源丰富,是南水北调中线水源区,2005年大坝加高工程之后,丹江口水库库容增加,正常蓄水位由157m提高到170m,正常蓄水位库容由174亿m3增加到290亿m3,汉江水资源将得到更好的调节[27]㊂本研究利用的主要数据包括:1990 2015年6个时期土地利用矢量数据,由中国国家地球系统科学数据共享平台(www.geodata.cn)提供;1990 2015年6个时期全国稻谷㊁小麦和玉米的播种面积以及单位面积收益和支出,数据来源于‘中国统计年鉴“[28]和‘全国农产品成本收益资料汇编“[29];全国㊁湖北省㊁陕西省㊁河南省1990 2015年6个时期的农田粮食单位面积产量,数据来源于中国及各省统计年鉴;1990 2015年丹江口水源区NPP数据,来源于国家地球系统科学数据共享服务平台(http://www.geodata.cn)㊂2㊀研究方法2.1㊀生态系统服务价值估算2.1.1㊀标准单位当量因子的价值量核算标准单位当量因子(以下简称当量因子)是指1hm2全国平均产量的农田每年自然粮食产量的经济价值[30],以此当量为参照并结合专家知识可以确定其他生态系统服务的当量因子的价值量,可以表征和量化不同类型生态系统对生态服务功能的潜在贡献能力㊂本研究参考谢高地[31]等的处理方法,将单位面积农田生态系统粮食生产经济价值的1/7作为1个标准当量因子的生态系统服务价值量,计算公式如式1㊂Dj=1/7(ðni=1sijwij-pij)(1)式中,D表示1个标准当量因子的生态系统服务价值量(元/hm2),Sij为研究区第j年第i类农作物(hm2);wij116413期㊀㊀㊀刘海㊀等:丹江口水源区生态系统服务时空变化及权衡协同关系㊀2164㊀生㊀态㊀学㊀报㊀㊀㊀38卷㊀图1㊀丹江口水源区Fig.1㊀Danjiangkouwatersourcearea为第j年第i类农作物单位面积总收益;pij为第j年第i类农作物总支出㊂2.1.2㊀单位面积生态系统服务价值的基础当量表单位面积生态系统服务价值的基础当量是评估区域生态系统的各项生态系统服务价值的基础,它是指不同类型生态系统单位面积上各类服务功能年均价值当量[31]㊂Costanza方法中,土地利用类型的单位面积生态系统服务价值主要反映的是欧美发达国家的经济水平,在中国应用中存在偏差[32],为此,中国科学院地理科学与资源研究所谢高地团队针对上述问题,根据中国生态系统和社会经济发展状况,对中国700位具有生态学背景的专业人员进行问卷调查的基础上进行改进,制定了中国生态系统服务价值的基础当量表[32]㊂由于本研究所使用的LUCC土地利用数据分级标准和谢高地团队的生态系统分级标准存在差异,故需要按研究需要将土地利用数据进行重分类㊂谢高地的生态系统一级分类包含的6种土地利用类型中,4种土地利用类型与中国科学院提供的土地利用类型相一致,存在差异的土地利用类型包括建设用地与未利用土地,因谢高地的生态系统分类中只包含有荒漠和湿地,故需要将这两类土地利用数据依据谢高地的生态系统分级标准进行重分类㊂鉴于丹江口水源区的未利用地主要为沙地,沼泽地,裸土地,裸岩石质地,其中沙地的生态系统服务价值与荒漠比较一致;沼泽地的生态系统服务价值与湿地较为相近;裸土地,裸岩石质地以及城乡工矿居民用地的生态系统服务价值与裸地较为相近,故这里将中国科学院土地利用类型中沙地,裸土地,裸岩石质地与建设用地的生态系统服务价值当量归并为谢高地的生态系统分类中的荒漠,将沼泽地重分类为湿地㊂除一级分类外,二者二级类型分级标准也存在差异,主要存在于林地㊁草地中㊂LUCC土地利用数据分级标准中,将林地分为有林地㊁疏林地㊁其他林地和灌木林,而谢高地团队将林地分为针叶㊁针阔混交林㊁阔叶林和灌木林,考虑到丹江口水源区属亚热带季风区,故将林地中的有林地和其他林地归为针阔混交林;根据林学野外调查,将疏林地和灌木林归为灌木林;LUCC土地利用数据分级标准中,将草地分为高覆盖度草地㊁中覆盖度草地㊁低覆盖度草地,而谢高地团队将草地草原㊁灌草丛和草甸,目前对生态系统服务的研究中并未明确高覆盖草地㊁中覆盖草地㊁低覆盖草地3种草地类型各自的当量,考虑到后期计算,此处将这3种类型草地统一归为灌草丛㊂重分类后,得到汉江流域单位面积生态系统服务价值基础当量表㊂表1㊀单位面积生态系统服务价值基础当量表Table1㊀Ecosystemserviceequivalentvalueperunitarea生态系统分类Classificationofecosystemservice供给服务Supplyservice调节服务Regulationservice支持服务Compositeservice文化服务Cultureservice一级分类二级分类食物生产原料生产水资源供给气体调节气候调节净化环境水文调节土壤保持生物多样性美学景观农田Farmland旱地0.850.40.020.670.360.10.271.030.130.06水田1.360.09-2.631.110.570.172.720.010.210.09森林Forestland针阔混交林0.310.710.372.357.031.993.512.862.61.14草地Grassland灌木0.190.430.221.414.231.283.351.721.570.69灌草丛0.380.560.311.975.211.723.822.42.180.96湿地Wetland湿地0.510.52.591.93.63.624.232.317.874.73荒漠Desert荒漠0.010.030.020.110.10.310.210.130.120.05裸地0000.0200.10.030.020.020.01水域Water水系0.80.238.290.772.295.55102.240.932.551.892.1.3㊀当量因子的修正2.1.3.1㊀区域修正由于表1是谢高地团队基于2010年全国的相关数据计算而得,考虑到生态系统服务价值的变化具有时间和空间效应,故本研究以2010年为基准,对丹江口水源区1990 2015年当量因子进行区域修正,修正系数为丹江口水源区相应年份农田粮食单位面积产量与2010年全国农田粮食单位面积产量的比值㊂修正结果如表2㊂表2㊀丹江口水源区不同年份不同省份当量因子/(元/hm2)当量因子Equivalentfactor全国China丹江口水源区Danjiangkouwatersourcearea当量因子EquivalentFactor全国China丹江口水源区Danjiangkouwatersourcearea1990356.74315.792005449.10384.451995383.24326.062010481.19409.992000404.80367.102015530.46485.902.1.3.2㊀功能性系数修正微观空间尺度上,生态系统本身的多样性和环境条件的多样性决定了生态系统服务的类型和强度具有空间差异性㊂一般来说,生态系统的生态服务功能大小与该生态系统的生物量有密切关系[30]㊂不同的景观类型,其生物量和区域水热状况也不同,生物量越大,其生态功能越强㊂但由于生物量的计算模型众多,且不同生态系统的计算方法不同[33],因此难以对丹江口水源区的生物量进行准确计算㊂鉴于此,本文选取与生物量相近的植被净初级生产力(NPP)来对研究区当量因子进行功能性系数修正㊂由于NPP计算涉及数据众多,2000年以前的相关数据获取困难,为了保证数据的一致性,本文使用NPP模拟数据进行修正(该数据是在CRU气象中心发布的全球历史时期气象数据的驱动下,利用IBIS模型模拟获得),方法如下:将研究区内中某一像元的NPP值(NPPij)与该像元所属类型的生态系统的NPP平均值相比,将比值作为功能性系数(pi)对当量因子进行逐像元的动态调整㊂pi=NPPi/NPPijmean(i=1990,1995, ,2015)(j=1,2, )(2)式中,pi代表第i年的功能性调整系数;NPPij代表第i年某一像元的NPP值;NPPijmean代表第i年第j类生态系统的NPP的平均值㊂3164㊀13期㊀㊀㊀刘海㊀等:丹江口水源区生态系统服务时空变化及权衡协同关系㊀2.1.4㊀生态系统服务价值估算模型以表2中丹江口水源区不同年份当量因子,结合表1单位面积生态系统服务价值基础当量表和NPP模拟数据计算得到丹江口水源区不同年份生态系统服务单位面积价值当量㊂在此基础上,以不同年份汉江流域土地利用数据为主要数据源,基于生态系统服务价值估算模型对汉江流域生态系统服务价值进行估算㊂估算模型如公式2:ESV=ðni=1(SiˑVCiˑaˑpi)(3)式中,ESV为生态系统服务价值总量,Si为研究区第i类土地利用类型面积(hm2);VCi为第i类土地利用类型的单位面积生态系统服务价值(元/hm2);i为土地利用类型;a为修订系数,pi为第i年的功能性调整系数㊂2.2㊀权衡与协同关系研究方法2.2.1㊀相关分析相关分析可以定量描述两个变量之间的线性相关程度,明确两个变量之间的相关方向[34]㊂相关关系有强弱方向之分,数值越大相关性越强,数值越小相关性越弱;数值为正表明一个变量增加,另一个变量也增加,称为正相关,数值为负,表明一个变量增加,另一个变量减少,称为负相关㊂计算公式如下:Rxy=ðni=1(xi- x)(y- y)i=1(xi- x)2ðni=1(yi- y)2(4)式中,Rxy为相关系数;n为样本数;xiyi分别是x㊁y的第i个值; x, y分别是变量x,y的平均值㊂2.2.2㊀生态系统服务权衡协同度生态系统服务权衡协同度(EcosystemServicesTrade⁃offDegree)是建立在数据线性拟合的基础之上,反映各个生态系统服务间相互作用的方向和程度的方法[13],目的是对研究区生态系统服务变化量的相互作用进行整体的评价㊂下文简称为ESTD,计算公式如下:ESTDij=ESCib-ESCiaESCjb-ESCja(5)式中,ESTDij表示第i㊁j种生态系统服务权衡协同度;ESCib为b时刻第i种生态系统服务的变化量;ESCia为a时刻第i种生态系统服务的变化量;ESCjb㊁ESCja与此相同㊂ESTD代表某两种生态系统服务变化量相互作用的程度和方向,ESTD为负值时,表示第i与j种生态系统服务为权衡关系;ESTD为正值时,表示两者之间为协同关系;ESTD绝对值代表相较于第j种生态系统服务的变化,第i种生态系统服务变化的程度㊂3㊀结果3.1㊀生态系统服务价值时空变化3.1.1㊀生态系统服务价值时间变化利用公式3求得丹江口水源区1990 2015年各项生态系统服务价值如下(表3):1990 2015年丹江口水源区生态服务价值从404.03亿元增加至571.15亿元,共增长了211.86亿元,增幅为58.97%,年平均增长率为2.36%㊂其中1990 1995年,丹江口水源区生态服务价值为负增长,与1990年相比减少了44.74亿元,降幅为11.07%㊂其余年份水源区生态服务价值总体呈增长趋势,其中增长幅度最大的时间段为2005 2010年,增幅为24.86%;增幅最小的时间段为2000 2005年,仅为5.22%㊂4164㊀生㊀态㊀学㊀报㊀㊀㊀38卷㊀表3㊀1990 2015丹江口水源区生态系统服务价值/(元/hm2)Table3㊀EcosystemservicesvalueofDanjiangkouwatersourceareain1990 2015年份Year供给服务Supplyservice支持服务Compositeservice调节服务Regulationservice文化服务Cultureservice食物生产原料生产水资源供给土壤保持生物多样性气体调节气候调节净化环境水文调节美学景观计Total前一时间段与后时间段的变化率/%Changerate199011.5712.061.3747.1341.3240.62104.8433.0293.7718.33404.03199510.1810.780.7742.1336.9336.2693.9629.4882.4116.39359.29-11.07200011.4712.091.3147.2241.3840.59104.9232.8489.5820.32401.7111.81200512.0612.711.4449.6143.5842.69110.4634.6896.1119.35422.685.22201015.0415.861.8961.9154.3453.24137.843.28120.2624.13527.7424.86201516.3117.131.9666.9558.7657.65148.9746.82130.526.09571.158.23从生态系统服务类型来看,气候调节㊁水文调节㊁土壤保持和生物多样性构成了丹江口水源区生态系统服务价值的主体㊂水资源供给价值最低,但增长幅度最大,25年间增长了0.58亿元,增幅为43%㊂增长幅度最小的生态服务价值为水文调节,25年间增长了36.72亿元,增幅为39%㊂从丹江口水源区各类用地提供的生态系统服务价值来看,林地的生态系统服务价值始终最高,其次为草地㊁水域㊁农田,这4类用地提供了水源区95%以上的生态服务㊂从各类用地生态系统服务价值占总生态服务价值的比例变化情况来看,农田占总生态服务价值的比例呈波动变化,但总体呈增加趋势,由3.26%增加至4.17%;草地占总生态服务价值的比例与农田相同,总体呈增加趋势,由29.04%增加至30.06%;林地占总生态服务价值的比例则呈波动减小的趋势,由58.73%减少至56.94%;水系则相反,占总生态服务价值的比例呈波动增加的趋势,由8.62%增加至9.05%;建设用地,荒漠,裸地占总生态服务价值的比例呈增加趋势,但所占比例极小,均小于0.1%㊂3.1.2㊀生态系统服务价值空间变化在GIS软件中,基于栅格统计了丹江口水源区1990㊁1995㊁2000㊁2005㊁2010和2015年研究区域的生态系统服务价值,根据价值高低分为六类,得到生态系统服务价值分布图(图2)㊂由图2可知,丹江口水源区生态系统服务价值呈现明显的西南高,东北低的特征㊂生态系统价值高值的区域分布在南部和东部部分地区,最高值位于丹江口水库周围㊂生态系统价值低值的区域与农田分布较为一致,主要分布在西部的水田以及东部的旱地区域㊂生态系统价值中值分布范围较广,主要分布在水源区的中部和西部部分地区㊂1990 1995年,水源区生态服务价值减少,生态服务低值区域范围由中东部向西扩大,南部的高值区域范围减小㊂1995 2015年生态服务价值呈增长趋势,西部和南部区域的生态服务价值增大,东部的低值区域也有所减少㊂计算1990 2015年各网格的生态系统服务价值动态变化度后得到水源区生态系统服务价值动态变化度空间分布图(图3)㊂可以看出,动态变化度为负值的区域零散分在在水源区内,与土地利用变化区域的分布范围比较吻合;动态变化度低值和中值区域主要分布于水源区的西部部分地区和东部地区,且这些区域大都为农田;动态变化度高值区域面积最广,中西部较为集中,与水源区内林草地的分布较为一致;动态变化度极高值区域主要分布于水源区北部㊂3.2㊀丹江口水源区生态系统服务之间的关系3.2.1㊀生态系统服务关联关系在对丹江口水源区生态系统服务价值进行估算之后,依据相关分析,得到10种生态系统服务之间的相关性(表4)㊂相关性结果为正值时,表明两种生态系统服务具有协同关系,即两种生态系统服务在同一时间段具有同样的上升或降低趋势,一种服务的增加会对另一种服务产生一定的促进和增幅作用,结果为负值时,表明两种生态系统服务具有权衡关系,即一种生态系统服务的增加引起了另一种生态服务的减少㊂丹江口水源区10种生态系统服务之间组成100组值,其中36组值为负,64组为正,其中18组在0.01水平上显著正相关,8组在0.05水平上显著正相关㊂5164㊀13期㊀㊀㊀刘海㊀等:丹江口水源区生态系统服务时空变化及权衡协同关系㊀图2㊀历年生态系统服务价值分布图/(元/hm2)Fig.2㊀DistributionofEcosystemservicesvaluein1990—2015表4㊀丹江口水源区生态系统服务价值间关系Table4㊀InteractionofecosystemservicesinDanjiangkouwatersourcearea相关Correlation供给服务Supplyservice调节服务Regulationservice支持服务Compositeservice文化服务Cultureservice食物生产原料生产水资源供给气体调节气候调节净化环境水文调节土壤保持生物多样性美学景观食物生产Foodproduction1-0.052-0.624-0.179-0.529-0.748-0.493-0.359-0.632-0.705原料生产Rawmaterialproduction-0.0521-0.5930.965∗∗0.851∗0.156-0.560.931∗∗0.6660.458水资源供给Watersupply-0.624-0.591-0.377-0.0880.7020.976∗∗-0.2540.2090.446气体调节Gasregulation-0.1790.965∗∗-0.37710.930∗∗0.395-0.3260.982∗∗0.821∗0.659气候调节Climateregulation-0.5290.851∗-0.0880.930∗∗10.625-0.0920.982∗∗0.947∗∗0.836∗6164㊀生㊀态㊀学㊀报㊀㊀㊀38卷㊀续表相关Correlation供给服务Supplyservice调节服务Regulationservice支持服务Compositeservice文化服务Cultureservice食物生产原料生产水资源供给气体调节气候调节净化环境水文调节土壤保持生物多样性美学景观净化环境Environmentdepuration-0.7480.1560.7020.3950.62510.72-0.6030.838∗0.949∗∗水文调节Hydrologicaladjusting-0.493-0.560.976∗∗-0.326-0.0920.721-0.2340.2260.467土壤保持Soilconservation-0.3590.931∗∗-0.2540.982∗∗0.982∗∗0.502-0.23410.892∗0.748生物多样性Biodiversity-0.6320.666-0.3140.821∗0.947∗∗0.838∗0.2260.892∗10.967∗∗美学景观Aestheticlandscape-0.7050.4580.4460.6590.836∗0.949∗∗0.4670.7480.967∗∗1㊀㊀∗∗表示两种生态系统服务在0.01水平上显著相关;∗表示两种生态系统服务在0.05水平上显著相关图3㊀1990 2015年生态系统服务价值动态变化度分布图㊀Fig.3㊀DistributionofdynamicvariationofEcosystemservicesvaluein1990 2015在丹江口水源区生态系统服务之间相互关系中,协同关系占64%,表明协同关系是丹江口水源区生态系统服务之间的主导关系㊂这些协同关系主要存在于调节服务㊁支持服务与其他类型的生态系统服务的关系之中㊂丹江口水源区存在的权衡关系中,83.46%与供给服务有关㊂在供给服务中,3种不同类型的供给服务彼此之间均呈此消彼长的权衡关系,其中食物生产与调节服务㊁支持服务㊁文化服务均呈权衡关系;原料生产与食物生产㊁水文调节为权衡关系;水资源供给与食物生产㊁原料生产㊁气体调节㊁气候调节以及土壤保持为权衡关系㊂调节服务中,气候调节㊁气体调节㊁净化环境三者之间相互为正相关,其中气候调节与气体调节的相关性较高,这3种调节服务之间为彼此增益的协同关系,水文调节与气体调节㊁气候调节则呈不显著权衡关系,与净化环境为协同关系㊂这4种调节服务均与支持服务㊁文化服务存在正相关关系,呈协同增长的态势㊂支持服务中,土壤保持与生物多样性之间存在显著正相关关系,与调节服务㊁文化服务均为相互增益的协同关系,与供给服务中的食物生产为权衡关系,与原料生产和水资源供给为协同关系㊂文化服务中的美学景观除与食物生产为权衡关系外,与其他服务均为相互增益的协同关系,其中,与调节服务中的气候调节㊁净化环境以及支持服务中的生物多样性存在较强的协同关系㊂3.2.2㊀生态系统服务权衡协同度生态系统服务之间的相关分析是从整个时间跨度方面分析生态系统服务之间的关系㊂为了进一步评估不同时间段生态系统服务之间相互作用的程度和方向,本研究引入生态系统服务权衡协同度(ESTD)模型对丹江口水源区生态系统服务间的关系进行量化评估,当ESTD为正值时,表明这两种生态系统服务变化方向相同㊂ESTD为负值时,表明这两种生态系统服务变化方向相反㊂ESTD绝对值表示两种生态系统服务之间的变化程度的大小㊂除了计算1990 2015年的权衡协同度外,为了研究丹江口大坝加高后对丹江口水源区生态系统之间相互关系的影响,本文在对丹江口水源区生态系统服务价值估算的基础上,以丹江口大坝加高的时间点为间隔点,对丹江口水源区1990 2005年㊁2005 2015年两个时间段的生态系统服务权衡度进行计算㊂结果如下(图4 图6)㊂7164㊀13期㊀㊀㊀刘海㊀等:丹江口水源区生态系统服务时空变化及权衡协同关系㊀。
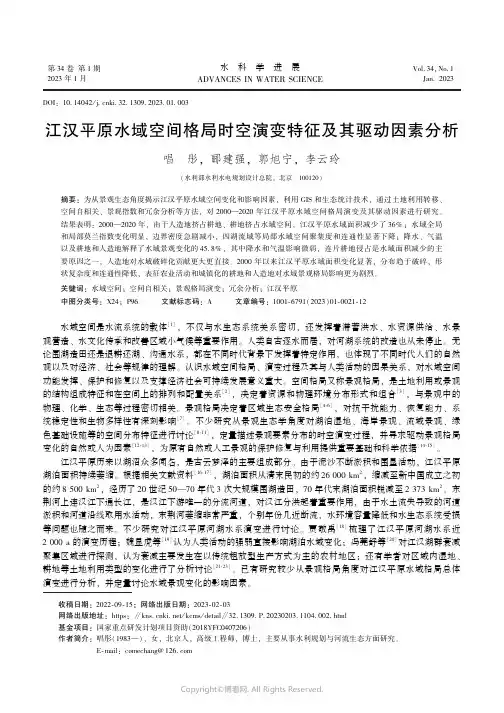
第34卷第1期2023年1月㊀㊀水科学进展ADVANCES IN WATER SCIENCEVol.34,No.1Jan.2023DOI:10.14042/ki.32.1309.2023.01.003江汉平原水域空间格局时空演变特征及其驱动因素分析唱㊀彤,郦建强,郭旭宁,李云玲(水利部水利水电规划设计总院,北京㊀100120)摘要:为从景观生态角度揭示江汉平原水域空间变化和影响因素,利用GIS 和生态统计技术,通过土地利用转移㊁空间自相关㊁景观指数和冗余分析等方法,对2000 2020年江汉平原水域空间格局演变及其驱动因素进行研究㊂结果表明:2000 2020年,由于人造地挤占耕地㊁耕地挤占水域空间,江汉平原水域面积减少了36%;水域全局和局部莫兰指数变化明显,边界密度急剧减小,四湖流域等局部水域空间聚集度和连通性显著下降;降水㊁气温以及耕地和人造地解释了水域景观变化的45.8%,其中降水和气温影响微弱,连片耕地侵占是水域面积减少的主要原因之一,人造地对水域破碎化贡献更大更直接㊂2000年以来江汉平原水域面积变化显著,分布趋于破碎,形状复杂度和连通性降低,表征农业活动和城镇化的耕地和人造地对水域景观格局影响更为剧烈㊂关键词:水域空间;空间自相关;景观格局演变;冗余分析;江汉平原中图分类号:X24;P96㊀㊀㊀文献标志码:A㊀㊀㊀文章编号:1001-6791(2023)01-0021-12收稿日期:2022-09-15;网络出版日期:2023-02-03网络出版地址:https :ʊ /kcms /detailʊ32.1309.P.20230203.1104.002.html 基金项目:国家重点研发计划项目资助(2018YFC0407206)作者简介:唱彤(1983 ),女,北京人,高级工程师,博士,主要从事水利规划与河流生态方面研究㊂E-mail:comechang@水域空间是水流系统的载体[1],不仅与水生态系统关系密切,还发挥着滞蓄洪水㊁水资源供给㊁水景观营造㊁水文化传承和改善区域小气候等重要作用㊂人类自古逐水而居,对河湖系统的改造也从未停止㊂无论围湖造田还是退耕还湖㊁沟通水系,都在不同时代背景下发挥着特定作用,也体现了不同时代人们的自然观以及对经济㊁社会等规律的理解㊂认识水域空间格局㊁演变过程及其与人类活动的因果关系,对水域空间功能发挥㊁保护和修复以及支撑经济社会可持续发展意义重大㊂空间格局又称景观格局,是土地利用或景观的结构组成特征和在空间上的排列和配置关系[2],决定着资源和物理环境分布形式和组合[3],与景观中的物理㊁化学㊁生态等过程密切相关㊂景观格局决定着区域生态安全格局[4-6],对抗干扰能力㊁恢复能力㊁系统稳定性和生物多样性有深刻影响[7]㊂不少研究从景观生态学角度对湖泊湿地㊁海岸景观㊁流域景观㊁绿色基础设施等的空间分布特征进行讨论[8-11],定量描述景观要素分布的时空演变过程,并寻求驱动景观格局变化的自然或人为因素[12-13],为原有自然或人工景观的保护修复与利用提供重要基础和科学依据[14-15]㊂江汉平原历来以湖沼众多闻名,是古云梦泽的主要组成部分㊂由于泥沙不断淤积和围垦活动,江汉平原湖泊面积持续萎缩㊂根据相关文献资料[16-17],湖泊面积从清末民初的约26000km 2,缩减至新中国成立之初的约8500km 2,经历了20世纪50 70年代3次大规模围湖造田,70年代末湖泊面积锐减至2373km 2㊂东荆河上连汉江下通长江,是汉江下游唯一的分流河道,对汉江分洪起着重要作用,由于水土流失导致的河道淤积和河道沿线取用水活动,东荆河萎缩非常严重,个别年份几近断流,水环境容量降低和水生态系统受损等问题也随之而来㊂不少研究对江汉平原河湖水系演变进行讨论㊂贾敬禹[18]梳理了江汉平原河湖水系近2000a 的演变历程;魏显虎等[19]认为人类活动的强弱直接影响湖泊水域变化;冯莞舒等[20]对江汉湖群衰减聚集区域进行探测,认为衰减主要发生在以传统粗放型生产方式为主的农村地区;还有学者对区域内湿地㊁耕地等土地利用类型的变化进行了分析讨论[21-23]㊂已有研究较少从景观格局角度对江汉平原水域格局总体演变进行分析,并定量讨论水域景观变化的影响因素㊂22㊀水科学进展第34卷㊀本文从土地利用变化入手,对江汉平原2000 2020年土地利用状况和水域景观格局指数进行分析,定量讨论江汉平原水域空间转移状况㊁空间自相关关系以及景观指数的时空变化等;考虑自然和人类活动影响,分析水域空间演变的驱动因素㊂研究结果可为江汉平原水域空间保护与恢复和可持续发展提供科学依据㊂1㊀研究区域与研究方法1.1㊀研究区域江汉平原地处湖北中南部,西起枝江和当阳,东迄黄梅和阳新,北至荆门和钟祥,南与洞庭湖平原相连,由长江与汉江冲积而成,面积约4.7万km2,是长江中下游平原的重要组成㊂江汉平原属亚热带季风气候,温暖湿润㊁雨热同期㊁热量充足㊂年均气温约17ħ,10ħ以上活动积温为5100~5300ħ,年均降水量为1100~1300mm㊂区域地势平坦,海拔多在50m等高线以下,水网交织,湖泊星罗棋布,是湖北经济社会发展的核心区域和中国重要商品粮基地㊂江汉平原位置示意如图1㊂图1㊀江汉平原位置示意Fig.1Location of the Jianghan Plain1.2㊀数据来源与处理采用数据包括30m精度土地利用数据㊁降水和气温数据㊂土地利用数据来自中国发布的2000年㊁2010年和2020年3期全球地表覆盖(GlobeLand30)数据产品(http:ʊ/),该产品主要采用美国陆地资源卫星(Landsat)的TM5㊁ETM+㊁OLI多光谱影像和中国环境减灾卫星(HJ-1)30m多光谱影像和高分一号(GF-1)多光谱影像研制而成,数据总体精度在83.5%以上㊂对研究区数据进行随机抽样,通过野外调研开展分类数据验证,数据分类精度在90%以上,能够满足研究需要㊂研究区共涉及耕地㊁林地㊁草地㊁灌木地㊁湿地㊁水体㊁人造地和裸地8种土地类型,其中,人造地指由人工建造活动形成的地表,包括城镇等各类居民地㊁工矿㊁交通设施等㊂考虑本文以水域空间为主要研究对象,将湿地和水体合并成为水域空间;其余土地利用类型含义如表1所示㊂降水和气温数据来自中国1km分辨率逐月降水量和平均气温数据集(1901 2020年)[24-25]㊂㊀第1期唱彤,等:江汉平原水域空间格局时空演变特征及其驱动因素分析23㊀表1㊀土地利用类型及其含义Table 1Land use types and its description土地利用类型含义耕地用于种植农作物的土地,包括水田㊁灌溉旱地㊁雨养旱地㊁菜地㊁牧草种植地㊁大棚用地㊁以种植农作物为主间有果树及其他经济乔木的土地,以及茶园㊁咖啡园等灌木类经济作物种植地林地乔木覆盖且树冠盖度超过30%的土地,包括落叶阔叶林㊁常绿阔叶林㊁落叶针叶林㊁常绿针叶林㊁混交林以及树冠盖度为10%~30%的疏林地草地天然草本植被覆盖,且盖度大于10%的土地,包括草原㊁草甸㊁稀树草原㊁荒漠草原以及城市人工草地等灌木地灌木覆盖且灌丛覆盖度高于30%的土地,包括山地灌丛㊁落叶和常绿灌丛,以及荒漠地区覆盖度高于10%的荒漠灌丛水域位于陆地和水域交界带,有浅层积水或土壤过湿的土地,多生长有沼生或湿生植物,包括内陆沼泽㊁湖泊沼泽㊁河流洪泛湿地㊁森林/灌木湿地㊁泥炭沼泽㊁红树林㊁盐沼等;陆地范围液态水覆盖区域,包括江河㊁湖泊㊁水库㊁坑塘等人造地由人工建造活动形成的地表,包括城镇等各类居民地㊁工矿㊁交通设施等,不包括建设用地内部连片绿地和水体裸地植被覆盖度低于10%的自然覆盖土地,包括荒漠㊁沙地㊁砾石地㊁裸岩㊁盐碱地等1.3㊀研究方法1.3.1㊀土地利用动态转移分析土地利用转移矩阵是系统分析中对系统状态与状态转移的定量描述[26],是将研究期始末土地利用结构和转移面积以二维矩阵的形式表达,既能反映研究区某时间节点的地类结构与面积,还能分析研究期始末地类的转入转出情况,揭示土地利用格局的时空演化过程㊂数学表达如式(1)所示㊂S =S 11S 1n ︙⋱︙S n 1S nn éëêêêùûúúú(1)式中:S 为研究期始末土地利用状况;S ij 为研究期内土地类型i 转换成土地类型j 的面积;i ,j =1,2, ,n ,n 为土地利用类型数㊂本文通过空间相交计算,得到不同时段土地利用转移状况㊂1.3.2㊀空间自相关分析空间自相关分析是研究邻近位置属性相关性的空间统计学方法,是针对某种特征属性,对某空间单元与其周围单元间进行的空间自相关程度计算,以分析这些空间单元在空间上的离散或聚集等分布特性㊂以全局自相关和局部自相关揭示研究区的整体特征和局部分异㊂全局自相关是对变量空间聚集特征的综合评价,以全局莫兰指数(Global Moranᶄs I )表征,计算公式如式(2)所示[27]㊂局部自相关表达局部区域的聚集现象或异常值,描述空间分异规律,以局部莫兰指数(Anselin Local Moranᶄs I )表征,计算公式如式(3)㊁式(4)所示[28]㊂I =m ðmi =1ðmj =1w ij (x i -x )(x j -x )/[ðmi =1ðmj =1w ij ðmi =1(xi-x )2](2)式中:I 为全局莫兰指数;m 为区域空间单元总数;x i 和x j 分别为随机变量x 在地理单元i 和j 上的属性值;x =1m ðmi =1x i,为m 个空间单元样本属性值的平均值;w ij 为区域i ㊁j 的邻接空间权重矩阵,表示空间对象的邻接关系㊂当区域i ㊁j 相邻,w ij =1,反之w ij =0㊂I 的取值范围为[-1,1],I >0表示空间正相关,即具有空间聚集性;I <0表示空间负相关,即不具空间聚集性;I 接近于0表示不存在空间自相关性也即随机分布㊂I i =x i -x s 2i()ðmj =1,j ʂiw ij(x j-x )(3)s 2i=ðmj =1,j ʂi(x j -x )2/(m -1)(4)24㊀水科学进展第34卷㊀式中:I i为局部莫兰指数,当I i值为正时表示存在高值(或低值)空间聚集,I i值为负时表示不相似值的空间聚集㊂根据土地利用数据精度和水域平均斑块面积,综合考虑尺度效应,选取6kmˑ6km网格单元划分1674个网格,计算每个网格内的水域面积,并与网格面积相除得到不同时期水域面积率网格图㊂计算水域面积率全局莫兰指数和局部莫兰指数,分析是否存在空间集聚或异常值及其出现的位置㊂1.3.3㊀景观格局分析在类型尺度上,选取景观面积比例(P LAND)㊁边界密度(D E)㊁景观分裂度(I L D)和聚合度(I A)等景观指数,定量描述水域空间面积㊁形状㊁空间聚散度和连通性等特征,揭示江汉平原水域景观空间分布状况㊂其中,P LAND表示景观中某类型斑块的面积占整个景观面积的百分比;D E表征景观形状复杂程度,数值越大形状越复杂;I L D表征景观中不同斑块分布的分离程度,反映景观的破碎化状况,数值越大景观聚集度越低;I A表征景观斑块间的连通性,数值越小景观越离散㊂各景观指数的数学表达见文献[6,15]㊂在6kmˑ6km 网格图内,计算各网格的水域景观指数,采用反距离加权插值法(IDW)对景观指数进行空间插值,得到不同时期江汉平原水域景观指数的空间分布㊂2㊀结果与分析2.1㊀江汉平原水域空间转换变化过程在研究时段内,江汉平原水域空间发生了较大变化,通过土地利用转移矩阵(表2 表4)可知,2000 2010年,水域面积减少最多,为982km2,减少比例为13%,向耕地转移净面积最多,为806km2;耕地和人造地面积均有所增加,分别为528km2和589km2,其中,耕地增加主要来自林地和水域的转入,人造地增加主要来自耕地的转入,面积为510km2㊂2010 2020年,水域面积加速减少,减少面积1741km2,仍然主要转向耕地,转为耕地的净面积为1834km2;耕地面积数量减少不多,为140km2,但存在明显的水域转为耕地㊁耕地转为人造地的转换路径;人造地增加了2393km2,面积是2010年的近2倍㊂经过20a土地利用演变,江汉平原人造地面积增加近3000km2,是2000年的2.5倍,耕地面积略有增加,增加比例为1%,主要通过耕地转为人造地㊁再由水域空间补给耕地的方式实现㊂2000 2020年江汉平原水域转向耕地和由耕地转为人造地的面积分布如图2所示㊂水域向耕地转移较为集中的地区为洪湖㊁仙桃等;耕地向人造地的转移分布较广,在沿江局部河段和都市圈附近存在聚集现象,在其他区域呈较均匀的离散分布㊂表2㊀2000 2010年江汉平原土地利用转移矩阵Table2Land use transition matrix of the Jianghan Plain in2000 2010单位:km2土地利用类型耕地林地草地灌木地水域人造地裸地2000年合计耕地31898.0234.397.10.21058.0837.70.234125.5林地480.01596.754.20.4139.051.20.12321.6草地84.0133.7372.70.134.938.90664.2灌木地0.30.40.1 2.4000 3.2水域1863.5228.988.805363.831.312.07588.4人造地327.713.818.0010.31625.001994.9裸地0.10.100000.30.5 2010年合计34653.62208.0631.0 3.16606.12584.012.646698.2㊀第1期唱彤,等:江汉平原水域空间格局时空演变特征及其驱动因素分析25㊀表3㊀2010 2020年江汉平原土地利用转移矩阵Table3Land use transition matrix of the Jianghan Plain in2010 2020单位:km2土地利用类型耕地林地草地灌木地水域人造地裸地2010年合计耕地31213.0269.097.90.3715.72354.0 3.734653.6林地370.71380.4141.20.4182.3114.318.82208.0草地119.064.6285.10.168.094.20631.0灌木地 1.40.700.9000 3.1水域2549.220.629.303879.6121.0 6.46606.1人造地260.5 6.08.4016.02293.102584.0裸地0.20.200 3.808.412.6 2020年合计34513.91741.5561.9 1.64865.34976.637.346698.2表4㊀2000 2020年江汉平原土地利用转移矩阵Table4Land use transition matrix of the Jianghan Plain in2000 2020单位:km2土地利用类型耕地林地草地灌木地水域人造地裸地2000年合计耕地30490.3291.4112.60.2467.22748.415.534125.5林地570.51255.8114.20.3118.8259.6 2.32321.6草地136.998.9255.90.163.5109.00664.2灌木地 1.40.70 1.00.100 3.2水域3045.985.366.504203.5168.019.27588.4人造地268.89.312.7012.31691.701994.9裸地0.10.100000.30.5 2020年合计34513.91741.5561.9 1.64865.34976.637.346698.2图2㊀2000 2020年江汉平原水域转为耕地和耕地转为人造地的面积分布Fig.2Spatial distribution of water area changed to farmland and farmlands changed to artificial surface on the Jianghan Plain in 2000 20202.2㊀江汉平原水域空间自相关动态变化在P=0.01的显著水平下,2000年㊁2010年和2020年江汉平原水域全局莫兰指数分别为0.563㊁0.566和0.421,江汉平原整体上存在水域面积率高值与高值聚集㊁低值与低值聚集的空间聚类现象㊂2000 2010年全局莫兰指数基本维持稳定,2010 2020年自相关程度有所减弱,说明水域面积率高低值的聚集程度有26㊀水科学进展第34卷㊀所降低,相邻区域水域空间趋同性正在下降㊂水域局部空间自相关特征如图3所示,统计聚集与异常值类型网格数量,结果如表5所示㊂2000 2020年,江汉平原水域空间不相关的网格数量有所增加,增加比例为9%㊂水域空间高值聚集的网格数量持续减少,近20a减少了约1/4,且前10a的减少速度更快㊂水域空间低值被高值包围的网格数量有所增加,且随时间推移从主要分布在高值聚集区域周边逐渐向区域内部延伸,表明水域空间连通性正在减弱,破碎度正在增加,且2010 2020年表现更为突出㊂低值聚集的网格数量略有减少,从空间分布看,低值聚集区从2000年主要分布在江汉平原南北侧边缘演变成向江汉平原腹地发展,特别表现在四湖流域等㊂图3㊀2000 2020年江汉平原水域空间LISA聚集图Fig.3LISA cluster map of water area on the Jianghan Plain in2000 2020表5㊀2000 2020年江汉平原水域空间自相关类型统计Table5Types of the spatial autocorrelation of the water area on the Jianghan Plain in2000 2020单位:个年份不相关高值聚集高值被低值包围低值被高值包围低值聚集2000年8982364374992010年9571833394922020年9801763554602.3㊀江汉平原水域空间格局动态变化特征江汉平原类型尺度水域景观指数计算结果如表6所示㊂2000 2020年,江汉平原水域面积率(P LAND,W)和边界密度(D E,W)持续下降,且后10a下降更快;水域面积率从16.2%下降为10.4%,水域面积减小为原来的约60%;水域边界密度降为原来的约40%,水域形状复杂度明显降低,水域边界趋于简单化或规整化㊂水域景观分裂度指数(I LD,W)变化不大,水域破碎度基本维持原有状态㊂水域聚合度指数(I A,W)略有增加,表明水域连通性有所增加㊂从整体看,近20a水域面积持续减少,水域边界趋于简单化和规整化,连通性略有增加㊂表6㊀2000 2020年江汉平原水域景观指数Table6Landscape metrics of water area at class level on the Jianghan Plain in2000 2020年份P LAND,W/%D E,W/(m㊃ha-2)I LD,W I A,W/%2000年16.212.90.998894.02010年14.110.10.997394.62020年10.4 5.90.998595.7㊀第1期唱彤,等:江汉平原水域空间格局时空演变特征及其驱动因素分析27㊀㊀㊀通过景观指数插值计算,得到江汉平原水域面积率㊁水域景观分裂度指数和水域聚合度指数的空间分布㊂水域面积率空间分布状况如图4所示,小于10%的区域在2000年主要分布在江汉平原边缘区域及天门㊁潜江东部㊁监利北部和汉川西南部的一些区域,2010年扩展到潜江全域和江陵部分区域,到2020年,扩展趋势大大增加;水域面积率小于5%的区域在江汉平原中西部连片分布;水域面积率在20%~40%的区域,从2000年的呈带状贯通式分布演变为2020年的面积缩减为原来的约一半,且呈相对离散分布;水域面积率在40%和60%以上的区域面积2020年较2000年分别减少了76%和95%㊂水域面积率网格数量统计如表7所示㊂图4㊀2000 2020年江汉平原水域面积率空间分布Fig.4Spatial distribution of percentage of water area on the Jianghan Plain in2000 2020表7㊀不同水域面积率网格数量统计表Table7Grid number of rates of water area年份P LAND,W<10%20%<P LAND,W<40%P LAND,W>40%P LAND,W>60%2000年222661054824303962010年25904741920175772020年30984527959713㊀㊀水域景观分裂度指数空间分布如图5所示,变化主要发生在2010 2020年,数值趋近于1的区域面积显著增加且连片分布,表明原有的水域聚集分布区域正在萎缩或消失,以四湖流域㊁仙桃以及武汉市部分区域等最为显著㊂江汉平原局部区域水域空间正向分布更加离散和破碎的方向演变㊂水域聚合度指数空间分布如图6所示,2000年江汉平原大部分区域聚合度指数在60%以上;2000 2010年间,中西部部分区域聚合度略有下降,水域连通性有所降低;2010 2020年聚合度下降趋势显著,以仙桃㊁汉川㊁天门以及四湖流域等为主要区域,连通性显著减弱,破碎度增加㊂图5㊀2000 2020年江汉平原水域景观分裂度指数分布Fig.5Spatial distribution of Landscape Division Index of water area on the Jianghan Plain in2000 202028㊀水科学进展第34卷㊀图6㊀2000 2020年江汉平原水域聚合度指数分布Fig.6Spatial distribution of Aggregation Index of water area on the Jianghan Plain in2000 20203 江汉平原水域空间格局演变的影响因素分析水域景观格局是自然和人为因素共同作用的结果[29]㊂江汉平原地势相对平坦低洼,地理空间异质性不明显,选取对水域空间产生直接影响的降水和气温作为自然因素㊂江汉平原自古是鱼米之乡,是中国重要的粮食主产区和著名的水产区,同时又是湖北省经济社会和文化发展的核心区域,人口密集,人类活动剧烈,考虑人类活动与土地状况的密切联系,以耕地和人造地演变表征农业生产㊁城镇化进程和经济社会发展等人类活动,作为人为因素㊂采用6kmˑ6km网格图,以网格内的降水㊁气温以及耕地和人造地的面积率㊁连通性和景观分裂度指数作为解释变量,以水域面积率㊁聚合度指数和景观分裂度指数作为响应变量,选取水域面积占比较高或面积变化较大的743个网格为样方,通过冗余分析寻求水域空间格局演变的驱动因素㊂结果显示,在P=0.002的显著水平下,降水㊁气温以及耕地和人造地变化共解释了45.8%的水域空间景观数据㊂通过方差分析,识别自然和人为因素各自的贡献率以及共同作用的贡献率,结果表明,在P=0.002的显著水平下,降水和气温的单独效应为2.3%,耕地和人造地的单独效应为44.3%,共同作用部分为0.8%㊂由于自然因素作用十分微弱,为进一步明确人类活动的影响,以耕地(A g)和人造地(A r)景观指数为解释变量,以降水和气温为协变量,通过偏冗余分析,在剔除降水和气温影响后,得到耕地和人造地对水域空间的影响㊂结果表明,在P=0.002的显著水平下,前2个约束轴解释了44.5%的水域空间景观数据方差,形成的双序图如图7所示㊂水域空间面积率与连通性呈正相关,即水域面积率越大,连通性越高;聚散程度与面积率和连通性存在负相关关系,即水域景观越破碎,连通性越弱,水域面积率也越低㊂耕地与水域景观具有明显的相关关系,在耕地面积率(A g-P LAND,W)和连通性(A g-I A,W)变化梯度轴上,最适值排序为水域空间分裂度>连通性>水域面积率,表明耕地面积率和连通性与水域面积率和连通性呈负相关,且对水域面积率的影响最大,其次为水域连通性;从耕地分裂度(A g-I LD,W)变化梯度轴看,耕地分布越离散则水域面积率越大㊁连通性越强,且根据水域景观指数在耕地分裂度梯度轴上的投影距原点距离,离散分布的耕地对水域面积率的作用较对水域连通性的作用更显著㊂人造地面积率(A r-P LAND,W)㊁连通性(A r-I A,W)和分裂度(A r-I LD,W)指数箭头间的夹角均小于90ʎ,呈正相关关系,且作用相对集中,在人造地3个景观指数梯度轴上,水域空间格局最适值的排序为景观分裂度>连通性>水域面积率,且人造地景观指数与水域空间破碎程度呈较强的正相关,与水域面积呈较强的负相关,表明人造地大面积连片分布,直接影响区域的水域面积率,并导致水域景观相对破碎和离散分布㊂㊀第1期唱彤,等:江汉平原水域空间格局时空演变特征及其驱动因素分析29㊀图7㊀江汉平原水域景观与耕地和人造地的冗余分析排序Fig.7Redundancy analysis ordination of water landscape with farmland and artificial surface on the Jianghan Plain㊀㊀湖泊是抵御湖区洪水的第一道天然屏障,湖泊面积减少必然带来蓄滞洪能力的减弱㊂根据潘方杰等[30]建立的江汉平原湖泊水面与可调蓄水量的相关关系,湖泊面积减少使得可调蓄水量减少近40%;如针对典型洪水,需考虑来水过程㊁预留湖泊容积㊁优化调度以及湖泊周边水利工程设施等对流域防洪的综合影响,进一步开展深入研究㊂此外,受数据精度限制,除已知垸堤外,宽度远小于30m的未知垸堤难以体现在现有尺度研究中,可能造成对水域破碎程度㊁连通性等的评价趋于乐观,后续将加强对垸堤数据的更新并开展更小尺度水域格局演变分析㊂江汉平原洲滩民垸众多,作为流域防洪体系的重要组成部分,发挥着行蓄洪水的作用,根据耕地㊁人造地对水域空间影响分析结果,从防洪安全角度出发,应持续推进洲滩民垸实施单退(退人不退地)和双退(退人退地),巩固退垸行洪成效,提升防洪能力㊂随着武汉 1+8 城市圈的发展,江汉平原城市化进程将进一步加速,人类活动强度也将进一步加大㊂考虑水域空间格局演变特征,应厘清耕地㊁水域和人造地的空间关系,按照 四水四定 原则,严格控制城市发展边界,严守耕地保护红线,严格划定与管控水域空间㊂城市建设应遵循低影响开发原则,维持水域空间的连通性和完整性,同时强化土地利用规划的作用,提高城市土地利用率㊂4㊀结㊀㊀论本文基于GlobeLand30全球地表覆盖数据,分析水域空间转移状况㊁水域空间自相关状况以及水域景观指数时空变化,揭示江汉平原水域空间时空演变特征,并结合降水和气温数据,识别影响水域空间演变的关键驱动因素㊂主要结论如下:(1)2000 2020年,江汉平原水域面积减少约2700km2,占水域总面积的36%,主要被耕地侵占,而耕地面积基本没变的原因是一部分耕地面积又转为人造地㊂快速的城市化进程使得人造地面积在20a间增长了约2.5倍,新增面积约90%是通过间接侵占水域空间的方式实现,即人造地挤占耕地㊁减少的耕地面积通过挤占水域空间补足㊂围湖造田一直是影响江汉平原湖泊演变的主要因素之一,然而最近20a在围湖造田表象的背后又呈现新的变化㊂(2)江汉平原水域面积萎缩与聚集性㊁连通性减弱和形状简单化趋势相互伴随㊂水域全局自相关程度明显减弱,水域空间聚集分布面积减少约1/4;边界密度降为原来的约40%,中西部区域水域景观分裂度指数和聚合度指数变化明显,水域空间趋于离散和破碎化㊂水域景观阶段性特征明显,2000 2010年,水域面积减少近13%,水域形状复杂度略有降低,局部水域空间破碎化和连通性降低趋势有所发展;2010 2020。
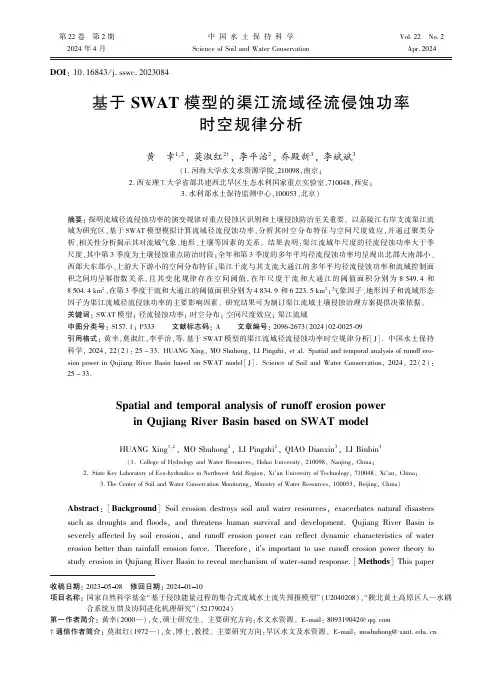
第22卷 第2期2024年4月中国水土保持科学Science of Soil and Water ConservationVol.22 No.2Apr.2024 D OI :10.16843/j.sswc.2023084基于SWAT 模型的渠江流域径流侵蚀功率时空规律分析黄 幸1,2,莫淑红2†,李平治2,乔殿新3,李斌斌3(1.河海大学水文水资源学院,210098,南京;2.西安理工大学省部共建西北旱区生态水利国家重点实验室,710048,西安;3.水利部水土保持监测中心,100053,北京)摘要:探明流域径流侵蚀功率的演变规律对重点侵蚀区识别和土壤侵蚀防治至关重要㊂以嘉陵江右岸支流渠江流域为研究区,基于SWAT 模型模拟计算流域径流侵蚀功率,分析其时空分布特征与空间尺度效应,并通过聚类分析㊁相关性分析揭示其对流域气象㊁地形㊁土壤等因素的关系㊂结果表明:渠江流域年尺度的径流侵蚀功率大于季尺度,其中第3季度为土壤侵蚀重点防治时段;全年和第3季度的多年平均径流侵蚀功率均呈现出北部大南部小㊁西部大东部小㊁上游大下游小的空间分布特征;渠江干流与其支流大通江的多年平均径流侵蚀功率和流域控制面积之间均呈幂指数关系,且其变化规律存在空间阈值,在年尺度干流和大通江的阈值面积分别为8549.4和8504.4km 2,在第3季度干流和大通江的阈值面积分别为4834.9和6223.5km 2;气象因子㊁地形因子和流域形态因子为渠江流域径流侵蚀功率的主要影响因素㊂研究结果可为制订渠江流域土壤侵蚀治理方案提供决策依据㊂关键词:SWAT 模型;径流侵蚀功率;时空分布;空间尺度效应;渠江流域中图分类号:S157.1;P333文献标志码:A文章编号:2096⁃2673(2024)02⁃0025⁃09引用格式:黄幸,莫淑红,李平治,等.基于SWAT 模型的渠江流域径流侵蚀功率时空规律分析[J].中国水土保持科学,2024,22(2):25-33.HUANG Xing,MO Shuhong,LI Pingzhi,et al.Spatial and temporal analysis of runoff ero⁃sion power in Qujiang River Basin based on SWAT model[J].Science of Soil and Water Conservation,2024,22(2):25-33.收稿日期:20230508 修回日期:20240110项目名称:国家自然科学基金 基于侵蚀能量过程的集合式流域水土流失预报模型”(U2040208), 陕北黄土高原区人 水耦合系统互馈及协同进化机理研究”(52179024)第一作者简介:黄幸(2000 ),女,硕士研究生㊂主要研究方向:水文水资源㊂E⁃mail:809319042@†通信作者简介:莫淑红(1972 ),女,博士,教授㊂主要研究方向:旱区水文及水资源㊂E⁃mail:moshuhong@Spatial and temporal analysis of runoff erosion powerin Qujiang River Basin based on SWAT modelHUANG Xing 1,2,MO Shuhong 2,LI Pingzhi 2,QIAO Dianxin 3,LI Binbin 3(1.College of Hydrology and Water Resources,Hohai University,210098,Nanjing,China;2.State Key Laboratory of Eco⁃hydraulics in Northwest Arid Region,Xi′an University of Technology,710048,Xi′an,China;3.The Center of Soil and Water Conservation Monitoring,Ministry of Water Resources,100053,Beijing,China)Abstract :[Background ]Soil erosion destroys soil and water resources,exacerbates natural disasters such as droughts and floods,and threatens human survival and development.Qujiang River Basin is severely affected by soil erosion,and runoff erosion power can reflect dynamic characteristics of water erosion better than rainfall erosion force.Therefore,it’s important to use runoff erosion power theory to study erosion in Qujiang River Basin to reveal mechanism of water⁃sand response.[Methods ]This paper中国水土保持科学2024年took Qujiang River Basin as a research object,calculating seasonal as well as annual runoff erosion power based on runoff,which was simulated by SWAT model in terms of utilizing meteorological forcing data such as precipitation,temperature,wind etc.In addition,features of spatial⁃temporal pattern and effects of spatial scale were analyzed.Cluster and correlation method were adopted for investigation into relationships between runoff erosion power with meteorological,topographic and soil conditions. [Results]1)The constructed SWAT model had high accuracy in runoff simulation and good applicability in Qujiang River Basin.R2and NS coefficients were0.69and above,while PBIAS coefficient was below 16.72%in both parameter rate setting period and validation period.2)In aspect of time,annual runoff erosion power outweighed that in season.However,erosion during seasonⅢwas more serious than that in other season,which requires more attention on soil erosion prevention and control.Besides,runoff erosion power for whole year and for season III demonstrated a decreasing trend from north to south,west to east and up to down inspace.3)The thresholds of drainage control area for whole year in Qujiang river and Datong river were8549.4and8504.4km2respectively,while those for season III were4834.9and 6223.5km2respectively,indicating runoff erosion power decreased smoothly with increasing area when the area was larger than spatial thresholds,then gradually tended to a stable value.4)Meteorological, topographic and watershed morphological characters were main factors influenced runoff erosion power in Qujiang River Basin.Erosion in upstream area of basin presented greater performance than downstream, due to the steep topography,uneven precipitation distribution and morphological ease of runoff generation and flow concentration processes in upper reaches.[Conclusions]This paper illustrated feasibility of SWAT model and its simulated outcome in Qujiang River Basin.The spatial⁃temporal runoff erosion power characteristics together with impacts are closely related to meteorological constituents,terrain and basin shape.Therefore,the results contribute to effective identification of key sand producing areas in watershed,and also provide supports for soil erosion prevention,ecology restoration and environmental carrying capacity enhancement.Keywords:SWAT model;runoff erosion power;temporal and spatial distribution;spatial scale effect; Qujiang River Basin 土壤侵蚀是全球公认的最严重的环境问题之一,其破坏水土资源,加剧旱涝等自然灾害,威胁人类的生存和发展㊂嘉陵江流域地质地貌条件复杂㊁降水丰富㊁土壤可蚀性强,且不合理生产活动多,使得流域内水土流失面积和土壤侵蚀总量曾常居长江流域前列,水土流失治理刻不容缓[1]㊂当前有许多量化土壤侵蚀对流域影响的模型,如通用土壤流失方程㊁修正土壤流失方程和中国坡面土壤流失方程等[2]㊂降雨侵蚀力反映降雨及其产生的径流剥离和携带土壤颗粒的能力,其作为水蚀动力指标被广泛应用于土壤侵蚀模型及土壤侵蚀分析中[34]㊂但是降雨侵蚀力的计算通常需要高精度且不易获取的长序列场次降雨数据,资料处理较繁琐,且其仅通过雨滴的击溅效应表征土壤侵蚀作用,并未体现水蚀动力过程中的径流侵蚀和径流输沙作用[56],具有一定的局限性㊂与降雨侵蚀力相比,径流侵蚀功率能更好的反映水蚀动力特性,对于侵蚀动力机制的反应更敏感,数据要求更低[7]㊂目前已有众多学者基于径流侵蚀功率理论研究黄土高原地区的土壤侵蚀空间分布特征及尺度效应,取得较好成果[89]㊂长江流域的降水特征及下垫面条件与黄河流域不同,其侵蚀产沙和主要驱动机制也会有所差异[10],而此类研究在长江流域相对较少㊂因此,利用径流侵蚀功率理论研究长江流域地区的侵蚀情况对揭示其水沙响应机理具有重要意义㊂笔者以嘉陵江子流域渠江流域为例,基于SWAT(Soil and Water Assessment Tool)模型模拟流域径流,计算并分析径流侵蚀功率的时空分布特征㊁空间尺度效应及主要影响因子,以期为流域有效识别重点产沙区㊁合理开发利用水土资源等做出贡献㊂1 研究区概况渠江流域面积为3.92万km2(E106°28′~ 109°00′,N30°00′~32°48′),属亚热带湿润季风气62 第2期黄幸等:基于SWAT模型的渠江流域径流侵蚀功率时空规律分析候㊂其雨季集中于7 9月,多年平均降雨量为1078mm,输沙量主要来自汛期,多年平均输沙模数为347t/km2㊂流域地势东北高西南低,源头地势坡度较大,至下游浅丘区比降逐渐减小,土壤类型以棕壤㊁黄棕壤和紫色土为主㊂渠江流域水系及水文站点分布见图1㊂图1 渠江流域水系及水文站点分布图Fig.1 Distribution of river system and hydrological stations in Qujiang River Basin2 数据与方法2.1 数据来源笔者采用的数据主要包括摘自‘长江流域水文年鉴“的2008 2018年渠江流域上㊁中㊁下游巴中㊁七里沱和罗渡溪水文站实测日流量资料,由中国大气同化驱动数据集整理的逐日降水㊁风速㊁温度等气象数据,以及中科院地理空间数据云㊁中科院数据中心遥感影像㊁世界土壤数据库提供的30m分辨率地形数据㊁1∶10万土地覆盖数据和1∶100万土壤类型等空间数据㊂2.2 径流侵蚀功率计算2.2.1 SWAT模型构建与应用 笔者使用SWAT 模型[11]模拟渠江流域2009 2018年月径流,进而分析计算流域径流侵蚀功率㊂先依据集水面积㊁坡度等级㊁土地利用与土壤类型将渠江流域划分为77个子流域和1377个水文响应单元㊂然后,选取2008年作为预热期进行参数预调,2009 2013年作为率定期,2014 2018年作为验证期㊂在SWAT-CUP中选择径流相关参数进行参数敏感性分析和参数率定,并运用决定系数R2(R-Square)㊁纳什效率系数NS(Nash-Sutcliffe efficiency coefficient)㊁偏差比例PBIAS(percent bias)作为评价指标检验径流模拟精度㊂一般认为R2>0.6㊁NS>0.5㊁PBIAS≤±25%时,结果较好㊂满足精度要求时,输出渠江各子流域出口的模拟月径流过程㊂2.2.2 径流侵蚀功率计算 径流侵蚀功率属于经验模型指标中的侵蚀动力因子,其计算原理及应用详见文献[7]㊂依此推出的季径流侵蚀功率和年径流侵蚀功率计算公式分别见式(1)和式(2)㊂E s=Q s H s㊂(1)式中:E s为季径流侵蚀功率,m4/(km2㊃s);Q s为季最大月流量模数,m3/(km2㊃s);H s为季径流深,m㊂E y=Q y H y㊂(2)式中:E y为年径流侵蚀功率,m4/(km2㊃s);Q y为年最大月流量模数,m3/(km2㊃s);H y为年径流深,m㊂2.3 径流侵蚀功率影响因素分析选用系统聚类方法[12]和斯皮尔曼相关系数[13]对径流侵蚀功率影响因子进行合并归类与相关性分析㊂斯皮尔曼相关系数的绝对值越大,指标之间相关性越高,其表达式见式(3)㊂ρ=1-6∑n i=1d2in(n2-1)㊂(3)式中:ρ为斯皮尔曼相关系数;n为系列长度;d为72中国水土保持科学2024年按升序或降序排列后,同次序指标间的差值,量纲均为1㊂3 结果与分析3.1 模型率定与验证结果率定期㊁验证期巴中㊁七里沱和罗渡溪水文站模拟与实测月径流量值对比见图2~4㊂分析可知,巴中水文站率定期R 2=0.96㊁NS =0.92㊁PBIAS =16.2%,验证期R 2=0.70㊁NS =0.69㊁PBIAS =16.43%,率定结果较好,验证结果评级为可信;七里沱水文站率定期R 2=0.95㊁NS =0.93㊁PBIAS =-0.3%,验证期R 2=0.82㊁NS =0.80㊁PBIAS =-14.81%,率定结果极好,验证结果评级为较好;罗渡溪水文站率定期R 2=0.93㊁NS =0.92㊁PBIAS =-3.5%,验证期R 2=0.87㊁NS =0.84㊁PBIAS =-16.72%,率定结果极好,验证结果评级为较好㊂综上所述,在率定期和验证期内,3个水文站模拟所得月径流过程与实测月径流过程吻合度较高,表明所构建的SWAT 模型能较真实地反映渠江流域水文情势㊂图2 巴中水文站月径流量模拟值与实测值对比图Fig.2 Comparison of simulated and measured monthly runoff at Bazhong station图3 七里沱水文站月径流量模拟值与实测值对比图Fig.3 Comparison of simulated and measured monthly runoff at Qilituo station3.2 径流侵蚀功率的时空分布基于SWAT 模型得到2009 2018年渠江77个子流域季尺度和年尺度的多年平均径流侵蚀功率,其空间分布见图5和6㊂从时间角度看,全流域多年平均年径流侵蚀功率为0.049m 4/(km 2㊃s),总体上大于各季度多年平均径流侵蚀功率;在季尺度,第3季度多年平均径流侵蚀功率最大(0.028m 4/(km 2㊃s)),其次为第2季度㊁第4季度和第1季度,其变化周期与水文周期一致㊂显然,第3季度的径流侵蚀功率对全年贡献最大,应当重视该季度的水土流失治理㊂在空间尺度上,流域全年和第3季度的多年平均径流侵蚀功率均呈现出 北部大㊁南部小;西部大㊁东部小;上游大㊁下游小”的空间分布特征㊂第4季度的空间分布虽在南北和上下游部分与全年相似,但在东西部表现出 东部大㊁西部小”的特征㊂第1季度和第2季度的空间分布82 第2期黄幸等:基于SWAT模型的渠江流域径流侵蚀功率时空规律分析图4 罗渡溪水文站月径流量模拟值与实测值对比图Fig.4 Comparison of simulated and measured monthly runoff at Luoduxi station与全年相反,表现为 南部大㊁北部小;东部大㊁西部小;下游大㊁上游小”,但因其径流侵蚀功率较小,对年尺度空间分布影响也较小㊂3.3 径流侵蚀功率的空间尺度效应渠江流域的径流侵蚀功率空间差异明显,可能存在空间尺度效应,即径流侵蚀功率随流域控制面积变化可能呈现出一定规律㊂首先利用SWAT 模型计算2009 2018年渠江77个子流域出口断面及以上控制面积的全年和第3季度的多年平均径流侵蚀功率,结果见图7㊂由图7可知,对全年和第3季度,渠江各子流域出口断面及以上控制区域的多年平均径流侵蚀功率总体呈现出 上游大,下游小;干流大,支流小”的分布特点㊂为量化径流侵蚀功率与流域控制面积的相关关系,选取侵蚀较严重的渠江干流和支流大通江为研究对象,将流域控制面积分别与全年和第3季度的多年平均径流侵蚀功率进行拟合分析㊂干流的拟合结果分别见式(4)㊁式(5)和图8,大通江的拟合结果分别见式(6)㊁式(7)和图9㊂E my =0.0761A -0.158,R 2=0.67;(4)E ms =0.0438A-0.137,R 2=0.52;(5)E my 1=0.0771A -0.153,R 2=0.46;(6)E ms 1=0.0510A-0.165,R 2=0.49㊂(7)式中:E my ㊁E my 1分别为干流和大通江多年平均年径流侵蚀功率,m 4/(km 2㊃s);E ms ㊁E ms 1分别为干流和大通江多年平均季径流侵蚀功率,m 4/(km 2㊃s);A 为流域控制面积,103km 2㊂由图8和9可知,渠江干流和支流大通江存在较显著的空间尺度效应,其多年平均径流侵蚀功率与流域控制面积之间均呈幂指数关系,且干流相关关系优于支流大通江,全年相关系数与第3季度接近㊂随着流域控制面积的增大,多年平均径流侵蚀功率逐渐减小并趋于平缓,减小速率由大变小,说明存在空间阈值㊂为确定阈值,对式(4)~(7)求导,导数方程见式(8)~(11)㊂E′my =-0.0120A -1.158;(8)E′ms =-0.0060A-1.137;(9)E′my 1=-0.0118A -1.153;(10)E′ms 1=-0.0084A-1.165㊂(11)经计算可知,渠江干流在全年和第3季度的空间阈值分别为8549.4和4834.9km 2,大通江在全年和第3季度的空间阈值分别为8504.4和6223.5km 2㊂即当流域控制面积小于空间阈值时,|E |≥0.001,多年平均径流侵蚀功率随流域控制面积增加而迅速减小,反之则变化平缓,并逐渐减小至某一稳定值㊂其中干流的全年和第3季度径流侵蚀功率稳定值分别为0.04和0.02m 4/(km 2㊃s),大通江的全年和第3季度径流侵蚀功率稳定值分别为0.056和0.035m 4/(km 2㊃s)㊂3.4 径流侵蚀功率影响因素为探究渠江流域径流侵蚀功率时空分布及空间尺度效应的主要驱动因素,选用SPSS (statistical product and service solutions)软件对多年平均的年径流侵蚀功率进行聚类分析㊂本文共选取地形(75°以上坡度面积比例)㊁流域形态(圆度)㊁气象(各子流域上的多年平均降水量)㊁侵蚀动力(多年平均径流侵蚀功率)㊁土地利用(林草地面积比例)和土壤(易受侵蚀土壤面积比例)6类聚类因子,经分析将渠江77个子流域划分为3种聚类类型,其空间分布见图10㊂可知,第1聚类与第2聚类主要分布于上游地区,其面积所例分别为26.0%和19.3%,多年平均径流侵蚀功率分别为0.05892中国水土保持科学2024年 4个季度的季径流侵蚀功率量级不同,值越大侵蚀越严重,其总体范围为0.00001≤E s≤0.08000㊂下同㊂Magnitude of seasonal runoff erosion power varies among four periods,with larger values indicating more severe erosion.The over⁃all range is0.00001≤E s≤0.08000.The same below.图5 渠江流域多年平均季径流侵蚀功率空间分布图Fig.5 Spatial distribution of multi⁃year average runoff erosion power at season scale in Qujiang River Basin 和0.052m4/(km2㊃s),均大于多年平均径流侵蚀功率中值0.049m4/(km2㊃s),该地区径流侵蚀能量较大,受侵蚀程度较剧烈㊂第3聚类是渠江流域的主导聚类,主要分布在中下游地区,其面积比例为54.7%,流域内多年平均径流侵蚀功率为0.046m4/(km2㊃s),小于多年平均径流侵蚀功率中值,该地区植被类型多样,下垫面条件较好,受侵蚀程度较小㊂03 第2期黄幸等:基于SWAT模型的渠江流域径流侵蚀功率时空规律分析图6 渠江流域多年平均年径流侵蚀功率空间分布图Fig.6 Spatial distribution of multi⁃year average runoff erosionpower at year scale in Qujiang River Basin 统计侵蚀动力因子与其余聚类因子的斯皮尔曼相关系数见表1,结果表明气象因子㊁地形因子和流域形态因子为渠江流域径流侵蚀功率排名前3的主图7 渠江各子流域出口断面及以上控制面积的多年平均径流侵蚀功率空间分布图Fig.7 Spatial distribution of multi⁃year average runoff erosion power for control area at and abovethe outlet cross⁃section of each Qujiang River subbasin要影响因子㊂且在显著水平为0.05时,第1聚类中的气象因子与径流侵蚀功率呈显著相关,说明降雨的空间分布不均性对该地区径流侵蚀能量影响较大;第2聚类中气象因子㊁地形因子和流域形态因子与径流侵蚀功率呈显著相关,说明该地区75°以上坡度面积比例很大,流域内地势陡峭,降雨空间分布差异较显著,流域形态偏圆形,产汇流过程较快,能显著影响径流侵蚀功率的空间分布和规律;第3聚类中流域形态因子与气象因子与径流侵蚀功率呈一般相关,其对该聚类地区径流侵蚀功率的影响远不如第2聚类地区,说明该地区整体地势较平缓,各子流域多年平均降雨量差距不大,流域形态较狭长,产汇流过程相对较慢㊂4 结论1)所构建的SWAT 模型径流模拟精度较高,在渠江流域适用性好㊂巴中㊁七里沱㊁罗渡溪水文站率定期R 2㊁NS 系数均在0.92及以上,PBIAS 系数均<16.20%;验证期R 2㊁NS 系数均在0.69及以上,PBIAS 系数均在16.72%以下㊂这说明该模型能较真实地反映渠江流域水文情势㊂2)渠江流域多年平均年径流侵蚀功率总体上大于季径流侵蚀功率,其中第3季度>第2季度>第4季度>第1季度㊂流域全年和第3季度的多年平均径流侵蚀功率空间分布均呈现出 北部大㊁南部小;西部大㊁东部小;上游大㊁下游小”的特征;第4季度的空间分布在东西部呈现出 东部大㊁西部小”的特征,其余部分与全年相似;第1㊁第2季度的空间分布与全年分布规律相反㊂ 3)渠江干流及其支流大通江的径流侵蚀功率具有较为显著的空间尺度效应,全年和第3季度的多年平均径流侵蚀功率与流域控制面积之间呈13中国水土保持科学2024年图8 渠江干流多年平均年和第3季度径流侵蚀功率与流域控制面积关系图Fig.8 Fitting results of multi⁃year average runoff erosionpower and watershed control area at year and seasonscale(season Ⅲ)in the main stream of Qujiang River图9 渠江支流大通江多年平均年和第3季度径流侵蚀功率与流域控制面积关系图Fig.9 Fitting results of multi⁃year average runoff erosionpower and watershed control area at year and seasonscale(season Ⅲ)in Datong River图10 渠江流域聚类空间分布图Fig.10 Clustering spatial distribution of Qujiang River Basin幂指数均关系㊂当流域控制面积分别>8549.4和4834.9km 2时,干流全年和第3季度的多年平均径流侵蚀功率随着面积增加变化幅度极小,并逐渐稳定于0.04和0.02m 4/(km 2㊃s);当流域控制面积分别大于8504.4和6223.5km 2时,大通江全年和第3季度的多年平均径流侵蚀功率随着面积增加变化幅度极小,并逐渐稳定于0.056和0.035m 4/(km 2㊃s)㊂表1 斯皮尔曼相关系数计算结果表Tab.1 Spearman correlation coefficient calculated results table聚类名Cluster name地形因子Topographical factor流域形态因子Watershed morphology气象因子Meteorology 土地利用因子Land use 土壤因子Soil第1聚类Cluster Ⅰ-0.451-0.4840.621*-0.280-0.022第2聚类Cluster Ⅱ0.636*0.622*0.678*0.441-0.336第3聚类Cluster Ⅲ0.0680.349*0.336*-0.2610.072 注:*表示在0.05水平上相关性显著㊂Notes:*indicates significant correlation at the 0.05level. 4)气象因子㊁地形因子和流域形态因子对渠江流域径流侵蚀功率的分布有主要影响作用㊂流域上游区因地势陡峭㊁降水分布不均㊁形态易于产汇流而表现出较大的径流侵蚀功率;下游地区因地势平坦,产汇流过程缓慢受侵蚀情况较轻㊂5 参考文献[1] 万彩兵,程冬兵,李昊.水土保持法修订实施十年来长江流域水土流失治理成效[J].中国水土保持,2021(6):1.WAN Caibing,CHENG Dongbing,LI Hao.Effect of soil and water loss control in the Yangtze River Basin since the revision and implementation of soil and water conser⁃vation law for ten years [J].Soil and Water Conservation in China,2021(6):1.[2] 史志华,刘前进,张含玉,等.近十年土壤侵蚀与水土保持研究进展与展望[J ].土壤学报,2020,57(5):1117.SHI Zhihua,LIU Qianjin,ZHANG Hanyu,et al.Study on soil erosion and conservation in the past 10years:Pro⁃23 第2期黄幸等:基于SWAT模型的渠江流域径流侵蚀功率时空规律分析gress and prospects[J].Acta Pedologica Sinica,2020,57(5):1117.[3] 许功伟,徐立荣,张云苹,等.1970 2019年大汶河流域降雨侵蚀力时空变化分析[J].水土保持研究,2022,29(6):45.XU Gongwei,XU Lirong,ZHANG Yunping,et al.Spati⁃otemporal variation of rainfall erosivity in the Dawen RiverBasin during1970-2019[J].Research of Soil and Wa⁃ter Conservation,2022,29(6):45.[4] WISCHMEIER W H,SMITH D D.Predicting rainfallerosion losses:A guide to conservation planning[M].Washington:Department of Agriculture,1978:26.[5] 徐晶,时延锋,徐征和,等.1961 2020年沂蒙山区降雨侵蚀力时空变化特征[J].水土保持研究,2022,29(6):36.XU Jing,SHI Yanfeng,XU Zhenghe,et al.Spatiotem⁃poral variation characteristics of rainfall erosivity in theYimeng Mountain area from1961to2020[J].Researchof Soil and Water Conservation,2022,29(6):36. [6] TU Anguo,ZENG Jianling,LIU Zhao,et al.Effect ofminimum inter⁃event time for rainfall event separationon rainfall properties and rainfall erosivity in a humidarea of southern China[J].Geoderma,2023,431:116332.[7] 鲁克新.黄土高原流域生态环境修复中的水沙响应模拟研究[D].西安:西安理工大学,2006:18.LU Kexin.Study on runoff⁃sediment response simulationin watershed eco⁃environmental rehabilitation on loessplateau[D].Xi′an:Xi′an University of Technology,2006:18.[8] 张译心,徐国策,李占斌,等.不同时间尺度下流域径流侵蚀功率输沙模型模拟精度[J].水土保持研究,2020,27(3):1.ZHANG Yixin,XU Guoce,LI Zhanbin,et al.Simula⁃tion accuracy of runoff erosion power⁃sediment transfermodel at different time scales[J].Research of Soil andWater Conservation,2020,27(3):1.[9] 杨光,鲁克新,李鹏,等.基于SWAT模型的清水河流域年径流侵蚀功率空间分布[J].水土保持研究,2022,29(6):90.YANG Guang,LU Kexin,LI Peng,et al.Spatial distri⁃bution of annual runoff erosion power in Qingshui RiverBasin based on SWAT model[J].Research of Soil andWater Conservation,2022,29(6):90. [10]CHANG Enhao,LI Peng,LI Zhanbin,et al.The impactof vegetation successional status on slope runoff erosion inthe Loess Plateau of China[J].Water,2019,11(12):2614.[11]HUSSAINZADA W,LEE H S.Effect of an improved ag⁃ricultural irrigation scheme with a hydraulic structure forcrop cultivation in arid northern Afghanistan using the Soiland Water Assessment Tool(SWAT)[J].Scientific Re⁃ports,2022,12(1):5186.[12]倪鹏,包为民,张乾,等.基于主成分分析的系统聚类分析方法在洪水预报中的应用[J].三峡大学学报(自然科学版),2018,40(1):1.NI Peng,BAO Weimin,ZHANG Qian,et al.Applica⁃tion of hierarchical cluster analysis to flood forecastingbased on principal component analysis[J].Journal ofChina Three Gorges University(Natural Sciences),2018,40(1):1.[13]张钰荃,高成,陈旭东,等.西江上游流域年径流系数变化规律及其影响因素分析[J].水电能源科学,2021,39(5):37.ZHANG Yuquan,GAO Cheng,CHEN Xudong,et al.Variation of runoff coefficient and its influencing factors inupper reaches of Xijiang River Basin[J].Water Re⁃sources and Power,2021,39(5):37.33。
PLEASE SCROLL DOWN FOR ARTICLEThis article was downloaded by: [CDL Journals Account]On: 12 December 2008Access details: Access Details: [subscription number 785022370]Publisher Taylor & FrancisInforma Ltd Registered in England and Wales Registered Number: 1072954 Registered office: Mortimer House,37-41 Mortimer Street, London W1T 3JH, UK
International Journal of Remote SensingPublication details, including instructions for authors and subscription information:http://www.informaworld.com/smpp/title~content=t713722504
Modelling spatial-temporal change of Poyang Lake using multitemporal LandsatimageryFengming Hui abc; Bing Xu bd; Huabing Huang bc; Qian Yu e; Peng Gong bcf
a International Institute for Earth System Science, Nanjing University, Nanjing 210093, China b State KeyLaboratory of Remote Sensing Science, jointly sponsored by the Institute of Remote Sensing Applications ofChinese Academy of Sciences and Beijing Normal University, Beijing 100101, China c Department ofGeography, University of Utah, Salt Lake City, Utah 84112-9155 d Poyang Lake Ecological Research Stationfor Environment and Health, Duchang 332600, China e Department of Geosciences, University ofMassachusetts, Amherst, Massachusetts 01003-9297 f Division of Ecosystem Science, University ofCalifornia, Berkeley, California 94720-3114
First Published:October2008
To cite this Article Hui, Fengming, Xu, Bing, Huang, Huabing, Yu, Qian and Gong, Peng(2008)'Modelling spatial-temporal change ofPoyang Lake using multitemporal Landsat imagery',International Journal of Remote Sensing,29:20,5767 — 5784
To link to this Article: DOI: 10.1080/01431160802060912URL: http://dx.doi.org/10.1080/01431160802060912
Full terms and conditions of use: http://www.informaworld.com/terms-and-conditions-of-access.pdfThis article may be used for research, teaching and private study purposes. Any substantial orsystematic reproduction, re-distribution, re-selling, loan or sub-licensing, systematic supply ordistribution in any form to anyone is expressly forbidden.
The publisher does not give any warranty express or implied or make any representation that the contentswill be complete or accurate or up to date. The accuracy of any instructions, formulae and drug dosesshould be independently verified with primary sources. The publisher shall not be liable for any loss,actions, claims, proceedings, demand or costs or damages whatsoever or howsoever caused arising directlyor indirectly in connection with or arising out of the use of this material.Modellingspatial-temporalchangeofPoyangLakeusingmultitemporalLandsatimagery
FENGMINGHUI{{",BINGXU{§,HUABINGHUANG{",QIANYU#andPENGGONG*{"||
{InternationalInstituteforEarthSystemScience,NanjingUniversity,Nanjing210093,China{StateKeyLaboratoryofRemoteSensingScience,jointlysponsoredbytheInstituteofRemoteSensingApplicationsofChineseAcademyofSciencesandBeijingNormalUniversity,Beijing100101,China"PoyangLakeEcologicalResearchStationforEnvironmentandHealth,Duchang332600,China§DepartmentofGeography,UniversityofUtah,SaltLakeCity,Utah84112–9155,USA#DepartmentofGeosciences,UniversityofMassachusetts,Amherst,
Massachusetts01003–9297,USA||DivisionofEcosystemScience,UniversityofCalifornia,Berkeley,California94720-3114,USA
(Received19December2006;infinalform5August2007)PoyangLakeisaseasonallake,exchangingwaterwiththelowerbranchoftheYangtzeRiver.Duringthespringandsummerfloodingseasonitinundatesalargeareawhileinthewinteritshrinksconsiderably,creatingalargetractofmarshlandforwildmigratorybirds.Abetterknowledgeofthewatercoveragedurationandthebeginningandendingdatesforthevastrangeofmarshlandssurroundingthelakeisimportantforthemeasurement,modellingandmanagementofmarshlandecosystems.Inaddition,theabundanceofaspecialtypeofsnail(Oncomelaniahupensis),theintermediatehostofparasiteschistosome(Schistosomajaponicum)inthisregion,isalsoheavilydependentonthewatercoverageinformation.However,thereisnoaccuratedigitalelevationmodel(DEM)forthelakebottomandtheinundatedmarshland,noristheresufficientwaterlevelinformationoverthisarea.Inthisstudy,weassessthefeasibilityoftheuseofmultitemporalLandsatimagesformappingthespatial-temporalchangeofPoyangLakewaterbodyandthetemporalprocessofwaterinundationofmarshlands.Eightcloud-freeLandsatThematicMapperimagestakenduringaperiodofoneyearwereusedinthisstudy.Weusedthenormalizeddifferencewaterindex(NDWI)andthemodifiednormalizeddifferencewaterindex(MNDWI)methodstomapwaterbodies.Wethenexaminedtheannualspatial-temporalchangeofthePoyangLakewaterbody.FinallyweattemptedtoobtainthedurationofwaterinundationofmarshlandsbasedonthetemporalsequenceofwaterextentdeterminedfromtheLandsatimages.Theresultsshowedthatalthoughtheimagescanbeusedtocapturethesnapshotsofwatercoverageinthisarea,theyareinsufficienttoprovideaccurateestimationofthespatial-temporalprocessofwaterinundationoverthemarshlandsthroughlinearinterpolation.