Annual sulfur deposition through fog, wet and dry deposition in the Kinki Region of Japan
- 格式:pdf
- 大小:2.40 MB
- 文档页数:10
J. Adhes.Journal of AdhesionJ. Adhes. Sci. Technol.Journal of Adhesion Science and TechnologyJ. Adv. Mater.Journal of Advanced MaterialsJ. Aerosol SciJournal of Aerosol ScienceJ. Agric. Food. Chem.Journal of Agricultural and Food ChemistryJ. Air Waste Manage. Assoc.Journal of the Air and Waste Management AssociationJ. Alloys Compd.Journal of Alloys and CompoundsJ. Am. Ceram. Soc.Journal of the American Ceramic SocietyJ. Am. Chem. Soc.Journal of the American Chemical SocietyJ. Am. Oil Chem. Soc.Journal of the American Oil Chemists SocietyJ. Am. Soc. Brew. Chem.Journal of the American Society of Brewing ChemistsJ. Am. Soc. Mass. Spectrom.Journal of the American Society for Mass SpectrometryJ. Amer. Chem. Soc.Journal of the American Chemical SocietyJ. Anal. Appl. PyrolysisJournal of Analytical and Applied PyrolysisJ. Anal. At. Spectrom.Journal of Analytical Atomic SpectrometryJ. Anal. Chem.Journal of Analytical ChemistryJ. Anal. Toxicol.Journal of Analytical ToxicologyJ. Antibiot.Journal of AntibioticsJ. Antimicrob. Chemother.Journal of Antimicrobial ChemotherapyJ. AOAC Int.Journal of AOAC InternationalJ. Appl. Bacteriol.Journal of Applied BacteriologyJ. Appl. Biomater.Journal of Applied BiomaterialsJ. Appl. Crystallogr.Journal of Applied CrystallographyJ. Appl. Electrochem.Journal of Applied ElectrochemistryJ. Appl. Phycol.Journal of Applied PhycologyJ. Appl. Phys.Journal of Applied PhysicsJ. Appl. Polym. Sci.Journal of Applied Polymer ScienceJ. Appl. Spectrosc.Journal of Applied SpectroscopyJ. Appl. Toxicol.Journal of Applied ToxicologyJ. Asian Nat. Prod. Res.Journal of Asian Natural Products ResearchJ. Autom. Chem.Journal of Automatic ChemistryJ. Autom. Methods Manage. Chem.Journal of Automated Methods & Management in ChemistryJ. Bacteriol.Journal of BacteriologyJ. Bioact. Compat. Polym.Journal of Bioactive and Bompatible PolymersJ. Biochem.Journal of BiochemistryJ. Biochem. Bioph. MethodsJournal of Biochemical and Biophysical MethodsJ. Biol. Chem.Journal of Biological ChemistryJ. Biol. Inorg. Chem.Journal of Biological Inorganic ChemistryJ. Biolumin. Chemilumin.Journal of Bioluminescence and ChemiluminescenceJ. Biomater. Appl.Journal of Biomaterials ApplicationsJ. Biomater. Sci., Polym. Ed.Journal of Biomaterials Science Polymer EditionJ. Biomed. Mater. Res.Journal of Biomedial Materials ResearchJ. Biomol. NMRJournal of Biomolecular NMRJ. Biomol. Struct. Dyn.Journal of Biomolecular Structure and DynamicsJ. Biotechnol.Journal of BiotechnologyJ. Can. Pet. Technol.Journal of Canadian Petroleum TechnologyJ. Carbohydr. Chem.Journal of Carbohydrate ChemistryJ. Cardiovasc. Pharmacol.Journal of Cardiovascular PharmacologyJ. Catal.Journal of CatalysisJ. Cell. Biochem.Journal of Cellular BiochemistryJ. Cell Biol.Journal of Cell BiologyJ. Cell. Physiol.Journal of Cellular PhysiologyJ. Cell Sci.Journal of Cell ScienceJ. Ceram. Soc. Jpn.Journal of the Ceramic Society of JapanJ. Chem. Crystallogr.Journal of Chemical CrystallographyJ. Chem. Ecol.Journal of Chemical EcologyJ. Chem. Educ.Journal of Chemical EducationJ. Chem. Eng. DataJournal of Chemical and Engineering DataJ. Chem. Eng. Jpn.Journal of Chemical Engineering of JapanJ. Chem. Inf. Comput. Sci.Journal of Chemical Information and Computer ScienceJ. Chem. Neuroanat.Journal of Chemical NeuroanatomyJ. Chem. Phys.Journal of Chemical PhysicsJ. Chem. Res., Synop .Journal of Chemical Research SynopsisJ. Chem. Soc.Journal of the Chemical SocietyJ. Chem. Soc. Pak.Journal of the Chemical Society of PakistanJ. Chem. Soc., Chem. Commun.Journal of the Chemical Society, Chemical CommunicationsJ. Chem. Soc., Dalton Trans.Journal of the Chemical Society, Dalton TransactionsJ. Chem. Soc., Faraday Trans.Journal of the Chemical Society, Faraday TransactionsJ. Chem. Soc., Perkin Trans. 1Journal of the Chemical Society, Perkin Transactions 1J. Chem. Soc., Perkin Trans. 2Journal of the Chemical Society, Perkin Transactions 2J. Chem. Technol. Biotechnol.Journal of Chemical Technology and BiotechnologyJ. Chem. Thermodyn.Journal of Chemical ThermodynamicsJ. Chemom.Journal of ChemometricsJ. Chim. Phys. Phys.- Chim. Biol.Journal de Chimie Physique et de Physico-Chimie BiologiqueJ. Chin. Chem. Soc.Journal of the Chinese Chemical SocietyJ. Chin. Inst. Chem. Eng,Journal of the Chinese Institute of Chemical EngineersJ. Chromatogr.Journal of ChromatographyJ. Chromatogr. AJournal of Chromatography AJ. Chromatogr. BJournal of Chromatography BJ. Chromatogr. Sci.Journal of Chromatographic ScienceJ. Clin. Endocrinol. Metab.Journal of Clinical Endocrinology and MetabolismJ. Clin. Microbiol.Journal of Clinical MicrobiologyJ. Cluster Sci.Journal of Cluster ScienceJ. Coat. Technol.Journal of Coatings TechnologyJ. Colloid Interface Sci.Journal of Colloid and Interface ScienceJ. Comb. Chem.Journal of Combinatorial ChemistryJ. Compos. Mater.Journal of Composite MaterialsJ. Compos. Tech. Res.Journal of Composites Technology and ResearchJ. Comput. Aided Mater. Des.Journal of Computer-Aided Materials DesignJ. Comput. Aided Mol. Des.Journal of Computer-Aided Molecular DesignJ. Comput. Chem.Journal of Computational ChemistryJ. Contam. Hydrol.Journal of Contaminant HydrologyJ. Controlled ReleaseJournal of Controlled ReleaseJ. Coord. Chem.Journal of Coordination ChemistryJ. Cryst. GrowthJournal of Crystal GrowthJ. Dairy Sci.Journal of Dairy ScienceJ. Dispersion Sci. Technol.Journal of Dispersion Science and TechnologyJ. Elastomers Plast.Journal of Elastomers and PlasticsJ. Electroanal. Chem.Journal of Electroanalytical ChemistryJ. Electroceram.Journal of ElectroceramicsJ. Electrochem. Soc.Journal of the Electrochemical SocietyJ. Electron. Mater.Journal of Electronic MaterialsJ. Electron Microsc.Journal of Electron MicroscopyJ. Electron. Spectrosc. Relat. Phenom.Journal of Electron Spectroscopy and Related PhenomenaJ. Endocrinol.Journal of EndocrinologyJ. Endotoxin Res.Journal of Endotoxin ResearchJ. Eng. Mater. Technol.Journal of Engineering Materials and TechnologyJ. Environ. Biol.Journal of Environment biologyJ. Environ. Eng.Journal of Environment EngineeringJ. Environ. HealthJournal of Environment HealthJ. Environ. Manage.Journal of Environment ManagementJ. Environ. Monit.Journal of Environmental MonitoringJ. Environ. Qual.Journal of Environment QualityJ. Environ. Radioact.Journal of Environment RadioactivityJ. Environ. Sci. Health., Part AJournal of Environment Science and Health, Part A Environmental ScienceJ. Environ. Sci. Health., Part BJournal of Environment Science and Health, Part B PesticidesJ. Enzym Inhib.Journal of Enzyme InhibitionJ. Essent. Oil Res.Journal of Essential Oil ResearchJ. Ethnopharmacol.Journal of EthnopharmacologyJ. Eur. Ceram. Soc.Journal of the European Ceramic SocietyJ. Exp. Biol.Journal of Experimental BiologyJ. Exp. Bot.Journal of Experimental BotanyJ. Exposure Anal. Environ. Epidemiol.Journal of Exposure Analysis and Environment EpidemiologyJ. Ferment. Bioeng.Journal of Fermentation and BioengineeringJ. Fire Sci.Journal of Fire SciencesJ. Fluid Mech.Journal of Fluid MechanicsJ. Fluids Eng.Journal of Fluids EngineeringJ. Fluorine Chem.Journal of Fluorine ChemistryJ. Food Biochem.Journal of Food BiochemistryJ. Food Eng.Journal of Food EngineeringJ. Food LipidsJournal of Food LipidsJ. Food Prot.Journal of Food ProtectionJ. Food Sci.Journal of Food ScienceJ. Gen. Appl. Microbiol.Journal of General and Applied MicrobiologyJ. Gen. Microbiol.Journal of General MicrobiologyJ. Hazard. Mater.Journal of Hazardous materialsJ. Heat TransferJournal of Heat TransferJ. Heterocycl. Chem.Journal of Heterocyclic ChemistryJ. High. Resolut. Chromatogr.Journal of High Resolution Chromatography J. Histochem. Cytochem.Journal of Histochemistry and CytochemistryJ. Hypertens.Journal of HypertensionJ. Imaging Sci. Technol.Journal of Imaging Science and TechnologyJ. Inclusion Phenom. Mol. Recognit. Chem.Journal of Inclusion Phenomena and Molecular Recognition in ChemistryJ. Ind. Microbiol.Journal of Industrial MicrobiologyJ. Indian Chem. Soc.Journal of the Indian Chemical SocietyJ. Ind. Microbiol. Biotechnol.Journal of Industrial Microbiology and BiotechnologyJ. Inorg. Biochem.Journal of Inorganic BiochemistryJ. Inorg. Nucl. Chem.Journal of Inorganic and Nuclear ChemistryJ. Inorg. Organomet. Polym.Journal of Inorganic and Organometallic PolymersJ. Inst. Chem.Journal of Institute of Chemists (India)J. Inst. Environ. Sci.Journal of the Institute of Environment SciencesJ. Inst. Water Environ. Manage.Journal of the Institution of Water and Environment ManagementJ. Intell. Mater. Syst. Struct.Journal of Intelligent Material Systems and StructuresJ. Interferon Cytokine Res.Journal of Interferon and Cytokine ResearchJ. Interferon Res.Journal of Interferon ResearchJ. Jpn. Inst. Met.Journal of the Japan Institute of MetalsJ. Korean Chem. Soc.Journal of the Korean Chemical SocietyJ. Labelled Compd. Radiopharm.Journal of Labelled Compounds and RadiopharmaceuticalsJ. Lipid MediatorsJournal of Lipid MediatorsJ. Lipid Mediators Cell SignallingJournal of Lipid Mediators and Cell SignallingJ. Lipid Res.Journal of Lipid ResearchJ. Liq. Chromatogr.Journal of Liquid ChromatographyJ. Liq. Chromatogr. Related Technol.Journal of Liquid Chromatography and Related TechnologiesJ. Low Temp. Phys.Journal of Low Temperature PhysicsJ. Lumin.Journal of LuminescenceJ. Macromol. Sci., Phys.Journal of Macromolecular Science - PhysicsJ. Macromol. Sci., Polym. Rev.Journal of Macromolecular Science Polymer ReviewsJ. Macromol. Sci., Pure Appl. Chem.Journal of Macromolecular Science Pure and Applied ChemistryJ. Macromol. Sci., Rev. Macromol. Chem. Phys.Journal of Macromolecular Science - Reviews in Macromolecular Chemistry and PhysicsJ. Magn. Magn. Mater.Journal of Magnetism and Magnetic MaterialsJ. Magn. Reson., Ser AJournal of Magnetic Resonance Series AJ. Magn. Reson., Ser BJournal of Magnetic Resonance Series BJ. Mass Spectrom.Journal of Mass SpectrometryJ. Mater. Chem.Journal of Materials ChemistryJ. Mater. Civ. Eng.Journal of Materials in Civil EngineeringJ. Mater. Cycles Waste Manage.Journal of Material Cycles and Waste ManagementJ. Mater. Eng. Perform.Journal of Materials Engineering and PerformanceJ. Mater. Process. Manuf. Sci.Journal of Materials Processing and Manufacturing ScienceJ. Mater. Process. Technol.Journal of Materials Processing TechnologyJ. Mater. Res.Journal of Materials ResearchJ. Mater. Sci. Lett.Journal of Materials Science LettersJ. Mater. Sci. - Mater. Electron.Journal of Materials Science - Materials in ElectronicsJ. Mater. Sci. - Mater. Med.Journal of Materials Science Materials in MedicineJ. Mater. Sci. Technol.Journal of Materials Science and TechnologyJ. Mater. Synth. Process.Journal of Materials Synthesis and ProcessingJ. Math. Chem.Journal of Mathematical ChemistryJ. Med. Chem.Journal of Medicinal ChemistryJ. Membr. Biol.Journal of Membrane BiologyJ. Membr. Sci.Journal of Membrance ScienceJ. Microbiol. Biotechnol.Journal of Microbiology and BiotechnologyJ. Microbiol. MethodsJournal of Microbiological MethodsJ. Microcolumn Sep.Journal of Microcolumn SeparationsJ. Microelectromech. Syst.Journal of Microelectronic SystemsJ. MicroencapsulationJournal of MicroencapsulationJ. Mol. Biol.Journal of Molecular BiologyJ. Mol. Catal.Journal of Molecular CatalysisJ. Mol. Catal. A: Chem.Journal of Molecular Catalysis A: ChemicalJ. Mol. Catal. B: Enzym.Journal of Molecular Catalysis B: EnzymaticJ. Mol. Graphics Modell.Journal of Molecular Graphics and ModellingJ. Mol. Liq.Journal of Molecular LiquidsJ. Mol. Microbiol. Biotechnol.Journal of Molecular Microbiology and BiotechnologyJ. Mol. Model.Journal of Molecular ModelingJ. Mol. Spectrosc.Journal of Molecular SpectroscopyJ. Mol. Struct.Journal of Molecular StructureJ. Nanopart. Res.Journal of Nanoparticle ResearchJ. Nat. Prod.Journal of Natural ProductsJ. Near Infrared Spectrosc.Journal of Near Infrared SpectroscopyJ. Neurochem.Journal of NeurochemistryJ. Neurosci.Journal of NeuroscienceJ. Neurosci. Res.Journal of Neuroscience ResearchJ. New Mater. Electrochem. Syst.Journal of New Materials for Electrochemical SystemsJ. Non-Cryst. SolidsJournal of Non-Crystalline SolidsJ. Non-Equilib. Thermodyn.Journal of Non-Equilibrium ThermodynamicsJ. Nucl. Mater.Journal of Nuclear MaterialsJ. Nucl. Sci. Technol.Journal of Nuclear Science and TechnologyJ. Opt. Soc. Am. B: Opt. Phys.Journal of the Optical Society of America B: Optical PhysicsJ. Org. Chem.Journal of Organic ChemistryJ. Organomet. Chem.Journal of Organometallic ChemistryJ. Pet. Sci. Technol.Journal of Petroleum Science and TechnologyJ. Pharm. Biomed. Anal.Journal of Pharmaceutical and Biomedical AnalysisJ. Pharm. Pharmacol.Journal of Pharmacy and PharmacologyJ. Pharm. Sci.Journal of Pharmaceutical SciencesJ. Pharmacol. Exp. Ther.Journal of Pharmacology and Experimental TherapeuticsJ. Pharmacol. Toxicol. MethodsJournal of Pharmacological and Toxicological MethodsJ. Phase Equilib.Journal of Phase EquilibriumJ. Photochem. Photobiol., AJournal of Photochemistry and Photobiology AJ. Photochem. Photobiol., BJournal of Photochemistry and Photobiology BJ. Photopolym. Sci. Technol.Journal of Photopolymer Science and TechnologyJ. Phys. A: Math. Gen.Journal of Physics A: Mathematical and GeneralJ. Phys. B: At., Mol. Opt. Phys.Journal of Physics B: Atomic Molecular and Optical PhysicsJ. Phys. Chem.Journal of Physical ChemistryJ. Phys. Chem. AJournal of Physical Chemistry AJ. Phys. Chem. BJournal of Physical Chemistry BJ. Phys. Chem. Ref. DataJournal of Physical and Chemical Reference DataJ. Phys. Chem. SolidsJournal of Physics and Chemistry of SolidsJ. Phys. D: Appl. Phys.Journal of Physics D: Applied PhysicsJ. Phys. G: Nucl. Part. Phys.Journal of Physics G: Nuclear and Particle PhysicsJ. Phys. IJournal de Physique IJ. Phys. IIJournal de Physique IIJ. Phys. IIIJournal de Physique IIIJ. Phys. IVJournal de Physique IVJ. Phys. Org. Chem.Journal of Physical Organic ChemistryJ. Phys. Soc. Jpn.Journal of the Physical Society of JapanJ. Phys.: Condens. MatterJournal of Physics: Condensed MatterJ. Planar. Chromatogr. - Mod. TLCJournal of Planar Chromatography - Modern TLCJ. Plant Biochem. Biotechnol.Journal of Plant Biochemistry and BiotechnologyJ. Polym. Eng.Journal of Polymer EngineeringJ. Polym. Environ.Journal of Polymers and the EnvironmentJ. Polym. Mater.Journal of Polymer MaterialsJ. Polym. Sci., Part A: Polym. Chem.Journal of Polymer Science Part A: Polymer ChemistryJ. Polym. Sci., Part B: Polym. Phys.Journal of Polymer Science Part B: Polymer PhysicsJ. Porous Mater.Journal of Porous MaterialsJ. Porphyrins PhthalocyaninesJournal of Porphyrins and PhthalocyaninesJ. Power SourcesJournal of Power SourcesJ. Prakt. Chem. /Chem-ZtgJournal fur Praktische Chemie - Chemiker ZeitungJ. Propul. PowerJournal of Propulsion and PowerJ. Protein Chem.Journal of Protein ChemistryJ. Pulp Pap. Sci.Journal of Pulp and Paper ScienceJ. Quant. Spectrosc. Radiat. TransferJournal of Quantitative Spectroscopy and Radiative TransferJ. Radioanal. Nucl. Chem.Journal of Radioanalytical and Nuclear ChemistryJ. Radioanal. Nucl. Chem. Art.Journal of Radioanalytical and Nuclear Chemistry ArticlesJ. Radioanal. Nucl. Chem. Lett.Journal of Radioanalytical and Nuclear Chemistry LettersJ. Raman Spectrosc.Journal of Raman SpecroscopyJ. Rapid Methods Autom. Microbiol.Journal of Rapid Methods and Automation in MicrobiologyJ. Reinf. Plast. Compos.Journal of Reinforced Plastics and CompositesJ. Rheol.Journal of RheologyJ. S. Afr. Inst. Min. Metall.Journal of the South African Institute of Mining and Metallurgy J. Sci. Food Agric.Journal of the Science of Food and AgricultureJ. Sci. Ind. Res.Journal of Scientific and Industrial ResearchJ. Serb. Chem. Soc.Journal of the Serbian Chemical SocietyJ. Sep. Sci.Journal of Separation ScienceJ. Sol-Gel Sci. Technol.Journal of Sol-Gel Science and TechnologyJ. Solid State Chem.Journal of Solid State ChemistryJ. Solid State Electrochem.Journal of Solid State ElectrochemistryJ. Solution Chem.Journal of Solution ChemistryJ. Steroid Biochem. Mol. Biol.Journal of Steroid Biochemistry and Molecular BiologyJ. Strain Anal. Eng. Des.Journal of Strain Analysis for Engineering DesignJ. Struct. Chem.Journal of Structural ChemistryJ. Supercrit. FluidsJournal of Supercritical FluidsJ. Synth. Org. Chem Jpn.Journal of Synthetic Organic Chemistry, JapanJ. Test. .Journal of Testing and uationJ. Therm. Anal.Journal of Thermal AnalysisJ. Therm. Anal. Calorim.Journal of Thermal Analysis and CalorimetryJ. Therm. Spray Technol.Journal of Thermal Spray TechnologyJ. Thermophys Heat TransferJournal of Thermophysics and Heat TransferJ. Thermoplast. Compos. Mater.Journal of Thermoplastic Composite MaterialsJ. Toxicol. Environ. HealthJournal of Toxicology and Environment HealthJ. Toxicol., Clin. Toxicol.Journal of Toxicology - Clinical ToxicologyJ. Toxicol., Cutaneous Ocul. Toxicol.Journal of Toxicology - Cutaneous and Ocular ToxicologyJ. Toxicol., Toxin Rev.Journal of Toxicology - Toxin ReviewsJ. Trace Elem. Exp. Med.Journal of Trace Elements in Experimental MedicineJ. Trace Elem. Med Biol.Journal of Trace Elements in Medicine and BiologyJ. Trace Microprobe Tech.Journal of Trace and Microprobe TechniquesJ. Vac. Sci. Technol., AJournal of Vacuum Science and Technology AJ. Vac. Sci. Technol., BJournal of Vacuum Science and Technology BJ. Wood Chem. Technol.Journal of Wood Chemistry and TechnologyJACSJournal of the American Chemical SocietyJOMJOM Journal of the Minerals Metals and Materials SocietyJPC J. Planar Chromatogr. - Mod. TLCJPC Journal of Planar Chromatography Modern TLCJpn. J. Appl. Phys., Part 1Japanese Journal of Applied Physics Part 1Jpn. J. Appl. Phys., Part 2Japanese Journal of Applied Physics Part 2Jpn. J. Cancer Res.Japanese Journal of Cancer ResearchJpn. J. Pharmacol.Japanese Journal of PharmacologyJpn. J. Toxicol. Environ. HealthJapanese Journal of toxicology and Environment healthJSME Int J., Ser. AJSME International Journal Series A: Mechanics and Material EngineeringJSME Int J., Ser. BJSME International Journal Series B: Fluids and Thermal EngineeringJSME Int J., Ser. CJSME International Journal Series C: Mechanical Systems Machine Elements and Manufacturing。
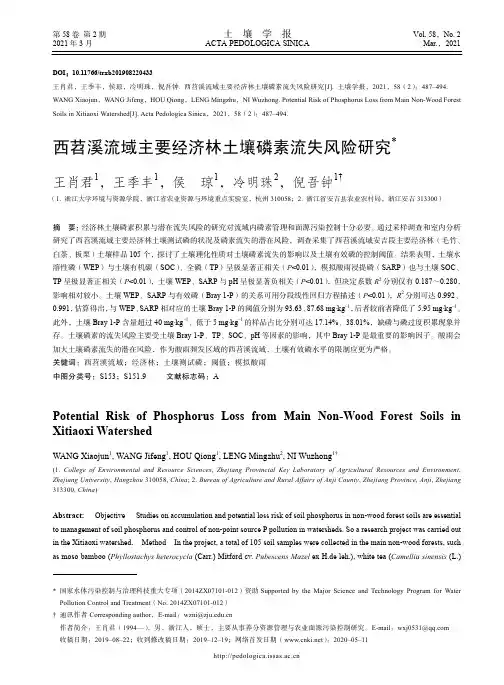
第58卷 第2期 土 壤 学 报 Vol. 58,No. 22021年3月ACTA PEDOLOGICA SINICA Mar.,2021* 国家水体污染控制与治理科技重大专项(2014ZX07101-012)资助Supported by the Major Science and Technology Program for Water Pollution Control and Treatment (No. 2014ZX07101-012) † 通讯作者Corresponding author ,E-mail :作者简介:王肖君(1994—),男,浙江人,硕士,主要从事养分资源管理与农业面源污染控制研究。
E-mail :收稿日期:2019–08–22;收到修改稿日期:2019–12–19;网络首发日期( ):2020–05–11DOI :10.11766/trxb201908220433王肖君,王季丰,侯琼,冷明珠,倪吾钟. 西苕溪流域主要经济林土壤磷素流失风险研究[J]. 土壤学报,2021,58(2):487–494. WANG Xiaojun ,WANG Jifeng ,HOU Qiong ,LENG Mingzhu ,NI Wuzhong. Potential Risk of Phosphorus Loss from Main Non-Wood Forest Soils in Xitiaoxi Watershed[J]. Acta Pedologica Sinica ,2021,58(2):487–494.西苕溪流域主要经济林土壤磷素流失风险研究*王肖君1,王季丰1,侯 琼1,冷明珠2,倪吾钟1†(1. 浙江大学环境与资源学院,浙江省农业资源与环境重点实验室,杭州310058;2. 浙江省安吉县农业农村局,浙江安吉313300)摘 要:经济林土壤磷素积累与潜在流失风险的研究对流域内磷素管理和面源污染控制十分必要。
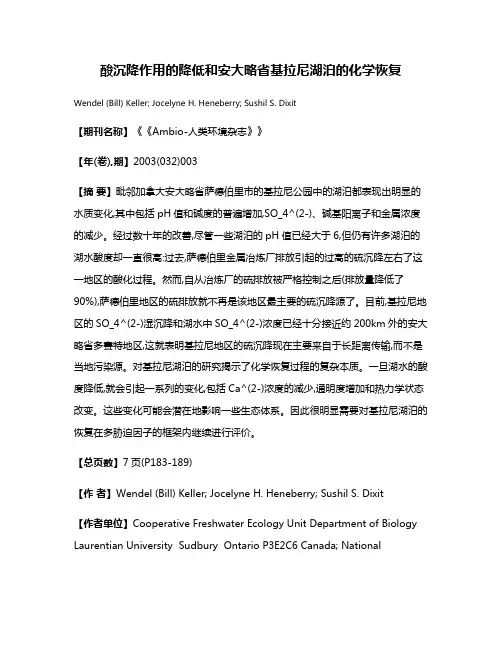
酸沉降作用的降低和安大略省基拉尼湖泊的化学恢复Wendel (Bill) Keller; Jocelyne H. Heneberry; Sushil S. Dixit【期刊名称】《《Ambio-人类环境杂志》》【年(卷),期】2003(032)003【摘要】毗邻加拿大安大略省萨德伯里市的基拉尼公园中的湖泊都表现出明显的水质变化,其中包括pH值和碱度的普遍增加,SO_4^(2-)、碱基阳离子和金属浓度的减少。
经过数十年的改善,尽管一些湖泊的pH值已经大于6,但仍有许多湖泊的湖水酸度却一直很高:过去,萨德伯里金属冶炼厂排放引起的过高的硫沉降左右了这一地区的酸化过程。
然而,自从冶炼厂的硫排放被严格控制之后(排放量降低了90%),萨德伯里地区的硫排放就不再是该地区最主要的硫沉降源了。
目前,基拉尼地区的SO_4^(2-)湿沉降和湖水中SO_4^(2-)浓度已经十分接近约200km外的安大略省多赛特地区,这就表明基拉尼地区的硫沉降现在主要来自于长距离传输,而不是当地污染源。
对基拉尼湖泊的研究揭示了化学恢复过程的复杂本质。
一旦湖水的酸度降低,就会引起一系列的变化,包括Ca^(2-)浓度的减少,通明度增加和热力学状态改变。
这些变化可能会潜在地影响一些生态体系。
因此很明显需要对基拉尼湖泊的恢复在多胁迫因子的框架内继续进行评价。
【总页数】7页(P183-189)【作者】Wendel (Bill) Keller; Jocelyne H. Heneberry; Sushil S. Dixit【作者单位】Cooperative Freshwater Ecology Unit Department of Biology Laurentian University Sudbury Ontario P3E2C6 Canada; NationalGuidelines&Standards Office Environment Canada Ottawa K1A0H3 Canada【正文语种】中文【中图分类】X52【相关文献】1.对加拿大东南部湖泊从酸沉降效应中恢复的评价 [J], Dean S. Jeffries; Russell Weeber; Thomas A. Clair; Suzanne Couture; Peter J. Dillon; Jacques Dupont; Wendel(Bill) Keller; Donald K. McNicol; Michael A. Turner; Robert Vet2.安大略基拉尼公园及实验湖泊区浮游生物群落对酸化的响应及其恢复过程 [J], David L. Findlay3.加拿大安大略省基拉尼湖酸化恢复的动态模拟[J], Thorjφrn Larssen; Christine Brereton; John M. Gunn4.1971~2000年间安大略省基拉尼公园里的甲壳类浮游动物群落从酸化水体中得到恢复:pH 6作为恢复的目标 [J], Catherine Holt;Norman D. Yan;李佩珍;李康民5.酸沉降区域碱性湖泊中汞的生物地球化学循环演化研究意义 [J], 阎海鱼;冯新斌;商立海;汤顺林因版权原因,仅展示原文概要,查看原文内容请购买。
藏东南森林穿透雨氮沉降通量变化特征及其影响因子刘智媛;周筠珺;李瀚;韩琳【期刊名称】《气象科技》【年(卷),期】2016(0)5【摘要】2012-2013年生长季在野外原位观测了青藏高原林芝地区森林穿透雨中不同形态氮湿沉降通量,并研究了氮沉降通量的变化特征及其影响因子.研究结果表明,2012、201 3年可溶性总氮(TN)累积沉降通量分别为8.82kg·hm-2·a-1和6.91kg·hm-2·a-1;其中,硝态氮(NO3-N)、铵态氮(NH4+-N)、可溶性总有机氮(DON)沉降通量分别占总氮的16.98%、53.39%和29.63%,NH4+-N对湿沉降通量的贡献率最大.不同形态氮沉降通量呈现明显的季节性变化特征,一般在夏季达到最大值.随着降水量及温度的升高,不同形态氮沉降通量均有增加趋势;其中,总无机氮(TIN)与月平均气温呈显著相关关系(p<0.05),TN、TIN均与月累积降水量呈极显著相关(p<0.01).月累计降水量和月平均气温可以共同解释森林穿透雨中TN沉降通量55.2%的变化.【总页数】8页(P834-840,853)【作者】刘智媛;周筠珺;李瀚;韩琳【作者单位】成都信息工程大学,成都610225;中国科学院大气物理研究所,北京100029;成都信息工程大学,成都610225;成都信息工程大学,成都610225;成都信息工程大学,成都610225【正文语种】中文【相关文献】1.鼎湖山典型森林土壤苯系物通量对模拟氮沉降的响应 [J], 郑丽丽;郭萍萍;易志刚2.离子树脂法测定森林穿透雨氮素湿沉降通量——以千烟洲人工针叶林为例 [J], 盛文萍;于贵瑞;方华军;刘允芬;胡中民3.氮沉降对森林土壤主要温室气体通量的影响 [J], 张炜;莫江明;方运霆;鲁显楷;王晖4.氮沉降对中国森林土壤CO2通量的影响 [J], 杨长青;朱艳;蔡卫红;张林5.两类典型荒漠生物结皮覆盖土壤碳通量月变化特征及其影响因子 [J], 韦应欣;周利军;卜崇峰;骆汉;鞠孟辰;王春;李亚红;郭琦;李炳垠因版权原因,仅展示原文概要,查看原文内容请购买。
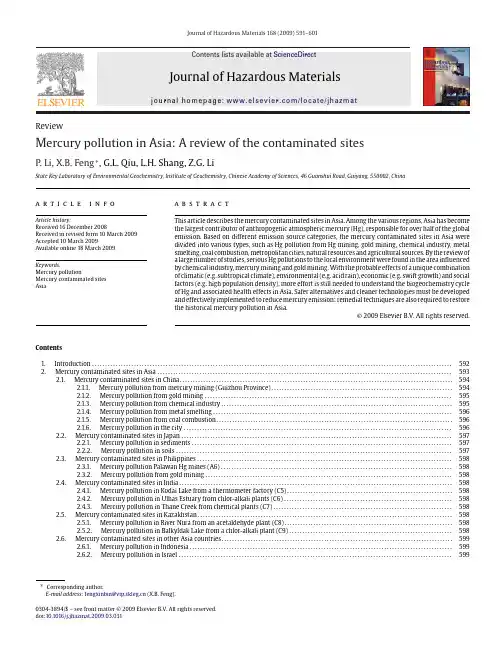
Journal of Hazardous Materials 168(2009)591–601Contents lists available at ScienceDirectJournal of HazardousMaterialsj o u r n a l h o m e p a g e :w w w.e l s e v i e r.c o m /l o c a t e /j h a z m atReviewMercury pollution in Asia:A review of the contaminated sitesP.Li,X.B.Feng ∗,G.L.Qiu,L.H.Shang,Z.G.LiState Key Laboratory of Environmental Geochemistry,Institute of Geochemistry,Chinese Academy of Sciences,46Guanshui Road,Guiyang,550002,Chinaa r t i c l e i n f o Article history:Received 16December 2008Received in revised form 10March 2009Accepted 10March 2009Available online 18March 2009Keywords:Mercury pollutionMercury contaminated sites Asiaa b s t r a c tThis article describes the mercury contaminated sites in Asia.Among the various regions,Asia has become the largest contributor of anthropogenic atmospheric mercury (Hg),responsible for over half of the global emission.Based on different emission source categories,the mercury contaminated sites in Asia were divided into various types,such as Hg pollution from Hg mining,gold mining,chemical industry,metal smelting,coal combustion,metropolitan cities,natural resources and agricultural sources.By the review of a large number of studies,serious Hg pollutions to the local environment were found in the area influenced by chemical industry,mercury mining and gold mining.With the probable effects of a unique combination of climatic (e.g.subtropical climate),environmental (e.g.acid rain),economic (e.g.swift growth)and social factors (e.g.high population density),more effort is still needed to understand the biogeochemistry cycle of Hg and associated health effects in Asia.Safer alternatives and cleaner technologies must be developed and effectively implemented to reduce mercury emission;remedial techniques are also required to restore the historical mercury pollution in Asia.©2009Elsevier B.V.All rights reserved.Contents 1.Introduction (592)2.Mercury contaminated sites in Asia ................................................................................................................5932.1.Mercury contaminated sites in China........................................................................................................5942.1.1.Mercury pollution from mercury mining (Guizhou Province).....................................................................5942.1.2.Mercury pollution from gold mining ..............................................................................................5952.1.3.Mercury pollution from chemical industry........................................................................................5952.1.4.Mercury pollution from metal smelting ...........................................................................................5962.1.5.Mercury pollution from coal combustion..........................................................................................5962.1.6.Mercury pollution in the city ......................................................................................................5962.2.Mercury contaminated sites in Japan .......................................................................................................5972.2.1.Mercury pollution in sediments ...................................................................................................5972.2.2.Mercury pollution in soils .........................................................................................................5972.3.Mercury contaminated sites in Philippines .................................................................................................5982.3.1.Mercury pollution Palawan Hg mines (A6)........................................................................................5982.3.2.Mercury pollution from gold mining..............................................................................................5982.4.Mercury contaminated sites in India........................................................................................................5982.4.1.Mercury pollution in Kodai Lake from a thermometer factory (C5)...............................................................5982.4.2.Mercury pollution in Ulhas Estuary from chlor-alkali plants (C6)................................................................5982.4.3.Mercury pollution in Thane Creek from chemical plants (C7)....................................................................5982.5.Mercury contaminated sites in Kazakhstan.................................................................................................5982.5.1.Mercury pollution in River Nura from an acetaldehyde plant (C8)................................................................5982.5.2.Mercury pollution in Balkyldak Lake from a chlor-alkali plant (C9)..............................................................5982.6.Mercury contaminated sites in other Asia countries........................................................................................5992.6.1.Mercury pollution in Indonesia....................................................................................................5992.6.2.Mercury pollution in Israel ........................................................................................................599∗Corresponding author.E-mail address:fengxinbin@ (X.B.Feng).0304-3894/$–see front matter ©2009Elsevier B.V.All rights reserved.doi:10.1016/j.jhazmat.2009.03.031592P.Li et al./Journal of Hazardous Materials168(2009)591–6012.6.3.Mercury pollution in Kuwait (599)2.6.4.Mercury pollution in landfill in Korea(F4) (599)3.Discussions and summary (599)Acknowledgements (600)References (600)1.IntroductionMercury(Hg)is considered as a global pollutant[1],because Hg0is the predominant form of atmospheric Hg,which has a long residence time in the atmosphere from0.5to2years[2].It can be transported and deposited to remote places even1000km away from the sources[3].Furthermore,Hg can be converted to methylmercury(Me-Hg)and accumulated in the food chain,posing a potential threat to humans’health.The concern of Hg pollution arises from the health effects caused by Me-Hg through the con-sumption offish and marine products[4].Hg is released to atmosphere from natural and anthropogenic sources.Coal combustion[5–8],waste incineration[9,10],metal mining,refining and manufacturing[11–13]and chlorine-alkali production[14–16]are currently major anthropogenic source cat-egories in the industrialized world.Human activities emit both elemental Hg(Hg0)with a long life in the atmosphere and reac-tive gaseous mercury(RGM)and particulate Hg,which are short lived in the air and deposited near the emission source[2].Mercury is also released into the atmosphere by a number of natural processes,including volcanoes and geothermal activities [17–19],evasion from surficial soils[20–22],water bodies[23–27], vegetation surfaces[28,29],wildfires[30–32],as well as the re-emission of deposited mercury[2].Mercury released from natural sources is believed to be mainly Hg0[2].Global oceanic emission is estimated to be800–2600tons/a [33–35]and global natural terrestrial emission is estimated to be1000–3200tons/a[28,33–36].These give a global natural mer-cury emission of1800–5800tons/a.Such a significant yet uncertain emission quantity can considerably influence model results of atmospheric mercury[37–39].The global anthropogenic Hg emission to the atmosphere is esti-mated to be2190tons in2000[40].The largest emissions occur from combustion of fossil fuels,mainly coal in utility,industrial, and residential boilers.As much as two-thirds of the total emission of ca.2190ton of Hg came from combustion of fossil fuels.And Asian countries contributed about54%(1179tons)to the global Hg emis-sion from all anthropogenic sources worldwide in2000[40].And the major emissions of Hg to the global atmosphere still occur from combustion of fossil fuels(879tons).China heads the list of the10 countries with highest Hg emissions from anthropogenic activities. With more than600tons of Hg,China contributes about28%to the global emissions of mercury.There are also four other Asian coun-tries(India,Japan,Kazakhstan,Korea Democratic Republic)on the list.Due to long-range transport,mercury emissions from Asia are thought to significantly influence mercury deposition over North America[41,42].For Hg pollution,a huge environmental and economic cost can be resulted from Hg emission,control and remediation. Trasande et al.[43]evaluated the lost productivity of U.S.chil-dren through Me-Hg exposure;and it amounts to$8.7billion annually,of which$1.3billion each year is attributable to Hg emis-sions from American power plants.Hylander et al.[44]reported the remediation costs for point pollution sources globally,which ranged between2500and1.1million US$kg−1Hg isolated from the biosphere.Asia is the world’s largest and most populous continent.It covers8.6%of the Earth’s total surface area(or29.4%of its land area).With over4billion people,it contains more than 60%of the world’s current human population.Over the past three decades remarkable economic growth has occurred in Asia especially in East Asia and this has put the region’s natural environment at a great risk.The outbreaks of severe mercury poisoning in Minamata,Japan,and Iraq in the last centaury had posed the shocked disaster to eco-environment system and human beings.Mercury-contaminated effluent was discharged into Minamata Bay from an acetaldehyde producing factory and Me-Hg was bio-accumulated byfish and shellfish,and caused Minamata disease in humans by eating contaminatedfish,which killed more than100people and paralyzed several thousand people around Minamata Bay and the adjacent Yatsushiro Sea since1956[45,46].In the early1970’s,a major methylmercury poisoning catastrophe occurred in Iraq by consumption of seed grain treated with a Me-Hg fungicide,which an estimated10,000 people died and100,000were severely and permanently brain damaged.This paper was designed to evaluate Hg pollution in Asia by description of Hg contaminated sites.On the basis of different emis-sion source categories,the contaminated sites were divided into a number of types:Hg pollution from Hg mining(A),Gold mining (B),Chemical Industry(C),Metal smelting(D),Coal combustion(E), Metropolitan cities(F),Natural resource(G)and Agricultural source(H).Fig.1.Mercury contaminated sites in Asia.P.Li et al./Journal of Hazardous Materials 168(2009)591–601593Table 1The description of mercury contaminated sites in Asia.ID CategoryCountry Province Mercury contaminated sitesReferences A1Hg mine China Guizhou Wanshan Hg mine [47–51]A2Hg mine China Guizhou Wuchuan Hg mine [52,53]A3Hg mine China Guizhou Lanmuchang Hg mine [54,55]A4Hg mine China Guizhou Tongren Hg mine [56]A5Hg mine China Guizhou Danzhai Hg mine[57]B1Gold mine China Shaanxi Tongguan artisanal gold mining area [58]B2Gold mineChina Jiangxi Dexing artisanal gold mining area [59]C1Chemical industry China Jilin Songhua River [60,61]C2Chemical industry China Tianjin Jiyun River[62]C3Chemical industry China Guizhou Baihua Reservoir and Farmland in Qingzhen [47,63–65]D1Metal smelting China JilinHuludao Znic smelting area[66,67]D2Metal smelting China Guizhou Weining,Hezhang artisanal Znic smelting area [11,68,69]E1Coal combustion China Shaanxi coal-fired power plant in Baoji City [70]F1City,landfill China Guizhou Landfill in Guiyang City [71–73]F2City,landfillChina Shanghai Landfill in Shanghai City [74,75]C4Chemical industry Japan Kumamoto Minamata Bay [76–79]G1Natural resource Japan Kagoshima Kagoshima Bay[80]G2Natural resourceJapan Sea of Japan (East Sea)[81]H1Agricultural resource Japan Niigata Paddy soils contaminated by agricultural fungicide near Agano River,Niigata[82]G3Natural resource JapanKagoshima Soils influenced by Sakurajima Volcano,Southern Kyushu [83]A6Hg mine Philippines Palawan Palawan Hg mine[84]B3Gold mine Philippines Mindanao Agusan River basin of eastern Mindanao[85]B4Gold mine Philippines Mindanao Paddy fields in the Naboc area,near Monkayo on the island of Mindanao[86]B5Gold minePhilippines Mindanao Sibutad,Western Mindanao influenced by gold mining [87]C5Chemical industry India Tamil Nadu Kodai Lake polluted bya thermometer factory [88]C6Chemical industry India Maharashtra Ulhas Estuary affected by chlor-alkali plants [89]C7Chemical industry IndiaMaharashtra Thane Creek affected by chemical plants[90]C8Chemical industry Kazakhstan Qaraghandy River Nura,Hg polluted from an acetaldehyde plant[91–93]C9Chemical Industry Kazakhstan Pavlodar Balkyldak Lake,Hg polluted from the chlor-alkali plant in Pavlodar,Northern Kazakhstan[94]B6Gold mine Indonesia Sulawesi IslandTalawaan Watershed,North Sulawesi Island[95]F3CityIsrael Marine sediments at the activated sewage sludge disposal site off the Mediterranean coast of Israel[96]C10Chemical industry Kuwait Kuwait Bay,Hg contamination from a Salt and Chlorine Plant [97]F4City,landfillKoreaLandfill in Seoul City[98]2.Mercury contaminated sites in AsiaThe Hg contaminated sites in Asia were listed in Fig.1and described in Table 1.Mercury pollution from chemical industry (C),mercury mining (A)and gold mining (B)are major pollution categories in Asia (Fig.2).Because of its special physical and chemical characteristics,Hg has been widely used in numerous industrial processes and prod-ucts,such as chlor-alkali production,batteries,fluorescent lamps,thermometers,and electronic switches.Chemical industry has been among the largest intentional uses of Hg in the world.Mercury con-taminated effluent from the factory was discharged into aquatic system,which resulted serious Hg pollution to the water body and sediments.The typical and widely concerned mercury pollution in Minamata Bay was resulted from the waste water discharge from an acetaldehyde producing factory,which contained not only inor-ganic Hg but also Me-Hg.Large scale mining activities in Hg mining area have caused seri-ous Hg pollution to local environment,for example,Hg mines in Guizhou Province,China.A lot of researches were conducted in this area due to large scale mining activities.Elemental Hg-Au amalgamation method was widely used in some small scale gold mine in China and Southeast Asia (e.g.Philip-pines,Indonesia).This small-scale or artisanal gold mining involves the use of simple processes generally by a few individuals to recover particulate gold and has led to serious Hg pollution of terrestrial and aquatic ecosystems.China,Japan,Philippines,India and Kazakhstan had the most of Hg contaminated sites in Asia (Fig.3,Table 2),which was nearly identical with the situation of anthropogenic Hg emission.The fiveFig.2.Percentage and numbers of Hg contaminated sites from different categories in Asia.594P.Li et al./Journal of Hazardous Materials 168(2009)591–601Table 2The base situation and numbers of Hg contaminated sites in main five Asia countries.Population/millionArea/million km 2Annual anthropogenic Hg emission/t [12]Numbers of Hg contaminated sites China 13109.6604.715Japan1280.38143.55Philippines 88.60.30–3India1080 3.3149.93Kazakhstan 15.1 2.743.92Total 26301694228Asia368044117933Fig.3.The numbers of Hg contaminated sites for different countries in Asia.countries contributed 71.5%of population,36.4%of area,79.9%of anthropogenic Hg emission and 84.8%of numbers of Hg contami-nated sites in Asia.2.1.Mercury contaminated sites in China2.1.1.Mercury pollution from mercury mining (Guizhou Province)The Hg reserve of China ranks the third in the world.Guizhou was used to be the most important Hg production center in China (Fig.4),because more than 78%of total national resources were discovered in this province.So far,a lot of largeand super-large Hg mines have been discovered in this province (Fig.5),for exam-ple,Wanshan (A1),Wuchuan (A2),Lanmuchang (A3),Tongren (A4),and Danzhai (A5).A long-term of 3000years Hg mining activities have introduced significant quantities of gangues and mine wastes (calcines),which are uncontrolled stockpiled nearFig.4.The spatial distribution of mercury mine in China.the abandoned Hg processing sites and retorts and continuing release Hg to the environment,causing serious Hg contamina-tion.2.1.1.1.Hg levels in mine wastes (calcines).High concentrations of total mercury (T-Hg)in mine wastes,up to 4400mg/kg,were observed in Wanshan Hg mine [48].Results from leaching exper-iments identified the existence of soluble reactive Hg compounds [56],suggesting that the introduction of mine wastes into river sys-tems could release Hg species (i.e.soluble reactive Hg)to water body.Me-Hg concentrations in mine wastes ranged from 0.17to3.9g/kg [48,52].2.1.1.2.Hg contamination in the ambient air.Wang et al.[51,53,55]investigated total gaseous mercury (TGM)concentrations in the ambient air in Wanshan,Wuchuan and Lanmuchang Hg min-ing area.The average of TGM concentrations ranged from 17.8to 102ng/m 3,from 19.5to 2110ng/m 3,from 7.9to 468ng/m 3in Wan-shan,Wuchuan and Lanmuchang Hg mining area,respectively.The results showed air Hg concentrations were 2–4orders of magni-tude higher than those observed in background areas in Europe and North America due to a large amount of Hg emission from Hg mining activities.Moss obtaining nutrients through atmospheric route can be used as a bio-indicator of air pollution of Hg [99].A significant amount of Hg can be concentrated in mosses in Hg mining areas,reaching up to 95mg/kg [48,56].Qiu et al.[48]clearly demonstrated a significantly positive correlation between atmospheric Hg con-centrations and T-Hg concentrations in moss which indicated that Hg mining activities have resulted in serious Hg contamination to the ambient air.2.1.1.3.Hg contamination in soil.At the Wanshan Hg mine,Hg con-centrations in surface soils could be as much as 790mg/kg [48].At a site of 24km downstream from the Wuchuan mine,soils alongside river banks were still heavily contaminated with Hg and Hg concen-tration reached 24mg/kg [52].The distribution of Hg in a soil profile impacted by a large-scale Hg smelter was investigated in Wuchuan [52].Results showed that T-Hg concentrations were the highest in the surface soil,ranging from 6.5to 17mg/kg,and decreased to a low level of 0.48mg/kg at a depth of 45cm.This indicated that Hg species deposited onto the soil surface can be transported down-ward so that anomalous Hg values can extend to depths of about 50cm.Elevated Me-Hg levels as high as 23g/kg in soil was found in Wanshan [47].Similar results were reported in soils from Wuchuan,which ranged from 0.69to 20g/kg [52].However,studies showed Me-Hg concentrations in rice paddies were usually higher than those of cornfields [48,52]due to its favorable environment for methylation of Hg [100].Hg contaminated irrigating water and anaerobic conditions most likely contributed to high concentra-tions of Me-Hg in rice paddies.2.1.1.4.Hg contamination in surface water.Concentrations of T-Hg in surface water collected from Wanshan,Lanmuchang,WuchuanP.Li et al./Journal of Hazardous Materials168(2009)591–601595Fig.5.The typical mercury pollution sites in Guizhou Province.and Tongren varied from24.8to10,580ng/L[47,49,52,54,56].A geo-chemical study showed that the drainages from calcines piles had pH value of10.6–11.8,containing high dissolved Hg concentrations of300–1900ng/L[50].This indicated that the reaction between water and calcines increased the concentrations of Hg in mine drainage and was an important process,which controls the release and transport of Hg from mine wastes into the streams.2.1.1.5.Hg contamination in food.Levels of Hg up to18mg/kg occurred in green cabbages(B.oleracea)grown in Hg-contaminated soils in Lanmuchuang Hg mining area[54].Vegetable and rice sam-ples collected from Wanshan Hg mining area contained elevated T-Hg,which ranged from5to1890g/kg(wet weight)and from4.9 to215g/kg(dry weight)for vegetables and rice samples,respec-tively.However,it is clearly demonstrated that only rice could assimilate and accumulate Me-Hg in its edible portion in a high level,and Me-Hg concentration in rice can be as high as174g/kg [101].Local residents were exposed to Me-Hg due to frequent rice meals but not withfish consumption in the mining areas[102]. 2.1.2.Mercury pollution from gold mining2.1.2.1.Mercury pollution in Tongguan gold mining area,Shaanxi Province(B1).Feng et al.[58]examined Hg contamination in air, water,sediment,soil and crops in Tongguan gold mining area,China, where elemental Hg had been used to extract gold for many years. Average TGM concentrations in ambient air in a gold mill reached 18g/m3.T-Hg concentrations in stream water samples ranged from0.24to880g/L and particulate Hg was dominate Hg species. T-Hg concentrations in sediment varied from0.90to1200mg/kg. Soil samples collected in the vicinity of Au mills were significantly contaminated with Hg as indicated by T-Hg concentrations rang-ing from0.9to76mg/kg.T-Hg concentrations in vegetable and wheat samples ranged from42to640g/kg,all of which signifi-cantly exceed Chinese guidance limit for vegetables(10g/kg)and foodstuffs other thanfish(20g/kg).2.1.2.2.Mercury pollution from gold mining in Dexin County,Jiangxi Province(B2).Lin et al.[59]studied Hg pollution related to gold mining in Dexin County,Jiangxi Province,which indicated serious Hg pollution to local environment resulted from gold mining.Average concentration of TGM in air from workplace of gold mines ranged from1.95to2.84mg/m3,which significantly exceeded upper limit(0.01mg/m3).T-Hg concentration in wastew-ater ranged from0.5to1.0mg/L,about10–20times of permission value(0.05mg/L),and the wastewater was directly discharged to the streams without any treatment.T-Hg concentrations in solid tailings were highly elevated,up to100–300mg/kg.T-Hg concen-tration in the soil near the workshop was found to be1100mg/kg.2.1.3.Mercury pollution from chemical industry2.1.3.1.Mercury pollution in Songhua River,Northeastern China(C1). Songhua River,situated in Northeastern China,is one of the seven largest rivers in China and was seriously contaminated with mer-cury from1958to1982by the Acetic Acid Plant of Jilin Chemical Company.The plant discharged in113.2tons of T-Hg and5.4tons of Me-Hg to the Songhua River,which constituted69.8%and99.3%of total anthropogenic Hg and Me-Hg input to this river,respectively. In addition to this contamination source,some small plants which also used Hg were distributed inside the drainage area of Songhua River and also discharged Hg into the river.A few large research projects related to integrated control and countermeasure of Me-Hg pollution of Songhua River were car-ried out between1980s and1994.The results from these research projects were published in two books[60,61]and in a number of papers in Chinese journals.After the largest mercury emission source,the acetic acid plant of Jilin Chemical Company,completely terminated discharge of Hg to the Songhua River in1982,T-Hg and Me-Hg concentrations in river water and T-Hg concentrations in surface sediment decreased significantly[103].Mercury concentrations in sediment at certain highly contaminated sites were still elevated compared to the back-ground mercury concentration in sediment of the Songhua River, which is0.14mg/kg[104].T-Hg concentrations infish decreased gradually after mercury discharge to the river was completely stopped in1982[103],as shown in Fig.6.The average mercury concentrations in hair offishermen reached13.5mg/kg in1970s,596P.Li et al./Journal of Hazardous Materials168(2009)591–601Fig.6.Temporal changes of Hg concentration infishes in Songhua River from1972 to1991.and somefishermen showed the symptoms of Minamata disease, including concentric constriction of the visualfield,loss of sensa-tion in hands and feet,hearing impairment,and ataxia.A survey carried out in1997showed that the average T-Hg concentration in hair offishermen dropped to1.8mg/kg[105].2.1.3.2.Mercury pollution in Jiyun River,Tianjin City(C2).The Jiyun River,located in Tianjin City,eastern China,was seriously contam-inated with mercury since the1960s when a Chlor-alkali plant started to operate at the middle reaches of the river.Before1977, Hg contaminated wastewater from the plant had been directly dis-charged into the river.After1977,a mercury control project went into operation and mercury concentration in wastewater decreased tremendously[62].T-Hg concentrations in river water and sed-iment ranged from20to24,000ng/L,from0.03to845mg/kg, respectively[62].2.1.3.3.Mercury pollution from chemical plant in Guizhou(C3). Guizhou Organic Chemical Plant(GOCP),which used Hg-based technology till1997,is located at upper reaches of Baihua Reser-voir(Fig.5).GOCP went into operation in1980,and about160tons of Hg had been consumed since then.From1980to1985,drainages from GOCP were directly discharged to the stream without any treatment,which seriously contaminated the surrounding environ-ments,especially for Baihua Reservoir and nearby paddyfields.High average concentrations of T-Hg in water samples from Baihua Reservoir were found up to73.4ng/L[64].Yan et al.[65] reported the highest T-Hg concentration of39mg/kg in sediments was obtained in the upstream of Baihua reservoir,which is located immediately downstream of the GOCP.The study testified exceed-ingly high T-Hg levels in the historical records provided by sediment cores.Yasuda et al.[63]demonstrated that paddyfields down-stream of GOCP receiving the waste water from GOCP were seriously Hg contaminated.The average T-Hg concentration was 15.73±42.98mg/kg,which was significantly elevated compared to average value of0.11±0.05mg/kg in control area nearby.Horvat et al.[47]reported Hg pollution in paddy soil in Qingzhen, which was the closest to GOCP.Active transformation of inorganic Hg to organic Hg species(Me-Hg)taken place in water,sediments and soils were also observed.T-Hg concentrations in rice grains can reach up to87.8g/kg,which41.4g/kg was in Me-Hg form and the percentage of Hg as Me-Hg varied from32.9%to52.8%.2.1.4.Mercury pollution from metal smelting2.1.4.1.Mercury pollution in Huludao zinc smelting area,Liaoning Province(D1).Zheng et al.[66]studied spatial distribution of Hg in the soil in the area suffering zinc smelting and chlor-alkai pro-duction.T-Hg concentration in surface soil was0.055–14.5mg/kg with a mean value of1.44mg/kg,which was38times higher than that of regional background value.T-Hg concentration in surface soil decreased radiantly around dual centers of the factory for zinc smelting and chlor-alkai production,which manifested influence from atmosphere Hg disposition.Zheng et al.[67]investigated T-Hg in maize,soybean,broom-corn,22vegetables,and the soil around their roots from eight sampling plots near Huludao zinc plant.T-Hg concentration of the seeds of maize,soybean,and broomcorn were0.008,0.006,and 0.057mg/kg,respectively.T-Hg concentrations of edible parts of vegetables varied from0.001to0.147mg/kg(dry weight),which can pose health risk to the local residents through vegetables eating.2.1.4.2.Mercury pollution from artisanal zinc smelting in northwest-ern Guizhou(D2,Fig.5).In Hezhang,T-Hg concentrations in top soils decreased exponentially with the distance from Zn smelting areas, and dropped dramatically at upwind direction[68].This indicated Hg contaminations in top soils were mainly derived from deposi-tion of atmospheric Hg emitted from zinc smelting.Local surface waters were seriously contaminated with Hg and average of T-Hg concentration in surface water reached138ng/L,which was higher than that in local springs and wells[11].Apart from deposition of Hg species emitted from zinc smelting,smelting residues were also primary source of Hg contamination to surface water.Li et al.[69]determined T-Hg and Me-Hg concentrations in soil, surface water and corn plants in Weining County,northwestern Guizhou.Significantly elevated TGM concentrations were found in the atmosphere adjacent to zinc smelting sites,ranging from30to 3814ng/m3.Concentrations of T-Hg and dissolved Hg in the surface water ranged from95to278ng/L and from87to117ng/L,respec-tively.T-Hg and Me-Hg concentrations in top soil samples ranged from62to355g/kg and from0.20to1.1g/kg,respectively.The results revealed a significant Hg pollution to the local environment resulted from artisanal zinc smelting activities.2.1.5.Mercury pollution from coal combustion2.1.5.1.Mercury pollution from power plant in Baoji City,Shaanxi Province(E1).Yang and Wang[70]determined soil Hg pollution around a coal-fired power plant in Baoji City,Shaanxi Province.T-Hg concentrations in the soil ranged from0.137to2.105mg/kg(with average value of0.606mg/kg)and were elevated comparing with background value in Shaanxi Province.Forty-five years of operating caused an elevation of T-Hg concentrations in the vicinal soils.2.1.6.Mercury pollution in the city2.1.6.1.Mercury pollution in landfill in Guiyang(F1).Li et al.[71,72] measured T-Hg concentration in municipal solid waste(MSW), plants and leachates in landfill in Guiyang City,Guizhou Province.T-Hg concentration in MSW ranged from0.170to46.2mg/kg with a geometric mean of0.574mg/kg.Hg in leachate of Gao-Yan land-fill was very low,i.e.79.4ng/L,it was responsible to low T-Hg in the MSW,high leachate pH,appearance of insoluble sulfide and absorption by organic and inorganic materials in MSW.The results indicated that there was some Hg pollution risks associ-ated with MSW landfilling.Feng et al.[73]found that landfills are not only TGM emission source,but also Me-Hg emission source to the ambient air.The average mono-methylmercury and dimethylmercury concentrations averaged out at2.06±1.82ng/m3 and9.50±5.18ng/m3,respectively.2.1.6.2.Mercury pollution in landfill in Shanghai(F2).Tang et al. [74,75]evaluated Hg pollution in leachates,ground water,surface water and top soil in Laohang Landfill in Shanghai City.T-Hg con-centration in the leachates ranged from0.1to1.016g/L in different。
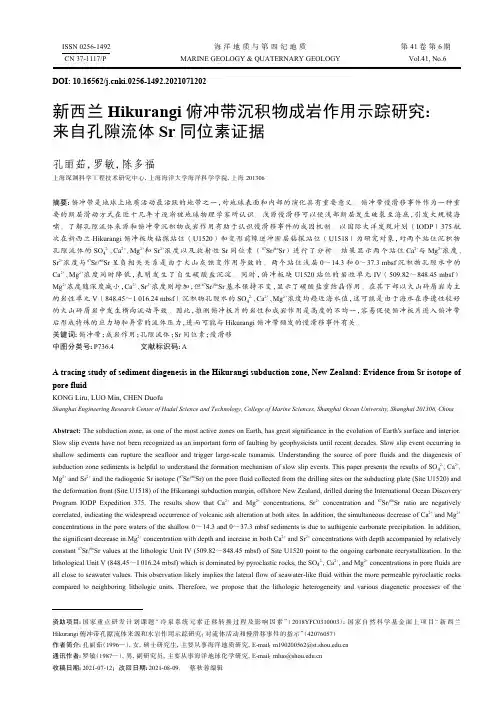
DOI: 10.16562/ki.0256-1492.2021071202新西兰Hikurangi 俯冲带沉积物成岩作用示踪研究:来自孔隙流体Sr 同位素证据孔丽茹,罗敏,陈多福上海深渊科学工程技术研究中心,上海海洋大学海洋科学学院,上海 201306摘要:俯冲带是地球上地质活动最活跃的地带之一,对地球表面和内部的演化具有重要意义。
俯冲带慢滑移事件作为一种重要的断层滑动方式在近十几年才逐渐被地球物理学家所认识。
浅源慢滑移可以使浅部断层发生破裂至海底,引发大规模海啸。
了解孔隙流体来源和俯冲带沉积物成岩作用有助于认识慢滑移事件的成因机制。
以国际大洋发现计划(IODP )375航次在新西兰Hikurangi 俯冲板块钻探站位(U1520)和变形前缘逆冲断层钻探站位(U1518)为研究对象,对两个站位沉积物孔隙流体的SO 42-、Ca 2+、Mg 2+和Sr 2+浓度以及放射性Sr 同位素(87Sr/86Sr )进行了分析。
结果显示两个站位Ca 2+与Mg 2+浓度、Sr 2+浓度与87Sr/86Sr 呈负相关关系是由于火山灰蚀变作用导致的。
两个站位浅层0~14.3和0~37.3 mbsf 沉积物孔隙水中的Ca 2+、Mg 2+浓度同时降低,表明发生了自生碳酸盐沉淀。
同时,俯冲板块U1520站位的岩性单元IV (509.82~848.45 mbsf )Mg 2+浓度随深度减小,Ca 2+、Sr 2+浓度则增加,但87Sr/86Sr 基本保持不变,显示了碳酸盐重结晶作用。
在其下部以火山碎屑岩为主的岩性单元V (848.45~1 016.24 mbsf )沉积物孔隙水的SO 42-、Ca 2+、Mg 2+浓度均趋近海水值,这可能是由于海水在渗透性较好的火山碎屑岩中发生横向流动导致。
因此,推测俯冲板片的岩性和成岩作用是高度的不均一,容易促使俯冲板片进入俯冲带后形成特殊的应力场和异常的流体压力,进而可能与Hikurangi 俯冲带频发的慢滑移事件有关。
a killing frost 严寒acid rain n.酸雨acidification n.土地酸化afforestation n. 绿化造林agricultural ecology 农业生态学air emission standards 空气排放标准air pollution 空气污染air pollution emission 空气污染排放(物)algae n. 藻类,海藻alternative fuels --替代燃料altitude n. 海拔ample rainfall n. 充足的雨量annual temperature range 年气温幅度anomalies n. 反常(现象)aquatic life 水生植物artificial rain n.人工降雨atmosphere (The)n. 大气层biosphere n. 生物圈barrier effect of mountains 山的阻隔效应、栅栏效应black hole n. 黑洞car exhaust n.汽车尾气carbon dioxide (CO2)n. 二氧化碳carbon monoxide (CO)n. 一氧化碳clean energy n. 清洁能源clean fuels n. 清洁燃料climatic zones 气候带Temperate 温带(气候)the cool temperate zone 寒温带the warm temperate zone 暖温带Tropical 热带(气候)Subtropical 亚热带(气候)Tundra 苔原(气候)Equatorial 赤道(气候)Arid 干旱(气候)Mediterranean 地中海式(气候)Polar (arctic)极地(气候)Mountains 高山(气候)Plateau 高原(气候)Maritime 海洋性(气候)Continental climate 大陆气候coastline n.海岸线combustion n. 燃烧comet n.彗星contamination n. 污染contingency n. 偶发事件convection n对流debris flow 泥石流deforestation n.森林砍伐desertification n.(土壤)沙漠化,荒漠化domestic sewage n. 生活污水drought n. 旱灾dust storm n. 沙尘暴earthquake n. 地震earthquake magnitude 震级eco-agriculture 生态农业ecological impact 生态影响ecosystem n. 生态系统eco-technology 生态技术El Nino Southern Oscillation (ENSO)(气候学)厄尔尼诺南徊现象[详析]厄尔尼诺是西班牙语"El Nino"的音译。
第一章概论第一节:大气与大气污染1.大气的组成:大气是由多种气体混合而成,其组成可以分为三部分:干燥清洁的空气、水蒸气和各种杂质。
干洁空气的组成是氮、氧、氩和二氧化碳气体,其含量占全部干洁空气的99.996%(体积);氖、氦、氪、甲烷等次要成分只占0.004%左右。
P1(选择/ 2.大气污染:系指由于人类活动或自然过程使得某些物质进入大气中,呈现出足够的浓度,达到了足够的时间,并因此而危害了人体的舒适、健康和人们的福利,甚至危害了生态环境。
P3(名词解释/选择)(例:大气污染与其他污染的区别是?---“时间的持续(足够的时间)”)3.全球性大气污染问题包括温室效应、臭氧层破坏和酸雨等三大问题。
P3(填空)4.温室效应:大气中的二氧化碳和其他微量气体,可以使太阳短波辐射几乎无衰减地通过,但却可以吸收地表的长波辐射,由此引起全球气温升高的现象,称为“温室效应”。
P3 第二节:大气污染物及其来源1.大气污染物的种类很多,按其存在状态可概括为两类:气溶胶状态污染物,气体状态污染物。
P4(填空)2.气溶胶:系指沉降速度可以忽略的小固体粒子、液体粒子或它们在气体介质中的悬浮体系。
P4(名词解释)3.总悬浮颗粒物(TSP):指能悬浮在空气中,空气动力学当量直径100的颗粒物。
P54.可吸入颗粒物(PM 10):指悬浮在空气中,空气动力学当量直径10的颗粒物。
P55.对于气体污染物,有可分为一次污染物和二次污染物。
P5(填空)6.一次污染物:是指直接从污染源排到大气中的原始污染物质。
P5(名词解释)7.二次污染物:是指由一次污染物与大气中已有组分或几种一次污染物之间经过一系列化学或光化学反应而生成的与一次污染物性质不同的新污染物质。
P6(名词解释)8.硫酸烟雾:硫酸烟雾系大气中的SO2等硫氧化物,在有水雾、含有重金属的悬浮颗粒或氮氧化物存在时,发生一系列化学或光化学反应而生成的硫酸雾或硫酸盐气溶胶。
硫酸烟雾引起的刺激作用和生理反应等危害,要比SO2气体大得多。
Annual sulfur deposition through fog,wet and dry deposition in the Kinki Region of JapanHikari Shimadera *,Akira Kondo,Kundan Lal Shrestha,Akikazu Kaga,Yoshio InoueDivision of Sustainable Energy and Environmental Engineering,Graduate School of Engineering,Osaka University,2-1Yamadaoka,Suita,Osaka 565-0871,Japana r t i c l e i n f oArticle history:Received 17March 2011Received in revised form 17August 2011Accepted 19August 2011Keywords:Fog deposition Acid depositionTransboundary air pollution WRF/CMAQFog water deposition modela b s t r a c tThis study estimated annual sulfur (SO 2þSO 42À)deposition through fog,wet and dry deposition in the Kinki Region of Japan from April 2004to March 2005.The numerical models used in this study include the Weather Research and Forecasting model (WRF),the Community Multiscale Air Quality model (CMAQ),and a fog deposition model.WRF well predicted mountain fog at Mt.Rokko,the meteorology near the ground surface in the Kinki Region and the upper air meteorology in Japan during the simu-lation period.CMAQ well predicted the long-range atmospheric transport of aerosol SO 42Àfrom the AsianContinent to Japan.The mean SO 42Àconcentration in fog water was approximately 6times higher than that in precipitation in the Kinki Region.Ratios of fog water deposition to precipitation reached up to more than 10%in some mountainous areas in the Kinki Region.Consequently,the amount of sulfur deposition through fog water deposition was larger than that through dry deposition and comparable to that through wet deposition in some mountainous areas in the Kinki Region.Ó2011Elsevier Ltd.All rights reserved.1.IntroductionFog is a cloud on the ground surface and reduces the horizontal visibility to less than 1000m.Fog can be classi fied into several types,such as radiation fog and mountain fog,in accordance with the formation mechanism.Radiation fog occurs through radiative cool-ing of humid air masses typically from night to early in the morning on flat terrains and in valleys.Mountain fog mainly occurs through orographic lifting of humid air masses or horizontal advection of low-level cloud to mountain ranges (Klemm et al.,2005).Fog can affect forest ecosystems in mountainous areas,in which fog occurs more frequently than in other areas.Fog water deposi-tion through the interception of fog droplets by vegetation can be an important part of the hydrologic budget of forests (Vong et al.,1991;Dawson,1998).Ionic concentrations in fog water are much higher than those in rain water (Igawa et al.,1998;Aikawa et al.,2001).Consequently,fog can contribute signi ficantly to atmo-spheric deposition in mountainous forest areas (Baumgardner et al.,2003;Klemm and Wrzesinsky,2007).The effects of fog may be more pronounced in Japan than in other regions because approximately two-thirds of the land area are covered with forests,most of which are located in mountainous regions.The amounts of fog water deposition have been measured using various approaches,such as the through fall measurement (e.g.,Shubzda et al.,1995;Lange et al.,2003)and the eddy covariance method (e.g.,Burkard et al.,2003;Klemm et al.,2005;Eugster et al.,2006).Numerical models also have been utilized to estimate fog water deposition.A one-dimensional model developed by Lovett (1984)has been widely used to predict fog water deposition in various mountain forests (e.g.,Miller et al.,1993;Herckes et al.,2002a;Baumgardner et al.,2003).Katata et al.(2008)also developed a one-dimensional land surface model to better predict fog water deposi-tion,and showed the model agreed better with the measurement data by Klemm et al.(2005)than the model developed by Lovett (1984).The study of fog on a spatial scale requires numerical simulations because few fog monitoring sites exist and fog is highly variable according to regions.Mesoscale meteorological models have been employed for regional forecasting of particular fog events (e.g.,Ballard et al.,1991;Pagowski et al.,2004).Shimadera et al.(2008)applied the 5th generation Mesoscale Model (MM5)(Grell et al.,1994)to fog simulation for months in the Kinki Region of Japan,and showed that the model well reproduced occurrence of fog.Shimadera et al.(2009)utilized MM5and the Community Multiscale Air Quality model (CMAQ)(Byun and Ching,1999)to predict concentrations of acidic compounds in fog water in the Kinki Region in March 2005.Shimadera et al.(2010)developed a two-dimensional fog water deposition model,and showed that the model was applicable to the estimate of spatial distribution of fog deposition with the meteorology and air quality modeling system.*Corresponding author.Tel./fax:þ810668797670.E-mail addresses:shimadera@ea.see.eng.osaka-u.ac.jp ,simadera@criepi.denken.or.jp (H.Shimadera).Contents lists available at SciVerse ScienceDirectAtmospheric Environmentjournal homep age:www.elsevi/locate/atmosenv1352-2310/$e see front matter Ó2011Elsevier Ltd.All rights reserved.doi:10.1016/j.atmosenv.2011.08.055Atmospheric Environment 45(2011)6299e 6308The present study utilized the Weather Research and Fore-casting model(WRF)(Skamarock et al.,2008),CMAQ and the fog deposition model in order to estimate annual sulfur(SO2þSO42À) deposition through fog(not included in wet deposition in this study),wet and dry deposition in the Kinki Region of Japan from April2004to March2005.2.Numerical models2.1.Meteorology and air quality modeling systemMeteorology and air quality models used in the present study are WRF version ARW3.2.1and CMAQ version4.7.1.WRF is a three-dimensional,nonhydrostatic,terrain-following sigma-pressure coordinate mesoscale model with a multiple-nest capability,several physics options,and a four-dimensional data assimilation capability. CMAQ is a three-dimensional Eulerian air quality modeling system that simulates the transport,transformation,and dry and wet deposition of various air pollutants and their precursors across spatial scales ranging from local to hemispheric.For the present study,CMAQ was modified to output ionic concentrations in fog (cloud water at thefirst layer).The following relationship between the horizontal visibility(x vis)(m)and the liquid water content of fog(LWC)(g mÀ3)obtained from Stoelinga and Warner(1999)was utilized to judge whether fog occurred or not:x vis¼À1000Âlnð0:02Þ144:7LWC:(1)It was considered that fog occurred when x vis<1000m,i.e.LWC>0.017g mÀ3at thefirst layer.The WRF/CMAQ modeling system was run for the period fromApril2004to March2005with an initial spin-up period of March2004.Fig.1shows modeling domains for CMAQ prediction.The study region is centered at(122.5 E,32.5 N)on the Lambertconformal conic projection map of Asia.The horizontal domainsconsist of4domains from domain1(D1)covering a wide area ofAsia to domain4(D4)covering most of the Kinki Region of Japan.The horizontal resolutions and the number of grid cells in thedomains are81,27,9and3km,and128Â96,66Â66,69Â69and72Â72for D1,domain2(D2),domain3(D3)and D4,respectively.The vertical layers for the WRF and CMAQ predictions consist of24and16sigma-pressure coordinated layers from the surface to100hPa,respectively.The middle heights of thefirst,second andthird layers are approximately15,50,and110m,respectively.The observation data used for the WRF/CMAQ evaluations wereobtained from fog sampling by the Hyogo Prefectural Governmenton Mt.Rokko,surface meteorological observation in D4andupper air meteorological observation in Japan conducted by theJapan Meteorological Agency(JMA),air pollution monitoring by theOsaka Prefectural Government,and acid deposition monitoring bythe Ministry of the Environment(MOE)of Japan.The locations ofthe observation sites are shown in Fig.1.The fog sampling on Mt.Rokko was performed by using an active fog collector with a netconsisting of Teflon string.The liquid water content of fog wasestimated from volume of sampled fog water,sampling time,samplingflow rate,and collection efficiency.The concentrationsof Fig.1.Modeling domains for CMAQ prediction and locations of observation sites.H.Shimadera et al./Atmospheric Environment45(2011)6299e63086300chemical species of sampled fog water were measured with an ion chromatograph.The details of the method are described in Aikawa et al.(2005).For the meteorological prediction,WRF was con figured with the Kain-Fritsch scheme (Kain,2004)for the cumulus parameterization of D1e D3,the Yonsei University scheme (Hong et al.,2006)for planetary boundary layer parameterization,the WRF single-moment 3-class microphysics scheme (Hong et al.,2004;Hong and Lim,2006),the Noah land surface model (Chen and Dudhia,2001),the rapid radiative transfer model (Mlawer et al.,1997)for the long wave radiation and the scheme of Dudhia (1989)for the shortwave radiation simulations.Input data for WRF include the National Centers for Environmental Prediction final analysis (NCEP FNL)data,and the grid point value derived from the mesoscale model (GPV MSM)data by JMA.Initial and lateral boundary condi-tions for WRF were obtained from the NCEP FNL for D1and the GPV MSM for D2.The WRF simulations from D2to D4were conducted with two-way nesting.Three-dimensional analysis nudging was applied to the west e east and north e south wind components in D1and D2with the nudging coef ficient set to 3.0À5s À1for the entire simulation period.For the air quality prediction,CMAQ was con figured with the Statewide Air Pollution Research Center version 99(SAPRC99)(Carter,2000)mechanism for the gas-phase chemistry,the 5th generation CMAQ aerosol module (U.S.EPA,2008)for the aerosol processes,and the cloud and aqueous phase chemistry option based on Chang et al.(1987)and Pleim and Chang (1992).The hourly results of WRF were processed using the Meteorology e Chemistry Interface Processor (MCIP)version 3.6.Initial and boundary condi-tions for D1were obtained from the CMAQ default concentration pro files.Emission data applied in this study include anthropogenic,biogenic volatile organic compounds (BVOC),biomass burning and volcanic SO 2emissions.Anthropogenic and BVOC emissions for the Japan region were derived from an emissions inventory for Japan in the year 2000called EAGrid2000-Japan (Kannari et al.,2007).For the other South and East Asia regions,anthropogenic emissions were obtained from an emissions inventory for Asia in the year 2006developed by Zhang et al.(2009).Emissions of NH 3were derived from predicted values for the year 2004and 2005of the regional emission inventory in Asia (Ohara et al.,2007).BVOC and biomass burning emissions were derived from Murano (2006)and Streets et al.(2003),respectively.For the other regions in D1,anthropogenic and biomass burning emissions were obtained from an emissions inventory prepared for Arctic Research of the Composition of the Troposphere from Aircraft and Satellites (/arctas_premission ),and BVOC emissions were derived from Guenther (1995).The volcanic SO 2emissionswere obtained from Andres and Kasgnoc (1998)for volcanoes erupting continuously,and observation data by JMA for Miyakejima located to the south of Tokyo.Emissions from international ship-ping estimated by Corbett and Koehler (2003,2004)were allocated with the ship emissions allocation factor by Wang et al.(2008).To estimate the contribution of the transboundary air pollution from the other regions to Japan,the CMAQ simulations were con-ducted in two emission cases.The first is a baseline emission case with the total emissions described above (EB),and the other is an emission case where anthropogenic emissions in the land areas except Japan are set to be 0(EJ).Fig.2shows spatial distributions of SO 2emission rates in EB.The total emissions of SO 2in EB and EJ are 57.1and 7.5Tg year À1,respectively.2.2.Fog deposition modelThe fog water deposition model used in the present study is based on the two-dimensional model developed by Shimadera et al.(2010).The study showed that the model-predicted fog deposition velocity increased with increasing horizontal wind speed,and considerably varied with forest parameters.Moreover,the model-predicted fog deposition velocity was the largest at the windward edge of forest.It was also showed that the model well reproduced the deposition flux of mountain fog observed by Eugster et al.(2006).Equations to simulate turbulent air flow in and above a forest canopy are based on equations used by Yamada (1982).An equation of mean motion isv U v t ¼v v z K M v Uv zÀC D A S U j U j ;(2)where U is the horizontal wind component (m s À1),K M is the eddy diffusivity of momentum (m 2s À1),C D is the drag coef ficient for a forest canopy and A S is the one-sided surface area density (m 2m À3).The vertical distribution of A S was obtained from a func-tion proposed by Kondo and Akashi (1976).An advection e diffusion equation of fog isv LWCv t¼ÀU $V LWC þV ðK H $V LWC ÞÀS IM ÀS S ;(3)where K H is the eddy diffusivity of heat (m 2s À1),S IM and S S are respectively fog water deposition terms by inertial impaction and gravitational settling of fog droplets on leaves.Inertial impaction is generally the dominant deposition mechanism,but gravitational settling can be important under low wind speed conditions (Lovett,1984).K M and K H were obtained with the closure model of Mellor and Yamada (1982).S IM and S S are givenbyFig.2.Spatial distribution of annual mean SO 2emission rate in EB.H.Shimadera et al./Atmospheric Environment 45(2011)6299e 63086301S IM ¼A L k x 3IM j U j LWC ;(4)S s ¼A L k z v s LWC ;(5)where A L is the one-sided leaf area density (m 2m À3),3IM is the ef ficiency of inertial impaction,v S is the gravitational settling velocity of fog droplets,k x and k z are respectively the portions of the effective leaf area for deposition of fog droplets by inertial impac-tion and gravitational settling.The ef ficiencies of inertial impaction 3IM for needle and broad leaves were obtained with an empirical function proposed by Katata et al.(2008).The gravitational settling velocity v S is given byv s ¼gd 2p ðr W Àr A Þm A;(6)where g is the acceleration of gravity (m s À2),d p is the volume-weighted mean diameter of fog droplet (m),r W and r A are respectively the densities of liquid water and air (kg m À3),and m A is the viscosity coef ficient of air (kg m À1s À1).Droplet size of fog can be expressed as a function of LWC (e.g.,Eugster et al.,2006;Katata et al.,2008).Because of lack of observation data on droplet size of fog in the study region,this study utilized the observation data by Burkard et al.(2003)at the Lägeren research site in Switzerland to obtain the following relationship between d p and LWC :d P ¼ 11:6LWC 0:305þ15:8LWC þ4:0Â10À6:(7)According to Petroff et al.(2009),k x and k z are expressed byk x ¼Z2=p q L ¼0Z2p f L ¼04q L 4f L sin q L j cos f L j d q L d f L ;(8)k z ¼Z2=p q L ¼04q L cos q L d q L ;(9)4q L ða L Þ¼2p G ðm L þv L ÞG ðm L ÞG ðv L Þ 1À2a L p m L À1 2a L p v L À1;a L ˛ 0;2p;(10)4f L ða L Þ¼12p;a L ˛½0;2p ;(11)where q L and f L are respectively the inclination and azimuth of leaves,4q L and 4f L are the leaf angular densities associated with each angle,G is the Euler Gamma-function,m L and n L are parameters depending on the canopy species,location and time.Forsimpli fication,it was assumed that all leaf orientations were equi-probable,i.e.,m L and n L were set to be 1.Fig.3shows the modeling domain for the fog deposition model.The width of the objective region is set to 3km for predictions of fog water deposition in 3-km grid cells in D4.Horizontal and vertical resolutions are 60and 1m,respectively.Forest areas are allocated to the objective region from its edges according to forest fraction.Spatial distribution of forest fractions in D4was obtained from the 100-m land use dataset of the Digital National Land Information in Japan (http://nlftp.mlit.go.jp/ksj/).Forest areas cover 69%of the land areas and 95%of the mountainous areas with elevation !500m in D4.Spatial distributions of leaf area index (LAI)in D4were derived from the global datasets of monthly 1-km LAI with the Moderate resolution imaging spectroradiometer (MODIS)(/modismisr/index.html ).Mean values of LAI in the forest areas in D4are 2.5in the spring (April and May 2004,and March 2005),2.8in the summer (June,July and August 2004),2.2in the fall (September,October and November 2004)and 1.4in the winter (December 2004,January and February 2005).SpatialFig.3.Modeling domain for two-dimensional fog deposition model.Table 1Statistical performance for meteorological predictions near the ground surface at the meteorological observatories in D4and at 925hPa surface above the aerological observatories in Japan from April 2004to March 2005.Surface925hPaTemperatureSample number 139823(8625e 8760)14580(714e 730)Mean Obs.( C)16.4(15.2e 17.7)11.8(2.8e 19.3)Mean WRF ( C)16.2(14.2e 17.8)11.3(1.3e 18.5)MAE ( C) 1.6(1.2e 1.8) 1.2(0.9e 2.9)IA0.99(0.97e 0.99)0.99(0.95e 1.00)Humidity Sample number139970(8637e 8760)14574(710e 730)Mean Obs.(g kg À1)9.0(8.3e 9.9)8.4(4.3e 12.4)Mean WRF (g kg À1)9.1(8.6e 9.9)8.6(4.5e 13.3)MAE (g kg À1)0.9(0.8e 1.0) 1.1(0.7e 1.9)IA0.98(0.98e 0.99)0.98(0.75e 0.98)Wind speed Sample number138868(8467e 8752)14526(714e 730)Mean Obs.(m s À1) 2.8(1.5e 4.2)8.6(7.0e 10.7)Mean WRF (m s À1) 3.9(2.5e 4.9)9.0(6.8e 10.3)RMSE (m s À1) 2.5(1.4e 3.4) 3.2(2.2e 5.0)IA0.70(0.41e 0.83)0.90(0.73e 0.94)Wind U-component Sample number 138868(8467e 8752)14526(714e 730)Mean Obs.(m s À1)0.4(À0.3e 0.9) 1.7(À3.6e 5.3)Mean WRF (m s À1)0.7(À0.3e 1.4) 1.6(À4.8e 6.4)RMSE (m s À1) 2.5(1.6e 3.0) 3.3(2.2e 4.9)IA0.77(0.53e 0.87)0.95(0.82e 0.97)Wind V-component Sample number 138868(8467e 8752)14526(714e 730)Mean Obs.(m s À1)À0.3(À0.8e 0.3)0.1(À1.5e 1.7)Mean WRF (m s À1)À0.2(À1.0e 0.6)À0.2(À3.0e 1.8)RMSE (m s À1) 2.6(1.8e 2.8) 3.4(2.8e 4.4)IA0.78(0.52e 0.89)0.93(0.79e 0.97)Precipitation Annual Obs.(mm)2135(1458e 5316)Annual WRF (mm)1893(1169e 3505)Parenthetical values show ranges of values at the individual observatories.H.Shimadera et al./Atmospheric Environment 45(2011)6299e 63086302distribution of tree species in D4was obtained from the 1-km vegetation dataset of the 5th National Survey on the Natural Environment in Japan (http://www.biodic.go.jp/kiso/fnd_f.html ).Needle-leaved and broad-leaved forest areas account for 69and 31%of the total forest area in D4,respectively.Height of the forest canopy was assumed to be 15m.Meteorological input data,including the wind speed at the upper boundary and the liquid water content over the forest canopy,were derived from the WRF predictions at the first and second layers.Although the chemical composition of fog droplets can vary with droplet size (Herckes et al.,2002b;Fahey et al.,2005),CMAQ can predict only the bulk aqueous phase chemistry.In this study,hourly sulfur deposition through fog was estimated though multiplication of the model-predicted fog water deposition by the CMAQ-predicted concen-trations in fog.3.Results of meteorology and air quality predictions 3.1.Meteorology predictionThe performance for WRF predictions was evaluated using the mean absolute error (MAE),the root mean square error (RMSE)and the index of agreement (IA)(Willmott,1981).The statistical measures are de fined asMAE ¼1N XN i ¼1j M iÀO i j ;(12)RMSE ¼"1N XN i ¼1ðM i ÀO i Þ2#1;(13)Fog frequencyObservation WRFLiquid water contentL i q u i d w a t e r c o n t e n t (g m -3)F o g f r e q u e n c y (%)Observation WRF20042005Fig.4.Observed and WRF-predicted monthly fog frequency and mean liquid water content of fog at the Mt.Rokko fog sampling site from April 2004to March 2005.Observation (µmol L -1)Observation (µg m -3)EB Spring Summer Fall Winter EJ Spring Summer Fall WinterObservation (ppb)Observation (µmol L -1)C M A Q (µm o l L -1)C M A Q (µg m -3)C M A Q (p p b )C M A Q (µm o l L -1)abcdFig.5.Scatter plots of the observed versus CMAQ-predicted seasonal mean concentrations of (a)SO 2,(b)aerosol SO 42À,(c)SO 42Àin precipitation and (d)SO 42Àin fog for the period from April 2004to March 2005at the individual observation sites.2:1,1:2and 1:1reference lines are provided.H.Shimadera et al./Atmospheric Environment 45(2011)6299e 63086303IA ¼1ÀP Ni ¼1ðM iÀO i Þ2P Ni ¼1ðj M i ÀO j þj O i ÀO jÞ2;(14)where M and O are mean model-predicted and observed values,M i and O i are model-predicted and observed values,and N is the number of samples,respectively.Emery et al.(2001)set bench-marks with the statistical measures for the meteorology model performance:MAE 2 C and IA !0.8for temperature,MAE 2g kg À1and IA !0.6for humidity,RMSE 2m s À1and IA !0.6for wind speed.Table 2CMAQ-predicted seasonal and annual mean concentrations of sulfur compounds in the land areas in EB-D4from April 2004to March 2005.SpringSummer Fall Winter Annual SO 2(ppb)1.7(22)1.1(0) 1.1(8)0.8(18) 1.2(12)Aerosol SO 42À(m g m À3)4.5(61) 4.5(32) 2.8(47)0.8(46) 3.1(47)SO 42Àin precipitation (m mol L À1)21(38)20(16)13(21)13(36)16(28)SO 42Àin fog (m mol L À1)125(43)127(31)84(30)30(29)94(35)Parenthetical values are corresponding contribution rates of transboundary air pollution (%).Fig.6.Spatial distributions of CMAQ-predicted annual mean concentrations of (a)SO 2,(b)aerosol SO 42À,(c)SO 42Àin precipitation and (d)SO 42Àin fog from April 2004to March 2005.The results of SO 42Àconcentrations in fog are not shown in grid cells with fog frequencies <2%.H.Shimadera et al./Atmospheric Environment 45(2011)6299e 63086304Table 1summarizes WRF performance for meteorological predictions near the ground surface at the meteorological obser-vatories in D4and at 925hPa surface above the aerological obser-vatories in Japan from April 2004to March 2005.For temperature and humidity near the ground surface,the WRF predictions met the benchmarks for MAE and IA at all the meteorological observatories.The results indicate that WRF well captured variations in temper-ature and humidity associated with changes of seasons and synoptic scale factors such as passages of low pressure systems.For wind near the ground surface,while the WRF predictions met the benchmark for IA,the model performance was inferior to that for temperature and humidity.This may be attributed to the dif ficulty in predictions of weak and variable winds near the ground surface.Results of meteorology predictions in some other studies also indicated such tendencies (e.g.,Gilliam et al.,2006;Lee et al.,2007).For wind at the 925hPa surface,however,the WRF predictions wellagreed with the observations.For precipitation,WRF tended to underestimate the amounts at the meteorological observatories,but approximately captured the regional variations.Overall,WRF successfully simulated the meteorology fields from April 2004to March 2005.Fig.4shows observed and WRF-predicted monthly frequency of fog occurrence and mean liquid water content during fog events at the Mt.Rokko fog sampling site from April 2004to March 2005.The WRF predictions approximately captured monthly variations of fog frequency and liquid water content.Consequently,the predicted annual values well agreed with the observed ones,with the observed and predicted annual fog frequencies being 19%and 17%and annual mean liquid water contents being 0.15g m À3and 0.21g m À3,respectively.3.2.Air quality predictionFig.5shows scatter plots of the observed versus CMAQ-predicted seasonal mean concentrations of sulfur compounds from April 2004to March 2005.The CMAQ-predicted concentra-tions in EB were generally higher and agreed better with the observations than those in EJ,indicating that the model well simulated the transboundary air pollution.While CMAQ tended to underpredict the concentrations in the winter,most of the predicted seasonal values in EB were approximately within a factor of 2of the observations.The CMAQ performance for predictions ofSO 42Àconcentrations in fog at Mt.Rokko was comparable to that in precipitation in Japan.Table 2summarizes CMAQ-predicted seasonal and annual mean concentrations of sulfur compounds in the land areas in EB-D4andTable 3Model-predicted seasonal and annual fog frequency,liquid water content of fog,fog water deposition and precipitation in the land areas in D4from April 2004to March 2005.ElevationSpring Summer Fall Winter Annual Fog frequency (%)500m < 2.2 1.80.7 3.5 2.1!500m 13.512.410.120.914.2Liquid watercontent (g m À3)500m <0.140.130.090.130.15!500m 0.180.210.170.110.16Fog waterdeposition (mm)500m <33118!500m 35502916129Precipitation (mm)500m <5223867234822113!500m78483310858323533Fig.7.Spatial distributions of model-predicted (a)fog frequency,(b)mean liquid water content of fog,(c)annual fog water deposition and (d)annual precipitation in D4from April 2004to March 2005.The results of liquid water content are not shown in grid cells with fog frequencies <2%.H.Shimadera et al./Atmospheric Environment 45(2011)6299e 63086305corresponding contribution rates of the transboundary air pollution from April2004to March2005.Fig.6shows spatial distributions of the CMAQ-predicted annual mean concentrations of sulfur compounds for EB,EB-D4and EJ-D4.The spatial distribution of mean SO2concentration in EB-D4was similar to that in EJ-D4,particularly in and around the high SO2emission areas(Fig.2).In the CMAQ prediction,transport of an air mass from East China to the Kinki Region of Japan generally took2days or more,which was equivalent to or longer than the atmospheric lifetime of SO2suggested in other studies(e.g.,Restad et al.,1998;Tsai et al.,2010).Thesefindings indicate the large contribution of local emissions and small contri-bution of the transboundary air pollution to SO2concentration in the Kinki rge amounts of aerosol SO42À,which were primarily produced through the oxidation of SO2,were transported from the Asian Continent to Japan.Consequently,the transboundary air pollution contributed significantly to not only aerosol SO42Àconcentration but also SO42Àconcentration in precipitation and fog, particularly in the spring,in D4.The mean SO42Àconcentration in fog was approximately6times higher than that in precipitation in the land areas in EB-D4.Aikawa et al.(2001)reported that the observed concentration of chemical species in fog was approximately7times higher than that in precipitation at the Mt.Rokko fog sampling site. Thefinding indicates that the result of this study is reasonable.4.Fog water deposition in the Kinki RegionTable3summarizes model-predicted seasonal and annual fog frequency,liquid water content of fog,fog water deposition and precipitation in the land areas in D4from April2004to March2005. In order to show the importance of fog in high elevation areas, the land areas in D4were classified into two zones:the land areas with elevation<500m and the mountainous areas with elevation !500m,which respectively accounted for57and15%of D4.Fig.7 shows spatial distributions of the model-predicted annual frequency of fog occurrence,liquid water content of fog,fog water deposition and precipitation in D4.Fog frequency,fog water depo-sition and precipitation generally increased with increasing eleva-tion,with mean values of annual fog frequency,fog water deposition and precipitation in the mountainous areas with elevation!500m being6.9,17and1.7times larger than those in the land areas with elevation<500m.The results indicate that effects of fog are much more variable from region to region than those of precipitation.The values of fog frequency in wide areas of high mountains were comparable to or higher than those in Mt.Rokko,which is charac-terized by its high frequency of fog(Aikawa et al.,2001).In Kii Mts., Chugoku Mts.and Suzuka Mts.(Fig.1),annual fog frequencies at individual3-km grid cells reached up to52,49and43%,respectively.Among the four seasons,the amounts of fog deposition was the largest in the summer due to large liquid water content and thick vegetation cover,and the smallest in the winter due to small liquid water content and thin vegetation cover.Seasonal mean fog water deposition velocities in the mountainous areas with elevation !500m were14,15,14and8.4cm sÀ1in the spring,summer,fall and winter.Impaction and gravitational settling of fog droplet respectively accounted for94and6%of the total fog water deposi-tion in D4,indicating that mountain fog events with relatively high wind speed dominantly contributed to fog water deposition.Annual ratio of fog water deposition to precipitation was only1.1%in the entire D4,but was3.7%in the mountainous areas with elevation !500m.Moreover,in Mt.Rokko,Kii Mts.,Chugoku Mts.and Suzuka Mts,annual ratios of fog water deposition to precipitation at indi-vidual3-km grid cells reached up to6.0,16,10and11%,respectively.In other studies conducted in the temperate zone,observed turbulent fog water deposition velocities generally ranged from0to 10cm sÀ1at Speulderbos in the Netherlands(Vermeulen et al.,1997). Observed fog water deposition velocities generally ranged from0to 30cm sÀ1at the Waldstein research site in Germany(Klemm and Wrzesinsky,2007).Model-predicted seasonal mean fog water deposition velocities ranged from18to27cm sÀ1at Whiteface Mountain in the United States(Miller et al.,1993).Ratios of fog water deposition to precipitation in mountainous forests were3.4%at the Lägeren research site in Switzerland(Burkard et al.,2003),4.4%in Vosges Mts.in France(Herckes et al.,2002a),9.4%at the Waldstein research site in Germany(Klemm and Wrzesinsky,2007),13e25%in the Southern Appalachian Region of the United States(Shubzda et al., 1995),and22%at Whiteface Mountain in the United States(Miller et al.,1993),respectively.Although a direct comparison may not be appropriate given the differences in regions and methods,the results in this study are in the range of reported values in other studies. 5.Sulfur deposition in the Kinki RegionTable4summarizes the model-predicted seasonal and annual sulfur deposition through dry,wet and fog deposition in theland Fig.8.Spatial distributions of model-predicted annual sulfur deposition through(a)dry,(b)wet and(c)fog deposition in EB-D4from April2004to March2005.Table4Model-predicted seasonal and annual sulfur deposition through dry,wet and fogdeposition in the land areas in EB-D4from April2004to March2005.Elevation Spring Summer Fall Winter AnnualDry(mmol m)500m< 5.5(21) 4.1(1) 3.8(10) 3.9(23)17.3(14)!500m 6.1(28) 3.6(0) 4.4(13) 3.3(29)17.3(18)Wet(mmol mÀ2)500m<10.7(37)7.7(16)9.2(20) 6.3(35)33.9(27)!500m16.8(42)15.9(16)14.0(20)11.0(39)57.6(29)Fog(mmol mÀ2)500m<0.5(42)0.5(34)0.1(28)0.0(26) 1.1(37)!500m 4.2(41) 4.7(26) 2.3(29)0.4(38)11.6(32)Total(mmol mÀ2)500m<16.6(32)12.3(12)13.1(17)10.3(31)52.3(23)!500m27.0(39)24.2(15)20.6(19)14.8(36)86.5(27)Parenthetical values are corresponding contribution rates of transboundary airpollution(%).H.Shimadera et al./Atmospheric Environment45(2011)6299e63086306。