
Cite this:https://www.doczj.com/doc/9c15915208.html,mun .,2012,48,747–749Sensitive turn-on ?uorescent detection of tartrazine based on ?uorescence resonance energy transfer w
Sheng Tian Huang,ab Yan Shi,a Nian Bing Li*a and Hong Qun Luo*a
Received 25th September 2011,Accepted 11th November 2011DOI:10.1039/c1cc15959c
We introduce a sensitive,rapid,label-free and general ?uores-cent method for the determination of tartrazine by competitive binding to reduced graphene oxide (rGO)against ?uorescein,and the ?uorescence recovery upon ?uorescein desorption from rGO provides a quantitative readout for tartrazine,giving a detection limit of 0.53ng mL à1.
Tartrazine (Tz)is a kind of water-soluble synthetic azo-colorant and has been used widely in food.Synthetic food colorants have been evaluated by the Food and Agricultural Organization (FAO)and the World Health Organization (WHO)1due to the potential toxicity.A variety of analytical methods,such as chromatography,1b ,2spectrophotometry,3photoacoustic
spectroscopy,4resonance Rayleigh scattering,5
capillary electro-phoresis 6and electroanalytical techniques,7have been available for their individual or simultaneous analysis in mixtures and there is an increasing need to monitor the levels of these dyes in various products.
Graphene is an e?cient ?uorescence quencher for organic dyes with very di?erent molecular structures and absorbance/emission pro?les 8through ?uorescence resonance energy transfer (FRET).9This feature has encouraged the construction of graphene-based sensors.Recently,researches 10showed that graphene could adsorb and quench a ?uorescent-labeled ssDNA probe.Moreover,the ?uorescence could be recovered when the probe formed a duplex with its complementary strand,which released the probe from graphene sheets.The marriage of graphene with DNA,which is speci?c to proteins,small molecules,or ions and can be convenient sensing elements,11constructs a multicolor platform for the development of various biomolecule and metal ions sensors.10b ,12However,they have limited practical use due to high cost,essential label,easy hydrolyzation,and/or the use of masking agents.More recently,our group has developed a label-free reduced graphene oxide–acridine orange-based ?uorescent sensor for highly sensitive
and selective detection of hemin 13and Hg 2+.14However,there are still few reports 15on graphene-dye-based label-free optical sensors.
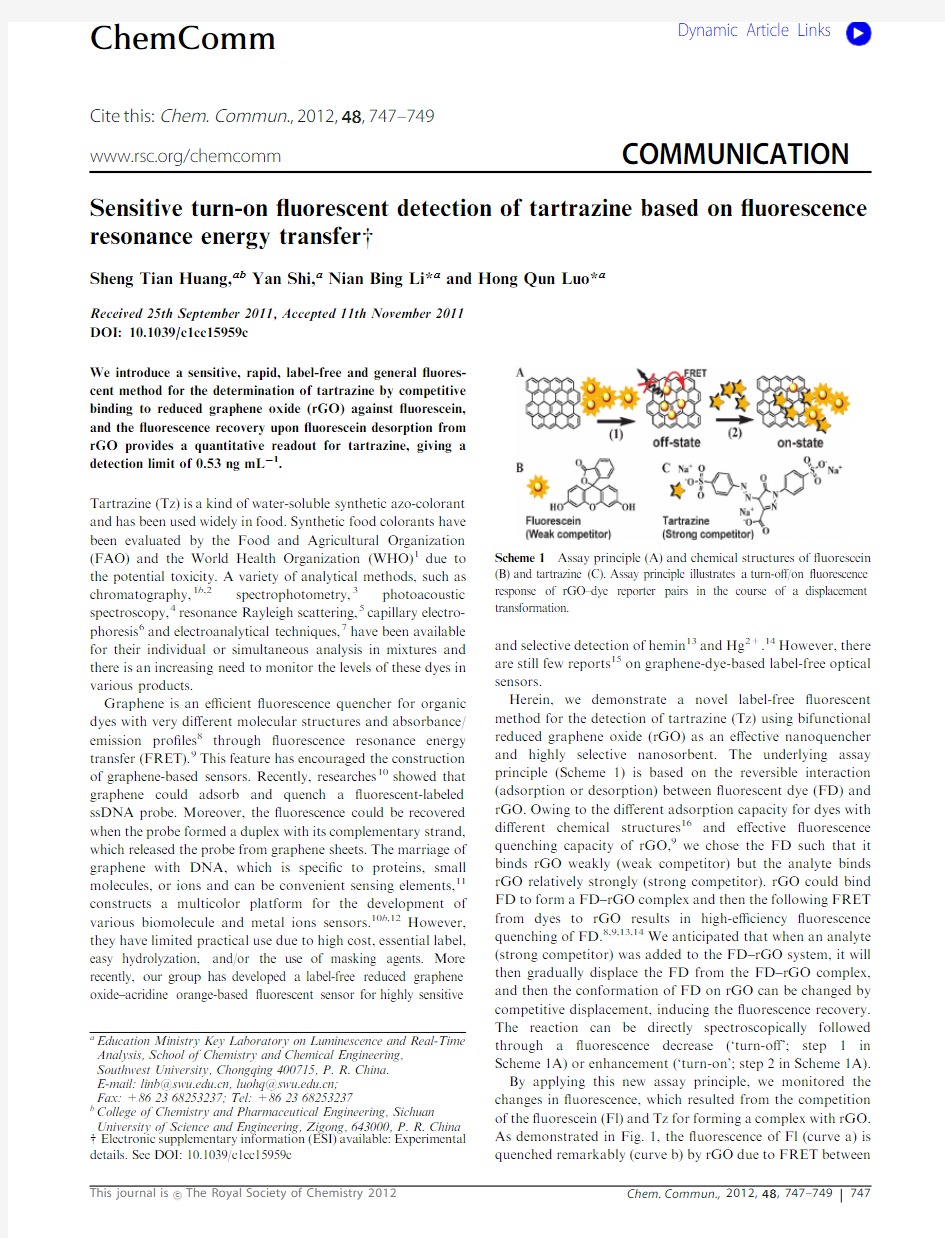
Herein,we demonstrate a novel label-free ?uorescent method for the detection of tartrazine (Tz)using bifunctional reduced graphene oxide (rGO)as an e?ective nanoquencher and highly selective nanosorbent.The underlying assay principle (Scheme 1)is based on the reversible interaction (adsorption or desorption)between ?uorescent dye (FD)and rGO.Owing to the di?erent adsorption capacity for dyes with di?erent chemical structures 16and e?ective ?uorescence quenching capacity of rGO,9we chose the FD such that it binds rGO weakly (weak competitor)but the analyte binds rGO relatively strongly (strong competitor).rGO could bind FD to form a FD–rGO complex and then the following FRET from dyes to rGO results in high-e?ciency ?uorescence quenching of FD.8,9,13,14We anticipated that when an analyte (strong competitor)was added to the FD–rGO system,it will then gradually displace the FD from the FD–rGO complex,and then the conformation of FD on rGO can be changed by competitive displacement,inducing the ?uorescence recovery.The reaction can be directly spectroscopically followed through a ?uorescence decrease (‘turn-o?’;step 1in Scheme 1A)or enhancement (‘turn-on’;step 2in Scheme 1A).By applying this new assay principle,we monitored the changes in ?uorescence,which resulted from the competition of the ?uorescein (Fl)and Tz for forming a complex with rGO.As demonstrated in Fig.1,the ?uorescence of Fl (curve a)is quenched remarkably (curve b)by rGO due to FRET between
Scheme 1Assay principle (A)and chemical structures of ?uorescein (B)and tartrazine (C).Assay principle illustrates a turn-o?/on ?uorescence response of rGO–dye reporter pairs in the course of a displacement transformation.
a
Education Ministry Key Laboratory on Luminescence and Real-Time Analysis,School of Chemistry and Chemical Engineering,Southwest University,Chongqing 400715,P.R.China.E-mail:linb@https://www.doczj.com/doc/9c15915208.html,,luohq@https://www.doczj.com/doc/9c15915208.html,;Fax:+862368253237;Tel:+862368253237b
College of Chemistry and Pharmaceutical Engineering,Sichuan
University of Science and Engineering,Zigong,643000,P.R.China w Electronic supplementary information (ESI)available:Experimental details.See DOI:10.1039/c1cc15959c
ChemComm
Dynamic Article Links
https://www.doczj.com/doc/9c15915208.html,/chemcomm
COMMUNICATION
D o w n l o a d e d b y S o u t h w e s t U n i v e r s i t y o n 17/05/2013 02:48:44. P u b l i s h e d o n 28 N o v e m b e r 2011 o n h t t p ://p u b s .r s c .o r g | d o i :10.1039/C 1C C 15959C
View Article Online / Journal Homepage / Table of Contents for this issue
Fl and rGO.The steep?uorescence enhancement(curve c)was
observed when low-microgram per liter concentration of Tz was
added in the Fl–rGO mixture.The location of the maximum of
the Fl does not change,but the intensity increases,indicating
that the conformation of Fl on rGO has been changed by Tz
displacement.Similarly,the phenomenon also happened when
using2,7-dichloro-?uorescein(DCFl)and eosin Y(EY)as the
halogen substitutes of?uorescein(Fig.S1,ESI w).Furthermore,
the e?ect of Tz on the?uorescence of Fl has been investigated
(Fig.S2,ESI w).Obviously,there is no spectroscopic overlap
between Tz and Fl(Fig.S2A,ESI w),and the addition of
increasing amounts of Tz to Fl has little e?ect on the?uores-
cence intensity of Fl(Fig.S2B,ESI w),demonstrating that there
was no interaction between Tz and Fl.Therefore,the?uores-
cence recovery was due to the replacement reaction between Tz
and Fl–rGO,namely,Tz has replaced Fl(in the Fl–rGO
complex)to form a new complex Tz–rGO and the free Fl.In
this experiment,the more Tz were added,the more free Fl were
formed,leading to the increasing?uorescence signals.Here,
?uorescence enhancement e?ciency[FEE,(IàI0)/I0]was
employed to evaluate their performance,where I0and I are
the?uorescence intensity of the Fl–rGO system in the absence
and presence of Tz,respectively.
For the Fl–rGO sensor system,we investigated its FEE by
varying the rGO concentration at a?xed concentration of Fl
(122.22ng mLà1).As shown in Fig.2,the FEE in the presence
of Tz was gradually increased with an increasing concentration
of rGO until the concentration of rGO reached2.66m g mLà1.
However,the FEE decreased when the concentration of rGO
exceeded2.66m g mLà1.The gradual enhancement of FEE was
due to that the more rGO would adsorb more Fl,leading to a
steep decrease of blank value of the Fl–rGO sensor(Fig.S3,
ESI w).However,excessive rGO can also bind Tz,which
will decrease the e?ective concentration of Tz.Therefore,
2.66m g mLà1rGO was chosen for subsequent studies.
The?uorescence intensity of?uorescein is highly pH
dependent.17The e?ect of pH of0.20mol Là1HAc-NaAc
bu?er on the FEE was investigated in the pH range from3.83
to5.41(Fig.3).The highest FEE was obtained at pH5.03.In
addition,the optimum addition amount of HAc-NaAc bu?er
was found experimentally to be150m L(Fig.S4,ESI w).
The e?ect of reagent addition order on the FEE was
investigated by?ve approaches with di?erent reagent addition
orders(Fig.S5,ESI w).The result showed that mixing bu?er
solution,Fl and rGO?rst and then adding Tz could result in
higher FEE than any other addition sequences of the reagents
(order b in Fig.S5,ESI w).A kinetic study was carried out to
record the in?uence of the incubation time on?uorescence in a
period of2min immediately after mixing di?erent amounts of
Tz with Fl–rGO(Fig.S6.ESI w).The?uorescence intensity of
the Fl–rGO sensor alone keeps almost the same all the time,
with the addition of di?erent concentrations of Tz,the
?uorescence intensity increases rapidly and reaches a plateau
in less than1min,indicating that most of the Fl molecules in
the Fl–rGO complex has been promptly replaced by Tz in the
initial stage.
The sensitivity and selectivity of the sensor for Tz detection
were then investigated.The?uorescence spectra of the mixture
in the presence of di?erent amounts of Tz are shown in Fig.4.
A linear relationship between the FEE and the concentration of Tz
(c Tz,ng mLà1)was observed in the range of2.36–236.11ng mLà1
(inset in Fig.4),where the calibration equation was(IàI0)/I0=
0.0159c Tz+0.0554(R2=0.9955).The detection limit(3s/slope)
was calculated to be0.53ng mLà1,which was much more sensitive
than that of the current analytical methods.1b,2–7The selectivity
of the Fl–rGO?uorescent sensor toward Tz relative to other
common additives of food products was also tested(Fig.5).
Of these tested substances,NaCl,KI,NaH2PO4,CaCl2,
NH4Fe(SO4)2,fructose,glucose,sucrose,lactose,citric acid, Fig.1Fluorescence emission spectra:Fl(a),Fl+rGO(b)and Fl+
rGO+Tz(c).Concentrations:Fl(122.22ng mLà1),Tz(236.11ng mLà1),
and rGO(2.66m g mLà1).0.20mol Là1HAc-NaAc bu?er,pH5.03;
reaction time:1min,excitation:480nm.Inset:the magni?ed?gure of
curves b and c.
D
o
w
n
l
o
a
d
e
d
b
y
S
o
u
t
h
w
e
s
t
U
n
i
v
e
r
s
i
t
y
o
n
1
7
/
5
/
2
1
3
2
:
4
8
:
4
4
.
P
u
b
l
i
s
h
e
d
o
n
2
8
N
o
v
e
m
b
e
r
2
1
1
o
n
h
t
t
p
:
/
/
p
u
b
s
.
r
s
c
.
o
r
g
|
d
o
i
:
1
.
1
3
9
/
C
1
C
C
1
5
9
5
9
C
sodium citrate and vitamin C exhibit lower ?uorescence response compared with Tz.Carboxymethyl cellulose (CMC)and sodium benzoate could be allowed at low concentration.Meanwhile,CMC as a stabilizer,sucrose as a typical sweetener and sodium benzoate as a preservative for beverages with high concentration 18would commonly interfere with the Tz detection.Thus a proper pretreatment or separation technology should be needed when the proposed method is put into practice.
A lemon-?avored sports drink sample was used to detect Tz according to the procedure.The sample was pretreated according to the sample preparation procedure (see ESI w ).A 46.43ng mL à1Tz was found and the determination could be made with a recovery of 97.9–104.4%and RSD of 1.9–2.4%(Table S1,ESI w ).
In summary,a novel and label-free turn-on ?uorescent method for the detection of Tz based on the Fl–rGO complex has been developed.The ?uorescence was signi?cantly quenched via FRET when ?uorescein molecules were attached to the surface of rGO nanosheets by p –p stacking interactions.Upon addition of Tz,the ?uorescence was recovered due to the competitive adsorption of rGO nanosheets between Tz and Fl.Under the optimum conditions,the detection range was
wide from 2.36to 236.11ng mL à1.The detection limit for Tz was estimated to be about 0.53ng mL à1.The proposed method showed high sensitivity,short analysis time,economy and convenient operation.What is more important is that the sensing platform is a potential assay principle for the detection of other organic molecules and biomolecules due to the di?erent adsorption capacity for multiple FD and analytes with di?erent molecular structures.
We gratefully acknowledge the National Natural Science Foundation of China (No.20975083)and the Municipal Science Foundation of Chongqing City (No.CSTC–2008BB 4013).
Notes and references
1(a )A.Downham and P.Collins,Int.J.Food Sci.Technol.,2000,35,5;(b )K.S.Minioti,C.F.Sakellariou and N.S.Thomaidis,Anal.Chim.Acta ,2007,583,103.
2(a )M.Kucharska and J.Grabka,Talanta ,2010,80,1045;(b )E.C.Vidotti,W.F.Costa and C.C.Oliveira,Talanta ,2006,68,516.
3(a )Y.N.Ni,Y.Wang and K.Serge,Talanta ,2009,78,432;(b )E.C.Vidotti,J.C.Cancino,C.C.Oliveria and M.D.C.E.Rollemberg,Anal.Sci.,2005,21,149;(c )E.Dinc,E.Baydan,M.Kanbur and F.Onur,Talanta ,2002,58,579;(d )P.L.Lopez-de-Alba,L.Lopez-Martinez,L.I.Michelini-Rodriguez,K.Wrobel,K.Wrobel and J.Amador-Hernandez,Analyst ,1997,122,1575.
4T.M.Coelho,E.C.Vidotti,M.C.Rollemberg,A.N.Medina,M.L.Baesso,N.Cella and A.C.Bento,Talanta ,2010,81,202.5Z.D.Chen,Y.Xiao,Y.B.Zeng,L.Li,Q.Y.Lu and W.J.Wang,Acta Chim.Sin.,2010,68,334.
6H.Y.Huang,Y.C.Shih and Y.C.Chen,J.Chromatogr.,A ,2002,959,317.
7(a )W.K.Zhang,T.Liu,X.J.Zheng,W.S.Huang and C.D.Wan,Colloids Surf.,B ,2009,74,28;(b )J.J.Berzas Nevado,J.Rodriguez Flores and M.J.Villasenor LLerena,Talanta ,1997,44,467;(c )P.L.Lopez-de-Alba,L.Lopez-Martinez and L.M.De-Leon-Rodriguez,Electroanalysis ,2002,14,197.8J.Kim,F.Kim and J.X.Huang,Mater.Today ,2010,13,28.9(a )R.S.Swathi and K.L.Sebastian,J.Chem.Phys.,2008,129,054703;(b )R.S.Swathi and K.L.Sebastian,J.Chem.Phys.,2009,130,086101.
10(a )S.J.He,B.Song,D.Li,C.F.Zhu,W.P.Qi,Y.Q.Wen,L.H.Wang,S.P.Song,H.P.Fang and C.H.Fan,Adv.Funct.Mater.,2010,20,453;(b )C.H.Lu,H.H.Yang,C.L.Zhu,X.Chen and G.N.Chen,Angew.Chem.,Int.Ed.,2009,48,4785.11(a )Y.L.Zhang,Y.Huang,J.H.Jiang,G.L.Shen and R.Q.Yu,J.Am.Chem.Soc.,2007,129,15448;(b )T.Hermann and D.J.Patel,Science ,2000,287,820;(c )M.A.Rahman,J.I.Son,M.S.Won and Y.B.Shim,Anal.Chem.,2009,81,6604.
12(a )H.X.Chang,L.H.Tang,Y.Wang,J.H.Jiang and J.H.Li,Anal.Chem.,2010,82,2341;(b )Y.Q.Wen,F.F.Xing,S.J.He,S.P.Song,L.H.Wang,Y.T.Long,D.Li and C.H.Fan,https://www.doczj.com/doc/9c15915208.html,mun.,2010,46,2596.
13Y.Shi,W.T.Huang,H.Q.Luo and N.B.Li,https://www.doczj.com/doc/9c15915208.html,mun.,2011,47,4676.
14W.T.Huang,Y.Shi,W.Y.Xie,H.Q.Luo and N.B.Li,https://www.doczj.com/doc/9c15915208.html,mun.,2011,47,7800.
15M.Liu,H.M.Zhao,S.Chen,H.T.Yu,Y.B.Zhang and X.Quan,https://www.doczj.com/doc/9c15915208.html,mun.,2011,47,7749.
16P.Bradder,S.K.Ling,S.B.Wang and S.M.Liu,J.Chem.Eng.Data ,2011,56,138.
17L.N.Bogdanova,N.O.Mchedlov-Petrossyan,N.A.Vodolazkaya and A.V.Lebed,Carbohydr.Res.,2010,345,1882.
18(a )J.R.Chipley,ed.A.L.Branen and P.M.Davidson,Sodium Benzoate and Benzoic Acid in Antimicrobials in Foods ,Marcel Dekker,New York,1983;(b )L.R.Vartanian,M.B.Schwartz and K.D.Brownell,Am.J.Public Health ,1997,4,667.
Fig.4Fluorescence emission spectra of the ?uorescent sensor in the presence of di?erent concentrations of Tz (from 2.36to 236.11ng mL à1).Concentrations:Fl (122.22ng mL à1),and rGO (2.66m g mL à1).Inset:calibration curve for Tz detection.
D o w n l o a d e d b y S o u t h w e s t U n i v e r s i t y o n 17/05/2013 02:48:44. P u b l i s h e d o n 28 N o v e m b e r 2011 o n h t t p ://p u b s .r s c .o r g | d o i :10.1039/C 1C C 15959C