小波分析中英文对照外文翻译文献
- 格式:doc
- 大小:134.50 KB
- 文档页数:17
小波,近似和压缩1在过去的十年里,小波在信号处理理论和实践中的影响正在变得越来越大,这是因为它们的统一的角色和成功的应用(参见这篇文章的42和38)。
位于基于小波算法核心部分的滤波器组已经在信号处理器中实现了标准化,并且在从信号压缩到调制中已经有了固定的应用。
在离散时间和连续时间信号处理之间的相互作用中常常能看到小波的贡献。
本文的目的就是从信号处理的角度来观察最近小波理论的进展。
尤其是,讨论了近似结果和压缩算法,同时也解决了新的结构和开放的问题。
基准,近似,压缩寻找一个好的能解决问题的标准至少要追溯到傅里叶和他的热方程的研究[18]。
由傅里叶提出来的级数有如下显著的特征:在一个区间内该级数能表示任何有限能量函数。
这个基函数是线性时不变系统的本征函数,换句话说,傅里叶级数就是能够对角线化的线性时不变处理器。
同样的,在采样理论中用的sinc 函数能够描述任何有限带宽的函数,并且能够以样本代替函数本身进行处理。
简而言之,一个基函数被选择出来就是为了即能够描述客观值(例如,系数较少的好的近似)又能够算出实际的值(例如,某些处理器的对角线化处理)。
为了更好的介绍,假设我们有一个函数S ,我们希望描述一个S ∈f 的元素。
例如,这个具有有限空间函数S ,在区间[]1,0上的可积函数有限平方的积分()∞<⎰dt t f 12(1)我们用()1,02L 表示。
接下来的问题就是为S 找到一个这样的基函数,也就是在S 中的一组基函数{}I i i ∈ϕ,使得任何元素S ∈f 可以被写成一个线性组合i if βα∑=(2)最接近信号处理核心的例子当然是在sinc 函数方面具有带限功能的扩展。
假设在傅里叶域使函数空间限带为[]ππ,-并且有一个有限的平方的积分。
我们表示此空间为()ππ,2-BL ,然后由香农采样定理可知在这个空间中的任何函数可以表示为[36],[28]1Martin V etterli.Wavelets Approximation, and Compression[J].IEEE SIGNAL ProcessingMagazine,2001,64(2):59-73.()()∑∞-∞=-=n nn t c t f sin α(3)()n f n =α是()t f 在整点的采样值,()()tt t c ππsin sin =(4)而且整数移位是基函数。
题目:多分辨率分析&连续小波变换TITLE: MULTIRESOLUTION ANALYSIS & THE CONTINUOUS WA VELETTRANSFORM院系:电气信息工程系专业:通信工程姓名:学号:毕业设计(论文)外文资料翻译多分辨率分析&连续小波变换多分辨率分析虽然时间和频率分辨率的问题是一种物理现象(海森堡测不准原理)无论是否使用变换,它都存在,但是它可以使用替代方法分析,称为信号多分辨率分析(MRA)。
MRA,如它的名字一样,分析了不同分辨率不同频率的信号。
每个频谱分量不能得到同样的解决是因为在STFT的情况下。
MRA是为了在高频率时,能够得到良好的时间分辨率和较差的频率分辨率,而在低频率时,能够得到良好的频率分辨率和较差的时间分辨率而设计的。
这种方法是十分有意义的,特别是当手头的信号高频成分持续时间短和低频成分持续时间长时。
幸运的是,在实际应用中所遇到的信号往往是这种类型。
例如,下面显示了这种类型的信号。
它有一个贯穿整个信号相对较低的频率分量,而在信号中间有一个短暂的、相对较高的频率成分。
连续小波变换连续小波变换作为一种替代快速傅里叶变换办法来发展,克服分析的问题。
小波分析和STFT的分析方法类似,在这个意义上说,就是信号和一个函数相乘,{\它的小波},类似的STFT的窗口功能,并转换为不同分段的时域信号。
但是,STFT和连续小波变换二者之间的主要区别是:1、Fourier转换的信号不采取窗口,因此,单峰将被视为对应一个正弦波,即负频率是没有计算。
2、窗口的宽度是相对于光谱的每一个组件变化而变化的,这是小波变换计算最重要的特征。
连续小波变换的定义如下:公式3.1从上面的方程可以看出,改变信号功能的有两个变量,τ和s,分别是转换参数和尺度参数。
psi(t)为转化功能,它被称为母小波。
母小波一词得名是由于如下所述的两个小波分析的重要性质:这个词意味着小波浪。
小指的条件是本(窗口)函数的有限长度的(紧支持)。
知识产权论文中英文对照外文翻译文献中英文对照外文翻译文献1外文参考文献译文the well-known trademarks and dilute anti-diluted First, well-known trademarks SummaryWell-known trademarks is a long-term use, in the market enjoy a high reputation, known for the relevant public and by certain procedures that the trademark. Since the "Paris Convention" was first introduced the concept of well-known trademarks, the well-known trademarks for special protection legislation has become the world trend.Paris Convention stipulates: all of the members were identified as the well-known trade marks, or registered First, the first to ban others, and the other is to prohibit the use of others with identical or similar logo. Trips further provides: 1, the Paris Convention for the special protection and extension of the services of well-known trademarks, 2, the scope of protection does not extend to prohibit similar goods or services with the well-known trademarks for use on the same or similar logo, 3, on how to That a well-known trademarks in principle a simple requirement.National legislation on the practice, the well-known trade marks that standards vary, often based on specific trade mark promotion of public awareness of related areas, logo merchandise sales and the scope of national interests, and o ther factors identified. From an international treaty to protect the well-known trademarks mind, that well-known trade marks and protection of well-known trade marks are closely linked.Second, the well-known trademarks protected modeOn the protection of the main trademarks of relative and absolute protectionism two models.The former refers to ban others with well-known trademarks identical or similar trademark with the trademark owner the same or similar industries in the registration or use of similar goods in non-use of the same or similar trademarks is permitted, "the Paris Convention "That is, relative to protectionism.While the latter refers to ban others in any industry, including the well-known trade mark goods with different or similar to those in the industry to register with the well-known trade marks and the use of the same or similar trademarks, TRIPS agreement that is taken by the expansion of the absolute protectionism.In simple economic form, as specified by the trade mark goods at a single, specific trade mark goods and the link between more closely. With, a valuable well-known trademarks have been more and more use of different types of commodities, which are among the types of goods on the property may be totally different, in a trademark associated with the commodity groups and the relative weakening of trade marks Commodity producers and the relative isolation. Not well-known trademarks such as cross-category protection and allow others to register, even if the goods obvious differences, the public will still be in the new goods and reputable well-known trademarks to establish a link between people that the goods may be well-known trademark, the new commodities , Or the well-known trademarks of goods and people between the existence of a legal, organizational or business association, thus leading to the misuse of consumers purchase. The rapid development of the commodity today, the relative protectionism has not improved the protection of the public and well-known trademark owner's interests.In view of this, in order to effectively prevent the reputation of well-known trademarks, and the identification of significant features and advertising value by the improper use of the damage, many countries on the implementation of a well-known trademarks is protectionism, which prohibits the use of any products on the same or with the well-known trademarks Similar to the trademark.TRIPS Agreement Article 16, paragraph 3 states: Paris Convention 1967 text, in principle, applicable to the well-known trademarks and logos of the commodities or services are not similar goods or services, if not similar goods or services on the use of the trademark will be Suggest that the goods or services with the well-known trademarks on a link exists, so that the interests of all well-known trademarks may be impaired.Third, the well-known trademarks dilutedThe protection of trademark rights, there are mainly two: one for the confusion theory, a theory for desalination.The main traditional trademark protection for trade marks the difference between functional design, and its theoretical basis for the theory of confusion. In summary, which is to ensure that the trademark can be identification, confirmation and different goods or services different from the significant features, to avoid confusion, deception and E Wu, the law gives first use of a person or persons registered with exclusive rights, which prohibits any Without the permission of the rights to use may cause confusion among consumers in the same or similar trademarks. Clearly, the traditional concept of trademark protection, to stop "the possibility of confusion" is the core of trademark protection.With the socio-economic development andcommercialization of the continuous improvement of the degree, well-known trademarks by the enormous implication for the growing commercial value have attracted the attention of people. Compared with ordinary marks, bearing well-known trademarks by the significance and meaning beyond the trademark rights to the general, and further symbol of product quality and credit, contains a more valuable business assets - goodwill. Well-known trade mark rights of people to use its excellent reputation of leading the way in the purchasing power, instead of the use of trademarks to distinguish between different products and producers.When the mark beyond the role of this feature to avoid confusion, then, this factor is obviously confused and can not cover everything, and other factors become as important as or more important. Thus, in theory confusion on the basis of further development of desalination theory.Trademark Dilution (dilution), also known as trademark dilution, is one of trademark infringement theory. "Watered down", according to the U.S. "anti-federal trademark law dilute" means "regardless of well-known trade mark rights and the others between the existence of competition, or existence of confusion, misunderstanding or the possibility of deception, reduce and weaken the well-known trademarks Its goods or services and the identification of significant capacity of the act. " In China, some scholars believe that "refers to dilute or weaken gradually weakened consumer or the public will be trademarks of the commercial sources with a specific link between the ability." Trademark faded and that the main theory is that many market operators have Using well-known trademarks of the desire of others, engage in well-known trademarks should be toprevent others from using its own unique identification of special protection.1927, Frank ? Si Kaite in the "Harvard Law reviews" wrote the first trademark dilute theory. He believes that people should not only be trademarks of others prohibit the use of the mark, he will compete in the commodity, and should prohibit the use of non-competitive goods on. He pointed out: the real role of trade marks, not distinguish between goods operators, but satisfied with the degree of difference between different commodities, so as to promote the continuous consumer purchase. From the basic function of trademarks, trade mark used in non-competitive goods, their satisfaction with regard to the distinction between the role of different commodities will be weakened and watered down. Trademarks of the more significant or unique, to the public the impression that the more deeply, that is, should be restricted to non-compete others in the use of goods or services.Since then, the Intellectual Property Rights Branch of the American Bar Association Chairman Thomas ? E ? Si Kaite Smith on the theory made a fu rther elaboration and development. He said: "If the courts allow or laissez-faire 'Rolls Royce' restaurants, 'Rolls-Royce' cafeteria, 'Rolls-Royce' pants, 'Rolls-Royce' the candy, then not 10 years, ' Rolls-Royce 'trademark owners will no longer have the world well-known trademarks. "Si Kaite in accordance with the theory of well-known trade marks have faded because of the effect of non-rights holders with well-known trademarks in the public mind the good image of well-known trademarks will be used in non-competitive goods, so as to gradually weaken or reduce the value of well-known trademarks, That is, by the well-known trademarks havecredibility. Trademark tag is more significant or unique characteristics, which in the public mind the impression that the more deep, more is the need for increased protection, to prevent the well-known trade marks and their specific goods was the link between the weakening or disappearance.In practice, trademarks diluted share a wide range of operating methods, such as:A well-known trademarks of others will still use as a trademark, not only in the use of the same, similar to the goods or services. For example, household appliances, "Siemens" trademark as its own production of the furniture's trademark.2. To other people's well-known trademarks as their corporate name of the component. Such as "Haier" trademark for the name of his restaurant.3. To the well-known trademarks of others as the use of domain names. For example, watches trademark "OMEGA" registered the domain name for themselves (/doc/cf12487433.html,).4. To the well-known trademarks of others as a commodity and decorating use.5. Will be others as well-known trade marks of goods or services using the common name. For example, "Kodak" interpreted as "film, is a camera with photographic material", or "film, also known as Kodak,……" This interpretation is also the mark of the water down. If the "Kodak" ignored the trademark owner, after a period of time, people will Kodak film is, the film is Kodak. In this way, the Kodak film-related goods has become the common name, it as a trademark by a significant, identifiable on limbo. The public well-known Jeep (Jeep), aspirin (Aspirin), freon (Freon), and so was the registration of foreign goods are due toimproper use and management and the protection of poor, evolved into similar products common name, Thus lost its trademark logo features.U.S. "anti-diluted Federal trademark law" before the implementation of the Federal Court of Appeal through the second from 1994 to 1996 case, identified thefollowing violations including the Trademark Dilution: (1) vague, non-means as others in similar goods not on Authorized the use of a trademark so that the sales of goods and reduce the value of trademarks or weakened (2) pale, that is because of violations related to the quality, or negative, to demonize the acts described a trademark goods may be caused to others The negative effects of the situation, (3) to belittle, or improperly changed, or derogatory way to describe a trade mark case.The majority of our scholars believe that the well-known trademarks diluted There are two main forms: watered down and defaced. The so-called dilute the people will have no right to use the same or similar trademark with the well-known trademarks used in different types of commodities, thus making the mark with the goods weakened ties between the specific acts the so-called defaced is that people will have no right to use the same Or similar marks for the well-known trade marks will have to belittle good reputation, tarnished the role of different types of goods on the act.Some scholars believe that the desalination also refers to the three aspects of well-known trademarks damage. First, in a certain way to demonize the relevant well-known trademarks; Second, some way related to well-known trademark dark; Third is the indirect way so that consumers will distort trade mark goods for the general misunderstanding of the name.In general, can be diluted in the form summarized as follows: 1, weakeningWeakening is a typical diluted form, also known as dark, is that others will have some visibility in the use of a trademark is not the same, similar to the goods or services, thereby weakening the mark with its original logo of goods or services The link between, weakening the mark was a significant and identifiable, thus bearing the trade mark by the damage caused by acts of goodwill. Weakening the mark of recognition of the significant damage is serious, it can be the recognition of trademark dilution, was significant, or even make it completely disappeared, then to the mark bycarrying the reputation of devastating combat.First, the weakening of the identification is the weakening and lower. Any unauthorized person, others will have some visibility in the use of a trademark is not the same, similar to the goods or services, will reduce its recognition of. But consumers were referred to the mark, it may no longer think of first is the original goods or services, not only is the original or goods or services, consumers simply will not even think of goods or services, but the Trademark Dilution of goods Or services. There is no doubt that this marks the recognition of, is a heavy blow.Weakening of the mark is significantly weakened and the lower. Mark is significantly different from other commercial trademark marked characteristics. A certain well-known trademarks, which in itself should be a very significant, very significant and can be quickly and other signs of its own separate. However, the Trademark Dilution of the same or similar trademarks used in different goods or services, so that was the trademark and other commercial marked difference in greatlyreduced, to the detriment of its significant.Of course, regardless of the weakening of the mark was a significant or identifiable, are the ultimate impact of the mark by the bearer of goodwill. Because the trade mark is the carrier of goodwill, the mark of any major damage, the final performance for all bearing the trade mark by the goodwill of the damage.2, tarnishedMeans others will have some well-known trademarks in the use of the good reputation of the trademark will have to belittle, defaced role of the goods or services on the act. Contaminate the trademarks of others, is a distortion of trade marks to others, the use of the damage, not only reduced the value of the mark, even on such values were defaced. As tarnished reputation is a trademark of damage, so tarnished included in the diluted acts, is also relatively accepted view. Moreover, in the field of trademark faded, tarnished than the weakening of the danger of even greater acts, the consequences are more serious.3, degradationDegradation is due to improper use of trademarks, trade mark goods for the evolution of the common name recognition and loss of function. Trademark Dilution degradation is the most serious kind. Degradation of the event, will completely lose their identification marks, no longer has the distinction function as the common name of the commodity.Fourth, protection against diluteBased on the well-known trademarks dilute the understanding, and accompanied by a serious weakening of well-known trademarks, all countries are gradually legislation to provide for the well-known trademarks to protect anti-diluted. There are specific models:1, the development of special anti-dilute the protection of well-known trademarksThe United States is taking this protection on behalf of the typical pattern.1995, in order to prevent lower dilute "the only representative of the public eye, the unique image of the trademark" to protect "the trademark value of advertising," the U.S. Congress passed the National reunification of the "anti-federal trademark law watered down", so as to the well-known trademarks All provide the unified and effective national anti-dilute the protection.U.S. anti-diluted in trademark protection has been added a new basis for litigation, which is different from the traditional basis of trademark infringement litigation. Trademark infringement of the criteria is confusing, the possibility of deception and misleading, and the Trademark Dilution criteria is unauthorized to others well-known trademarks of the public to reduce the use of the trademark instructions for goods and services only and in particular of Feelings. It is clear that the U.S. law is anti-diluted basis, "business reputation damage" and the possibility of well-known trade mark was a significant weakening of the possibility of providingrelief. Moreover, anti-faded law does not require the application of competitive relations or the existence of possible confusion, which is more conducive to the exercise of trademark right to appeal.2, through the Anti-Unfair Competition Law ProtectionSome countries apply anti-unfair competition law to protect famous trademarks from being watered down. Such as Greece, "Anti-Unfair Competition Law," the first one: "Prohibition of theUse of well-known trademarks in order to take advantage of different commodities on the well-known trademarks dilute its credibility was significant." Although some countries in the Anti-Unfair Competition Law does not explicitly prohibits trademark faded, but the Trademark Dilution proceedings, the application of unfair competition litigation.3, through or under well-known trademark protection within the scope of trademark protectionMost civil law countries is this way. 1991, "the French Intellectual Property Code," Di Qijuan trademark law section L.713-5 of the provisions that: not in similar goods or services on the use of well-known trade marks to the trademark owner or a loss caused by the improper use of trademarks , Against people should bear civil liability.Germany in 1995, "the protection of trademarks and other signs of" Article 14 also stipulates that: without the consent of the trademark rights of third parties should be banned in commercial activities, in and protected by the use of the trademark does not like similar goods or services , And the use of the trademark identical or similar to any signs.4, in the judicial precedents in the application of anti-dilute the protection ofIn some countries there are no clear legislative provisions of the anti-dilute well-known trademarks, but in judicial practice, they are generally applicable civil law on compensation for the infringement of the debt to protect the interests of all well-known trademarks, through judicial precedents to dilute the protection of applicable anti.China's well-known trademarks in the protection of the law did not "water down" the reference, but on the substance of therelevant legal provisions, protection of anti-diluted. 2001 "Trademark Law" amendment to increase the protection of well-known trademarks, in particular, it is important to the well-known trademarks have been registered to conduct cross-category protection. Article 13 stipulates: "The meeting is not the same as or similar to the trademark application for registration of goods is copied, Mofang, translation others have been registered in the well-known trademarks, misleading the public, the standard of the well-known trade mark registration may be the interests of the damage, no registration And can not be used. "But needs to be pointed out that this provision does not mean that China's laws for the well-known trademarks has provided an effective anti-dilute the protection. "Trademark Law" will prohibit only well-known trademarks and trademarks of the same or similar use, without the same or similar goods not on the behavior, but the well-known trade marks have faded in various forms, such as the well-known trademarks for names, domain names, such acts Detract from the same well-known trademarks destroyed the logo of the ability to make well-known trade mark registration of the interests of damage, this is not a legal norms.It must be pointed out that the trade mark that should be paying attention to downplay acts of the following:1, downplay acts are specifically for the well-known registered trade marks.Perpetrators diluted one of the main purpose is the free-rider, using the credibility of well-known trademarks to sell their products, and general use of trademarks do not have this value. That acts to dilute limited to well-known trademarks, can effectively protect the rights of trademark rights, have notexcessively restrict the freedom of choice of logo, is right to resolve the conflict right point of balance. "Trademark Law" will be divided into well-known trademarks have beenregistered and unregistered, and give different protection. Anti-has been watered down to protect only against the well-known trade marks registration, and for China not only well-known trade marks registered in the same or similar ban on the registration and use of goods. This reflects the "Trademark Law" the principle of protection of registered trademarks.2, faded in the different categories of goods and well-known trademarks for use on the same or similar logo.If this is the same or similar goods with well-known trademarks for use on the same or similar to the logo should be in accordance with the general treatment of trademark infringement. There is also a need to downplay the use of the tags are similar to a well-known trademarks and judgments.3, not all the non-use of similar products on the well-known trade marks and logos of the same or similar circumstances are all faded.When a trademark has not yet become well-known trademarks, perhaps there are some with the same or similar trademarks used in other types of goods on. In the well-known trademarks, the original has been in existence does not constitute a trademark of those who play down.4, acts that play down the perpetrator does not need to consider the subjective mental state.Regardless of their out of goodwill or malicious, intentional or fault, is not watered down the establishment. But the acts of subjective mental state will assume responsibility for its impact on the manner and scope. Generally speaking, if the perpetratoracts intentionally dilute the responsibility to shoulder much weight, in particular, bear a heavier responsibility for damages, if the fault is the commitment will be less responsibility. If there are no mistakes, just assume the responsibility to stop infringement.5, due to anti-faded to protect well-known trade marks with a specific goods orservices linked to well-known trademarks a long time widely used in a variety of goods, will inevitably lead to trademark the logo of a particular commodity producers play down the link, well-known trademarks A unique attraction to consumers will also be greatly reduced. So that should not be watered down to conduct a source of confusion for the conditions of goods, after all, not all the water down will cause consumers confusion. For example, a street shop's name is "Rolls-Royce fruit shop," people at this time there will be no confusion and that the shop and the famous Rolls-Royce trademark or producers of the contact. However, such acts can not be allowed, a large number of similar acts will dilute the Rolls-Royce trademark and its products linked to undermine the uniqueness of the trademark, if things continue this way when the mention of Rolls-Royce trademark, people may think of is not only Automobile, food, clothing, appliances, etc.. That faded as to cause confusion for the conditions, some will not dilute norms and suppression of acts, makes well-known trade marks are not well protected. Therefore, as long as it is a well-known trademark detract from the logo and unique ability to act on the behavior should be identified as diluted.1. Zheng Chengsi: "Intellectual property law", legal publishers 2003 version.2. Wu Handong editor: "Intellectual Property Law," China Politics and Law University Press 2002 edition.3. Susan. Sela De: "The United States Federal trademark law dilute the anti-legislation and practice," Zhang Jin Yi, contained in the "Law on Foreign Translation" 1998 No.4.4. Kong Xiangjun: "Anti-Unfair Competition AFP theory," People's Court Press, 2001 edition.5. Liu Ping, Qi Chang: "On the special protection of famous trademarks", in "law and commercial" 1998 No.6.6. Well-Tao, Lu Zhou Li: "On the well-known trademarks to protect the anti-diluted", in "Law" 1998 No. 5.2 外文参考文献原文浅谈驰名商标之淡化与反淡化一、驰名商标概述驰名商标是指经过长期使用,在市场上享有较高声誉,为相关公众所熟知,并经一定程序认定的商标。
外文文献翻译 例如例如::下面是一个样板下面是一个样板,,如需要更多的机械相关专业的外文文献可以联系QQ: 763077177 (非诚勿扰) Coating thickness effects on diamond coated cutting tools F. Qin, Y.K. Chou,D. Nolen and R.G. ThompsonAvailable online 12 June 2009. Abstract :Chemical vapor deposition (CVD)-grown diamond films have found applications as a hard coating for cutting tools. Even though the use of conventional diamond coatings seems to be accepted in the cutting tool industry, selections of proper coating thickness for different machining operations have not been often studied. Coating thickness affects the characteristics of diamond coated cutting tools in different perspectives that may mutually impact the tool performance in machining in a complex way.In this study, coating thickness effects on the deposition residual stresses, particularly around a cutting edge, and on coating failure modes were numerically investigated. On the other hand, coating thickness effects on tool surface smoothness and cutting edge radii were experimentally investigated. In addition, machining Al matrix composites using diamond coated tools with varied coating thicknesses was conducted to evaluate the effects on cutting forces, part surface finish and tool wear.The results are summarized as follows. Increasing coating thickness will increase the residual stresses at the coating–substrate interface. On the other hand, increasing coating thickness will generally increase the resistance of coating cracking and delamination. Thicker coatings will result in larger edge radii; however, the extent of the effect on cutting forces also depends upon the machining condition. For the thickness range tested, the life of diamond coated tools increases with the coating thickness because of delay of delaminations. Keywords: Coating thickness; Diamond coating; Finite element; Machining; Tool wear1. IntroductionDiamond coatings produced by chemical vapor deposition (CVD) technologies have been increasingly explored for cutting tool applications. Diamond coated tools have great potential in various machining applications and an advantage in fabrications of cutting tools with complex geometry such as drills. Increased usages of lightweight high-strength components have also resulted in significant interests in diamond coating tools. Hot-filament CVD is one of common processes of diamond coatings and diamond films as thick as 50 µm have been deposited on various materials including cobalt-cemented tungsten carbide (WC-Co) . There have also been different CVD technologies, e.g., microwave plasma assisted CVD , developed to enhance the deposition process as well as the film quality too. However, despite the superior tribological and mechanical properties, the practical applications of diamond coated tools are still limited.Coating thickness is one of the most important attributes to the coating system performance. Coating thickness effects on tribological performance have been widely studied. In general, thicker coatings exhibited better scratch/wear resistance performance than thinner ones due to their better load-carrying capacity. However, there are also reports that claim otherwise and . For example, Dorner et al. discovered, that the thickness of diamond-like-coating (DLC), in a range of 0.7–3.5 µm, does not influence the wear resistance of the DLC–Ti6Al4V . For cutting tool applications, however, coating thickness may have a more complicated role since its effects may be augmented around the cutting edge. Coating thickness effects on diamond coated tools are not frequently reported. Kanda et al. conducted cutting tests using diamond-coated tooling . The author claimed that the increased film thickness is generally favorable to tool life. However, thicker films will result in the decrease in the transverse rupture strength that greatly impacts the performance in high speed or interrupted machining. In addition, higher cutting forces were observed for the tools with increased diamond coating thickness due to the increased cutting edge radius. Quadrini et al. studied diamond coated small mills for dental applications . The authors tested different coating thickness and noted that thick coatings induce high cutting forces due to increased coating surface roughness and enlarged edge rounding. Such effects may contribute to the tool failure in milling ceramic materials. The authors further indicated tools with thin coatings results in optimal cutting of polymer matrix composite . Further, Torres et al. studied diamondcoated micro-endmills with two levels of coating thickness . The authors also indicated that the thinner coating can further reduce cutting forces which are attributed to the decrease in the frictional force and adhesion.Coating thickness effects of different coating-material tools have also been studied. For single layer systems, an optimal coating thickness may exist for machining performance. For example, Tuffy et al. reported that an optimal coating thickness of TiN by PVD technology exists for specific machining conditions . Based on testing results, for a range from 1.75 to 7.5 µm TiN coating, thickness of 3.5 µm exhibit the best turning performance. In a separate study, Malik et al. also suggested that there is an optimal thickness of TiN coating on HSS cutting tools when machining free cutting steels . However, for multilayer coating systems, no such an optimum coating thickness exists for machining performance .The objective of this study was to experimentally investigate coating thickness effects of diamond coated tools on machining performance — tool wear and cutting forces. Diamond coated tools were fabricated, by microwave plasma assisted CVD, with different coating thicknesses. The diamond coated tools were examined in morphology and edge radii by white-light interferometry. The diamond coated tools were then evaluated by machining aluminum matrix composite in dry. In addition, deposition thermal residual stresses and critical load for coating failures that affect the performance of diamond coated tools were analytically examined.2. Experimental investigationThe substrates used for diamond coating experiments, square-shaped inserts (SPG422), were fine-grain WC with 6 wt.% cobalt. The edge radius and surface textures of cutting inserts prior to coating was measured by a white-light interferometer, NT1100 from Veeco Metrology.Prior to the deposition, chemical etching treatment was conducted on inserts to remove the surface cobalt and roughen substrate surface. Moreover, all tool inserts were ultrasonically vibrated in diamond/water slurry to increase the nucleation density. For the coating process, diamond films were deposited using a high-power microwave plasma-assisted CVD process.A gas mixture of methane in hydrogen, 750–1000 sccm with 4.4–7.3% of methane/hydrogen ratio, was used as the feedstock gas. Nitrogen gas, 2.75–5.5 sccm, was inserted to obtain nanostructures by preventing columnar growth. The pressure was about 30–55 Torr and the substrate temperature was about 685–830 °C. A forward power of 4.5–5.0 kW with a low deposition rate obtained a thin coating; a greater forward power of 8.0–8.5 kW with a highdeposition rate obtained thick coatings, two thicknesses by varying deposition time. The coated inserts were further inspected by the interferometer.A computer numerical control lathe, Hardinge Cobra 42, was used to perform machining experiments, outer diameter turning, to evaluate the tool wear of diamond coated tools. With the tool holder used, the diamond coated cutting inserts formed a 0° rake angle, 11° relief angle, and 75° lead angle. The workpieces were round bars made of A359/SiC-20p composite. The machining conditions used were 4 m/s cutting speed, 0.15 mm/rev feed, 1 mm depth of cut and no coolant was applied. The selection of machining parameters was based upon previous experiences. For each coating thickness, two tests were repeated. During machining testing, the cutting inserts were periodically inspected by optical microscopy to measure the flank wear-land size. Worn tools after testing were also examined by scanning electron microscopy (SEM). In addition, cutting forces were monitored during machining using a Kistler dynamometer.5. ConclusionsIn this study, the coating thickness effects on diamond coated cutting tools were studied from different perspectives. Deposition residual stresses in the tool due to thermal mismatch were investigated by FE simulations and coating thickness effects on the interface stresses were quantified. In addition, indentation simulations of a diamond coated WC substrate with the interface modeled by the cohesive zone were applied to analyze the coating system failures. Moreover, diamond coated tools with different thicknesses were fabricated and experimentally investigated on surface morphology, edge rounding, as well as tool wear and cutting forces in machining. The major results are summarized as follows.(1) Increase of coating thickness significantly increases the interface residual stresses, though little change in bulk surface stresses.(2) For thick coatings, the critical load for coating failure decreases with increasing coating thickness. However, such a trend is opposite for thin coatings, for which radial cracking is the coating failure mode. Moreover, thicker coatings have greater delamination resistance.(3) In addition, increasing the coating thickness will increase the edge radius. However, for the coating thickness range studied, 4–29 µm, and with the large feed used, cutting forces were affected only marginally.(4) Despite of greater interface residual stresses, increasing the diamond coating thickness, for the range studied, seem to increase tool life by delay of coating delaminations.AcknowledgementsThis research is supported by National Science Foundation, Grant No.: CMMI 0728228. P. Lu provided assistance in some analyses.金刚石涂层刀具的涂层厚度的影响作者:F. Qin, Y.K. Chou,D. Nolen and R.G. Thompson发表日期:2009摘要:化学气相沉积法(CVD),金刚石薄膜的发现,作为涂层刀具的应用。
中英文对照外文翻译文献(文档含英文原文和中文翻译)原文:Profit PatternsThe most important objective of companies is to create, develop and maintain one or more competitive advantages in order to generate dividends for the shareholders. For a long time, it was simply a question of dominating the market, either by costs or by a policy of differentiation. As Michael Porter advised, it was essential to avoid being “stuck in the middle”. This way of thinking set up competitive rivalry in a closed world, and tended towards stability. This model is less and less relevant today for whole sectors of the economy. We see a multitude of strategic movements which defy the logic of the old system. “Profit Patterns” lists numerous strategies which have joined the small number that we knew before. These patterns often combine to give rise to strategic models which are better adapted to the new and changing needs of the consumer.Increasing the value of a company depends on its capacity to predict Valuemigration from one economic sector to another or from one company to another has unimaginable proportions, in particular because of the new phenomena that mass investment and venture capital represent. The public is looking for companies that will succeed in the future and bet on the winner.Major of managers have a talent for recognizing development market trends There are some changing and development trends in all business sectors. They can be erected into models, thereby making it possible to acquire a technique for predicting them. This consists of recognizing them in the actual economic context. This book proposes thirty strategic prediction models divided into seven families. Predicting is not enough: one still has to act in time! Managers analyze development trends in the environment in order to identify opportunities. They then have to determine a strategic plan for their company, and set up a system aligning the internal and external organizational structure as a function of their objectives.For most of the 20th century, mastering strategic evolution models was not a determining factor, and formulas for success were fixed and relatively simple. In industry, the basic model stated that profit was a function of relative market share. Today, this rule is confronted with more and more contradictions: among car manufacturers for example, where small companies like Toyota are more profitable than General Motors and Ford. The highest rises in value have become the exclusive right of the companies with the most efficient business designs. These upstart companies have placed themselves in the profit zone of their sectors thanks, in part, to their size, but also to their new way of doing business – exploiting new rules which are sources of value creation. Among the new rules which define a good strategic plan are:1. Strong orientation towards the customer2. Internal decisions which are coherent with the overall activity, concerning the products and services as well as the involvement in the different activities of the value chain3. An efficient mechanism for value–capture.4. A powerful source of differentiation and of strategic control, inspiring investorconfidence in future cash-flow.5. An internal organization carefully designed to support and reinforce the company’s strategic plan.Why does value migrate? The explanation lies largely in the explosion of risk-capital activities in the USA. Since the 40’s, of the many companies that have been created, about a thousand have allowed talented employees, the “brains”, to work without the heavy structures of very big companies. The risk–capital factor is now entering a new phase in the USA, in that the recipes for innovation and value creation are spreading from just the risk-capital companies to all big companies. A growing number of the 500 richest companies have an internal structure for getting into the game of investing in companies with high levels of value-creation. Where does this leave Eur ope? According to recent research, innovation in strategic thinking is under way in Europe, albeit with a slight time-lag. Globalization is making the acceptation of these value-creation rules a condition of global competitively .There is a second phenomenon that has an even more radical influence on value-creation –polarization: The combination of a convincing and innovative strategic plan, strategic control and a dominant market share creates a terrific increase in investor confidence. The investors believe that the company has established its position of strength not only for the current, but also for the next strategic cycle. The result is an exponential growth in value, and especially a spectacular out-distancing of the direct rivals. The polarization process typically has two stages. In phase 1, the competitors seem to be level. In fact, one of them has unde rstood, has “got it”, before the others and is investing in a new strategic action plan to take into account the pattern which is starting to redefine the sector. Phase 2 begins when the conditions are right for the pattern to take over: at this moment, th e competitor who “got it”, attracts the attention of customers, investors and potential recruits (the brains). The intense public attention snowballs, the market value explodes to leave the nearest competitor way behind. Examples are numerous in various sectors: Microsoft against Apple and Lotus, Coca-Cola against Pepsi, Nike against Reebok and so on. Polarization of value raises the stakes and adds a sense of urgency: The first company to anticipate market changeand to take appropriate investment decisions can gain a considerable lead thanks to recognition by the market.In a growing number of sectors today, competition is concentrated on the race towards mindshare. The company which leads this race attracts customers who attract others in an upwards spiral. At the transition from phase 1 to phase 2, the managing team’s top priority is to win the mindshare battle. There are three stages in this strategy: mind sharing with customers gives an immediate competitive advantage in terms of sales; mind sharing with investors provides the resources to maintain this advantage, and mind sharing with potential recruits increases the chances of maintaining the lead in the short and the long term. This triple capture sets off a chain reaction releasing an enormous amount of economic energy. Markets today are characterized by a staggering degree of transparency. Successes and failures are instantaneously visible to the whole world. The extraordinary success of some investors encourages professional and amateurs to look for the next hen to lay a golden egg. This investment mentality has spread to the employment market, where compensations (such as stock-options) are increasingly linked to results. From these three components - customers, investors and new talent – is created the accelerating phenomenon, polarization: thousands of investors look towards the leader at the beginning of the race. The share value goes up at the same time as the rise in customer numbers and the public perception that the current leader will be the winner. The rise in share-price gets more attention from the media, and so on. How to get the knowledge before the others, in order to launch the company into leadership? There are several attitudes, forms of behavior and knowledge that can be used: being paranoiac, thinking from day to day that the current market conditions are going to change; talking to people with different points of view; being in the field, looking for signs of change. And above all, building a research network to find the patterns of strategic change, not only in one’s particular sector, but in the whole economy, so as always to understand the patterns a bit better and a bit sooner than the competitors.Experienced managers can detect similarities between movements of value in different circumstances. 30 of these patterns can be divided into 7 categories.Some managers understand migrations of value before other managers, allowing them to continually improvise their business plan in order to find and exploit value. Experience is an obvious advantage: situations can repeat themselves or be similar to others, so that experienced managers recognize and assimilate them quickly. There about 30 patterns .which can be put into 7 groups according to their key factors. It is important to understand that the patterns have three general characteristics: multiplicity,variants and cycles. The principle of multiplicity indicates that while a sector or a company may be affected by just one simple strategic pattern, most situations are more complicated and involve several simultaneously evolving patterns. The variants to the known models are developed in different circumstances and according to the creativity of the users of the models. Studying the variants gives more finesse in model-analysis. Finally, each model depends on economic cycles which are more or less long. The time a pattern takes to develop depends on its nature and also on the nature of the customers and sector in question.1) The first family of strategic evolution patterns consists of the six “Mega patterns”: these models do not address any particular dimension of the activity (customer, channels of distribution and value chain), but have an overall and transversal influence. They owe their name “Mega” to their range and their impact (as much from the point of view of the different economic sectors as from the duration). The six Mega models are: No profit, Back to profit, Convergence, Collapse in the middle, De facto standard and Technology shifts the board. • The No profit pattern is characterized by a zero or negative result over several years in a company or economic sector. The first factor which favors this pattern is the existence of a single strategic a plan in several competitors: they all apply differentiation by price to capture market-share. The second factor is the loss of the “crutch” of the sector, that is the end of a system of the help, such as artificially maintained interest levels, or state subsidies. Among the best examples of this in the USA are in agriculture and the railway industry in the 50’s and 60’s,and in the aeronautical industry in the 80’s and 90’s.• The Back to profit pattern is characterized by the emergence of innovative strategic plans or the projects which permit the return of profits. In the 80’s, the watch industry was stagnating in a noprofits zone. The vision of Nicolas Hayek allowed Swatch and other brands to get back into a profit-making situation thanks to a products pyramid built around the new brand.The authors rightly attribute this phenomenon to investors’ recognition of the superiority of these new business designs. However this interpretation merits refinement: the superiority resides less in the companies’ current capacity to identify the first an indications of strategic discontinuity than in their future capacity to develop a portfolio of strategic options and to choose the right one at the right time. The value of a such companies as Amazon and AOL, which benefit from financial polarization, can only be explained in this way. To be competitive in the long-term, a company must not only excel in its “real” market, but also in its financial market. Competition in both is very fierce, and one can not neglect either of these fields of battle without suffering the consequences. This share-market will assume its own importance alongside the commercial market, and in the future, its successful exploitation will be a key to the strategic superiority of publicly-quoted companies.Increasing the value of a company depends on its capacity to predictValue migration from one economic sector to another or from one company to another has unimaginable proportions, in particular because of the new phenomena that mass investment and venture capital represent. The public is looking for companies that will succeed in the future and bet on the winner.Major managers have a talent for recognizing development market trendsThere are some changing and development trends in all business sectors. They can be erected into models, thereby making it possible to acquire a technique for predicting them. This consists of recognizing them in the actual economic context.Predicting is not enough: one still has to act in timeManagers analyze development trends in the environment in order to identify opportunities. They then have to determine a strategic plan for their company, and set up a system aligning the internal and external organizational structure as a function of their objectivesSource: David .J. Morrison, 2001. “Profit Patterns”. Times Business.pp.17-27.译文:利润模式一个公司价值的增长依赖于公司自身的能力的预期,价值的迁移也只是从一个经济部门转移到另外一个经济部门或者是一个公司到另外一个意想不到的公司。
附录AResearch on Linear Motor Driving System Based on Wavelet Transform Abstractend-effect is a main reason of influence on the characteristic of linear motor driving system, its direct impact is nonstableand undulate edges magnetic field. the wavelet transform is applied to analyze the linear motor driving system performance in this paper. The improving thrust response system has been presented based on choice wavelet function and wavelet transform. Simulation results indicate that the proposed control strategy can abate the thrust ripple problem caused by end effect in linear motor control system, and make the system have good performances.Keywords wavelet transform; Linear motor; End effect;Direct thrust control systemIntroductionFrance physicist Morlet first applied the wavelet to analyzing the partial characteristic of earthquake wave in 1984. Because wavelet transform is a kind of analysis method for time-scale (frequency) signal, in time-domain and frequency-domain, which has the ability of exploring signal features with partial characteristic. Therefore, in the last years, the special analysis method has made itself theories rapid development and extensive application, especially in the aspects of signal analyzing and image processing areas.Linear motor has longitudinal edge and transverse edge, for this reason the linear motor exist special end-effect. Longitudinal end-effect is caused by finite length primary iron-core. Transverse end-effect is caused by finite width of primary and secondary, secondary current and secondary plates affecting the air-gap magnetic field. This is the main difference between the linear motor and the rotating machine. Longitudinal end-effect not only causes motor losses, lower electric efficiency and thrust, but also leads to motor work characteristic aggravation. Therefore, key factor is to analyze the longitudinal end effect in this paper.Traditional analysis method, Fourier transform, has localization contradiction of time-domain and frequency-domain, some messages while analyzing nonstable signal will be usually lost. Therefore, it is necessary to researcha new method that can solve this problem reasonably and effectively so as to improve linear motor driving system performance.Single dimension continuous wavelet transform has higher sensitivity, stronger ability of denoising and lower demand of the input signal, and doesn’t need objects mathematic model. The single dimension continuous wavelet transform is used foranalysis the performance of linear motor driving system.single dimension continuous wavelet transformThe continuous wavelet sequence can be described as,)(1)(,a t a t a τψψτ-=0;R ,≠∈a a τ (1)where a is scale parameter ,τ is shift parameter. The square-integrable function )(t ψis called Mother Wavelet. A wavelet sequence can be obtained by dilation and shift transformation of the mother wavelet )(t ψ. The continuous wavelet transform ofarbitrary function)()(2R L t x ∈ is expressed by (2). t t x a t a a W T x d )(1),(⎪⎭⎫ ⎝⎛-⎰=∞∞-τψτ (2)the mother wavelet )(t ψ formed wavelet sequence has an observable window function, so )(t ψ should satisfy following constraint condition:∞<⎰∞∞-t t d )(ψ (3))(ˆωψis a continuous function which must be zero at the initial point for satisfying (2), then,0d )()0(ˆ=⎰=∞∞-t t ψψ (4) And its Fourier transform is )(ˆωψ, when )(ˆωψ fulfills the admissible condition:∞<⎰=ωωωψψd )(ˆ2R C (5)It is shown that single dimension continuous wavelet transform uses )(t ψ both scale a dilations and time τ shifts to analyze the signal. The signal is expanded in window area [δτδτ+-,]*[εωεω+-,], where δand ε represent the time-span and the frequent-span of window respectively. The time-frequency analysis is multi-resolution if varying the window area. The high frequency signal is suitably analyzed by the gradually exquisite time step, and the low frequent signal is finely analyzed by the exquisite frequency step. The windows of the time and frequency are adjusted through changing the signal frequency. Time-frequency localization analysis of signal can be achieved.ConclusionsComparing with the Fourier transform analysis method, the wavelet transform technique has the characteristics that it analyzes the signal combining time domain with frequency domain together, for this reason it can effectively solve the problem of time-domain and frequency-domain limitation. It is important to search a new method that can solve the problem in linear motor driving system so as to improve linear motor servo characteristic. Through correct choice wavelet function, it is possible to consider both the frequency spectrum of mother wavelet and the characteristics of original signal. The result of signal analyzed is beneficial for abating the end effect influence on linear motor driving system. Simulation results indicate that the proposed control strategy can reasonably and effectively abate the thrust ripple problem of linear motor control system, and make the control system have good performance. References[1]Liu Lili, Xia Jiakuan and Jiang Ping. Study on the end effect and compensationtechnique of permanent magnetic linear synchronous motor. Journal of ShenyangUniversity of Technology. Vol. 27, pp.261-266, 2005.[2]S. Nornaka, “Simplified Fourier Transform Method of LIM Analyses Based onSpace Harmoni c Method”, Linear Drives for Industry Application, pp.187-190, 1998.[3]Yoshihiko. Mori, “End-effect Analysis of Linear Induction Motor Based on theWavelet Transform Technique”, IEEE Transactions on magnetics, 35(5), pp.3739-3741, 1999.[4]Li. haodong, “Resear ch on the End-effect and Control of the PM Linear MotorUsed in the Electric Discharge Machining”, Shenyanguniversity of technology, 2003.[5]Guo. Qingding and Wang. Chengyuan and Zhou. Meiwen and Sun. Yanyu,“precision control of linear AC serve system”, Ch ina Machine Press, pp.30-37, 2000.[6]Hu. Changhua, Li. Guohua, and Liu.Tao, “The system analysis and design basedon MATLAB6.X- wavelet transform”, Xi’anuniversity of electron science & technology press, pp.15-17, 2004.[7]Liu Lifeng. Research of Direct Thrust Force Control System of Linear MotorBased on DSP. ShenyangUniversity of Technology. 2005.研究基于小波变换的直线电机驱动系统摘要年底效应是一个主要的原因的影响的特点,直线电机驱动系统,其直接影响是nonstable和起伏的边缘磁场。

毕业设计(论文)外文资料翻译专业:班级:姓名:学号:一小波研究的意义与背景在实际应用中,针对不同性质的信号和干扰,寻找最佳的处理方法降低噪声,一直是信号处理领域广泛讨论的重要问题。
目前有很多方法可用于信号降噪,如中值滤波,低通滤波,傅立叶变换等,但它们都滤掉了信号细节中的有用部分。
传统的信号去噪方法以信号的平稳性为前提,仅从时域或频域分别给出统计平均结果。
根据有效信号的时域或频域特性去除噪声,而不能同时兼顾信号在时域和频域的局部和全貌。
更多的实践证明,经典的方法基于傅里叶变换的滤波,并不能对非平稳信号进行有效的分析和处理,去噪效果已不能很好地满足工程应用发展的要求。
常用的硬阈值法则和软阈值法则采用设置高频小波系数为零的方法从信号中滤除噪声。
实践证明,这些小波阈值去噪方法具有近似优化特性,在非平稳信号领域中具有良好表现。
小波理论是在傅立叶变换和短时傅立叶变换的基础上发展起来的,它具有多分辨分析的特点,在时域和频域上都具有表征信号局部特征的能力,是信号时频分析的优良工具。
小波变换具有多分辨性、时频局部化特性及计算的快速性等属性,这使得小波变换在地球物理领域有着广泛的应用。
随着技术的发展,小波包分析(Wavelet Packet Analysis)方法产生并发展起来,小波包分析是小波分析的拓展,具有十分广泛的应用价值。
它能够为信号提供一种更加精细的分析方法,它将频带进行多层次划分,对离散小波变换没有细分的高频部分进一步分析,并能够根据被分析信号的特征,自适应选择相应的频带,使之与信号匹配,从而提高了时频分辨率。
小波包分析(wavelet packet analysis)能够为信号提供一种更加精细的分析方法,它将频带进行多层次划分,对小波分析没有细分的高频部分进一步分解,并能够根据被分析信号的特征,自适应地选择相应频带,使之与信号频谱相匹配,因而小波包具有更广泛的应用价值。
利用小波包分析进行信号降噪,一种直观而有效的小波包去噪方法就是直接对小波包分解系数取阈值,选择相关的滤波因子,利用保留下来的系数进行信号的重构,最终达到降噪的目的。
文献信息:文献标题:The Need Of Financial Statement Analysis In A Firm orAn Orgnization(企业或机构财务报表分析的必要性)国外作者:Suneetha G文献出处:《International Journal of Science Engineering and AdvanceI Technology(JSEAT)》,2017,5(6):731-735.字数统计:2541 单词,15110 字符;中文 4377 汉字外文文献:The Need Of Financial Statement AnalysisIn A Firm Or An OrgnizationAbstract Financial statement analysis play a dominate role in setting the frame watt of managerial decisions through analysis and interpretation of financial statement. This paper discusses about financial … strength and weakness of the company by properly establishing relationship between the items of balance shed and profit and loss account. In order to judge the profitability and financial soundness of the company horizontal, and vertical analyze or done. The various technique used in analyzing financial statement included 'comparative statement, common size statement, trend analysis and ratio analysis. The results suggest that the ratio approach is a highly useful tool in financial statement analysis, especially when a set of ratios is used to evaluate a firm's performance.Key words: Financial statement analysis, to evaluate a firm's performance.'Comparative statement. Common size statement, trend analysis and ratio analysis.1.IntroductionThe basis for financial analysis , planning and decision making is financial information/a business firm has to prepares its financial accounts viz., balance sheet , profit and loss account which provides useful financial information for the purpose of decision making . Financial information is needed to predict. Compare and evaluate the fin's earnings ability. The formers statements viz. profit and loss account shows that operating activities of the concern and the later balance sheet depicts the balance value of the acquired assets and of liabilities at a particular point of time. However these statements don't disclose all of the necessary for ascertaining the financial strengths and weaknesses of an enterprise. it is necessary to analyze the data depicted in the financial statements. The finance manager has certain analytical tools which helps is financial analysis and planning. [Doron nissim, stephen h. Penman, (2003), FinancialStatement Analysis of Leverage and How it Informs About Profitability and Price-to-Book Ratios. Survey of Accounting Studies, Kluwer Academic Publishers] As per examine by 'Doron Nissim. Stephen H. Penman' on Financial proclamation investigation of Leverage and how it illuminates about gainfulness and cost to book proportions, money related explanation examination that recognizes use that emerges in financing exercises from use that emerges in operations. The examination yields two utilizing conditions. one for getting to back operations and one for obtaining over the span of operations. This examination demonstrates that the budgetary explanation investigation clarifies cross-sectional contrasts in present and future rates of return and additionally cost to-snare proportions, which depend on expected rates of profit for value. This investigation helps in understanding working influence contrasts in productivity in the cross-areas. changes in future productivity from current benefit and legally binding working liabilities from evaluated liabilities. [Yating Van, H.W. Chuang,(2010) Financial Ratio Adjustment Process: Evidencefrom Taiwan and North America,1SSN 1450-2887 Issue 43 (2010)0 Euro Journals Publishing, Inc. 2010]2.Financial statements analysisIt is a process of identifying the financial strengths and weaknesses of a firm from the available accounting data and financial statements. The analysis is done by properly establishing the relationship between the items of balance sheet and profit and loss account. The first task of the financial analyst is to determine the information relevant the decision under consideration from the total information contained in financial statement. The second step is to arrange information in a way to highlight significant relationships. The final step is interpretation and drawing of inferences and conclusions. Thus financial analysis is the process of selection, relating and evaluation of the accounting data or information.Purpose of financial statements analysisFinancial statements analysis is the meaningful interpretation of 'financial statements 'for panics demanding financial information. It is not necessary for the proprietors alone. In general, the purpose of financial statements analysis is to aid decision making between the users of accounts•To evaluate past performance and financial position•To predict future performanceTools and techniques of financial analysis:•Comparative balance sheet•Common size balance sheet•Trend analysis•Ratio analysis•Comparative balance sheetComparative financial statements is a statement of the financial position of a business so designed as to facilitate comparison of different accounting variables for drawing useful inferences. Financial statements of two or more business enter prices may be compared over period of years. This is known as inter firm comparison Financial statements of the particular business enter pries may be compared over two periods of years. This is known inter period comparisonCommon size statementsIt facilities the comparison of two or more business entities with a common base .in case of balance sheet, total assets or liabilities or capital can be taken as a common base. These statements are called common measurements or components percentage or 100 percent statements. Since each statement is representated as a %of the total of 100 which in variably serves as the base.In this manner the announcements arranged to draw out the proportion of every benefit of risk to the aggregate of the monetary record and the proportion of every thing of cost or incomes to net deals known as the basic size articulations.Pattern investigationEven examination of money related explanations can likewise be completed by figuring pattern rates. Pattern rate expresses quite a long while's budgetary information as far as a base year. The base year rises to 100 %, with every single other year expressed in some rate of this baseProportion investigationProportion investigation is the technique or process by which the relationship of things or gatherings of things in the budgetary proclamations are registered. decided and introduced. Proportion investigation is an endeavor to determine quantitativemeasures or aides concerning the money related wellbeing and benefit of the business venture. Proportion investigation can be utilized both in pattern and static examination. There are a few proportions at the examiner yet the gathering of proportions he would incline toward relies upon the reason and the destinations of the investigation.Bookkeeping proportions are viable apparatuses of examination; they are pointers of administrative and over all operational productivity. Proportions, when appropriately utilized are fit for giving valuable data. proportion examination is characterized as the deliberate utilization of proportions to decipher the money related explanations with the goal that the qualities and shortcomings of a firm and in addition its chronicled execution and current monetary condition can be resolved the term proportion alludes to the numerical or quantitative connection between things factors this relationship can be communicated as:(1)Fraction(2)Percentages(3)Proportion of numbersThese option strategies for communicating things which are identified with each other are, for reason for money related investigation, alluded to as proportion examination. It ought to be seen that processing the proportion does not include any data in the figures of benefit or deals. What the proportions do is that they uncover the relationship in a more important manner in order to empower us to reach inferences from them.As indicated by look into by the Yating yang and 11.W. Chuang. on 'Monetary Ratio Adjustment Process: Evidence from Taiwan and North America'. measurable legitimacy of the proportion strategy in monetary articulation examination is researched. The outcomes hence recommend that the proportion approach is a valuable instrument in monetary explanation investigation, particularly when an arrangement of proportions is utilized to assess an association's execution. Thestraightforwardness of this strategy additionally underpins the utilization of proportions in money related basic leadership.3.Money related proportions in perspective of GAAPGAAP is the arrangement of standard systems for recording business exchanges and detailing accounting report passages. The components of GAAP incorporate norms for how to figure income, how to arrange things on a monetary record, and how to ascertain exceptional offer estimations. The models fused into (MAP give general consistency in assumes that are thusly used to ascertain imperative money related proportions that financial specialists and investigators use to assess the organization. Indeed, even agreeable monetary records can be trying to unravel, yet without a framework characterizing every class of section, corporate money related articulations would be basically dark and useless.There are seven fundamental rule that guide the foundation of the Generally Accepted Accounting Principles. The standards of normality, consistency, perpetual quality and genuineness go towards the urging organizations to utilize the same legitimate bookkeeping hones quarter after quarter in a decent confidence push to demonstrate the genuine money related state of the organization. None remuneration, judiciousness and progression build up rules for how to set up a monetary record, by and large to report the budgetary status of the organization as it is without treating resources in irregular ways that distort the operations of the organization just to balance different sections. The rule of periodicity basic implies that salary to be gotten extra time ought to be recorded as it is booked to be gotten, not in a singular amount in advance.The brought together arrangement of bookkeeping in this manner has various advantages. Not exclusively does it give a specific level of straightforwardness into an organization's funds. it likewise makes for generally simple examinations betweenorganizations. Subsequently, GAAP empowers venture by helping financial specialists pick shrewdly. GAAP gives America organizations preference over remote ones where financial specialists, unless they have a cozy comprehension of the business, may have a great deal more trouble figuring the potential dangers and prizes of a venture. GAAP applies to U.S.- based enterprises just, however every other real nation has bookkeeping measures set up for their local organizations. Now and again, remote bookkeeping is genuinely like U.S. GAAP, changing in just minor and effectively represented ways. In different cases, the models change fundamentally making direct examinations questionable, best case scenario.4.Advantages and Limitations of Financial Ratio AnalysisFinancial ratio analysis is a useful tool for users of financial statement. It has following advantages:Focal points•It improves the money related proclamations.•It helps in contrasting organizations of various size and each other.•It helps in drift examination which includes looking at a solitary organization over a period.•It highlights imperative data in basic frame rapidly. A client can judge an organization by simply taking a gander at few number as opposed to perusing of the entire monetary explanations.RestrictionsRegardless of convenience, finance.ial proportion examination has a few burdens. Some key faults of budgetary proportion examination are:•Different organizations work in various enterprises each having distinctivenatural conditions, for example, control, showcase structure, and so on. Such factors curve so huge that a correlation of two organizations from various ventures may be deceiving.•Financial bookkeeping data is influenced by assessments and presumptions. Bookkeeping principles permit diverse bookkeeping arrangements, which disables likeness and subsequently proportion examination is less helpful in such circumstances.• Ratio investigation clarifies connections between past data while clients are more worried about present and future data.The investigation helps for breaking down the alteration procedure of money related proportions; the model states three impacts which circular segment an association's interior impact, expansive impact, and key administration. It encourages us to clarify(1)That a company's budgetary proportions reflect unforeseen changes in the business.(2)Active endeavors to accomplish the coveted focus by administration and(3)An individual association's money related proportion development.DialogMonetary proclamations investigation is the way toward looking at connections among components of the organization's 'bookkeeping articulations" or money related explanations (accounting report, salary articulation. proclamation of income and the announcement of held profit) and making correlations with pertinent data. It is a significant instrument utilized by financial specialists. leasers, monetary investigators. proprietors. administrators and others in their basic leadership handle The most well known sorts of money related explanations examination curve:•Horizontal Analysis: monetary data are thought about for at least two years for asolitary organization:•Vertical Analysis: every thing on a solitary monetary explanation is figured as a rate of an aggregate for a solitary organization;•Ratio Analysis: analyze things on a solitary budgetary articulation or look at the connections between things on two monetary proclamations.Money related proportions examination is the most widely recognized type of budgetary explanations investigation. Monetary proportions delineate connections between various parts of an organization's operations and give relative measures of the company's conditions and execution. Monetary proportions may give intimations and side effects of the money related condition and signs of potential issue regions. It by and large holds no importance unless they are looked at against something else, as past execution, another organization/contender or industry normal. In this way, the proportions of firms in various enterprises, which confront distinctive conditions, are generally difficult to analyze.Money related proportions can be a critical instrument for entrepreneurs and administrators to gauge their advance toward achieving organization objectives, and toward contending with bigger organizations inside an industry; likewise, following different proportions after some time is an intense approach to recognize patterns. Proportion examination, when performed routinely after some time, can likewise give assistance independent ventures perceive and adjust to patterns influencing their operations.Money related proportions are additionally utilized by financiers. Speculators and business experts to survey different traits of an organization's monetary quality or working outcomes, this is another motivation behind why entrepreneurs need to comprehend money related proportions in light of the fact that, all the time, a business' capacity to get financing or value financing will rely upon the organization's budgetary proportions. Money related proportions are ordered by the monetary part ofthe business which the proportion measures. Liquidity proportions look at the accessibility of organization's money to pay obligation. Productivity proportions measure the organization's utilization of its benefits and control of its costs to create a satisfactory rate of return. Use proportions look at the organization's techniques for financing and measure its capacity to meet budgetary commitments. Productivity proportions measure how rapidly a firm changes over non-money resources for money resources. Market proportions measure financial specialist reaction to owning an organization's stock and furthermore the cost of issuing stock.5.ConclusionProportion Analysis is a type of Financial Statement Analysis that is utilized to acquire a snappy sign of an association's money related execution in a few key territories. Proportion investigation is utilized to assess connections among money related proclamation things. The proportions are utilized to distinguish inclines after some time for one organization or to look at least two organizations at one point in time. Money related explanation proportion investigation concentrates on three key parts of a business: liquidity, benefit, and dissolvability.The proportions are sorted as Short-term Solvency Ratios, Debt Management Ratios, and Asset Management Ratios. Productivity Ratios, and Market Value Ratios. Proportion Analysis as an instrument has a few vital elements. The information, which are given by budgetary proclamations. are promptly accessible. The calculation of proportions encourages the examination of firms which contrast in measure. Proportions can be utilized to contrast an association's money related execution and industry midpoints. What's more, proportions can be utilized as a part of a type of pattern investigation to recognize zones where execution has enhanced or crumbled after some time. Since Ratio Analysis depends on bookkeeping data, its adequacy is restricted by the bends which emerge in budgetary explanations because of such things as Historical Cost Accounting and swelling. Thusly, Ratio Analysis should justbe utilized as an initial phase in money related examination, to get a snappy sign of an association's execution and to distinguish territories which should be explored further.中文译文:企业或机构财务报表分析的必要性摘要财务报表分析在制定管理决策框架方面起着主导作用,其方法是通过对财务报表进行分析和解释。
翻译1Detecting Artifacts and Textures in Wavelet Coded Images小波编码图像的失真检测和纹理分析概述本文对一个小波编码图像的分割和分析的算法进行描述。
该算法形成的图像后处理方案,可以成功地还原压缩图像过程中纹理模糊的一部分。
该算法包括提取纹理特征,灰度(或彩色)特征和空间功能特征等等。
该算法是K均值算法的一个升华,可用来有效地分割大图像。
这种算法在分析阶段采用了以规则为基础的启发式类别来手动分割纹理相似的图片,并且可以恢复。
这种新颖的图像后处理方法需要最低限度的用户交互,并能成功利用相关纹理层次来压缩图片。
一,简介近年来,数码影像设备如数码相机,扫描仪和数字视频录像机等随着突然井喷式数字内容的创建、传输和发布而不断地被普及。
然而,这些数字内容易受人工操作的影响的,如有损压缩,在分组网络上传输等过程,从而明显降低此类数字内容的感知质量和其相关联的商业价值。
后期处理算法可以恢复和增强此类图像和视频,从而获得重要的意义。
大多数现代压缩算法运用了变换域的方法,量化这些变换系数被认为是无关紧要的感知。
通常情况下,它们是高频率系数和高压缩率,高质量的量化可以影响在压缩后的图像中的人工操作。
对于古老的JPEG压缩,这将使人工操作不流畅。
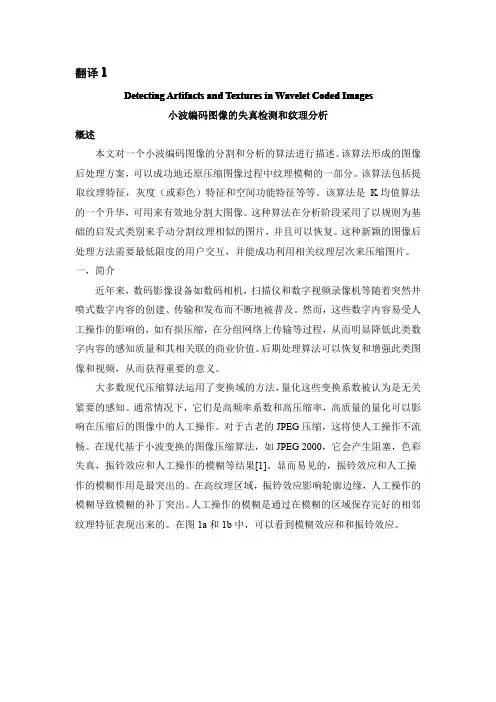
在现代基于小波变换的图像压缩算法,如JPEG2000,它会产生阻塞,色彩失真,振铃效应和人工操作的模糊等结果[1]。
显而易见的,振铃效应和人工操作的模糊作用是最突出的。
在高纹理区域,振铃效应影响轮廓边缘,人工操作的模糊导致模糊的补丁突出。
人工操作的模糊是通过在模糊的区域保存完好的相邻纹理特征表现出来的。
在图1a和1b中,可以看到模糊效应和和振铃效应。
Figure1:(a)彩色图片以未知比率压缩时的模糊效应和振铃效应(b)灰度图片以1:94比率压缩时的模糊效应和振铃效应研究者已经提出了许多不同的方法来解决振铃相应[2][3]和不同操作中的阻塞效应[4][5]。

中英文对照外文翻译文献(文档含英文原文和中文翻译)Banks analysis of financial dataAbstractA stochastic analysis of financial data is presented. In particular we investigate how the statistics of log returns change with different time delays t. The scale-dependent behaviour of financial data can be divided into two regions. The first time range, the small-timescale region (in the range of seconds) seems to be characterised by universal features. The second time range, the medium-timescale range from several minutes upwards can be characterised by a cascade process, which is given by a stochastic Markov process in the scale τ. A corresponding Fokker–Planck equation can be extracted from given data and provides a non-equilibrium thermodynamical description of the complexity of financial data.Keywords:Banks; Financial markets; Stochastic processes;Fokker–Planck equation1.IntroductionFinancial statements for banks present a different analytical problem than manufacturing and service companies. As a result, analysis of a bank’s financial statements requires a distinct approach that recognizes a bank’s somewhat unique risks.Banks take deposits from savers, paying interest on some of these accounts. They pass these funds on to borrowers, receiving interest on the loans. Their profits are derived from the spread between the rate they pay forfunds and the rate they receive from borrowers. This ability to pool deposits from many sources that can be lent to many different borrowers creates the flow of funds inherent in the banking system. By managing this flow of funds, banks generate profits, acting as the intermediary of interest paid and interest received and taking on the risks of offering credit.2. Small-scale analysisBanking is a highly leveraged business requiring regulators to dictate minimal capital levels to help ensure the solvency of each bank and the banking system. In the US, a bank’s primary regulator could be the Federal Reserve Board, the Office of the Comptroller of the Currency, the Office of Thrift Supervision or any one of 50 state regulatory bodies, depending on the charter of the bank. Within the Federal Reserve Board, there are 12 districts with 12 different regulatory staffing groups. These regulators focus on compliance with certain requirements, restrictions and guidelines, aiming to uphold the soundness and integrity of the banking system.As one of the most highly regulated banking industries in the world, investors have some level of assurance in the soundness of the banking system. As a result, investors can focus most of their efforts on how a bank will perform in different economic environments.Below is a sample income statement and balance sheet for a large bank. The first thing to notice is that the line items in the statements are not the same as your typical manufacturing or service firm. Instead, there are entries that represent interest earned or expensed as well as deposits and loans.As financial intermediaries, banks assume two primary types of risk as they manage the flow of money through their business. Interest rate risk is the management of the spread between interest paid on deposits and received on loans over time. Credit risk is the likelihood that a borrower will default onits loan or lease, causing the bank to lose any potential interest earned as wellas the principal that was loaned to the borrower. As investors, these are the primary elements that need to be understood when analyzing a bank’s financial statement.3. Medium scale analysisThe primary business of a bank is managing the spread between deposits. Basically when the interest that a bank earns from loans is greater than the interest it must pay on deposits, it generates a positive interest spread or net interest income. The size of this spread is a major determinant of the profit generated by a bank. This interest rate risk is primarily determined by the shape of the yield curve.As a result, net interest income will vary, due to differences in the timing of accrual changes and changing rate and yield curve relationships. Changes in the general level of market interest rates also may cause changes in the volume and mix of a bank’s balance sheet products. For example, when economic activity continues to expand while interest rates are rising, commercial loan demand may increase while residential mortgage loan growth and prepayments slow.Banks, in the normal course of business, assume financial risk by making loans at interest rates that differ from rates paid on deposits. Deposits often have shorter maturities than loans. The result is a balance sheet mismatch between assets (loans) and liabilities (deposits). An upward sloping yield curve is favorable to a bank as the bulk of its deposits are short term and their loans are longer term. This mismatch of maturities generates the net interest revenue banks enjoy. When the yield curve flattens, this mismatch causes net interest revenue to diminish.4.Even in a business using Six Sigma® methodology. an “optimal” level of working capital manageme nt needs to beidentified.The table below ties together the bank’s balance sheet with the income statement and displays the yield generated from earning assets and interest bearing deposits. Most banks provide this type of table in their annual reports. The following table represents the same bank as in the previous examples: First of all, the balance sheet is an average balance for the line item, rather than the balance at the end of the period. Average balances provide a better analytical framework to help understand the bank’s financial performance. Notice that for each average balance item there is a correspondinginterest-related income, or expense item, and the average yield for the time period. It also demonstrates the impact a flattening yield curve can have on a bank’s net interest income.The best place to start is with the net interest income line item. The bank experienced lower net interest income even though it had grown average balances. To help understand how this occurred, look at the yield achieved on total earning assets. For the current period ,it is actually higher than the prior period. Then examine the yield on the interest-bearing assets. It is substantially higher in the current period, causing higher interest-generating expenses. This discrepancy in the performance of the bank is due to the flattening of the yield curve.As the yield curve flattens, the interest rate the bank pays on shorter term deposits tends to increase faster than the rates it can earn from its loans. This causes the net interest income line to narrow, as shown above. One way banks try o overcome the impact of the flattening of the yield curve is to increase the fees they charge for services. As these fees become a larger portion of the bank’s income, it b ecomes less dependent on net interest income to drive earnings.Changes in the general level of interest rates may affect the volume ofcertain types of banking activities that generate fee-related income. For example, the volume of residential mortgage loan originations typically declines as interest rates rise, resulting in lower originating fees. In contrast, mortgage servicing pools often face slower prepayments when rates are rising, since borrowers are less likely to refinance. Ad a result, fee income and associated economic value arising from mortgage servicing-related businesses may increase or remain stable in periods of moderately rising interest rates.When analyzing a bank you should also consider how interest rate risk may act jointly with other risks facing the bank. For example, in a rising rate environment, loan customers may not be able to meet interest payments because of the increase in the size of the payment or reduction in earnings. The result will be a higher level of problem loans. An increase in interest rate is exposes a bank with a significant concentration in adjustable rate loans to credit risk. For a bank that is predominately funded with short-term liabilities, a rise in rates may decrease net interest income at the same time credit quality problems are on the increase.5.Related LiteratureThe importance of working capital management is not new to the finance literature. Over twenty years ago. Largay and Stickney (1980) reported that the then-recent bankruptcy of W.T. Grant. a nationwide chain of department stores. should have been anticipated because the corporation had been running a deficit cash flow from operations for eight of the last ten years of its corporate life. As part of a study of the Fortune 500’s financial management practices. Gilbert and Reichert (1995) find that accounts receivable management models are used in 59 percent of these firms to improve working capital projects. while inventory management models were used in 60 percent of the companies. More recently. Farragher. Kleiman andSahu (1999) find that 55 percent of firms in the S&P Industrial index complete some form of a cash flow assessment. but did not present insights regarding accounts receivable and inventory management. or the variations of any current asset accounts or liability accounts across industries. Thus. mixed evidence exists concerning the use of working capital management techniques.Theoretical determination of optimal trade credit limits are the subject of many articles over the years (e.g.. Schwartz 1974; Scherr 1996). with scant attention paid to actual accounts receivable management. Across a limited sample. Weinraub and Visscher (1998) observe a tendency of firms with low levels of current ratios to also have low levels of current liabilities. Simultaneously investigating accounts receivable and payable issues. Hill. Sartoris. and Ferguson (1984) find differences in the way payment dates are defined. Payees define the date of payment as the date payment is received. while payors view payment as the postmark date. Additional WCM insight across firms. industries. and time can add to this body of research.Maness and Zietlow (2002. 51. 496) presents two models of value creation that incorporate effective short-term financial management activities. However. these models are generic models and do not consider unique firm or industry influences. Maness and Zietlow discuss industry influences in a short paragraph that includes the observation that. “An industry a company is located in may ha ve more influence on that company’s fortunes than overall GNP” (2002. 507). In fact. a careful review of this 627-page textbook finds only sporadic information on actual firm levels of WCM dimensions. virtually nothing on industry factors except for some boxed items with titles such as. “Should a Retailer Offer an In-House Credit Card” (128) and nothing on WCM stability over time. This research will attempt to fill thisvoid by investigating patterns related to working capital measures within industries and illustrate differences between industries across time.An extensive survey of library and Internet resources provided very few recent reports about working capital management. The most relevant set of articles was Weisel and Bradley’s (2003) article on c ash flow management and one of inventory control as a result of effective supply chain management by Hadley (2004).6.Research MethodThe CFO RankingsThe first annual CFO Working Capital Survey. a joint project with REL Consultancy Group. was published in the June 1997 issue of CFO (Mintz and Lezere 1997). REL is a London. England-based management consulting firm specializing in working capital issues for its global list of clients. The original survey reports several working capital benchmarks for public companies using data for 1996. Each company is ranked against its peers and also against the entire field of 1.000 companies. REL continues to update the original information on an annual basis.REL uses the “cash flow from operations” value located on firm cash flow statements to estimate cash conversion efficiency (CCE). This value indicates how well a company transforms revenues into cash flow. A “days of working capital” (DWC) value is based on the dollar amount in each of the aggregate. equally-weighted receivables. inventory. and payables accounts. The “days of working capital” (DNC) represents the time period between purchase of inventory on acccount from vendor until the sale to the customer. the collection of the receivables. and payment receipt. Thus. it reflects the company’s ability to finance its core operations with vendor credit. A detailed investigation of WCM is possible because CFO also provides firmand industry values for days sales outstanding (A/R). inventory turnover. and days payables outstanding (A/P).7.Research FindingsAverage and Annual Working Capital Management Performance Working capital management component definitions and average values for the entire 1996 – 2000 period . Across the nearly 1.000 firms in the survey. cash flow from operations. defined as cash flow from operations divided by sales and referred to as “cash conversion efficiency” (CCE). averages 9.0 percent. Incorporating a 95 percent confidence interval. CCE ranges from 5.6 percent to 12.4 percent. The days working capital (DWC). defined as the sum of receivables and inventories less payables divided by daily sales. averages 51.8 days and is very similar to the days that sales are outstanding (50.6). because the inventory turnover rate (once every 32.0 days) is similar to the number of days that payables are outstanding (32.4 days). In all instances. the standard deviation is relatively small. suggesting that these working capital management variables are consistent across CFO reports.8.Industry Rankings on Overall Working Capital Management PerformanceCFO magazine provides an overall working capital ranking for firms in its survey. using the following equation:Industry-based differences in overall working capital management are presented for the twenty-six industries that had at least eight companies included in the rankings each year. In the typical year. CFO magazine ranks 970 companies during this period. Industries are listed in order of the mean overall CFO ranking of working capital performance. Since the best average ranking possible for an eight-company industry is 4.5 (this assumes that the eight companies are ranked one through eight for the entire survey). it is quite obvious that all firms in the petroleumindustry must have been receiving very high overall working capital management rankings. In fact. the petroleum industry is ranked first in CCE and third in DWC (as illustrated in Table 5 and discussed later in this paper). Furthermore. the petroleum industry had the lowest standard deviation of working capital rankings and range of working capital rankings. The only other industry with a mean overall ranking less than 100 was the Electric & Gas Utility industry. which ranked second in CCE and fourth in DWC. The two industries with the worst working capital rankings were Textiles and Apparel. Textiles rank twenty-second in CCE and twenty-sixth in DWC. The apparel industry ranks twenty-third and twenty-fourth in the two working capital measures9. Results for Bayer dataThe Kramers–Moyal coefficients were calculated according to Eqs. (5) and (6). The timescale was divided into half-open intervalsassuming that the Kramers–Moyal coefficients are constant with respect to the timescaleτin each of these subintervals of the timescale. The smallest timescale considered was 240 s and all larger scales were chosen such that τi =0.9*τi+1. The Kramers–Moyal coefficients themselves were parameterised in the following form:This result shows that the rich and complex structure of financial data, expressed by multi-scale statistics, can be pinned down to coefficients with a relatively simple functional form.10. DiscussionCredit risk is most simply defined as the potential that a bank borrower or counter-party will fail to meet its obligations in accordance with agreed terms. When this happens, the bank will experience a loss of some or all of the credit it provide to its customer. To absorb these losses, banks maintain anallowance for loan and lease losses. In essence, this allowance can be viewed as a pool of capital specifically set aside to absorb estimated loan losses. This allowance should be maintained at a level that is adequate to absorb the estimated amount of probable losses in the institution’s loan portfolio.A careful review of a bank’s financial statements can highlight the key factors that should be considered becomes before making a trading or investing decision. Investors need to have a good understanding of the business cycle and the yield curve-both have a major impact on the economic performance of banks. Interest rate risk and credit risk are the primary factors to consider as a bank’s financial performance follows the yield curve. When it flattens or becomes inverted a bank’s net interest revenue is put under greater pressure. When the yield curve returns to a more traditional shape, a bank’s net interest revenue usually improves. Credit risk can be the largest contributor to the negative performance of a bank, even causing it to lose money. In addition, management of credit risk is a subjective process that can be manipulated in the short term. Investors in banks need to be aware of these factors before they commit their capital.银行的金融数据分析摘要财务数据随机分析已经被提出,特别是我们探讨如何统计在不同时间τ记录返回的变化。
A Wavelet Based Approach for Fast Detection of Internal Fault in Power TransformersThe power transformer is one of the most expensive elements of power system and its protection is an essential part of the overall system protection strategy. The differential protection provides the best protection for power transformer. Its operation principle is based on this point that the differential current during an internal fault is higher than normal condition. But, a large transient current (inrush current) can cause mal-operation of differential relays. Then, studies for the improvement of the transformer protection have focused on discrimination between internal short circuit faults and inrush currents in transformers. The magnetizing inrush current has a large second order harmonic component in comparison to internal faults. Therefore , some transformer protection systems are designed to halt operating during the inrush current by sensing this large second order harmonic. The second harmonic component in the magnetizing inrush currents tend to be relatively small in modern large power transformers because of improvements in the power transformer core materials. Also , it has been seen that the fault current can contain higher second order harmonics than the inrush current due to nonlinear fault resistance, CT saturation .the distributed capacitance in the transmission line, which transformer is connected to, or due to the use of extra high voltage underground cables. Various methods have been suggested for overcoming this protection system mal-operation.This paper presents a wavelet based method for discrimination among inrush current, internal short circuit ,external short circuit and energizing and it is not affected by CT saturation and it is able to detect internal faults while transformer energization. Unlike Artificial Neural Network and Fuzzy logic based algorithms. This approach is not system dependent. The operating time of the scheme is less than 10ms. The Daubechies mother wavelet is used with a sample rate of 5 kHz. Then , the differential currents of the three phases are decomposed into two details and only the second level will be considered by using db5 mother wavelet.Discrete Wavelet TransformThe wavelet transform is a powerful tool to extract information from the non-stationary signals simultaneously in both time and frequency domains. The ability of the wavelet transform to focus on short time intervals for high-frequency components and long intervals for low-frequency components improves the analysisof transient phenomena signals. Various wavelet functions ,such as Symlet,Morlert and Daubechies are used to analyze different power system phenomena. The mother wavelet must be selected performed based on its application and the features of signal .which should be processed. In this paper, Daubechies wavelet is used. There are three types of wavelet transform. Which are Continuous Wavelet Transform(CWT). Discrete Wavelet Transform(DWT) and Wavelet Packet Transform(WPT). DWT is derived from CWT. Assume that x(t) is a tome variable signal, then the CWT is determined by (1):dt t t x CWT )()(),(21ατϕαατ-=*+∞∞--⎰ (1)Where, τ and α are translating and scaling parameters, respectively. Also ,)(t ϕ is the wavelet function and )(t *ϕ is the complex conjugate of )(t ϕ. Wavelet function must satisfy(2) and should have limited energy:0)(=⎰+∞∞-dt t ϕ (2)Then ,the discretized mother wavelet is as follows : )(1)(0000,m m mn m nb t t ααψαψ-= (3)Where, 0a >1 and 0b >0 and they are fixed real values. Also ,m and n are positive integers. DWT is expressed by (4):)()(),(,k k f n m f D W T kn m ∑*=ψψ (4)Where, )(,k n m *ψ is the complex conjugate of )(,k n m ψ. In (4), the motherwavelet is dilated and translated discretely by selecting α and b .m 0αα= and m nb b 00α= (5)DWT can be easily and quickly implemented by complementary low pass and high-pass filters.Proposed AlgorithmIn the proposed algorithm, the DWT is applied to the differential currents of three phases. The Daubechies Db-5 type wavelet is used as the mother wavelet and the signals are decomposed up to the second-level. Then , the spectral energy and standard deviation of the decomposed signals in the nd 2level are calculated. Theproposed method consists of two steps; detection and discrimination.Disturbance DetectionUnder normal conditions and external faults, the differential currents have smaller values than internal faults. However in some operating conditions, the external faults can result in high differential currents due to ratio mismatch of CTs or tap changes of power transformer. Then ,these conditions may cause mal-operation of the relay. Therefore ,a threshold current is used in order to prevent malfunctions caused by non-faulty currents. If one of differential currents exceeds this threshold value, it will be identified as a fault. The threshold value id defined, as follows:2)(sec .det CT per CT i i k i --+= (6)Where CT i -sec and CT per i - are the secondary and primary CT currents, respectively, and k is the slope of the differential relay characteristic. If dif i i ≤det , then the detection algorithm defines it as an internal fault.Disturbance DiscriminationIn order to classify disturbances, the differential currents are decomposed up to the second level, using Daubechies Db5 type wavelet with data window less than the half of the power frequency cycle. A sampling rate of 5 kHz, is considered for the algorithm(i.e .. 100 samples per power frequency cycle based on 50 Hz). Then, the energy and standard deviation in the second detail are calculated for each differential current. It is seen that the spectral energy as well as the standard deviation in nd 2level tends to have high values during inrush currents. Then , a discrimination index (md D )can be calculated by multiplying the spectral energy by standard deviation in the second detail for each differential current, as follows:E STD D m d *= (7)Where, STD is the standard deviation in nd 2 detail and E is its spectral energy. The STD can be determined using the following equation:M d d S T D M n m e a n n ∑=-=122)(2)( (8)Where, )(2n d is n-th coefficient from detail 2.mean d 2 is its mean value and M isthe total number of existed coefficients. Then , the spectral energy of the wavelet signal in the nd 2level is calculated by (9):21)(2∑==M n n d E (9)Then , then discrimination index (md D ) will be compared with a threshold value (Thr D ). The relay will be activated, if any one of the three-phase differential currents exceeds this threshold value(Thr D ).译文:一个基于小波变换对电力变压器内部故障快速检测的方法电力变压器是电力系统中最重要的部分之一并且其保护是整个系统的保护策略中重要组成部分。
小波分析的要点:1.目的小波分析是一个强有力的统计工具,最早使用在信号处理与分析领域中,通过对声音、图像、地震等信号进行降噪、重建、提取,从而确定不同信号的震动周期出现在哪个时间或频域上。
现在广泛的应用于很多领域。
在地学中,各种气象因子、水文过程、以及生态系统与大气之间的物质交换过程都可以看作是随时间有周期性变化的信号,因此小波分析方法同样适用于地学领域,从而对各种地学过程复杂的时间格局进行分析。
如,温度的日变化周期、年变化周期出现在哪些事件段上,在近100年中,厄尔尼诺-拉尼娜现象的变化周期及其出现的时间段,等等。
2.方法小波变换具有多分辨率分析的特点,并且在时频两域都具有表征信号局部特征的能力。
小波变换通过将时间系列分解到时间频率域内,从而得出时间系列的显著的波动模式,即周期变化动态,以及周期变化动态的时间格局(Torrence and Compo, 1998)。
小波(Wavelet),即小区域的波,是一种特殊的、长度有限,平均值为零的波形。
它有两个特点:一是“小”,二是具有正负交替的“波动性”,即直流分量为零。
小波分析是时间(空间)频率的局部化分析,它通过伸缩平移运算对信号(函数)逐步进行多尺度细化,能自动适应时频信号分析的要求,可聚焦到信号的任意细节。
小波分析将信号分解成一系列小波函数的叠加,而这些小波函数都是由一个母小波(mother wavelet)函数经过平移与尺度伸缩得来的。
用这种不规则的小波函数可以逼近那些非稳态信号中尖锐变化的部分,也可以去逼近离散不连续具有局部特性的信号,从而更为真实的反映原信号在某一时间尺度上的变化。
小波分析这种局部分析的特性使其成为对非稳态、不连续时间序列进行量化的一个有效工具(Stoy et al., 2005)。
小波是一个具有零均值且可以在频率域与时间域内进行局部化的数学函数(Grinsted et al., 2004)。
一个小波被称为母小波(mother wavelet),母小波可沿着时间指数经过平移与尺度伸缩得到一系列子小波。
中文4120字附录A 外文翻译——原文部分Prediction of Al(OH)3 fluidized roastingtemperature based on wavelet neural networkLI Jie(李劼)1, LIU Dai-fei(刘代飞)1, DAI Xue-ru(戴学儒)2, ZOU Zhong(邹忠)1, DINGFeng-qi(丁凤其)11. School of Metallurgical Science and Engineering, Central South University, Changsha 410083,China;2. Changsha Engineering and Research Institute of Nonferrous Metallurgy, Changsha 410011,China Received 24 October 2006; accepted 18 December 2006Abstract(cnki)The recycle fluidization roasting in alumina production was studied and a temperature forecast model was established based on wavelet neural network that had a momentum item and an adjustable learning rate. By analyzing the roasting process, coal gas flux, aluminium hydroxide feeding and oxygen content were ascertained as the main parameters for the forecast model. The order and delay time of each parameter in the model were deduced by F test method. With 400 groups of sample data (sampled with the period of 1.5 min) for its training, a wavelet neural network model was acquired that had a structure of {7211}, i.e., seven nodes in the input layer, twenty-one nodes in the hidden layer and one node in the output layer. Testing on the prediction accuracy of the model shows that as the absolute error ±5.0 ℃is adopted, the single-step prediction accuracy can achieve 90% and within 6 steps the multi-step forecast result of model for temperature is receivable.Key words: wavelet neural networks; aluminum hydroxide; fluidized roasting; roasting temperature; modeling; prediction1 IntroductionIn alumina production, roasting is the last process,in which the attached water is dried, crystal water is removed, and γ-Al2O3 is partly transformed into α-Al2O3.The energy consumption in the roasting process occupies about 10% of the whole energy used up in the alumina production[1] and the productivity of the roasting process directly influences the yield of alumina. As the roasting temperature is the primary factor affecting yield, quality and energy consumption, its control is very important to alumina production. If some suitable forecast model is obtained, temperature can be forecasted precisely and then measures for operation optimization can be adopted.At present, the following three kinds of fluidized roasting technology are widely used in the industry:American flash calcinations, German recycle calcinations and Danish gas suspension calcinations. For all these roasting technologies, most existing roasting temperature models are static models, such as simplematerial and energy computation models based on reaction mechanism[2]; relational equations between process parameters and the yield and the energy consumption based on regression analysis[3]; static models based on mass and energy balance and used for calculation and analysis of the process variables and the structure of every unit in the whole flow and system[4].However, all the static models have shortages in application because they cannot fully describe the characteristics of the multi-variable, non-linear and complex coupling system caused by the solid-gas roasting reactions. In the system, the flow field, the heat field, and the density field are interdependent and inter-restricted. Therefore, a temperature forecast model must have very strong dynamic construction, self-study function and adaptive ability.In this study, a roasting temperature forecast model was established based on artificial neural networks and wavelet analysis. With characteristics of strong fault tolerance, self-study ability, and non-linear mapping ability, neural network models have advantages to solve complex problems concerning inference, recognition, classification and so on. But the forecast accuracy of a neural network relies on the validity of model parameters and the reasonable choice of network architecture. At present, artificial neural networks are widely applied in metallurgy field[5−6]. Wavelet analysis, a timefrequency analysis method for signal, is named as mathematical microscope. It has multi-resolution analysis ability, especially has the ability to analyze local characteristics of a signal in both time and frequency territories. As a time and frequency localization analysis method, wavelet analysis can fix the size of analysis window, but allow the change of the shape of the analysis window. By integrating small wavelet analysis packet, the neural network structure becomes hierarchical and multiresolutional. And with the time frequency localization of wavelet analysis, the networkmodel forecast accuracy can be improved[7−10].2 Wavelet neural network algorithmsIn 1980’s, GROSSMANN and MORLET[11−13]proposed the definition of wavelet of any function f(x)∈L2(R) in a i x+b i affine group as Eqn.(1). In Eqn.(1) and Eqn.(2), the function ψ(x), which has the volatility characteristic[14], is named as Mother-wavelet. The parameters a and b mean the scaling coefficient and the shift coefficient respectively. Wavelet function can be obtained from the affine transformation of Mother-wavelet by scaling a and translating b. Theparameter 1/|a |1/2 is the normalized coefficient, as expressed in Eqn.(3):()][{}a b x x f a b a wf /)(||/1),(2/1-⎰=ψ, a ∈R +, b ∈R (x =−∞−+∞) (1))(0)(+∞--∞==⎰x dx x ψ (2) []{}a b x a x b a /)(/1)(2/1,-=ψψ(3) For a dynamic system, the observation inputs x (t ) and outputs y (t ) are defined as =t x [x(1),x(2)……x(t)],t y =[y(1),y(2)……y(t)] (4)By setting parameter t as the observation time point,the serial observation sample before t is [x t , y t ] and function y (t ), and the forecast output after t , is defined as)(),()(11t v y x g t y t t +=-- (5) If the v(t) value is tiny , function g(xt-1, yt-1) may be regarded as a forecast for function y(t).The relation between input (influence factors) and output (evaluation index) can be described by a BP neural network whose hidden function is Sigmoid type defined as Eqn.(6):)()(x s w x g i ∑=(i=0,……,N ) (6) where g (x ) is the fitting function; w i is the weight coefficient; S is the Sigmoid function; N is the node number.The wavelet neural network integrates wavelet transformation with neural network. By substituting wavelet function for Sigmoid function, the wavelet neural network has a stronger non-linearity approximation ability than BP neural network. The function expressed by wavelet neural network is realized by combining a series of wavelet. The value of y (x ) is approximated with the sum of a set of ψ(x ), as expressed in Eqn.(7):g(x)=∑-]/)[(i i i i a b x w ψ(i=0,……,N) (7) where g (x ) is the fitting function; w i is the weight coefficient; a i is the scaling coefficient; b i is the shift coefficient; N is the node number.The process of wavelet neural network identification is the calculation of parameters w i , a i and b i . With the smallest mean-square deviation energy function for the error evaluation, the optimization rule for computation is that the error approaches the minimum. By making ψ0=1, the smallest mean-square deviation energy function is shown in Eqn.(8). In this formula, K means the number of sample:E=2)]()([21x f x g j j -∑(j=1,……,k ) (8) At present, the following wavelet functions are widely used: Haar wavelet, Shannon wavelet,Mexican-hat wavelet and Morlet wavelet and so on [15].These functions can constitute standard orthogonal basis in L 2(R) by scaling and translating.In this study, a satisfactory result was obtained by applying the wavelet function expressed as Eqns.(9) and (10), which were discussed in Ref .[16].=)(x ψs(x+2)-2s(x)+s(x-2) (9)s(x)=1/(1+xe2 ) (10)3 Roasting temperature forecasting model3.1 Selection of model parametersThe roasting process includes feeding, dehydration, preheating decomposition, roasting and cooling, among which roasting temperature is the crucial operation parameter. When quality is good, low temperature is advantageous to increasing yield and decreasing consumption. The practice indicated that when temperature decreased by 100 ℃, about 3% energy could be saved[17]. There are many factors influencing on roasting, such as humidity, gas fuel quality, the ratio of air to gas fuel, feeding and furnace structure. All these factors are interdependent and inter-restricted.By analyzing the roasting process, coal gas flux,feeding and oxygen content were ascertained as the main parameters of the forecast model. The model structure is shown in Fig.1. As the actual production is a continuous process, a previous operation directly influences the present conditions of the furnace, therefore, when ascertaining the input parameters, the time succession must be taken into consideration. The parameters whose time series model orders must be determined including:temperature, coal gas flux, feeding, and oxygen content.All these parameters except temperature must have their delay time determined.Fig.1 Logic model of aluminium hydroxide roastingThe model orders of the parameters were determined by the F test method[18], which is a general statistical method and is able to compute the remarkabledegree of the variance of the loss function when the model orders of the parameters are changed. While an order increases from n1to n2(n1<n2=, the loss function E(n) decreases from E(n1) to E(n2), as shown in the following equation:t=[(E(n1)-E(n2))/E(n2)][(L-2n2)/2(n2-n1)] (11) where t is in accord with F distribution named as t−F[2(n1−n2), L−2n2].Assigning a confidence value to a, if t≤ta, namely E(n) does not decrease obviously, the order parameter n1is accepted; if t>ta, namely E(n) decreases obviously, n1may not be accepted, the order must be increased and t must be recomputed until n1 is accepted.400 groups of sample data with a sampling period of 1.5 min were used to determine the orders of the model parameters. Through computation, the orders of temperature, coal gas flux, feeding and oxygen content were 3, 2, 1 and 1 respectively, and the delay time of coal gas flux, feeding and oxygen content were 3, 5, 1 respectively. The structure of the wavelet neural network model is shown in Fig.2, and its equation is defined as follows:y(t)=WNN[y(t-1),y(t-2),y(t-3),u1(t-3),u1(t-4),u2(t-5),u3(t-1) (12) where y is the temperature;u1is the coal gas flux; u2is the feeding; u3is the oxygen content; t is the sample time.Fig.2 Structure of wavelet neural network modelThen we can deduce the neural network single-step prediction model:y m(t+1)=WNN1[y(t),y(t-1),y(t-2),u1(t-2),u1(t-3),u2(t-4),u3(t)] (13) And the multi-step prediction model isy m(t+d)=WNN d[y(t+d-1),y(t+d-2),y(t+d-3),u1(t+d-3),u1(t+d-4),u2(t+d-5),u3(t+d-1)] (14) where y m(t+1) is the prediction result for time t+1 with the sample data of time t; d is the prediction step; WNN1is the single-step prediction model; WNN d is the d-step multi-step prediction model. For the input variable in the right of Eqn.(14) [y, u1, u2, u3] whose sample time is remarked as t+d−i(i=1,2,3,4,5), if t+d−i≤t, their input values are real sample values. Whereas, if t+d−i>t, their input values as following y(t+d−i), u1(t+d−i), u2(t+d−i) and u3(t+d−i) are substituted with y m(t+d−i), u1(t), u2(t) and u3(t), respectively. Consequently, the multi-step prediction model for time t can be constructed based on one-step prediction and multi-step recurrent computation.3.2 Set-up of neural network modelAt the end of the 20th century, the approximate representation capability of neural networks had been developed greatly[19−21]. It had been proved that single-hidden-layer forward-feed neural network had the characteristics of arbitrary approximation to any non-linear mapping function. Therefore, a singlehidden-layer neural network was adopted as the temperature forecast model in this work. As the training measure, the gradient decline rule was used, in which weightiness of neural network was modified according to the δ rule. The modeling process included forward computation and error back propagation. In forward computing, the information (neuron) was transmitted from the input layer neural nodes to the output nodes through the hidden neural nodes, with each neuron only influencing the next one. If the expected error in output layer could not be obtained, error back propagation would be adopted and the weightiness of every node of the neural network would be modified. This process was repeated until the given precision was acquired.3.2.1 Network learning algorithmThe number of hidden nodes was determined with the pruning method[22]. At first, a network with its number of hidden nodes much larger than the practical requirement was used; then, according to a performance criterion equation for network, the nodes and their weightiness that had no or little contribution to the performance of the network were trimmed off; finally a suitable network structure could be obtained. In view of existing shortcomings in BP algorithm, such as easily dropping into a local minimum, slow convergence rate, and inferior anti-disturbance ability, the following improved measures were adopted.1) Attached momentum itemThe application of an attached momentum item, whose function equals to a low-frequency filter,considers not only error gradient, but also the change tendency on error curved surface, which allows the change existing in network. Without momentum function,the network may fall into a local minimum. With the use of this method in the error back propagation process, a change value in direct proportion to previous weightiness change is added to present weightiness change, which is used in the calculation of a new weightiness. The weightiness modification rule is described in Eqn.(15),where β (0<β<1= is the momentum coefficient:Δw ij (t+1)=w ij (t )-)]1()([/)(--+∂∂t w t w w t E ij ij ij βη (15)2) Adaptive adjustment of learning rateIn order to improve convergence performance in training process, a method of adaptive adjustment of learning rate was applied. The adjustment criterion was defined as follows: when the new error value becomes bigger than the old one by certain times, the learning rate will be reduced, otherwise, it may be remained invariable.When the new error value becomes smaller than the old one, the learning rate will be increased. This method can keep network learning at proper speed. This strategy is shown in Eqn.(16), in which SSE is the sum of output squared error in the output layer:η(t+1)=1.05η(t) [SSE(t+1)<SSE(t)]η(t+1)=0.70η(t) [SSE(t+1)>SSE(t)] (16) η(t+1)=1.00η(t) [SSE(t+1)=SSE(t)]3.2.2 Results of network predictionTo set up the neural network model, 450 groups of sample data were used, in which 400 groups for training and 50 groups for prediction. When the training loop times reached 22 375, the step-length-alterable training process was finished, with the network learning error E=0.01 and the finally determined structure of the network {7211}, i.e., seven nodes in the input layer, twenty-one nodes in the hidden layer and one node in the output layer. The trained network could accurately express the roasting process and would be applied forforecasting. The prediction results of the wavelet neural network are shown in Figs.3 and 4. Fig.3 indicates the change tendency of prediction error with the change of forecast step, from which it can be seen that with the forecast step increasing, the prediction error becomes bigger. And when the prediction step is lower than 6,namely, within 9 min after the last sample time, the average multi-step forecast error is less than 10 ℃. There is a satisfactory result shown in Fig.4: as an absolute error ±5.0 ℃ is adopted, the single-step prediction accuracy of wavelet neural network can achieve 90%.Furthermore, from Fig.4 it can be seen that the prediction accuracy of 6 steps is worse, but the result of 5 steps is receivable. With the model prediction, the change tendency of the roasting temperature can be forecasted. If the prediction results showing the temperature may become high or low, the roasting operation parameters can be adjusted in advance, by which the roasting energy can be saved.Fig.3Change tendency of multi-step prediction errorFig.4 Result of wavelet neural network prediction4 Conclusions1) By analyzing the sample data, coal gas flux,feeding and oxygen content are ascertained as the main parameters for the temperature forecast model. The model parameter order and delay time are deduced from F test method. Then the wavelet neural network is used to identify the roasting process. The practice application indicates this model is good in roasting temperature forecast.2) According to the process parameters analysis, the model has certain forecast ability. With forecast ability,the model provides a method for system analysis and optimization, which means that when influence factors are suitably altered, the change tendency of the roasting temperature can be analyzed. The forecast and the analysis based on the model have guiding significance for production operation.References[1] YANG Chong-yu. Process technology of alumina [M]. Beijing:Metallurgy Industry Press, 1994. (in Chinese)[2] ZHANG Li-qiang, LI Wen-chao. Establishment of some mathematicmodels for Al(OH)3 roasting [J]. Energy Saving of Non-ferrous Metallurgy, 1998, 4: 11−15. (in Chinese)[3] WEI Huang. The relations between process parameters, yield and energy consumption in the production of Al(OH)3 [J]. Light Metals,2003(1): 13−18. (in Chinese)[4] TANG Mei-qiong, LU Ji-dong, JIN Gang, HUANG Lai. Software design for Al(OH)3 circulation fluidization roasting system [J].Nonferrous Metals (Extractive Metallurgy), 2004(3): 49−52. (inChinese)[5] WANG Yu-tao, ZHOU Jian-chang, WANG Shi. Application of neural network model and temporal difference method to predict the silicon content of the hot metal [J]. Iron and Steel, 1999, 34(11):7−11. (in Chinese)[6] TU Hai, XU Jian-lun, LI Ming. Application of neural network to the forecast of heat state of a blast furnace [J]. Journal of Shanghai University (Natural Science), 1997, 3(6): 623−627. (in Chinese)[7] LU Bai-quan, LI Tian-duo, LIU Zhao-hui. Control based on BPneural networks and wavelets [J]. Journalof System Simulation,1997, 9(1): 40−48. (in Chinese)[8] CHEN Tao, QU Liang-sheng. The theory and application of multiresolution wavelet network [J]. China Mechanical Engineering,1997, 8(2): 57−59. (in Chinese)[9] ZHANG Qing-hua, BENVENISTE A. Wavelet network [J]. IEEE Transon on Neural Networks, 1992, 3(6): 889−898.[10] PATI Y C, KRISHNA P S. Analysis and synthesis of feed forward network using discrete affine wavelet transformations [J]. IEEE Transon on Neural Networks, 1993, 4(1): 73−85.[11] GROSSMANN A, MORLET J. Decomposition of hardy functions into square integrable wavelets of constant shape [J]. SIAM J Math Anal, 1984, 15(4): 723−736.[12] GROUPILLAUD P, GROSSMANN A, MORLET J. Cycle-octave and related transforms in seismic signal analysis [J]. Geoexploration,1984, 23(1): 85−102.[13] GROSSMANN A, MORLET J. Transforms associated to square integrable group representations (I): General results [J]. J Math Phys,1985, 26(10): 2473−2479.[14] ZHAO Song-nian, XIONG Xiao-yun. The wavelet transformation and the wavelet analyze [M]. Beijing: Electronics Industry Press,1996. (in Chinese)[15] NIU Dong-xiao, XING Mian. A study on wavelet neural network prediction model of time series [J]. Systems Engineering—Theory and Practice, 1999(5): 89−92. (in Chinese)[16] YAO Jun-feng, JIANG Jin-hong, MEI Chi, PENG Xiao-qi, REN Hong-jiu, ZHOU An-liang. Application of wavelet neural network in forecasting slag weight and components of copper-smelting converter[J]. Nonferrous Metals, 2001, 53(2): 42−44. (in Chinese)[17] WANG Tian-qing. Practice of lowering gaseous suspension calciner heat consumption coast [J]. Energy Saving of Non-ferrous Metallurgy, 2004, 21(4): 91−94. (in Chinese)[18] FANG Chong-zhi, XIAO De-yun. Process identification [M]. Beijing:Tsinghua University Press, 1988. (in Chinese)[19] CARROLL S M, DICKINSON B W. Construction of neural nets using the radon transform [C]// Proceedings of IJCNN. New York: IEEE Press, 1989: 607−611.[20] ITO Y. Representation of functions by superposition of a step or sigmoidal functions and their applications to neural network theory[J]. Neural Network, 1991, 4: 385−394.[21] JAROSLAW P S, KRZYSZTOF J C. On the synthesis and complexity of feedforward networks [C]// IEEE World Congress on Computational Intelligence. IEEE Neural Network, 1994:2185−2190.[22] HAYKIN S. Neural networks: A comprehensive foundation [M]. 2nd Edition. Beijing: China Machine Press, 2004.附录B外文翻译——译文基于小波神经网络的Al(OH)3流化床焙烧温度的预测李劼,刘代飞,戴学儒,邹忠,丁凤其1.中南大学冶金科学与工程学院,长沙410083,中国2.长沙有色冶金工程研究院,长沙410011,中国在氧化铝生产中的循环流态化焙烧进行了研究和温度预报模型的建立基于小波变换神经网络动量项和学习速率的可调。
Risk Analysis of the International Construction ProjectBy: Paul Stanford KupakuwanaCost Engineering Vol. 51/No. 9 September 2009ABSTRACTThis analysis used a case study methodology to analyse the issues surrounding the partial collapse of the roof of a building housing the headquarters of the Standards Association of Zimbabwe (SAZ). In particular, it examined the prior roles played by the team of construction professionals. The analysis revealed that the SAZ‟s traditional construction project was gener ally characterized by high risk. There was a clear indication of the failure of a contractor and architects in preventing and/or mitigating potential construction problems as alleged by the plaintiff. It was reasonable to conclude that between them the defects should have been detected earlier and rectified in good time before the partial roof failure. It appeared justified for the plaintiff to have brought a negligence claim against both the contractor and the architects. The risk analysis facilitated, through its multi-dimensional approach to a critical examination of a construction problem, the identification of an effective risk management strategy for future construction projects. It further served to emphasize the point that clients are becoming more demanding, more discerning, and less willing to accept risk without recompense. Clients do not want surprise, and are more likely to engage in litigation when things go wrong.KEY WORDS:Arbitration, claims, construction, contracts, litigation, project and risk The structural design of the reinforced concrete elements was done by consulting engineers Knight Piesold (KP). Quantity surveying services were provided by Hawkins, Leshnick & Bath (HLB). The contract was awarded to Central African Building Corporation (CABCO) who was also responsible for the provision of a specialist roof structure using patented “gang nail” roof trusses. The building construction proceeded to completion and was handed over to the ownerson Sept. 12, 1991. The SAZ took effective occupation of the headquarters building without a certificate of occupation. Also, the defects liability period was only three months .The roof structure was in place 10 years before partial failure in December 1999. The building insurance coverage did not cover enough, the City of Harare, a government municipality, issued the certificate of occupation 10 years after occupation, and after partial collapse of the roof .At first the SAZ decided to go to arbitration, but this failed to yield an immediate solution. The SAZ then decided to proceed to litigate in court and to bring a negligence claim against CABCO. The preparation for arbitration was reused for litigation. The SAZ‟s quantified losses stood at approximately $ 6 million in Zimbabwe dollars (US $1.2m) .After all parties had examined the facts and evidence before them, it became clear that there was a great probability that the courts might rule that both the architects and the contractor were liable. It was at this stage that the defendants‟ lawyers req uested that the matter be settled out of court. The plaintiff agreed to this suggestion, with the terms of the settlement kept confidential .The aim of this critical analysis was to analyse the issues surrounding the partial collapse of the roof of the building housing the HQ of Standard Association of Zimbabwe. It examined the prior roles played by the project management function and construction professionals in preventing/mitigating potential construction problems. It further assessed the extent to which the employer/client and parties to a construction contract are able to recover damages under that contract. The main objective of this critical analysis was to identify an effective risk management strategy for future construction projects. The importance of this study is its multidimensional examination approach.Experience suggests that participants in a project are well able to identify risks based on their own experience. The adoption of a risk management approach, based solely in pastexperience and dependant on judgement, may work reasonably well in a stable low risk environment. It is unlikely to be effective where there is a change. This is because change requires the extrapolation of past experience, which could be misleading. All construction projects are prototypes to some extent and imply change. Change in the construction industry itself suggests that past experience is unlikely to be sufficient on its own. A structured approach is required. Such a structure can not and must not replace the experience and expertise of the participant. Rather, it brings additional benefits that assist to clarify objectives, identify the nature of the uncertainties, introduces effective communication systems, improves decision-making, introduces effective risk control measures, protects the project objectives and provides knowledge of the risk history .Construction professionals need to know how to balance the contingencies of risk with their specific contractual, financial, operational and organizational requirements. Many construction professionals look at risks in dividually with a myopic lens and do not realize the potential impact that other associated risks may have on their business operations. Using a holistic risk management approach will enable a firm to identify all of the organization‟s business risks. This will increase the probability of risk mitigation, with the ultimate goal of total risk elimination .Recommended key construction and risk management strategies for future construction projects have been considered and their explanation follows. J.W. Hinchey stated that there is and can be no …best practice‟ standard for risk allocation on a high-profile project or for that matter, any project. He said, instead, successful risk management is a mind-set and a process. According to Hinchey, the ideal mind-set is for the parties and their representatives to, first, be intentional about identifying project risks and then to proceed to develop a systematic and comprehensive process for avoiding, mitigating, managing and finally allocating, by contract, those risks inoptimum ways for the particular project. This process is said to necessarily begin as a science and ends as an art .According to D. Atkinson, whether contractor, consultant or promoter, the right team needs to be assembled with the relevant multi-disciplinary experience of that particular type of project and its location. This is said to be necessary not only to allow alternative responses to be explored. But also to ensure that the right questions are asked and the major risks identified. Heads of sources of risk are said to be a convenient way of providing a structure for identifying risks to completion of a participant‟s part of the project. Effective risk management is said to require a multi-disciplinary approach. Inevitably risk management requires examination of engineering, legal and insurance related solutions .It is stated that the use of analytical techniques based on a statistical approach could be of enormous use in decision making . Many of these techniques are said to be relevant to estimation of the consequences of risk events, and not how allocation of risk is to be achieved. In addition, at the present stage of the development of risk management, Atkinson states that it must be recognized that major decisions will be made that can not be based solely on mathematical analysis. The complexity of construction projects means that the project definition in terms of both physical form and organizational structure will be based on consideration of only a relatively small number of risks . This is said to then allow a general structured approach that can be applied to any construction project to increase the awareness of participants .The new, simplified Construction Design and Management Regulations(CDM Regulations) which came in to force in the UK in April 2007, revised and brought together the existing CDM 1994 and the Construction Health Safety and Welfare(CHSW) Regulations 1996, into a single regulatory package.The new CDM regulations offer an opportunity for a step change in health and safety performance and are used to reemphasize the health, safety and broader business benefits of a well-managed and co-ordinated approach to the management of health and safety in construction.I believe that the development of these skills is imperative to provide the client with the most effective services available, delivering the best value project possible.Construction Management at Risk (CM at Risk), similar to established private sector methods of construction contracting, is gaining popularity in the public sector. It is a process that allows a client to select a construction manager (CM) based on qualifications; make the CM a member of a collaborative project team; centralize responsibility for construction under a single contract; obtain a bonded guaranteed maximum price; produce a more manageable, predictable project; save time and money; and reduce risk for the client, the architect and the CM.CM at Risk, a more professional approach to construction, is taking its place along with design-build, bridging and the more traditional process of design-bid-build as an established method of project delivery.The AE can review the CM‟s approach to the work, making helpful recommendations. The CM is allowed to take bids or proposals from subcontractors during completion of contract documents, prior to the guaranteed maximum price (GMP), which reduces the CM‟s risk and provides useful input to design. The procedure is more methodical, manageable, predictable and less risky for all.The procurement of construction is also more business-like. Each trade contractor has a fair shot at being the low bidder without fear of bid shopping. Each must deliver the best to get the projec. Competition in the community is more equitable: all subcontractors have a fair shot at the work .A contingency within the GMP covers unexpected but justifiable costs, and a contingency above the GMP allows for client changes. As long as the subcontractors are within the GMP they are reimbursed to the CM, so the CM represents the client in negotiating inevitable changes with subcontractors.There can be similar problems where each party in a project is separately insured. For this reason a move towards project insurance is recommended. The traditional approach reinforces adversarial attitudes, and even provides incentives for people to overlook or conceal risks in an attempt to avoid or transfer responsibility.A contingency within the GMP covers unexpected but justifiable costs, and a contingency above the GMP allows for client changes. As long as the subcontractors are within the GMP they are reimbursed to the CM, so the CM represents the client in negotiating inevitable changes with subcontractors.There can be similar problems where each party in a project is separately insured. For this reason a move towards project insurance is recommended. The traditional approach reinforces adversarial attitudes, and even provides incentives for people to overlook or conceal risks in an attempt to avoid or transfer responsibility.It was reasonable to assume that between them the defects should have been detected earlier and rectified in good time before the partial roof failure. It did appear justified for the plaintiff to have brought a negligence claim against both the contractor and the architects.In many projects clients do not understand the importance of their role in facilitating cooperation and coordination; the design is prepared without discussion between designers, manufacturers, suppliers and contractors. This means that the designer can not take advantage of suppliers‟ or contractors‟ knowledge of build ability or maintenance requirements and the impact these have on sustainability, the total cost of ownership or health and safety .This risk analysis was able to facilitate, through its multi-dimensional approach to a critical examination of a construction problem, the identification of an effective risk management strategy for future construction projects. This work also served to emphasize the point that clients are becoming more demanding, more discerning, and less willing to accept risk without recompense. They do not want surprises, and are more likely to engage in litigation when things go wrong.中文译文:国际建设工程风险分析保罗斯坦福库帕库娃娜工程造价卷第五十一期2009年9月9日摘要此次分析用实例研究方法分析津巴布韦标准协会总部(SAZ)的屋顶部分坍塌的问题。
Differences in Pulse Spectrum Analysis Between Atopic Dermatitis and Nonatopic Healthy ChildrenAbstractObjectives: Atopic dermatitis (AD) is a common allergy that causes the skin to be dry and itchy. It appears at an early age, and is closely associated with asthma and allergic rhinitis. Thus, AD is an indicator that other allergies may occur later. Literatures indicate that the molecular basis of patients with AD is different from that of healthy individuals. According to the classics of Traditional Chinese Medicine, the body constitution of patients with AD is also different. The purpose of this study is to determine the differences in pulse spectrum analysis between patients with AD and nonatopic healthy individuals.Methods: A total of 60 children (30 AD and 30 non-AD) were recruited for this study.A pulse spectrum analyzer (SKYLARK PDS-2000 Pulse Analysis System) was used to measure radial arterial pulse waves of subjects.Original data were then transformed to frequency spectrum by Fourier transformation. The relative strength of each harmonic wave was calculated. Moreover, the differences of harmonic values between patients with AD and non-atopic healthy individuals were compared and contrasted.Results: This study showed that harmonic values and harmonic percentage of C3 (Spleen Meridian, according to Wang’s hypothesis) were significantly different. Conclusions: These results demonstrate that C3 (Spleen Meridian) is a good index for the determination of atopic dermatitis. Furthermore, this study demonstrates that the pulse spectrum analyzer is a valuable auxiliary tool to distinguish a patient who has probable tendency to have AD and/or other allergic diseases.IntroductionAtopic dermatitis (AD) is a common pruritic chronic inflammatory allergic disease. Approximately 10% of all children in the world are affected by atopicdermatitis,typically in the setting of a personal or family history of asthma or allergic rhinitis. It occurs in infancy and early childhood. Sixty percent (60%) of the symptoms manifest in the first year of life, and 85% by 5 years of age. Early onset and close association with other atopic conditions, such as asthma and allergic rhinitis, make atopic dermatitis an excellent indicator that other allergies may occur later.A number of observations suggest that there is a molecular basis for atopic dermatitis; these include the findings of genetic susceptibility, immune system deviation, and epidermal barrier dysfunction. Moreover, according to the classics of Traditional Chinese Medicine, the body constitution of atopic dermatitis patients was also different. Establishment of scientific methods using pulse diagnosis will assistthe diagnosis and follow-up of AD."Organs Resonance"brought up by Wei-Kung Wang provided a scientific explanation for "pulse condition" and "Qi." Organs, heart, and vessels can produce coupled oscil-lation, which minimize the resistance of blood flow, resulting in better circulation. The changes of radial arterial pulse spectrum can reflect the harmonic energy redistribution of a specific organ. Several of the previous studies demonstrate that variations in the harmonics of pulse spectrum can be used in many fields, including diseases, acupuncture,Chinese herbal medications and clinical observation. The new method offers an extraordinary vision of medical investigation by combining pulse spectrum analysis with Traditional Chinese Medicine as well as modern medicine. Wang proposed that the peak values of numbered harmonics might be the representations of each visceral organ,C1 for Liver, C2 for Kidney, C3 for Spleen, etc.Materials and MethodsSubjectsIn total, 60 children (3–15 years of age), comprising 30 with AD (AD group) and 30 nonatopic healthy (non-AD group),participated in the study. The diagnosis of AD was based on the criteria defined by the United Kingdom working party.Nonatopic healthy was defined as those who had no known health problems and no personal or family history of allergic diseases, such as asthma, allergic rhinitis, etc.The experiment protocol was approved by the Institutional Review Board of China Medical University (approval number: DMR97-IRB-087). The written informed consents were obtained from the parents of all participants before they enrolled in this study.Children with a history of major chronic diseases, such as arrhythmia, ardiomyopathy, hypertension, diabetes mellitus, chronic renal failure, hyperthyroidism, difficult asthma,malignancy, and so on were excluded from this study.Those who suffered from any acute disease (e.g., acute upper airway infection or acute gastroenteritis in recent 7days), were also excluded from this experiment. Radial arterial pulse testA pulse spectrum analyzer (SKYLARK PDS-2000 Pulse Analysis System, approved by Department of Health, Executive Yuan, R.O.C. [Taiwan] with a license number 0023302) was used to record radial arterial pulse waves. The pressure transducer of the pulse spectrum analyzer detected artery pressure pulse with 100-Hz sampling rate and 25mm/ sec scanning rate. The output data were stored in digital form in an IBM PC. The subjects were asked to rest for 20 minutes prior to pulse measurements. All procedures were performed in a bright and quiet room with a constant temperature of 258C–268C. Pulses were recorded during 3:00 pm–5:00 pm to avoid the fasting or ingestion effect.Data processingWe transformed original data to spectrum data by Fourier transform as Wang et al described earlier.Briefly, original data were stored as time-amplitude. Mathematics software Matlab 6.5.1 (The MathWorks Inc.) provided Fast Fourier Transformation (FFT) technique to transform time-amplitude data to frequency-amplitude data. Then regular isolated harmonic in a multiple of fundamental frequency appeared.Thefinding gave a spectrum reading up to the 10th harmonic (Cn, n¼0–10). Intensity of harmonics above the 11th became very small and was neglected. Thereafter, the relative harmonic values of each harmonic were calculated ac-cording to Wang’s hypothesis.Harmonic percentage of Cn was defined asStatistical analysisThe experimental data were analyzed by Statistical software SPSS 13.0 for Windows (SPSS Inc.). Comparisons of the harmonic values and the harmonic percentage and the agedistribution between patients with AD and nonatopic healthy individuals were performed using the Student's two samples t test. Comparisons of the sex distribution between patients with AD and nonatopic healthy individuals were performed using the X2 test. Comparisons of the harmonic values and the harmonic percentage between left hand and right hand were performed using the Student's pairedsamples t test. All comparisons were two-tailed, and p<0.05 was considered to be statistically significant.ResultsIn total, 60 children (30 AD and 30 non-AD) participated in the study. The average age of the 60 subjects is 8.02+2.95 years. Baseline characteristics of all participants are shown in Table 1. There is no significant difference in age and gender between the two groups.Relative harmonic values of right radial arterial pulse spectrum analysis are shown in Table 2. Relative harmonic values of left radial arterial pulse spectrum analysis are shown in Table 3. Harmonic percentages of right radial arterial pulse spectrum analysis are shown in Table 4. Harmonic percentages of left radial arterial pulse spectrum analysis are shown in Table 5.In this study, the relative harmonic values of both right and left radial arterial pulse spectrum analysis are lower in the AD group. The relative harmonic values of C3 are significantly different ( p¼0.004, 0.059, respectively). Moreover, when comparingthem by parameter of harmonic percent age, C3 are significantly decreased in the AD group in both right and left radial arterial pulse spectrum analyses ( p¼0.045, 0.036, respectively). These results illustrated the close relationship between C3 (Spleen Meridian) and AD.DiscussionAccording to the theory of Traditional Chinese Medicine,the pathophysiologic mechanisms of AD are "inborn deficiency in body constitution, poor tolerance to environmental stimulants, Spleen Meridian not working well, interiorly generating wet and heat; infected with wind-wetness-heat-evil further, then suffering from those accumulating in skin." AD is a disease involving multiple dysfunctions of the visceral organs (Zang-Fu) rather than a constitutive skin defect.‘‘Spleen wetness’’ is usually considered a major syndrome of AD, which is compatible wi t h our findi n gs.On the other hand, there are also differences in C0 (Heart Meridian), C1 (Liver Meridian), C4 (Lung Meridian) of right hand ( p¼0.014, 0.005, 0.021, respectively) and C1 (Liver Meridian) of left hand ( p¼0.038) between the two groups.These findings appear to have a close relationship between AD and other visceral organs (Zang-Fu). It requires further research to clarify the clinical meanings of these differences.In the present experiment, the close relationship between C3 (Spleen Meridian, referred toWang’s hypothesis) and AD is illustrated. The result verifies Wang’s hypothesis about the relationship between harmonics and Meridians. Moreover,our experiment also has proved that the pulse spectrum analyzer is a suitable auxiliary tool for diagnosing and following up patients with AD.ConclusionsIn conclusion, it was determined that C3 (Spleen Meridian) is a valued index for the determination of atopic dermatitis. Also, the pulse spectrum analyzer is a practi c al noninvasive diagnostic tool to allow scientific and objecti v e di a gnosi s.However, the pulse diagnosis technique is just in the beginning stage. Even though the discovery from the present study seems clear, it deserves further study. AcknowledgmentsThis research was performed in a private clinic for pediatrics specialty, the Hwaishen clinic. The Hwaishen Clinic is acknowledged for their full support of this research. Disclosure StatementNo competing financial interests exist.。
小波分析中英文对照外文翻译文献(文档含英文原文和中文翻译)译文:一小波研究的意义与背景在实际应用中,针对不同性质的信号和干扰,寻找最佳的处理方法降低噪声,一直是信号处理领域广泛讨论的重要问题。
目前有很多方法可用于信号降噪,如中值滤波,低通滤波,傅立叶变换等,但它们都滤掉了信号细节中的有用部分。
传统的信号去噪方法以信号的平稳性为前提,仅从时域或频域分别给出统计平均结果。
根据有效信号的时域或频域特性去除噪声,而不能同时兼顾信号在时域和频域的局部和全貌。
更多的实践证明,经典的方法基于傅里叶变换的滤波,并不能对非平稳信号进行有效的分析和处理,去噪效果已不能很好地满足工程应用发展的要求。
常用的硬阈值法则和软阈值法则采用设置高频小波系数为零的方法从信号中滤除噪声。
实践证明,这些小波阈值去噪方法具有近似优化特性,在非平稳信号领域中具有良好表现。
小波理论是在傅立叶变换和短时傅立叶变换的基础上发展起来的,它具有多分辨分析的特点,在时域和频域上都具有表征信号局部特征的能力,是信号时频分析的优良工具。
小波变换具有多分辨性、时频局部化特性及计算的快速性等属性,这使得小波变换在地球物理领域有着广泛的应用。
随着技术的发展,小波包分析(Wavelet Packet Analysis)方法产生并发展起来,小波包分析是小波分析的拓展,具有十分广泛的应用价值。
它能够为信号提供一种更加精细的分析方法,它将频带进行多层次划分,对离散小波变换没有细分的高频部分进一步分析,并能够根据被分析信号的特征,自适应选择相应的频带,使之与信号匹配,从而提高了时频分辨率。
小波包分析(wavelet packet analysis)能够为信号提供一种更加精细的分析方法,它将频带进行多层次划分,对小波分析没有细分的高频部分进一步分解,并能够根据被分析信号的特征,自适应地选择相应频带,使之与信号频谱相匹配,因而小波包具有更广泛的应用价值。
利用小波包分析进行信号降噪,一种直观而有效的小波包去噪方法就是直接对小波包分解系数取阈值,选择相关的滤波因子,利用保留下来的系数进行信号的重构,最终达到降噪的目的。
运用小波包分析进行信号消噪、特征提取和识别是小波包分析在数字信号处理中的重要应用。
二小波分析的发展与应用小波包分析的应用是与小波包分析的理论研究紧密地结合在一起的。
近年来,小波包的应用范围也是越来远广。
小波包分析能够把任何信号映射到一个由基本小波伸缩、平移而成的一组小波函数上去。
实现信号在不同时刻、不同频带的合理分离而不丢失任何原始信息。
这些功能为动态信号的非平稳描述、机械零件故障特征频率的分析、微弱信号的提取以实现早期故障诊断提供了高效、有力的工具。
(1)小波包分析在图像处理中的应用在图像处理中,小波包分析的应用是很成功的,而这一方面的著作和学术论文也特别多。
二进小波变换用于图像拼接和镶嵌中,可以消除拼接缝。
利用正交变换和小波包进行图像数据压缩。
可望克服由于数据压缩而产生的方块效应,获得较好的压缩效果。
利用小波包变换方法可进行边缘检测、图像匹配、图像目标识别及图像细化等。
(2)小波包分析在故障诊断中的应用小波包分析在故障诊断中的应用已取得了极大的成功。
小波包分析不仅可以在低信噪比的信号中检测到故障信号,而且可以滤去噪声恢复原信号,具有很高的应用价值。
小波包变换适用于电力系统故障分析,尤其适用于电动机转子鼠笼断条以及发电机转子故障分析。
用二进小波Mallat算法对往复压缩机盖振动信号进行分解和重构,可诊断出进、排气阀泄漏故障。
利用小波包对变速箱故障声压信号进行分解,诊断出了变速箱齿根裂纹故障等。
(3)小波包分析在语音信号处理中的应用语音信号处理的目的是得到一些语音参数以便高效地传输或存储。
利用小波包分析可以提取语音信号的一些参数,并对语音信号进行处理。
小波包理论应用在语音处理方面的主要内容包括:清浊音分割、基音检测、去躁、重建与数据压缩等几个方面。
小波包应用于语音信号提取、语音台成语音增加波形编码已取得了很好的效果。
三基础知识介绍近年来,小波理论得到了非常迅速的发展,而且由于其具备良好的时频特性,实际应用也非常广泛。
这里希望利用小波的自身特性,在降低噪声影响的同时,尽量保持图像本身的有用细节和边缘信息,从而保证图像的最佳效果。
小波合成连续小波变换是一种可逆的变换,只要满足方程2。
幸运的是,这是一个非限制性规定。
如果方程2得到满足,连续小波变换是可逆的,即使基函数一般都是不正交的。
重建可能是使用下面的重建公式:公式1小波逆变换公式其中C_psi是一个常量,取决于所使用的小波。
该重建的成功取决于这个叫做受理的常数,受理满足以下条件:公式2受理条件方程这里 psi^hat(xi) 是 FT 的psi(t),方程2意味着psi^hat(0) = 0,这是:公式3如上所述,公式3并不是一个非常严格的要求,因为许多小波函数可以找到它的积分是零。
要满足方程3,小波必须振荡。
连续小波变换连续小波变换作为一种替代快速傅里叶变换办法来发展,克服分析的问题。
小波分析和STFT 的分析方法类似,在这个意义上说,就是信号和一个函数相乘,{它的小波},类似的STFT的窗口功能,并转换为不同分段的时域信号。
但是,STFT和连续小波变换二者之间的主要区别是:1、Fourier转换的信号不采取窗口,因此,单峰将被视为对应一个正弦波,即负频率是没有计算。
2、窗口的宽度是相对于光谱的每一个组件变化而变化的,这是小波变换计算最重要的特征。
连续小波变换的定义如下:公式4从上面的方程可以看出,改变信号功能的有两个变量,τ和s,分别是转换参数和尺度参数。
psi(t)为转化功能。
小波包分析的基本原理目前大多数数字图像系统中,输入图像都是采用先冻结再扫描方式将多维图像变成一维电信号,再对其进行处理、存储、传输等加工变换。
最后往往还要在组成多维图像信号,而图像噪声也将同样受到这样的分解和合成。
噪声对图像信号幅度、相位的影响非常复杂,有些噪声和图像信号是相互独立不相关的,而有些则是相关的,并且噪声本身之间也可能相关。
因此要有效降低图像中的噪声,必须针对不同的具体情况采用不同方法,否则就很难获得满意的去噪效果。
一般图像去噪中常见的噪声有以下几种:1)加性噪声:加性噪声和图像信号强度是不相关的,如图像在传输过程中引进的“信道噪声”电视摄像机扫描图像的噪声等。
这类带有噪声的图像可看成是理想的没有被噪声“污染”的图像与噪声。
2)乘性噪声:图像的乘性噪声和图像的加性噪声是不一样的,加性噪声和图像信号强度是不相关的,而乘性噪声和图像信号是相关的,往往随着图像信号的变化而发生变化,如飞点扫描图像中的噪声、电视扫描光栅、胶片颗粒噪声等。
3)量化噪声:量化噪声是数字图像的主要噪声源,它的大小能够表示出数字图像和原始图像的差异程度,有效减少这种噪声的最好办法就是采用按灰度级概率密度函数选择量化级的最优量化措施。
4)“椒盐”噪声:此种噪声很多,例如在图像切割过程中引起的黑图像上的白点、白图像上的黑点噪声等,还有在变换域引入的误差,在图像反变换时引入的变换噪声等。
实际生活中还有多种多样的图像噪声,如皮革上的疤痕噪声、气象云图上的条纹噪声等。
这些噪声一般都是简单的加性噪声,不会随着图像信号的改变而改变。
这为实际的去噪工作提供了依据。
2.图像去噪效果的评价在图像去噪的处理中,常常需要评价去噪后图像的质量。
这是因为一个图像经过去噪处理后所还原图像的质量好坏,对于人们判断去噪方法的优劣有很重要的意义。
目前对图像的去噪质量评价主要有两类常用的方法:一类是人的主观评价,它由人眼直接观察图像效果,这种方法受人为主观因素的影响比较大。
目前由于对人的视觉系统性质还没有充分的理解,对人的心理因素还没有找到定量分析方法。
因此主观评价标准还只是一个定性的描述方法,不能作定量描述,但它能反映人眼的视觉特性。
另一类是图像质量的客观评价。
调试环境-MATLAB开发平台MATLAB是Math Works公司开发的一种跨平台的,用于矩阵数值计算的简单高效的数学语言,与其它计算机高级语言如C, C++, Fortran, Basic, Pascal等相比,MATLAB语言编程要简洁得多,编程语句更加接近数学描述,可读性好,其强大的圆形功能和可视化数据处理能力也是其他高级语言望尘莫及的。
四综述众所周知,由于图像在采集、数字化和传输过程中常受到各种噪声的干扰,从而使数字图像中包含了大量的噪声。
能否从受扰信号中获得去噪的信息,不仅与干扰的性质和信号形式有关,也与信号的处理方式有关。
在实际应用中,针对不同性质的信号和干扰,寻找最佳的处理方法降低噪声,一直是信号处理领域广泛讨论的重要问题。
小波包分析的应用是与小波包分析的理论研究紧密地结合在一起的。
现在,它已经在科技信息产业领域取得了令人瞩目的成就。
如今,信号处理已经成为当代科学技术工作的重要组成部分,信号处理的目的就是:准确的分析、诊断、编码、压缩和量化、快速传递或存储、精确的恢复(或重构)。
从数学的角度来看,信号与图像处理可以统一看作是信号处理,在小波包分析的许多分析的许多应用中,都可以归结为信号处理问题。
小波包分析的应用领域十分广泛,它包括:信号分析、图象处理、量子力学、理论物理、军事电子对抗与武器的智能化、计算机分类与识别、音乐与语言的人工合成、医学成像与诊断、地震勘探数据处理、大型机械的故障诊断等方面。
例如,在数学方面,它已用于数值分析、构造快速数值方法、曲线曲面构造、微分方程求解、控制论等。
在信号分析方面的滤波、去噪、压缩、传递等。
在图像处理方面的图象压缩、分类、识别与诊断,去污等。
在医学成像方面的减少B超、CT、核磁共振成像的时间,提高分辨率等。
小波包分析用于信号与图像压缩是小波包分析应用的一个重要方面。
它的特点是压缩比高,压缩速度快,压缩后能保持信号与图像的特征不变,且在传递中可以抗干扰。
基于小波包分析的压缩方法很多,比较成功的有小波包最好基方法,小波域纹理模型方法,小波变换零树压缩,小波变换向量压缩等。
小波包在信号分析中的应用也十分广泛。
它可以用于边界的处理与滤波、时频分析、信噪分离与提取弱信号、求分形指数、信号的识别与诊断以及多尺度边缘检测等。
A ·The wavelet study the meaning and backgroundIn practical applications, the different nature of the signal and interference, to find the best processing method to reduce noise, the important issue is widely discussed in the field of signal processing. Currently, there are many methods can be used to signal noise reduction, such as median filtering, low pass filtering, Fourier transform, etc., but they are filtered out by the useful part of the signal details. The traditional signal de-noising method smooth signal only from the time domain or frequency domain are given the results of the statistical average. Time domain or frequency domain characteristics of the effective signal to noise removal, but not taking into account the local and the whole picture of the signal in the time domain and frequency domain. More Practice has proved that the classical approach based on the Fourier transform of the filter, and can not be non-stationary signal analysis and processing, denoising effect can not meet the requirements of engineering application development. In recent years, many papers non-stationary signal wavelet threshold de-noising method. Donoho and Johnstone contaminated with Gaussian noise signalde-noising by thresholding wavelet coefficients. Commonly used hard threshold rule and soft threshold rule set to filter out the noise from the signal high-frequency wavelet coefficients to zero. Practice has proved that these wavelet thresholding method with approximate optimization features, has a good performance in the field of non-stationary signals. The threshold rule mainly depends on the choice of parameters. For example, the hard threshold and soft threshold depends on the choice of a single parameter - global threshold lambda lambda adjustment is critical However, due to the non-linearity of the wavelet transform. Threshold is too small or too large, will be directly related to the pros and cons of the signal de-noising effect. When the threshold value is dependent on a number of parameters, the problem will become more complex. In fact, the effective threshold denoising method is often determined based on wavelet decomposition at different levels depending on the threshold parameter, and then determine the appropriate threshold rule. Compared with the wavelet analysis, wavelet packet analysis (Wavelet Packet Analysis) to provide a more detailed analysis for the signal, it will band division of multi-level, multi-resolution analysisis no breakdown of the high-frequency part of the further decomposition, and according to the characteristic of the signal being analyzed, adaptive selection of the corresponding frequency band, to match with the signal spectrum, thereby increasing the time - frequency resolution. The wavelet packet transform is the promotion of the wavelet transform in signal with more flexibility than the wavelet transform. Using wavelet packet transform to the signal decomposition, the low-frequency part andhigh-frequency components are further decomposed. Wavelet packet signal de-noising threshold method combined with good application value.At present, both in engineering applications and theoretical study, removal of signal interference noise is a hot topic. Extract valid signal is band a wide interference or white noise pollution signal mixed with noise signal, has been an important part of signal processing. The traditional digital signal analysis and processing is to establish the basis of Fourier transform, Fourier transform stationary signals in the time domain and frequency domain algorithm to convert each other, but can not accurately represent the signal time-frequency localization properties. For non-stationary signals people use short-time Fourier transform, but it uses a fixed short-time window function is a single-resolution signal analysis method, there are some irreparable defect. Wavelet theory is developed on the basis of Fourier transform and short-time Fourier transform, and it has the characteristics of multi-resolution analysis, have the ability to characterize the local signal characteristics in the time domain and frequency domain, is an excellent tool for signal analysis . Wavelet transform (Wavelet transform) emerged in the mid 1980s when the frequency domain signal analysis tools, since 1989 S.Mallat the first time since the introduction of wavelet transform image processing, wavelet transform its excellent time-frequency local capacity and good to go related capacity in the field of image compression coding has been widely used, and achieved good results. Multi-resolution wavelet transform, time-frequency localization characteristics and calculation speed and other attributes, which makes the wavelet transform has been widely applied in the field of geophysics. Such as: using wavelet transform gravity and magnetic parameters of the extraction, the magnitude of the error of the reconstructed signal with the original signal after the wavelet analysis as a standard to select the wavelet basisSeismic data denoising. As technology advances, the wavelet packet analysis (Wavelet Packet Analysis) method developed wavelet packet analysis is the expansion of the wavelet analysis, with a very wide range of application. It is able to signal to provide a more detailed analysis of the method, it is the bandmulti-level framing is not broken down at high frequency portion of the discrete wavelet transform isfurther analyzed, and according to the characteristics of the signal to be analyzed, adaptively selecting the frequency band corresponding to , with the signal matching, thereby increasing the time-frequency resolution. The wavelet packet analysis (wavelet packet analysis) signal to be able to provide a more detailed analysis of the method, it is divided band multi-level wavelet analysis no breakdown of the high frequency portion is further decomposed, and according to the characteristic of the signal being analyzed, adaptively select the appropriate frequency band, the signal spectrum to match, thus wavelet packet has a wider range of applications. Fractal theory of wavelet packet by U.S. scientists BBMandelbrot in themid-1970s the creation of "self-similarity" and "self-affine fractal object, dimension to quantitatively describe the complexity of the signal, it is mainly research, widely used in many fields of science, including the recent wavelet analysis and fractal theory, is used to determine the overlap complex chemical signals in the group scores and the peak position and fractal characteristics of the DNA sequence. Using wavelet packet analysis for signal noise reduction, an intuitive and effective wavelet packet de-noising method is the direct thresholding wavelet packet decomposition coefficients, select the filter factor coefficient signal reconstruction preserved, and ultimately to drop The purpose of the noise. Signal de-noising using wavelet packet analysis, feature extraction and recognition is an important application of wavelet packet analysis in digital signal processing.B·The development and application of wavelet analysisWavelet packet analysis of the application of theoretical research and wavelet packet analysis closely together. Now, it has been made in the field of science and technology information industry made remarkable achievements. Electronic information technology is an area of six high-tech focus, image and signal processing. Today, the signal processing has become an important part of the contemporary scientific and technical work, the purpose of signal processing: an accurate analysis, diagnosis, compression coding and quantization, rapid transfer or storage, accurately restore (or reconstructed). From the point of view of mathematically, signal and image processing can be unified as a signal processing, wavelet packet analysis many many applications of the analysis, can be attributed to the signal processing problem. Now, for its nature with practice is stable and unchanging signal processing ideal tool still Fourier analysis. However, in practical applications, the vast majority of the signal is stable, while the tool is especially suitable fornon-stationary signal is wavelet packet analysis.In recent years, the combined fund research projects and corporate research projects. China in theapplication of wavelet packet analysis carried out some exploration.First, wavelet packet signal analysis, the the boundary singularity processing method and wavelet packet processing in the frequency domain positioning is perfect from the application point of view. Harmonic wavelet packet analysis method, and the harmonic wavelet packet and fractal combined to solve practical problems in engineering.Secondly, in the operation of the rotor vibration signal detection of the fault feature analysis simulation and practical research. Motor noise analysis method using wavelet packet analysis theory to identify the impact threshold to noise singular signal of the acceleration of the vehicle, using the method of wavelet packet analysis and come to a satisfactory conclusion, while the harmonic wavelet packet combined with the fractal theory. Automobile gearbox nonlinear crack fault feature, the first application of the method of combining wavelet analysis and fractal theory and the technical design of the vehicle driveline. Middle and low agricultural transport light goods vehicle driveline job stability is not good, the problem of short working life, in the practical application of engineering to explore a new way.Next, using theoretical analysis, experiments and software implementation phase junction station, namely the use of wavelet packet analysis and computer programs to achieve the digital signal processing. In the analysis of non-stationary signals, respectively, using existing technology and wavelet packet analysis method, the fractal method is used, expect improvements in digital signal processing. To reflect the complex characteristics of the information to improve the accuracy of the signal analysis and detection, reached the advanced level. On the basis of cooperation with others to complete a set of signal processing methods and techniques of high-speed data processing system.In recent years, the range of applications of the wavelet packet is increasingly far and wide. Wavelet packet analysis any signal can be mapped to a basic wavelet telescopic pan from the wavelet function up. Signal to achieve a reasonable separation of the different frequency bands at different times, without losing any of the original information. These features for non-stationary dynamic signal description, analysis of the mechanical parts fault characteristic frequency, weak signal extraction provides an efficient and powerful tool to achieve early fault diagnosis. In recent years, through the continuous efforts of the scientific and technical personnel in China have achieved encouraging progress, successfully developed a wavelet transform signal analyzer, to fill the gap with the international advanced level. In theoretical and applied research on the basis of the generally applicable to non-stationary detection and diagnosis of mechanical equipment online and offline technologies and devices to obtain economic benefits. The National Scienceand Technology Progress Award.(1) wavelet packet analysis applications in image processingIn image processing, the application of wavelet packet analysis is very successful, and this aspect of books and academic papers are particularly high. Dyadic wavelet transform for image mosaic and mosaic, can eliminate the seam. Orthogonal transform and wavelet packet image data compression. Is expected to overcome the the blocking effects arising due to compression of data, to obtain better compression results. Wavelet packet transform method for edge detection, image matching, image target recognition and image thinning.(2) The wavelet packet analysis application in fault diagnosisWavelet packet analysis in fault diagnosis has been made a great success. Wavelet packet analysis can not only be detected in the low signal-to-noise ratio of the signal to the fault signal, and can filter out the noise to restore the original signal has a high application value. Wavelet packet transform is applied to power system fault analysis, particularly suitable for motor rotor cage broken bars and generator rotor failure analysis. With the dyadic wavelet Mallat algorithm reciprocating compressor cover vibration signal decomposition and reconstruction can be diagnosed into the exhaust valve leakage fault. Gearbox failure sound pressure signal using wavelet packet decomposition, diagnose gearbox root crack fault.Wavelet packet analysis in speech signal processing. The purpose of the speech signal processing is to get some of the speech parameters for efficient transmission or storage. Wavelet packet analysis can extract some of the parameters of the speech signal, speech signal processing. The main contents include: the theory of wavelet packet used in voice processing V oicing segmentation, pitch detection, to impatient to rebuild data compression and other aspects. Wavelet Packet used in speech signal extraction, the voice station into increased voice waveform coding has achieved very good results.Wavelet packet analysis in mathematics and physics. In the field of mathematics, wavelet packet analysis is a powerful tool for numerical analysis, a simple and effective way to solve partial differential equations and integral equations. Also good for solving linear and nonlinear problems. The resulting wavelet finite element method and wavelet boundary element method, greatly enriched the contents of the numerical analysis method.In the field of physics, wavelet packet represents a new condensed matter in quantum mechanics. In the adaptive optics. There are currently study wavelet packet transform wavefront reconstruction. In addition, the suitability of wavelet packet transform to portray irregularities, provides a new tool for turbulenceresearch.Wavelet analysis in medical applications. Micronucleus identification has important applications in medicine. Environmental testing, pharmaceutical and other sets of objects can be used for toxin detection. In the micronucleus computer automatic identification, continuous wavelet can accurately extract the edge of the nucleus. Currently, it is being studied by using wavelet packet transform brain signal analysis and processing, This will effectively eliminate the transient interference and EEG short-term, low-energy transient pulse is detected.Wavelet packet analysis neural network. Wavelet packet theory provides a prequel network analysis and theoretical framework that the wavelet form in the network structure is used to make specific spectral information contained in the training data. Wavelet packet transform designed to handle network training can greatly simplified. Unlike traditional agoThe case of a neural network structure, where the function is convex. Global grant urinate only the wavelet packet analysis and neural network node sets up the equipment intelligent diagnosis. The use of wavelet packet analysis can be given the initial alignment of the linear and nonlinear models of the inertial navigation system.Wavelet packet analysis in engineering calculations. The matrix operations frequently encountered problems in the project, such as dense matrix acting on the vector (discrete) or integral operator acting on the calculation of the function (continuous). Sometimes computation great, fast wavelet transform, so that the operator is greatly reduced. In addition, CAD / C AM, large-scale engineering finite element analysis, mechanical engineering optimization design, automatic test system design aspects of wavelet packet analysis should be examples.Wavelet packet analysis equipment protection and status detection system can also be used, such ashigh-voltage line protection and generator stator inter-turn short circuit protection. In addition, the wavelet packet analysis is also used in astronomical research, weather analysis, identification and signal sending.C·BASIC THEORYIn recent years,wavelet theory has been very rapid development,but also because of its goodtime-frequency character istics of awide range of practical applications. Here wish to take advantage of the self-wavelet features,in the reduction of noise at the same time,to keep the details of the image itself and the edge of useful information,thus ensuring the best image.one of image wavelet thresholding denoising method can be said that many image denoising methods are the best.THE W A VELET THEORY: A MATHEMATICAL APPROACHThis section describes the main idea of wavelet analysis theory, which can also be considered to be the underlying concept of most of the signal analysis techniques. The FT defined by Fourier use basis functions to analyze and reconstruct a function. Every vector in a vector space can be written as a linear combination of the basis vectors in that vector space , i.e., by multiplying the vectors by some constant numbers, and then by taking the summation of the products. The analysis of the signal involves the estimation of these constant numbers (transform coefficients, or Fourier coefficients, wavelet coefficients, etc). The synthesis, or the reconstruction, corresponds to computing the linear combination equation.All the definitions and theorems related to this subject can be found in Keiser's book, A Friendly Guide to Wavelets but an introductory level knowledge of how basis functions work is necessary to understand the underlying principles of the wavelet theory. Therefore, this information will be presented in this section.THE WA VELET SYNTHESISThe continuous wavelet transform is a reversible transform, provided that Equation 2 is satisfied. Fortunately, this is a very non-restrictive requirement. The continuous wavelet transform is reversible if Equation 2 is satisfied, even though the basis functions are in general may not be orthonormal. The reconstruction is possible by using the following reconstruction formula:Equation 1 Inverse Wavelet Transformwhere C_psi is a constant that depends on the wavelet used. The success of the reconstruction depends on this constant called, the admissibility constant , to satisfy the following admissibility condition :Equation 2 Admissibility Conditionwhere psi^hat(xi) is the FT of psi(t). Equation 2 implies that psi^hat(0) = 0, which is:Equation 3As stated above, Equation 3 is not a very restrictive requirement since many wavelet functions can be found whose integral is zero. For Equation 3 to be satisfied, the wavelet must be oscillatory.THE CONTINUOUS W AVELET TRANSFORMThe continuous wavelet transform was developed as an alternative approach to the short time Fourier transform to overcome the resolution problem. The wavelet analysis is done in a similar way to the STFT analysis, in the sense that the signal is multiplied with a function, {it the wavelet}, similar to the windowfunction in the STFT, and the transform is computed separately for different segments of the time-domain signal. However, there are two main differences between the STFT and the CWT:1. The Fourier transforms of the windowed signals are not taken, and therefore single peak will be seen corresponding to a sinusoid, i.e., negative frequencies are not computed.2. The width of the window is changed as the transform is computed for every single spectral component, which is probably the most significant characteristic of the wavelet transform.The continuous wavelet transform is defined as followsEquation4As seen in the above equation , the transformed signal is a function of two variables,τ and s ,the translation and scale parameters, respectively. psi(t) is the transforming function, and it is called the mother wavelet . The term mother wavelet gets its name due to two important properties of the wavelet analysis as explained below:The term wavelet means a small wave . The smallness refers to the condition that this (window) function is of finite length (compactly supported). The wave refers to the condition that this function is oscillatory . The term mother implies that the functions with different region of support that are used in the transformation process are derived from one main function, or the mother wavelet. In other words, the mother wavelet is a prototype for generating the other window functions.The term translation is used in the same sense as it was used in the STFT; it is related to the location of the window, as the window is shifted through the signal. This term, obviously, corresponds to time information in the transform domain. However, we do not have a frequency parameter, as we had before for the STFT. Instead, we have scale parameter which is defined as $1/frequency$. The term frequency is reserved for the STFT. Scale is described in more detail in the next section.MULTIRESOLUTION ANALYSISAlthough the time and frequency resolution problems are results of a physical phenomenon (the Heisenberg uncertainty principle) and exist regardless of the transform used, it is possible to analyze any signal by using an alternative approach called the multiresolution analysis (MRA) . MRA, as implied by its name, analyzes the signal at different frequencies with different resolutions. Every spectral component is not resolved equally as was the case in the STFT.MRA is designed to give good time resolution and poor frequency resolution at high frequencies and good frequency resolution and poor time resolution at low frequencies. This approach makes sense especially when the signal at hand has high frequency components for short durations and low frequency components for long durations. Fortunately, the signals that are encountered in practical applications are often of this type. For example, the following shows a signal of this type. It has a relatively low frequency component throughout the entire signal and relatively high frequency components for a short duration somewhere around the middle.he basic principle of wavelet packet analysisimage noise classificationMost digital imaging systems, the input image are based on the first freeze and then scan the multi-dimensional image into a one-dimensional electrical signal, its processing, storage, transmission and processing transform. Finally, they often have in the composition of multi-dimensional image signal, image noise will be equally subject to such decomposition and synthesis. The impact of noise on the image signal amplitude and phase is very complicated, some noise and image signals are independent of each other Irrelevant, while others are related to, and the noise itself may also be relevant. Therefore, to effectively reduce the noise in the image, using different methods must be specific for the type, otherwise it is difficult to obtain a satisfactory denoising effect. Common in the general image denoising noise are the following: 1) is not relevant to additive noise: the additive noise and the image signal intensity, such as the image introduced during transmission channel noise of the scanned image of the television camera noise. Such with noise of the image can be seen as the ideal no noise pollution "image noise.2) multiplicative noise: image multiplicative noise and image additive noise is not the same, the additive noise and image signal strength is not related to the multiplicative noise and image signals are related, often with the image signal change change, flying point in a scanned image noise, the TV raster scanned film grain noise.3) quantization noise: the quantization noise is the main noise source of a digital image, its size can show the degree of difference of the digital image and the original image, effectively reducing this noise the best way is to select grayscale probability density function quantified level optimal quantitative measures.4) "salt and pepper" noise: Many of such noise, such as white spots on the black image in the the image cutting process caused the white image on the black point noise, the error introduced in the transform domain, the inverse transform of the image introducing the transformed noise.Real life there are a variety of image noise, such as leather scar noise, weather maps stripe noise. These noises are generally simple additive noise will not change with the change of the image signal. This provides a basis for actual denoising.2. Evaluation of the effectiveness of image denoisingIn the image denoising processing is often necessary to evaluate the quality of the image denoising. This is because an image after denoising restore the image quality is good or bad, has a very important significance for the people to judge the merits of de-noising method. Current image denoising quality evaluation mainly there are two commonly used methods: one is the subjective evaluation, it is directly observed by the human eye image effects, which, due to the relatively large human subjective factors. Due to the nature of the human visual system is not fully understood, the psychological factors have yet to find a quantitative analysis method. Subjective evaluation criteria is only a qualitative description can not be quantitative description, but it reflects the human visual characteristics. The other is an objective evaluation of the image quality. It is a mathematical statistics on the processing method, its disadvantage is that it does not always reflect the human eye's real feeling. A compromise approach in assessing the pros and cons of image denoising algorithm, the subjective and objective two standards considered together.debugging environment-MATLAB development platformMATLAB Math Works, Inc. to develop a cross-platform, used for the the matrix numerical calculation of the simple and efficient mathematical language, compared with other high-level computer language such as。