A New Statistical-Based Kurtosis Wavelet Energy
- 格式:pdf
- 大小:1.48 MB
- 文档页数:11
设备管理与维修2021翼4(上)基于深度学习的滚动轴承故障诊断方法陈志刚,高鹤,刘菲,杨志达(北京航天拓扑高科技有限责任公司,北京100176)摘要:提出一种基于一维卷积神经网络(CNN)与门控循环单元(GRU )的滚动轴承故障诊断方法,设计了一种基于数据驱动的滚动轴承故障诊断方法。
利用同一数据集之间特征相似并且独立同分布这一特征,分别设计网络结构和参数。
为采用CNN 和GRU 进行故障诊断提供了新的思路,具有较好的技术应用前景。
关键词:深度学习;故障诊断;滚动轴承;一维卷积;门控循环单元中图分类号:TH133.33;TP277文献标识码:B DOI :10.16621/ki.issn1001-0599.2021.04.660引言滚动轴承是机械设备中常见的组件,从简单的电风扇到复杂的机床上都有滚动轴承的应用。
事实上,超过50%的机械缺陷与轴承故障有关,从而导致机器停产、停机、甚至造成人员的伤亡[1]。
因此,滚动轴承故障诊断是机械故障诊断的一个重要方面,也是近些年来的研究热点。
近些年来,随着学者们的不断深入研究提出了各种故障诊断的方法。
传统的研究方法有:BP 神经网络[3]、概率神经网络(Probabilistic Neural Network ,PNN )[4]、小波分析[5]、EMD [6]、集合经验模态分解(Ensemble Empirical Mode Decompo原sition ,EEMD )[7]、奇异值分解(Singular value decomposition ,SVD )[8]等得到了广泛的应用。
目前基于机器学习的故障诊断方法主要有,如Logistic 回归[9]、支持向量机(Support Vector Machine ,SVM )[10]以及人工神经网络(Artificial Neural Network ,ANN )[11]、模糊推断[12]。
人工智能的蓬勃发展,深度学习在图像识别、语音识别等领域得到广泛运用。
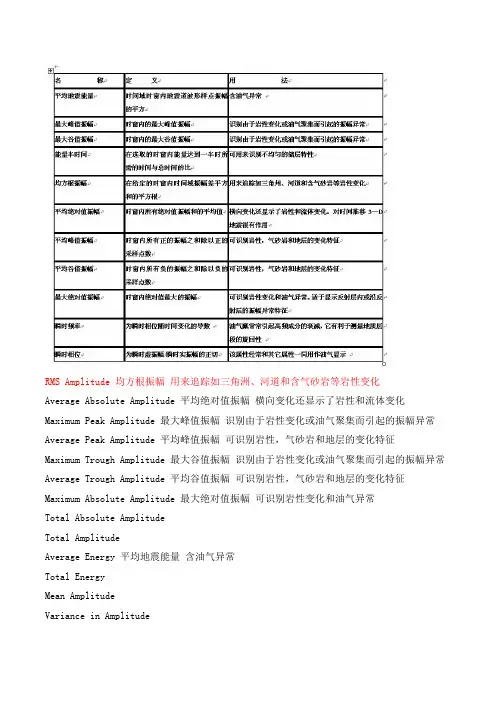
RMS Amplitude 均方根振幅用来追踪如三角洲、河道和含气砂岩等岩性变化Average Absolute Amplitude 平均绝对值振幅横向变化还显示了岩性和流体变化Maximum Peak Amplitude 最大峰值振幅识别由于岩性变化或油气聚集而引起的振幅异常Average Peak Amplitude 平均峰值振幅可识别岩性,气砂岩和地层的变化特征Maximum Trough Amplitude 最大谷值振幅识别由于岩性变化或油气聚集而引起的振幅异常Average Trough Amplitude 平均谷值振幅可识别岩性,气砂岩和地层的变化特征Maximum Absolute Amplitude 最大绝对值振幅可识别岩性变化和油气异常Total Absolute AmplitudeTotal AmplitudeAverage Energy 平均地震能量含油气异常Total EnergyMean AmplitudeVariance in AmplitudeSkew in AmplitudeKurtosis in Amplitude常用词Complex 复合的复杂的Instantaneous 瞬时Reflection 反射Strength 能量强度Phase 相位Slope 斜坡倾斜Statistics 统计学统计表Spectral 波谱的光谱的Sequence 次序顺序连续Frequency 频率Threshold 临界门槛Effective bandwidth 有效带宽Arc Length 弧长波长Max value 最大值、极大值Max positive value 最大正值Max negative value 最大负值Amp. Thickness of peak 波峰视厚度Amp. Thickness of trough 波谷视厚度Area under peak 波峰面积Area under trough 波谷面积Average value 平均值Average absolute 绝对平均值Minimum value 最小值Rms value均方根振幅Correlation coefficient requires wavelet 波的相关系数。
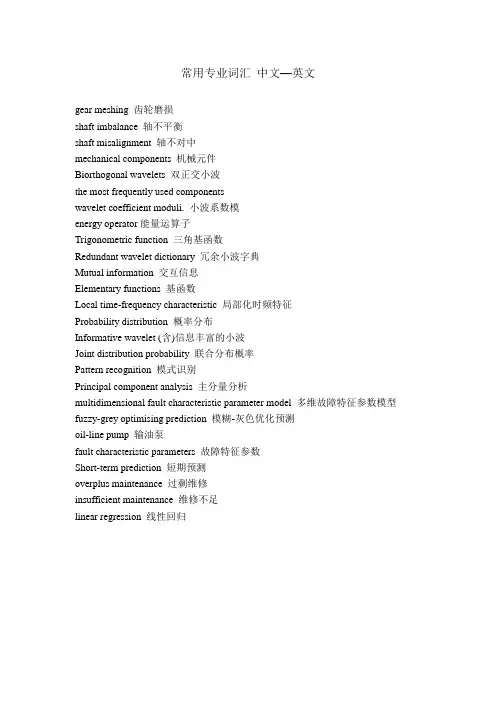
常用专业词汇中文—英文gear meshing 齿轮磨损shaft imbalance 轴不平衡shaft misalignment 轴不对中mechanical components 机械元件Biorthogonal wavelets 双正交小波the most frequently used componentswavelet coefficient moduli. 小波系数模energy operator能量运算子Trigonometric function 三角基函数Redundant wavelet dictionary 冗余小波字典Mutual information 交互信息Elementary functions 基函数Local time-frequency characteristic 局部化时频特征Probability distribution 概率分布Informative wavelet (含)信息丰富的小波Joint distribution probability 联合分布概率Pattern recognition 模式识别Principal component analysis 主分量分析multidimensional fault characteristic parameter model 多维故障特征参数模型fuzzy-grey optimising prediction 模糊-灰色优化预测oil-line pump 输油泵fault characteristic parameters 故障特征参数Short-term prediction 短期预测overplus maintenance 过剩维修insufficient maintenance 维修不足linear regression 线性回归According to the rolling bearing fault diagnosis theory, when a fault on the outer race would give an impulse for the passage of each rolling element.根据滚动轴承故障诊断理论,当外圈上有一个缺陷时,每一个滚动体经过缺陷时都会受到一次冲击。

可靠性分析在轨道交通系统中的应用陶涛; 龙静; 付勇; 程晓卿; 王志鹏【期刊名称】《《中国铁路》》【年(卷),期】2019(000)010【总页数】5页(P103-107)【关键词】轨道交通; 可靠性分析; 关键部件; 系统设备; 路网【作者】陶涛; 龙静; 付勇; 程晓卿; 王志鹏【作者单位】广州地铁集团有限公司广东广州510320; 城市轨道交通系统安全与运维保障国家工程实验室广东广州510320; 北京交通大学轨道交通控制与安全国家重点实验室北京100044【正文语种】中文【中图分类】U2980 引言不断增长的交通需求、交通拥挤、能源供给以及气候变化是整个世界所面临的几个主要问题,而轨道交通凭借在环保能效、土地利用、能源消耗以及安全性上的固有优势,必将在未来新型交通系统建设中扮演重要角色。
近年来,轨道交通系统在世界范围内得到了长足发展,特别是在高速铁路、高原铁路、高寒铁路、重载铁路以及城市轨道交通等方面,取得了一系列核心关键技术突破和创新性标志成果,而轨道交通系统可靠性问题也随之越来越受到人们的关注。
1 轨道交通系统范畴轨道交通是指运营车辆需在特定轨道上行驶的一类交通工具或运输系统,常见的轨道交通有高速铁路、普速铁路、磁悬浮、地铁、轻轨、单轨和有轨电车等。
轨道交通是国民经济发展的大动脉,是国家全局性、基础性、先导性和战略性的基础设施,是国家综合交通运输和城市公共交通系统的骨干网络,也是满足人民日益增长的出行需求、加强国防建设的重要交通工具。
作为国家高新技术产业、基础工业、现代服务业发展的驱动行业和承载行业之一,轨道交通行业在我国经济社会发展和民生改善中发挥着不可替代的重要作用,同时也为交通强国、科技强国,以及“一带一路”等建设项目实施奠定坚实的基础。
2 轨道交通系统可靠性分析研究现状国家标准TB/T 3133—2006《铁道机车车辆电子产品的可靠性、可用性、可维修性和安全性(RAMS)》[1]给出了关于可靠性的定义:在规定的条件下和规定的时间内,产品完成规定功能的能力。
监测检测 Monitoring&Detection
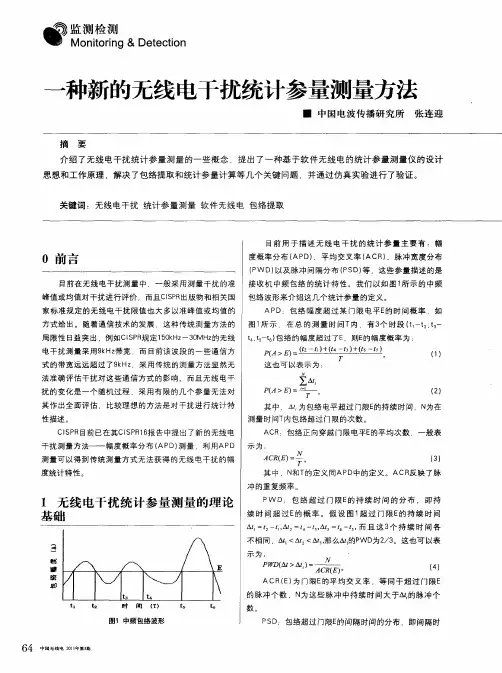
一种新的无线电干扰统计参量测量方法 ■中国电波传播研究所张连迎 摘要 介绍了无线电干扰统计参量测量的一些概念,提出了一种基于软件无线电的统计参量测量仪的设计 思想和工作原理.解决了包络提取和统计参量计算等几个关键问题,并通过仿真实验进行了验证。
关键词:无线电干扰统计参量测量软件无线电包络提取
0前言 目前在无线电干扰测量中,一般采用测量干扰的准 峰值或均值对干扰进行评价 而且CISPR出版物和相关国 家标准规定的无线电干扰限值也大多以准峰值或均值的 方式给出。随着通信技术的发展.这种传统测量方法的 局限性日益突出,例如cISPR规定1 50kHz~30MHz的无线 电干扰测量采用9kH z带宽.而目前该波段的一些通信方 式的带宽远远超过了9kH z.采用传统的测量方法显然无 法准确评估干扰对这些通信方式的影响。而且无线电干 扰的变化是一个随机过程.采用有限的几个参量无法对 其作出全面评估 比较理想的方法是对干扰进行统计特 性描述。 CISPR目前已在其CISPR1 6报告中提出了新的无线电 干扰测量方法——幅度概率分布(APD)测量,利用APD 测量可以得到传统测量方式无法获得的无线电干扰的幅 度统计特性。 1无线电干扰统计参量测量的理论 基础 一 量壁f 峰 寐 脚 tl t2 时闻(t)t 图1中频包络波形 64 中国无线电2叭1年第3期 目前用于描述无线电干扰的统计参量主要有:幅 度概率分布(APD)、平均交叉率(ACR)、脉冲宽度分布 (PWD)以及脉;中间隔分布(PSD)等,这些参量描述的是 接收机中频包络的统计特性。我们以如图1所示的中频 包络波形来介绍这几个统计参量的定义。 APD:包络幅度超过某门限电平E的时间概率,如 图1所示.在总的测量时间T内.有3个时段(t 一t .t。一 t4,t5-t6)包络的幅度超过了E, ̄.IJE的幅度概率为:
A New Statistical-Based Kurtosis Wavelet Energy Feature for Texture Recognition of SAR ImagesGholamreza AkbarizadehAbstract—In this paper,an efficient algorithm for texture recog-nition of synthetic aperture radar(SAR)images is developed based on wavelet transform as a feature extraction tool and support vec-tor machine(SVM)as a classifier.SAR image segmentation is an important step in texture recognition of SAR images.SAR images cannot be segmented successfully by using traditional methods because of the existence of speckle noise in SAR images.The algorithm,proposed in this paper,extracts the texture feature by using wavelet transform;then,it forms a feature vector composed of kurtosis value of wavelet energy feature of SAR image.In the next step,segmentation of different textures is applied by using feature vector and level set function.At last,an SVM classifier is designed and trained by using normalized feature vectors of each region texture.The testing sets of SAR images are segmented by this trained SVM.Experimental results on both agricultural and urban SAR images show that the proposed algorithm is effective for classification of different textures in SAR images,and it is also insensitive to the intensity.Index Terms—Fourth-order normalized cumulant,kurtosis wavelet energy(KWE),SAR image classification,speckle,syn-thetic aperture radar(SAR).I.I NTRODUCTIONI N MANY applications,such as the global monitoring for theenvironment,recognizing and tracking special objects,map-ping the Earth’s resources,and developing military systems, it is often beneficial to have an imaging system which is able to provide broad-area imaging at high resolutions and acquire images in inclement weather or during night as well as day. Synthetic aperture radar(SAR)imaging system can provide these requirements.SAR enhances optical imaging abilities because of the unique reactions of xerographic targets to radar frequencies and because of the minimum restrictions on time of day and atmospheric situations.SAR imaging systems are known as the most popular remote sensing technique greatly used in the past decades because of their capability to be utilized in all weather conditions,day and night photography time,and the high spatial resolution[1].In order to recognize and identify selected objects,SAR can pro-vide high-resolution images to distinguish terrain features[2]. However,SAR image processing is extremely difficult becauseManuscript received September29,2010;revised March27,2011,May14, 2011,July21,2011,and November10,2011;accepted April1,2012.Date of publication May23,2012;date of current version October24,2012.This work was supported by the Shahid Chamran University of Ahvaz as a research proposal with code901.The author is with the Electrical Engineering Department,Engineering Faculty,Shahid Chamran University of Ahvaz,Ahvaz61357-831351,Iran (e-mail:g.akbari@scu.ac.ir).Color versions of one or more of thefigures in this paper are available online at .Digital Object Identifier10.1109/TGRS.2012.2194787of the speckle noise[2]–[5].The speckle noise is a fully developed noise which usually affects SAR images.Speckle phenomenon can be described as multiplicative noise,with standard deviation equal to pixel reflectivity value[6].The probability density function(PDF)of the pixel intensities in SAR images is also impressed by speckle noise.This phe-nomenon can be expressed by the nonlinear intensity inhomo-geneity in SAR images[2].As a result of speckle noise effect on pixel intensities in SAR images,this is one of the main reasons for SAR imaging,which is a crucial issue for accurate segmentation and classification.Accordingly,traditional seg-mentation and classification methods based on intensity cannot be used to SAR image processing because of speckle noise effect on pixel intensity in SAR images.The main scope of the image segmentation and classification is to categorize pixels into obvious image regions that are easier to analyze.Thus, segmentation can be used for image partitioning problems,and classification can be used for object recognition purposes. Active contour models or snakes have been used as one of curve-evolution-based methods for global image segmen-tation[7].These methods are classified into two major cate-gories:edge-based methods[8]–[10]and region-based methods [11]–[13].These methods either have weak performances in facing with weak object boundaries in SAR images,or they are sensitive to the location of initial contour and pixel intensities. Furthermore,these methods are only useful to segment the extended areas such as rivers and urban and agricultural areas. On the other hand,nonlinearity of intensity inhomogeneity,as mentioned earlier,often occurs in SAR images from different modalities.Intensity inhomogeneity can be addressed by some active contour models which are widely known as piecewise smooth models[14]–[17].Recently,Li et al.[18]have proposed a region-based active contour model by defining a region-scalablefitting energy function that locally approximates the image intensities on two sides of a contour.This model relies on the intensity inhomogeneity.Nevertheless,nonlinear intensity inhomogeneity which is usually attendant with SAR images cannot be addressed in all of these methods.However,recent SAR image segmentation models have been developed containing generic segmentation procedure[19], [20],spectral data clustering algorithms[3],[21]–[23],fuzzy clustering algorithms[24],and level set methods[2],[4].A generic segmentation method,which is conformed to gamma PDF of SAR images,is proposed by Galland et al.[19]for SAR image segmentation.This parametric approach is on the basis of a polygonal grid model with a hypothetical unknown number of regions.In this approach,the number of regions of the partition is approximated by minimizing the stochastic complexity.However,when the gray values of SAR images are not correctly described by gamma PDF,like in0196-2892/$31.00©2012IEEEtextured speckle images,this technique will fail.Furthermore, since a parametric noise reconstruction of the segmentation procedure is regarded,the parameters of regions need to be adjusted,particularly when the data differ from gamma PDF such as in textured regions.Thus,this parametric procedure only illustrates a unique class of textured data which can lead to analogous limitations to those obtained with the gamma PDF. The same gamma PDF distributed-based method as that in[19]was exerted with different noise models by Delyon and Réfrégier[20].As a comparison with the segmentation algorithm proposed in[19],this approach has some evident advantages.It is established on a polygonal grid which can have an arbitrary structure,and its region number and normalcy of its borders are acquired by minimizing the stochastic com-plexity of a determined quantity version on Q levels of the image[20].Unlike in[19],this approach reaches to a standard model without parameters that need to be tuned by the user. However,the proper value of Q,which minimizes the number of misclassified pixels,could not be computed automatically in that procedure.Also,this procedure may fail due to the nonlin-ear intensity inhomogeneity phenomenon,which is mentioned earlier,if a texture region of a SAR image has other attributes of parametric noise models such as Poisson or Gaussian.In[3]and[21]–[23],various schemes of spectral clustering algorithms were developed.These spectral clustering algo-rithms have very evident advantages compared with the tradi-tional clustering algorithms.Some of these spectral clustering algorithms can identify the clusters of irregular shapes and ob-tain the globally optimal solutions in a relaxed continuous do-main by eigendecomposition[3].However,the computational complexity problem is an imperfection that exists in these meth-ods,and they are computationally expensive because of the use of a coherence matrixfixed by the similarity of each pair of pix-els.Thus,the method needs to compute the eigenvectors of the coherence matrix.Furthermore,spectral clustering algorithms need to allocate a parameter,namely,the scaling parameterσin the Gaussian radial basis function(RBF).Appropriate allocat-ing ofσis a crucial issue to obtain good segmentation results in spectral clustering algorithms.Unfortunately,it is difficult to select the appropriateσvalue,and it is always set manually.The improper value ofσcan corrupt the abilities because spectral clustering algorithms are highly sensitive toσ,and different values ofσmay lead to extremely different results[3].In[4]and[24],two new SAR image segmentation models were presented based on intensity homogeneity in each region as well as no purpose for segmenting the special objects in SAR images.On the other hand,nonlinearity of intensity inhomogeneity often occurs in SAR images as discussed earlier. These two new methods cannot address the nonlinear intensity inhomogeneity phenomenon.Moreover,these methods need an initial curve to be created by the user.In this paper,wefirst propose an efficient method of SAR image segmentation by defining a new energy function,which is based on fourth-order normalized cumulant concept,named kurtosis wavelet energy(KWE).We demonstrate that KWE energy function can be used as an efficient feature for texture discrimination in SAR images.In other words,this statistic-based energy function is a good texture feature for SAR image segmentation problem.Kurtosis is a fourth-order normalized cumulant concluded by working toward the higher order statis-tics(HOS)in statistics subjects.We derive the KWE energy function by implementing the wavelet coefficient energy extrac-tion algorithm and level set functions.Then,an SVM classifier is designed and trained by using normalized feature vector composed of wavelet energy feature,KWE feature,and gray values of eight neighborhood of SAR image.This normalized feature vector is formed for each region texture of SAR image. Statistical properties of texture of each region in SAR image can be extracted well by this normalized feature vector because of using the higher order cumulant(fourth order)in feature formulation design.We will show in this paper that,whenever the order of cumulant as a feature for a SAR image increases, this feature will give the more statistical properties of a specific region from a SAR image,and subsequently,it will outperform the accuracy of texture recognition process of SAR image. Note that our feature extraction section method,termed as KWE,is also related to the skewness wavelet energy(SWE) model which is proposed in[2]where the skewness value of the wavelet coefficient energy of the local intensity values in each region of SAR image is derived and the SWE values of the whole regions are used as the minimizers of the wavelet energy function.In[2],the lower order of cumulant(third order)is used as well as there is not any classifier scheme,and only the segmentation process is done.On the other hand,in this paper, a local texture of each region of a SAR image is segmented well,and then,a classifier is developed for texture recognition purposes.This paper is organized as follows.In Section II,the feature extraction step for SAR image segmentation is performed by computing the KWE formulation as an effective feature for texture segmentation and classification in SAR images.In Section III,derivation of the level set formulation with KWE energy is presented.In Section IV,the recognition step of our algorithm is performed.For this purpose,an SVM classifier is designed and trained by using the KWE extracted feature for texture discrimination.The implementation results of our method on both agricultural and urban SAR images are given in Section V.Finally,Section VI draws some conclusions.II.C UMULANTS AND K URTOSIS V ALUE AS AD EFINITION FOR SAR T EXTURESIn statistics and probability theory,it can be shown that the cumulant generating function of a random variable X is expressed by the natural logarithm of the moment generating function of a random variable X as follows:ΨX(ω)=ln(ΦX(ω))=lnE X{e jωX}(1)in whichΦX(ω)is the moment generating function of a random variable X,E X{.}represents the mathematical expectation of that random variable,andωis the frequency variable of the Fourier transform.The moment generating functionΦX(ω)is also given by the Fourier transform of the PDF of the random variable X as follows:ΦX(ω)=E X{e jωX}=+∞−∞e jωx.f X(x)dx.(2)From the Fourier transform properties,it is obvious that the moment generating function takes the same information regarding the principal random variable as does the PDF.The natural logarithm functionΨX(ω)defined in(1)is usually mentioned as the cumulant generating function,and it is widely used in HOS.The cumulant generating function can be denoted by the cutoff Taylor series expansion as follows:ΨX(ω)=nk=1c X(k).(jω)kk!(3)where c X(k)is the coefficient of the Taylor series and it is called the k th-order cumulant.It can be shown that the impression of cumulants gives a specifically powerful means for characterizing the nature of textures in images as stationary random series.Thus,it seems that cumulants can be good features to the description of textures.It is reported that,whenever the order of cumulant as a feature for a SAR image increases,this feature will give the more statistical characteristics of a specific region from a SAR image[2].However,implementation of higher order cumulants will impose more calculations and is time consuming.Thus, we should perform a tradeoff between the higher order and the complexity of calculations.In[2],the third-order normalized cumulant named skewness was proposed to be used as a texture feature for segmentation of SAR images.In this paper,we propose to use the fourth-order normalized cumulant named kurtosis as a texture feature for segmentation step of our proposed algorithm.We show that this selection gives more statistical information of each region,and it has also more efficient implementation than the skewness.It is feasible to represent the cumulants as functions of the moments of the random variable under analysis by using standard differentiation and mathematical identities.Note that thefirst-order moment is the mean moment,and the second-order moment is the central moment.For example,thefirst four cumulants as functions of the moments can be expressed by c(1)=m(1)=M=meanc(2)=m(2)−[m(1)]2=σ2=covariancec(3)=m(3)−3m(1)·m(2)+2[m(1)]3c(4)=m(4)−3[m(2)]2−4m(1)·m(3)+12[m(1)]2·m(2)−6[m(1)]4(4) where M andσ2represent the mean and covariance of the distribution of the related random variables,respectively.In order to clarify,the subscript X has been eliminated in these expressions.In most practical applications,the PDF of a ran-dom variable is unknown,and the cumulants must be computed from several comprehensions of the random variable.Thefirst step of our approach is segmenting different textures in SAR images using the kurtosis value of wavelet coefficients of texture of each region as a texture feature.The formulation of third-and fourth-order cumulants c(3)and c(4),given by (3)and(4),respectively,can be used as such texture feature. In applications developed for segmentation of SAR images, a beneficial feature is the feature that it is invariant to image size[2].However,the cumulant formulation as described in(4)is essentially dependent on the size of the generating random variable and also on the image size.For the purpose of this paper,we use a normalization of the higher order cumulants to make them invariant to image size.With this point of view, it is interesting to consider the normalized third-order and the normalized fourth-order cumulants with a desired random variable as defined respectively byNC(3)=c(3)[c(2)]32=c(3)[σ2]32=c(3)σ3(5)NC(4)=c(4)[c(2)]2=c(4)σ4.(6)Using this definition of cumulant,it directly follows that this normalized cumulant as a texture feature is image size invariant for any nonzero size of a SAR image.In(5),NC(3)is named skewness which is the third-order cumulant normalized with covariance.In(6),NC(4)is named kurtosis which is the fourth-order cumulant normalized with covariance.The skewness cumulant indicates the value of symmetry of the PDF histogram of a SAR image,and the kurtosis cumulant represents the sharpness of the PDF histogram of a SAR image. In other words,the kurtosis as a feature is the slope decreasing value of the PDF histogram curve of a SAR image.It can be found that,whenever the order of cumulant as a feature for a SAR image increases,this feature will give the more statistical characteristics of a specific region from a SAR image[2].However,implementation of higher order cumulants will impose more calculations and is time consuming.Thus, we should perform a tradeoff between the higher order and the complexity of calculations.In[2],the third-order normalized cumulant named skewness is proposed to be used as a texture feature for segmentation of SAR images.In this paper,a texture representation of each region in SAR images with wavelet transform and kurtosis value concepts is defined.Our goal is to design and extract an efficient feature for texture segmentation of SAR images.For this purpose,wefirst apply a wavelet transform up to the possible last level on a SAR image,get the wavelet coefficients,and compute the energy of the resulted wavelet coefficients.Then,the kurtosis value of the wavelet coefficient energy is calculated by computing thefirst four order moments of the wavelet coefficient energies m(1)–m(4)and the four-order cumulant c(4)and at last applying(6)to get the value of the kurtosis NC(4).In order to characterize a texture of each region in a SAR image by the wavelet coefficient energy,we consider RT(i,j) as a region texture of a SAR image as follows:RT(i,j)=1√MNmnW Aφ(y0,m,n)φy,m,n(i,j) +x=H,V,D−1y=−y0mnW xψ(y,m,n)ψx y,m,n(i,j)⎤⎦(7)whereϕis the scaling function,ψis the wavelet function,y0is the order of the decomposition,W Aφis approximation waveletcoefficients,and W Hφ,W Vφ,and W Dφrepresent detail waveletcoefficients.The W Hφ,W Vφ,and W Dφwavelet coefficientsare measured along the different directions as follows:W Hφalong columns(horizontal direction),W Vφalong rows(verticaldirection),and W Dφalong diagonals.We have tested several kinds of mother wavelets and severalwavelet coefficients W Aφ,W Hφ,W Vφ,and W Dφ.After exam-ining the results,we have selected to use the Haar wavelet as mother wavelet type and the energy of approximation wavelet coefficients in our proposed method.The energy of the approx-imation wavelet coefficients in each subband can be obtained by the following sequence:W Aφ(y,m,n)2,−y0≤y≤−1,m,n∈Z.(8)Aujol et puted experimentally(see[26])that the dis-tribution of the square of the wavelet coefficients in a subband of any image(also for SAR images)follows a generalized Gaussian law of the formP X2(y)=K2√yexp−√yαβy≥0(9)where K,α,andβare the texture parameters.IfΓ(t)and N represent the Gamma function and the total number of pixels of the given SAR image,respectively,then we haveK=NβαΓ1β.(10)To define a texture feature based on kurtosis,we shouldcompute the fourth-order moment of the wavelet coefficient energy distribution m(4)|Wφ|2as follows:m(4) |Wφ|2=E|Wφ|8=+∞(Wφ)8h(Wφ)d(Wφ)=Kα9β·Γ9β.(11)parison between the curves of F−1(kurtosis),F−1(skewness),and F−1(second moment).Now,we can obtainαas follows:α=m(4)|Wφ|2m(3)|Wφ|2Γ7βΓ9β.(12)Also,from c(4)and NC(4)defined by(4)and(6),respec-tively,NC(4)can be rewritten as(13),shown at the bottom ofthe page.Thus,the formulation of function F(x)=NC(4)is thenobtained by substitution of thefirst-to fourth-order moments,namely,m(1)|Wφ|2,m(2)|Wφ|2,m(3)|Wφ|2,and m(4)|Wφ|2,with their corre-sponding values given in(14),shown at the bottom of the page.Then,the value of classification parameterβis calculated byβ=F−1(kurtosis)=F−1⎛⎜⎝C(4)|Wφ|2C(2)|Wφ|22⎞⎟⎠.(15)The curve of F−1(kurtosis)is shown in Fig.1.As shown inFig.1,the curve of F−1(kurtosis)is approximately stable overa wide range of kurtosis.In order to do a comparison betweenthe three methods,second moment,skewness,and kurtosis,wehave depicted thefigure of these methods in one plot as shownNC(4)=C(4)|Wφ|2(σ2)4/2=m(4)|Wφ|2−3m(2)|Wφ|22+4m(1)|Wφ|2·m(3)|Wφ|2+12m(1)|Wφ|22·m(2)|Wφ|2−6m(1)|Wφ|24σ4(13)F(x)=Γ31βΓ9β−3·N·Γ21β·Γ25β−4·N·Γ21β·Γ3β·Γ7βN·Γ1β·Γ5β−NΓ23β2+q12·N2·Γ1βΓ23β·Γ5β−6·N3·Γ43βN·Γ1β·Γ5β−NΓ23β2(14)Fig.2.Defined segmentation problem.in Fig.1.As shown in Fig.1,the curve of F−1(kurtosis)ismore stable than the F−1(skewness)and F−1(second moment)which were proposed in[2]and[26],respectively.The curveof F−1(kurtosis)is approximately stable over a wide range ofkurtosis.From Fig.1,as it is expected,the value ofβis about0.25in all the ranges of kurtosis.Thus,if kurtosis is selectedas a texture feature for SAR image segmentation,it will bean efficient feature because of its stability.As it is expected,the kurtosis feature extracts more statistical information dueto its HOS.This is exactly the same thing that is requiredto face with texture regions in SAR images.Thus,a texturediscrimination of each region in SAR images can be done bythe KWE explained in this section.In the next section,weapply this feature in a level set function and develop it forsegmentation of each region in SAR images.III.C OMPUTING THE L EVEL S ET F ORMULATIONW ITH KWE E NERGY T ERMIn the previous section,we described a new texture featureextraction method for texture segmentation in SAR images.In this section,we apply this feature in a level set functionand develop it for segmentation of each region texture inSAR images.Suppose that r is an open subset of R2,K is the numberof segmented regions(number of r k),k is a parameter thatshows the region index,x is a pixel of region,R kl is theinterface between region r k and region r l,and the image is afunction considered as I:r→R.We define the region Re k= {x∈r|x belongs to the region k}.This defined segmentation problem is shown in Fig.2.We denote that,for all k=1,...,K,Re k is an open set r kgiven by a Lipschitz function L k:r→R so that⎧⎨⎩L k(x)>0if x∈r kL k(x)=0if x∈R kL k(x)<0if otherwise(16)where R k is the boundary of r k and L k is the signed distance function to R k.We can determine r k using the sign of L k and the Heaviside distribution function H.This function is approximated byHα(β)=⎧⎨⎩121+βα+1πsinπβαif|β|≤α1ifβ>α0ifβ<−α.(17)In the distributional sense,whenα→0,we have Hα→H.L k(x)is introduced as level set function.If L k(x)is calculatedfor any point x and we get the sign of L k(x),we can determineif x is in the region r k or not.For example,if L k(x)>0,thenH(L k(x))=1;thus,x∈k.Let x∈r be an arbitrary pixel andI(x):r→R1be a given vector of SAR image,where1isthe dimension of the vector I(x).Dimension of SAR imagescorresponds to the dimension of gray-level images.We definethe following function:F KWE(L1,L2,...,L K,f1,f2)=εKWEx(L1,L2,...,L K,f1,f2)+μρ(L)(18)whereμis a positive constant,εKWExis the KWE,f1and f2arethe functions that minimize theεKWEx,andρ(L)is the deviationof the level set function L from a signed distance function.Thekurtosis value of the wavelet coefficient energy is proposed tobe used as contour energyεKWEpin(18).Now,for a given pixel x∈r,the KWEεKW Epis followedby the distribution form of the kurtosis energy of the waveletcoefficients in a subband of each region.For each point x∈r,the KWE energy proposed in this paper isεKWEx(C,k1(x),k2(x))=γ1inside contour(C)K(x−y)|I(y)−k1(x)|2dy=γ2outside contour(C)K(x−y)|I(y)−k2(x)|2dy(19)where C is a contour in the image region r,γ1andγ2aretwo constant numbers,K is a kernel function with a kurtosisproperty,and k1(x)and k2(x)are two functions thatfit imagetextures near the pixel x.We call the pixel x the center point ofthe aforementioned equation,and we call the aforementionedenergy the KWE around the center point x.A benefit kernelfunction K(x)should be computed and used in the KWEenergy function derived in(19).We propose to use the kernelfunction K(x)as the PDF.Thus,we haveK|Wφ|2(x)=K2√xexp−√xαβ(20)where the constant parameter K is obtained by(10)and thesegment parametersαandβare given by(12)and(15),respectively.IV.R ECOGNITION OF S EGMENTED T EXTURES INSAR I MAGES W ITH SVM C LASSIFIERThe classifier plays an important role in image classificationand recognition.After the segmentation of textures in SARimages is done,the classification of each texture in SAR imageshould be achieved by using an efficient classifier and suitabletexture features.The theory of support vector machine(SVM),as a tool of pattern classification and recognition,is based onstatistical learning theory and the principle of structural riskminimization.SVMs are a set of affiliated supervised learning methodswhich analyze data and recognize patterns.SVM is used forstatistical classification and regression analysis.Suppose that,in a set of training examples,each example is marked as belonging to one of two categories.An SVM training algorithm initiates a model that predicts whether a new example drops within one category or the other.An SVM creates a hyperplane or a set of hyperplanes in a high or infinite dimensional space which can be used for classification,recognition,or other tasks.Intuitively,a good clustering is achieved by the hyperplane which has the largest distance to the nearest training data points of any class.This nearest data point is also called functional margin.In general,the larger margin leads to the lower generalization error of the classifier.The SVM classifier belongs to a family of generalized linear classifiers,but there are some ways to create nonlinear SVM classifier by applying the kernel trick to maximum margin hyperplane.A linear SVM uses a systematic approach to find a linear function with the lowest vapnik–chervonenis dimension.For nonlinear separable data,the SVM can map the input to a high-dimensional feature space where a linear hyperplane can be found.Thus,a good generalization can be attained by the SVM compared to traditional classifiers.The kernel function in a linear SVM is just a simple dot product in the input space.However,for a nonlinear SVM,the training data can be mapped to a feature space of higher dimension via a nonlinear projecting function.Since our clas-sification problem is a nonlinear form,hence,the optimal decision function can be considered asf (x )=sgn mi =1a i y i K (x,x i )+b (21)where K (x,x i )is the kernel function.In the SVM classifier,the kernel function plays the important role of mapping the input samples into a feature space.At the present time,there is not any technique available to discover the structure of kernels.Typical choices of kernel function are the linear kernels,polynomial kernels,and Gaussian RBF ker-nels in SVM research.They are defined as follows:1)Linear kernelsK (x,x i )=x •x i .(22)2)Homogeneous polynomial kernelsK (x i ,x j )=(x i •x j )d .(23)3)Inhomogeneous polynomial kernelsK (x i ,x j )=(x i •x j +1)d .(24)4)Gaussian RBF kernelsK (x i ,x j )=exp−x i −x j 22σ2.(25)We use the RBF kernels as the kernel function and the artificial choice method to obtain the samples in our proposed method for classification of segmented textures in SAR images.After the original SAR image was filtered by wavelet trans-form,the energy values of wavelet coefficients,the kurtosis value of wavelet coefficient energy,and gray values of eight neighborhood of that will be computed.These computedvaluesFig.3.(a)Three-look simulated SAR image (256×256).(b)Ground truth.(c)Segmentation obtained by LBF model (error rate:4.68%;the number of missegmented pixels:3070).(d)Segmentation obtained by SWE model (error rate:3.33%;the number of missegmented pixels:2185).(e)Segmentation obtained by KWE (error rate:1.46%;the number of missegmented pixels:954).compose the feature vector of samples.Then,segmentation of textures is applied by using feature vector and level set function proposed in Section III.At last,an SVM classifier is designed and trained by using normalized feature vectors of each region texture,and the testing sets of SAR image are divided by the trained SVM.According to the classification results,the gray value whose category is “+1”was set at 255,and the gray value whose category is “−1”was set at 0.Thus,the segmentation of SAR image is realized.V .I MPLEMENTATION AND T EST R ESULTSTo elucidate the relative advantages of the KWE with respect to local binary fitting (LBF)and SWE,the results of different algorithms on simulated and real SAR images are presented.A.Segmentation of Simulated SAR ImageIn order to evaluate the performance of the proposed method objectively,we first show an experiment on a simulated。