Content Based Image Retrieval using Color and Texture
- 格式:pdf
- 大小:948.79 KB
- 文档页数:19

20204/298随着CT 、MRI 、PET 、SPECT 、超声等成像技术的迅猛发展,医学图像作为一种信息丰富、表现直观的视觉信息资源在现代医疗诊断中发挥着越来越重要的作用。
医学图像归档与传输系统PACS 作为现代数字诊断的重要基础已被众多医疗机构重视和使用。
面对海量的医学图像资源,如何对它们有效的组织与管理,并快速准确地找到用户需要的图像数据已成为一个迫切需要解决的重要课题。
1图像检索的历史发展图像检索最早以人工文本标注为基础。
此时的图像检索本质上是标注文本的关键词匹配,依据文本匹配程度将相关图像呈现给用户。
该方法简单易实现,但缺点也显而易见:首先,人工标注图像,标注内容完全取决于标注者对图像的理解,主观性强。
其次,随着持续增加的图像数量,人工标注图像需要耗费大量的人力劳动。
面对海量的图像数据,这已越来越成为一个无法完成的任务。
20世纪90年代,研究者们开始寻求从图像自身寻找线索来检索图像,提出基于内容的图像检索(Content Based Image Retrieval ,CBIR )。
不同于人工文本标注,基于内容的图像检索直接从图像提取颜色、纹理、形状等特征信息,在特征空间中匹配检索需求,具有客观,自动化程度高等优点。
系统检索时需要用户提供匹配检索需求的图像样例,系统从图像样例中提取检索特征,在特征空间中进行近似匹配,按相关度由大到小排列,呈现给用户。
经过近二十年该领域的研究,人们发现如果图像检索仅仅依赖底层特征,获得的检索结果无法匹配抽象的高层语义,在很多情况下无法满足用户的需要,这极大地限制了检索系统的应用。
为此,研究人员开始考虑基于高级语义的图像检索(Semantic Based ImageRetrieval ,SBIR )问题。
基于语义的图像检索是基于内容图像检索的进一步发展,也是未来图像检索的发展方向。
在医学影像检索应用中,其要求结合从医学视觉信息中提取的特征语义和领域知识,跨越图像底层特征与高级语义之间存在的“语义鸿沟”,将医学图像检索由特征空间拓展到更广阔的高摘要随着现代医学影像技术的迅猛发展,医学图像数量呈现了爆炸性增长,高效的医学图像检索研究显得尤为迫切。
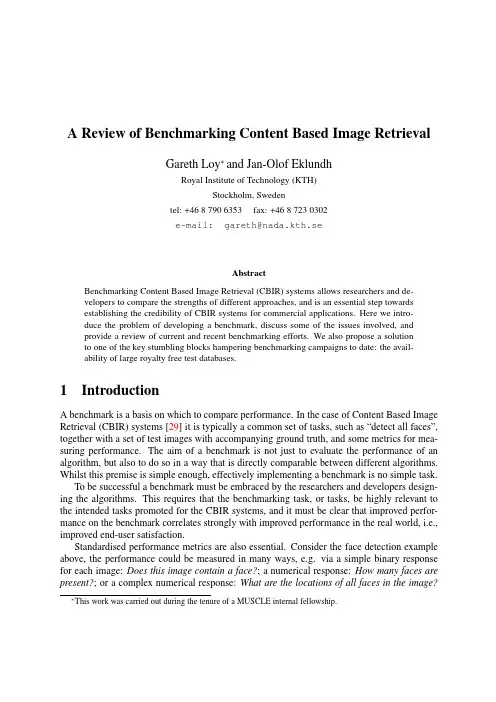
A Review of Benchmarking Content Based Image RetrievalGareth Loy∗and Jan-Olof EklundhRoyal Institute of Technology(KTH)Stockholm,Swedentel:+4687906353fax:+4687230302e-mail:gareth@nada.kth.seAbstractBenchmarking Content Based Image Retrieval(CBIR)systems allows researchers and de-velopers to compare the strengths of different approaches,and is an essential step towardsestablishing the credibility of CBIR systems for commercial applications.Here we intro-duce the problem of developing a benchmark,discuss some of the issues involved,andprovide a review of current and recent benchmarking efforts.We also propose a solutionto one of the key stumbling blocks hampering benchmarking campaigns to date:the avail-ability of large royalty free test databases.1IntroductionA benchmark is a basis on which to compare performance.In the case of Content Based Image Retrieval(CBIR)systems[29]it is typically a common set of tasks,such as“detect all faces”, together with a set of test images with accompanying ground truth,and some metrics for mea-suring performance.The aim of a benchmark is not just to evaluate the performance of an algorithm,but also to do so in a way that is directly comparable between different algorithms. Whilst this premise is simple enough,effectively implementing a benchmark is no simple task.To be successful a benchmark must be embraced by the researchers and developers design-ing the algorithms.This requires that the benchmarking task,or tasks,be highly relevant to the intended tasks promoted for the CBIR systems,and it must be clear that improved perfor-mance on the benchmark correlates strongly with improved performance in the real world,i.e., improved end-user satisfaction.Standardised performance metrics are also essential.Consider the face detection example above,the performance could be measured in many ways,e.g.via a simple binary response for each image:Does this image contain a face?;a numerical response:How many faces are present?;or a complex numerical response:What are the locations of all faces in the image?∗This work was carried out during the tenure of a MUSCLE internal fellowship.What are the locations of the eyes and mouth of all faces present?Should confidence values be associated with each response,and if so how should these be incorporated into thefinal performance measure?In addition to broadly accepted and clearly understood tasks and performance metrics there is the question of test data.The purpose of CBIR systems is to efficiently search huge amounts of widely varying images for some specified content.It is therefore essential to benchmark the performance of these systems on large amounts of data,both in order to evaluate the per-formance in as realistic a manner as possible and obtain a statistically significant result.The problem then arises:where is this data obtained and how is the ground truth generated?It is desirable to distribute the test data freely,which introduces copyright issues,whilst the ground truth labelling of the data has the potential to be an extremely arduous task.Difficulties aside,it is widely agreed that a well-designed benchmark is central to the ad-vancement of thefield.In1893Lord Kelvin[31]summarised the importance of benchmarking: When you can measure what you are speaking about,and express it in numbers,youknow something about it;but when you cannot measure it,when you cannot expressit in numbers,your knowledge is of a meager and unsatisfactory kind:it may bethe beginning of knowledge,but you have scarcely,in your thoughts,advanced tothe state of science.Providing a clear and broadly understood performance measure both allows researchers to more fully understand the strengths and limitations of their systems and compare their results with other systems on a level playingfield.It also provides industry,potential commercial partners, and potential buyers of CBIR systems with a universal measure of how good the systems really are,which is central to establishing the credibility of CBIR systems in the marketplace.Benchmarking CBIR systems,and computer vision algorithms in general,has long been considered an important task[6]and has led to a number of extensive benchmarking efforts, e.g.[7,8,19,17,11,10,14,15].This paper reviews several of these,and then moves on to tackle one of the key issues hampering benchmarking at present,the availability of royalty free images and ground truth data.A proposed method is outlined for generating extensive benchmarking databases from the growing population of online images available from sites such as Flickr and licenced under the new Creative Commons copyright.2Benchmarking ProjectsThis section gives a brief overview of a number of current and recent benchmarking projects relevant to CBIR systems.2.1VIPERThe VIPER1(Visual Information Processing for Enhanced Retrieval)network based at the Uni-versity of Geneva has been associated with several benchmarking efforts.These include,a web-1http://viper.unige.ch/research/benchmarking/based benchmark for Query By Example(QBE)-based CBIR systems,image browser bench-marking[20],and the Benchathlon2event.The group is also behind the development of the Multimedia Retrieval MarkUp Language3(MRML)that aims to provide a unified interface for multimedia retrieval and management software.The web-accessible benchmark for QBE-based CBIR systems was designed to allow devel-opers of image retrieval systems the opportunity to benchmark their systems online at any time. MRML was used to access the retrieval system,and queries were made based on image URLs and the results transmitted as URLs.The Benchathlon began with BIRDS-I4(Benchmark for Image Retrieval using Distributed Systems over the Internet)and was an initial step towards a standardized benchmark for CBIR systems.BIRDS-I was an image retrieval benchmark that was presented as a contest during EI2001.Participants were required to implement an image retrieval server to be tested against a ground-truth via a set of defined metrics.The Benchathlon aimed to develop a networked system benchmark for CBIR,along the lines of existing benchmarks for text retrieval and rela-tional database management.Muller et al.[17]reported that while the Benchathlon initiated discussion amongst participants no systematic comparison between systems was started.2.2IAPRThe International Association for Pattern Recognition’s(IAPR)Technical Committee12(TC-12)has worked towards a standardised benchmark for the comparison of multimedia retrieval systems[8,23].The aim was to identify and evaluate the relative strengths and weaknesses of different approaches by providing standard sets of data,queries,and performance metrics.Leung and Ip[8]made several initial recommendations concerning the development of a CBIR benchmark.They proposed that an extensible suite of benchmarks should be developed to cater for the disparate requirements of different applications,and that benchmarking image collections must be made freely available to researchers and must be free from any conditions or restrictions of use.It was recommended that initially1,000images be used for a CBIR benchmark,and this number be increased over time.All images should be in JPEG format and should contain multiple objects,with diverse relationships between them.Twenty evaluation queries covering a representative cross-section of contents should be designed against these images.Queries should be based entirely on the visual contents of the images(meta-data must not be used)and each query should be correctly“answered”by a known ground truth set of images.The number of answer images per query should be less than a specified amount,as should the number of images the algorithm returns at any one time.The proposed measures for evaluating performance included:recall,precision,average number of stages for retrieving the relevant images,average rank of the relevant images,effectiveness of query language and model,and effectiveness of relevance feedback.These specifications formed the basis of the IAPR TC-21Benchmark[23].The bench-mark consisted of,a set of still natural images,a representative set or queries,ground truths 2/4/associated with these queries,and a set of recommended performance metrics.The benchmark concentrated on the retrieval of semantic content(e.g.image contains car,person,etc.).2.3Computer Vision BenchmarksComputer vision algorithms offer a means for CBIR systems to extract semantic content from images.Two key areas of growing relevance for CBIR systems are segmentation and object recognition.Both of these have recently been the subjects of major benchmarking campaigns.2.3.1The Berkeley Segmentation Dataset and BenchmarkThe Berkeley Segmentation Dataset and Benchmark5consist of12,000hand-labeled segmen-tations of1,000images from30human subjects[11].The original images are from the Corel database.Half of the segmentations were done on colour images,and half on grayscale.The initial public release of this data consisted of all colour and grayscale segmentations for300 images,and was divided into200training images and100test images.A method was also pre-sented for measuring how well an automatically generated segmentation matched a ground-truth segmentation,and Matlab code was provided for running the benchmark.The motivation for the benchmark was to provide a basis for comparing different algorithms,and to track progress towards human-level performance.The performance metrics developed for boundary detection[12,13]are relevant for any boundary dataset–not just the hand-labelled segmentations in the Berkley benchmark.Over-laying all human segmented boundaries for a given image generated the ground truth.The benchmark then measured the performance of a given soft segmentation6against the ground truth.A threshold was applied to the soft boundary map at many different levels(e.g.30).At each level a precision-recall curve was generated,where precision was the probability that a hypothesised boundary pixel was a true boundary pixel,and recall was the probability that a true boundary pixel was detected.Therefore,the curve showed the trade-off between misses and false positives as the detector threshold changes.A summary statistic was also produced to provide a single number summarising the algo-rithm’s performance.In the case where the precision-recall curves do not intersect,the curve furthest from the origin dominates.The harmonic mean of the precision and recall was cal-culated at each point on this curve and the maximum value over the curve was taken as the summary statistic encapsulating the algorithm’s performance.2.3.2Evaluation of Feature Detectors and DescriptorsThe pastfive years has seen a drastic increase in the success of feature-based methods in computer vision.These approaches have been used for CBIR on large databases[25,30] 5/projects/vision/grouping/segbench/6a soft segmentation is not binary,instead it gives a continuous measure for each pixel describing the confidence that that pixel is a boundary.as well as numerous other applications including,visual data mining[28],object retrieval in video[27,26],model based recognition[5,9,21,24],and object categorisation[2,3,4,22].These approaches involve three steps.Given a collection of images between which tofind correspondences:detect a set of feature points in each image,construct a feature vector provid-ing a local description of each feature point(typically invariant to orientation and scale),and match these feature vectors tofind potential matching features over the collection of images. The success of these methods relies on detecting and describing feature points in a manner that is robust to some variations in lighting,viewpoint,scale and orientation,while providing feature vectors that are distinctive enough for good matching performance.Given two images contain-ing the same object,these methods aim to extract a sufficient number of similar feature points from each image of the object to allow the objects to be matched between the two images.Recently a concerted effort was made within the EU-funded project VIBES7to present a cohesive performance comparison of methods for detecting and describing local features8.This campaign focused on affine invariant methods that provide the most generic and useful means for feature-based recognition of objects or scenes.The treatment was presented in two papers, one describing methods for detecting local feature points[15]and the other describing methods for constructing feature vectors describing these points[14],software for executing the different methods and running the benchmark was also made available9.Thefirst paper[15]reviews affine-invariant region detectors and considers performance under:blur,JPEG artifacts,light change,and scale change.Detectors considered are:Harris affine detector,Hessian affine detector,maximally stable extremal region detector,edge-based region detector,intensity extrema-based region detector,and entropy-based region detector.The second paper[14]compares the performance of local descriptors.Descriptors consid-ered are shape context,steerablefilters,PCA-SIFT,differential invariants,spin images,SIFT, complexfilters,moment invariants and cross-correlation.2.4ImageCLEFImageCLEF is the image retrieval track of the Cross Language Evaluation Forum(CLEF)[1, 18].It is not strictly a CBIR benchmarking event as it allows the use of meta-data,i.e.,text that appears around the image or in the image title.The primary purpose of the CLEF campaign is to promote the multi-lingual searching of such data,however,a secondary goal is to investigate combining text and CBIR.ImageCLEF offers two main image retrieval tasks,one over collections of photographic images and one over collections of medical images.Since its inception in2003,ImageCLEF has drawn interest from both academics and commercial research organisations from the areas of CBIR,Cross-Language Information Retrieval,and user interaction.7http://www.nada.kth.se/sullivan/VIBES/8/˜vgg/research/affine/9/˜vgg/research/affine/2.5Neural Networks Council Standards CommitteeIEEE Neural Networks Council Standards Committee has a working group on pattern recog-nition benchmarks10with the goal of providing“easy access to data sets and algorithms which may be used for benchmarking and comparison purposes via the[internet]”.There is a webpage with lists of datasets,algorithm code,and publications.2.6MUSCLEThe EU-sponsored Network of Excellence MUSCLE11(Multimedia Understanding through Semantics,Computation and Learning)is developing systems and methodologies for automat-ically extracting semantic information from multimedia data.The MUSCLE benchmarking workpackage12has been established to develop tools for evaluating and comparing these algo-rithms,and to promote the use of these tools amongst the MUSCLE members.To achieve this large test databases are being assembled and regular evaluation projects are planned.In France the Million image CLIC(CEAList Image Collection)database[16]has been as-sembled by the Laboratoire d’ingnerie de la connaissance multimdia multilingue(LIC2M/CEA-LIST).The database contains15,900images that have undergone69different transformations. The group have also organised the ImagEV AL13competition for automatic recognition of pic-tures.The competition consists of several tasks including retrieval of transformed images(about 30,000images generated from2000using various image transformations),combined text and image retrieval,text detection and recognition in images,object recognition,and attribute ex-traction(e.g.indoor,outdoor,people present,etc.).The Paris School of Mines has provided another image database containing images under different ground truth illumination conditions.In Austria the massive CIS-Benchmark database of coin images,containing over100,000 ground-truthed images and1,500object classes,has been assembled as part of Project Dagobert at the ARC Seibersdorf Research Centre.In addition,the Partial Planar Objects Database has been compiled at TU Graz and consists of20different objects seen from varying angles;ground truth includes both the object name and viewing angle.Network members have also collect numerous databases containing video with ground truth labelling.The majority of databases compiled are available for public(if not always commer-cial)use.2.7TRECVIDA recent success story in an area closely related to CBIR benchmarking is TRECVID14that started in2001as a video retrieval track of the Text REtrieval Conference(TREC).In2003 TRECVID grew into an independent evaluation forum for research in automatic segmentation, 10/nnc/index1.html1112http://muscle.prip.tuwien.ac.at/index.php14/projects/trecvid/indexing,and content-based retrieval of digital video.Its aim is to promote progress in content-based retrieval from digital video via open,metrics-based evaluation15.The evaluation is an annual event and provides a large test collection,uniform scoring procedures,and a two-day workshop for organizations interested in comparing the results of their video retrieval systems.For2005the tasks considered for the TRECVID evaluation were:shot boundary detection, classification of types of camera motion,high-level feature extraction,a high-level search task which including query-based retrieval and browsing,and exploration of raw unedited BBC footage(rushes).High-level features were considered to be labels that were clear to humans, such as people walking/running:segment contains video of more than one person walking or running,or USflag:segment contains video of a USflag.A request to establish a CBIR track at TREC was rejected on the grounds that there were no databases large enough that could be freely distributed[18].2.8PEIPAThe principal aim of the Pilot European Image Processing Archive16(PEIPA)is to provide in-formation,datasets and software to measure and compare the effectiveness of image processing and computer vision algorithms.The archive is supported by the EU-funded project Perfor-mance Characterization in Computer Vision(PCCV)for Benchmarking Vision Systems17,the University of Essex,and the British Machine Vision Association.It offers a comprehensive online resource covering many aspects of benchmarking and performance characterisation in computer vision,including tutorials on benchmarking and links to databases.PEIPA aims to distribute test datasets to researchers so they can quantify and compare the performance of their algorithms.A test harness called HATE has been prepared to automate much of this process, and results can optionally be uploaded to the PEIPA website and made available to other re-searchers interested in making comparisons.3The Challenge of Assembling Test DataOne of the greatest challenges facing the CBIR benchmarking community is the availability of test databases[18].These databases not only need to contain thousands of images with associated ground truths,but they must be royalty-free so they can be freely distributed.This leads to two key problems:obtaining royalty free images,and generating ground truth.Many databases do exist,but these have typically been limited to contain material that has been donated or specially captured by the creators of the database.This has restricted the devel-opment of very large databases and made database generation a labour intensive process.While some creative solutions have been found,such as collaboration with Project Dagobert to form the CIS-benchmark,and using image transformations to extend database size[16],it remains to find a general solution to generating diverse,realistic databases for CBIR benchmarking.15Guidelines for the TRECVID2005Evaluation.16/index.html17/benchmark/A solution to the copyright issue is offered by Creative Commons18,a non-profit organi-sation that offers artists and authors an alternative to full copyright.Breaking away from the traditional“all rights reserved”copyright Creative Commons offers a“some rights reserved”copyright,allowing copyright holders to licence their material freely or with constraints such as Noncommercial,No Derivative Works or Share Alike.Importantly Creative Commons has been embraced by many online organisations including Flickr19—one of the most popular image sharing site on the internet—which is the home of millions images from users across the globe.Flickr’s Creative Commons pool20provides a searchable database of publicly licensed pho-tos.There are currently more than4million images available under Creative Commons licenses at Flickr and this number is steadily increasing.Many of these images also have“tags”describ-ing their content and comments from users who have viewed the image.Automatically building databases from publicly licensed images from sites like Flickr(or OpenPhoto21)simply requires writing a web-crawler to autonomously browse the site,down-loading images and their associated tags,comments,and author and copyright information,and compiling this into a database.Tags and comments can provide an initial basis for generating ground truth,and author and copyright information can be used to ensure that copyright restric-tions are adhered.As Flickr allows uses to“tag”and comment on images on an ongoing basis, it is possible to have the web-crawler automatically update the tags and comments associated with each image as additional information is posted.Thousands of users add images,tags and comments to Flickr on a daily basis.This is an invaluable opportunity to generate test data from the very environment that CBIR systems are built for,and to spur development towards the day when CBIR systems are helping the users of such sitesfind the content they require.4ConclusionToday effective benchmarking of CBIR is within reach.Frameworks have been established and effective methodologies outlined.The challenge remains to tune performance measures to the needs of developers,potential users and buyers of CBIR systems,and assemble large realistic test databases.With the ever-increasing growing amount of image content available online under the Creative Commonsflexible copyright,material for databases can be compiled rapidly and efficiently without traditional copyright bining this with forums like Flickr that allow multi-user posting,labelling and commenting of images,and it is becoming feasible to establish the realistic test databases required for a general“TREC-style”CBIR benchmark. References[1]Paul Clough,Mark Sanderson,and Henning M¨u ller.The clef cross language image retrieval track(imageclef)2004.In CIVR,pages243–251,2004.518/19fl20http://www.fl/creativecommons/21/[2]G.Csurka,C.Dance,C.Bray,and L.Fan.Visual categorization with bags of keypoints.InProceedings Workshop on Statistical Learning in Computer Vision,2004.5[3]Gy.Dork´o and C.Schmid.Selection of scale-invariant parts for object class recognition.In ICCV,pages634–640,2003.5[4]R.Fergus,P.Perona,and A.Zisserman.Object class recognition by unsupervised scale-invariantlearning.In Proceedings of the IEEE Conference on Computer Vision and Pattern Recognition, volume2,pages264–271,Madison,Wisconsin,June2003.5[5]Vittorio Ferrari,Tinne Tuytelaars,and Luc J.Van Gool.Simultaneous object recognition andsegmentation by image exploration.In ECCV(1),pages40–54,2004.5[6]O.Firschein,M.Fischler,and Takeo Kanade.Creating benchmarking problems in machine vision:Scientific challenge problems.In Proceedings of the1993DARPA Image Understanding Workshop, April1993.2[7]N.Gunther and G.Beretta.Benchmark for image retrieval using distributed systems over theinternet:Birds.Technical report,HP Labs,2000.2[8]Clement H.C.Leung and Horace Ho-Shing Ip.Benchmarking for content-based visual informationsearch.In VISUAL’00:Proceedings of the4th International Conference on Advances in Visual Information Systems,pages442–456,London,UK,2000.Springer-Verlag.2,3[9]David G.Lowe.Object recognition from local scale-invariant features.In ICCV’99:Proceedingsof the International Conference on Computer Vision-Volume2,page1150,Washington,DC,USA, 1999.IEEE Computer Society.5[10]St´e phane Marchand-Maillet.Construction of a formal multimedia benchmark.In Proceedings ofthe European Signal Processing Conference(EUSIPCO2002),Toulouse,France,September2002.(Invited paper).2[11]D.Martin,C.Fowlkes,and J.Malik.A database of human segmented natural images and its ap-plication to evaluating segmentation algorithms and measuring ecological statistics.International Conference on Computer Vision,July2001.2,4[12]David R.Martin,Charless Fowlkes,and Jitendra Malik.Learning to detect natural image bound-aries using brightness and texture.In NIPS,pages1255–1262,2002.4[13]David R.Martin,Charless Fowlkes,and Jitendra Malik.Learning to detect natural image bound-aries using local brightness,color,and texture cues.IEEE Trans.Pattern Anal.Mach.Intell., 26(5):530–549,2004.4[14]K.Mikolajczyk and C.Schmid.A performance evaluation of local descriptors.IEEE Trans PatternRecognition and Machine Intelligence,pages1615–1630,October2005.2,5[15]K.Mikolajczyk,T.Tuytelaars,C.Schmid,A.Zisserman,J.Matas,F.Schaffalitzky,T.Kadir,andL.Van Gool.A comparison of affine region detectors.Accepted in International Journal of Com-puter Vision,2005.2,5[16]P-A.Mo¨e llic,P.H`e de,G.Grefenstette,and let.Evaluating content based image retrievaltechniques with the one million images clic testbed.In Proc World Enformatika Congress,pages 171–174,Istanbul,Turkey,February25-272005.6,7[17]H.M¨u ller,P.Clough,A.Geissbuhler,and W.Hersh.Imageclef2004-2005:results,experiencesand new ideas for image retrieval evaluation.In Proceedings of the Fourth International Workshop on Content-Based Multimedia Indexing(CBMI2005),to appear,Riga,Latvia,2005.2,3[18]H.M¨u ller,A.Geissbuhler,S.Marchand-Maillet,and P.Clough.Benchmarking image retrievalapplications.In Visual Information Systems,2004.5,7[19]Henning M¨u ller,Wolfgang M¨u ller,St´e phane Marchand-Maillet,David McG.Squire,and ThierryPun.A framework for benchmarking in visual information retrieval,2003.2[20]Wolfgang M¨u ller,St´e phane Marchand-Maillet,Henning M¨u ller,and Thierry Pun.Towards a fairbenchmark for image browsers.In SPIE Photonics East,Voice,Video,and Data Communications, Boston,MA,USA,5–82000.3[21]Step´a n Obdrz´a lek and Jiri Matas.Object recognition using local affine frames on distinguishedregions.In BMVC,2002.5[22]Andreas Opelt,Michael Fussenegger,Axel Pinz,and Peter Auer.Weak hypotheses and boostingfor generic object detection and recognition.In ECCV(2),pages71–84,2004.5[23]Paul Over,Clement H.C.Leung,Horace Ho-Shing Ip,and Micheal Grubinger.Multimedia re-trieval benchmarks.IEEE Multimedia,11(2):80–84,April-June2004.3[24]F.Rothganger,zebnik,C.Schmid,and J.Ponce.3d object modeling and recognition usingaffine-invariant patches and multi-view spatial constraints.In CVPR(2),pages272–280,2003.5 [25]Cordelia Schmid and Roger Mohr.Local grayvalue invariants for image retrieval.IEEE Trans.Pattern Anal.Mach.Intell.,19(5):530–535,1997.4[26]Josef Sivic,Frederik Schaffalitzky,and Andrew Zisserman.Object level grouping for video shots.In ECCV(2),pages85–98,2004.5[27]Josef Sivic and Andrew Zisserman.Video google:A text retrieval approach to object matching invideos.In ICCV,pages1470–1477,2003.5[28]Josef Sivic and Andrew Zisserman.Video data mining using configurations of viewpoint invariantregions.In CVPR(1),pages488–495,2004.5[29]Arnold W.M.Smeulders,Marcel Worring,Simone Santini,Amarnath Gupta,and Ramesh Jain.Content-based image retrieval at the end of the early years.IEEE Trans.Pattern Anal.Mach.Intell.,22(12):1349–1380,2000.1[30]Tinne Tuytelaars and Luc J.Van Gool.Content-based image retrieval based on local affinely in-variant regions.In VISUAL’99:Proceedings of the Third International Conference on Visual Information and Information Systems,pages493–500,London,UK,1999.Springer-Verlag.4 [31]Kelvin William Thompson.Popular lectures and addresses[1891-1894].In Bartlett’s FamiliarQuotations,Fourteenth Edition,page723a.1968.2。

Urban, J. and Jose, J.M. and van Rijsbergen, C.J. (2006) An adaptive technique for content-based image retrieval. Multimedia Tools and Applications 31(1):pp. 1-28./3586/An Adaptive Technique for Content-Based Image Retrieval Jana Urban,Joemon M.Jose and Cornelis J.van Rijsbergen({jana,jj,keith}@)Department of Computing Science,University of Glasgow,Glasgow G128RZ,UK Abstract.We discuss an adaptive approach towards Content-Based Image Re-trieval.It is based on the Ostensive Model of developing information needs—a special kind of relevance feedback model that learns from implicit user feedback and addsa temporal notion to relevance.The ostensive approach supports content-assisted browsing through visualising the interaction by adding user-selected images to a browsing path,which ends with a set of system recommendations.The suggestionsare based on an adaptive query learning scheme,in which the query is learnt from previously selected images.Our approach is an adaptation of the original Ostensive Model based on textual features only,to include content-based features to char-acterise images.In the proposed scheme textual and colour features are combined using the Dempster-Shafer theory of evidence combination.Results from a user-centred,work-task oriented evaluation show that the osten-sive interface is preferred over a traditional interface with manual query facilities. This is due to its ability to adapt to the user’s need,its intuitiveness and thefluidway in which it operates.Studying and comparing the nature of the underlying information need,it emerges that our approach elicits changes in the user’s need based on the interaction,and is successful in adapting the retrieval to match the changes.In addition,a preliminary study of the retrieval performance of the osten-sive relevance feedback scheme shows that it can outperform a standard relevance feedback strategy in terms of image recall in category search.Keywords:content-based image retrieval,adaptive retrieval,ostensive relevance, relevance feedback,user evaluationAbbreviations:CBIR–Content-based Image Retrieval;RF–Relevance Feedback;OM–Ostensive Model1.IntroductionThe semantic gap has become a buzzword in Content-based Image Retrieval(CBIR)research.It refers to the gap between low-level im-age features and high-level semantic concepts.Despite considerable research effort in thisfield over the last decade,there has not been any significant success for generic applications.Today,the research community has accepted the fact that it will probably be impossible to retrieve images by semantic content for several years.Instead,people have started to exploit relevance feedback techniques.Relevance feed-back is regarded as an invaluable tool to improve CBIR effectiveness,c 2004Kluwer Academic Publishers.Printed in the Netherlands.2Urban et alnot only because it provides a way to embrace the individuality of users, but it is indispensable in bridging the semantic gap.The semantic gap has further implications on the query formulation process.Since low-level features do not directly reflect the user’s high-level perception of the image content,the query formulation process is even more difficult than in text retrieval systems.Moreover,the underlying search need is dynamic and evolving in the course of a search session.Most often,image searching is explorative in nature, where searchers initiate a session and learn as they interact with the system.However,current CBIR systems fail to deal with the dynamic nature of search needs.In this work,we introduce an adaptive retrieval system,which places particular emphasis on the“human in the loop”.In the proposed system the retrieval process is iterative,updating the system’s knowledge of the user’s information need based on the user’s implicit feedback.To this end,it incorporates an adaptive image retrieval technique based on the Ostensive Model(OM)of developing information needs[3].In the underlying interaction model the user builds up a browsing tree of interesting images by choosing one image from a recommended set to be appended to the browsing path in each iteration.The system’s recommendations are based on a query constructed from the current path of images.For the query,each image in the path is considered relevant,but the degree of relevance is dependent on age:it decreases over time when new images are appended.In this way,the OM is a special kind of relevance feedback model,in which a query is refined by the user implicitly selecting images for feedback.It recognises and addresses the issue of dynamic nature of information needs,and has the advantage of allowing for an intuitive and user-centred search process.In order to evaluate the effectiveness of the ostensive relevance ap-proach,we built three systems:a baseline system with manual query facilities and two variances based on the OM.Results of a user-centred, work task-oriented evaluation show that the ostensive browsing inter-faces are generally preferred over the comparative system.Its strengths are considered to lie in its ability to adapt to the user’s need,and its very intuitive andfluid way of operation.In addition,the retrieval performance of the underlying technique is evaluated in a simulated environment assuming a user conducting cate-gory search.In comparison to a traditional relevance feedback technique as baseline,it shows that the query learning scheme based on the OM can outperform the baseline strategy in terms of the total number of images belonging to a specific category found.The main contributions of this paper are three-fold.First,we show how the OM can be adapted to both textual and content-based featuresAn Adaptive Technique for CBIR3 with the proposed query learning scheme.Second,we provide results from an extensive user evaluation of CBIR st but not least, we highlight the merits of the ostensive relevance feedback strategy in terms of retrieval performance and point out future directions for a continuative evaluation.The remainder of the paper is organised as follows.Section2pro-vides an account of the motivations for our approach:the intrinsic difficulties of the query formulation process and a review of current approaches to relevance feedback.In particular,these are compared to the notion of ostensive relevance.In Sections3&4we introduce the systems we used for the evaluation and describe the proposed adaptive query learning scheme.The experimental methodology is detailed in Section5,followed by a review of our experimental results.The main findings of the user study are summarised and discussed in Section7, while Section8adds results of a quantitative evaluation of the under-lying query learning scheme.Finally,we conclude and provide a brief outlook to the future.2.Content-based Image RetrievalEvery information seeking process is necessarily initiated by an infor-mation need on the user’s side.Therefore,the success of a retrieval system depends largely on its ability to allow the user to communicate this need.For the user,the query formulation often poses a signifi-cant hurdle due to manifold reasons,which will be discussed briefly in this section.A popular means to overcome these problems is relevance feedback.This section therefore also covers the idea behind relevance feedback and discusses some examples in the CBIR literature.2.1.Query Formulation ProblemOne of the major issues in information searching is the problems asso-ciated with initiating a good query.However,it has been well accepted that searchersfind it hard to generate a query due to the following reasons[21].Firstly,searchers do not know how the documents are rep-resented.This is especially true for CBIR systems due to the low-level representation of content-based features.It is substantially difficult to formulate a query in terms of the system’s internal representation of the documents,which is often composed of a collection of low-level features in the pixel domain.Secondly,the underlying information need itself is typically vague (“I don’t know what I’m looking for,but I’ll know when Ifind it”[28]).4Urban et alDue to the uncertainty about what information is available or about the actual need itself,a search process usually starts with an explorative phase,in which the user tries the system and its options,and tests what kind of information is returned.Through exposure to new objects, the user’s context is changing and their knowledge state is developing, triggering changes in the user’s need[10,8].This often leads the user to reformulate the initial query either to make it more precise after having gained some knowledge about the collection make-up,or to steer it in different directions after having seen other interesting documents,or a combination of both.2.2.Relevance FeedbackIn order to alleviate the query formulation problem,a popular approach is to incorporate relevance feedback into the retrieval system.Relevance feedback is a commonly accepted means to improve retrieval effective-ness and has been studied extensively(e.g.[19,21]).In IR systems incorporating relevance feedback,the search process is initiated with a user-supplied query,returning a small number of documents to the user.The user is then given the possibility of indicating which of the returned documents are actually useful(relevant).Based upon those user relevance judgments the original query is automatically reformu-lated.The new query is again matched against the documents in the collection,returning an improved set of documents.This process can continue until the user’s information need is satisfied.As a consequence, a retrieval system based on relevance feedback is inherently interactive.As mentioned earlier,relevance feedback is a tool to kill two birds with one stone.It is used to bridge the semantic gap by avoiding or helping the query formulation process,while at the same time it natu-rally provides a way to embrace the individuality of users.The user’s judgement of relevance is naturally based on their current context, their preferences,and also their way of judging the semantic content of the images(e.g.[23,7]).Initially,the system uses the low-level image features as a quick way to‘estimate’the relevance values of the images. By prompting the user for relevance feedback,this rough estimation can be improved to steer the results in the direction the user has in mind.A comprehensive study of existing relevance feedback techniques in image retrieval can be found in[35].2.2.1.AssumptionsDifferent methods have been adopted on the basis of often diverging assumptions.One major variance is what actually is fed back to the sys-tem.Often,binary feedback for positive and negative examples is usedAn Adaptive Technique for CBIR5(e.g.,[29]),some additionally associate a‘degree of(ir)relevance’(e.g.,[18]),and others interpret the feedback only as a‘comparative judg-ment’(e.g.,[6]).Depending on the assumptions taken in this respect, the resulting systems can be distinguished further:While positive feed-back has been used for feature selection(e.g.,[17])or feature relevance weighting(e.g.,[18,11]),using both positive and negative feedback gives rise to treating the retrieval process as a classification or learning problem.Many systems now strike the latter path,transferring meth-ods previously employed mainly in thefield of artificial intelligence (e.g.,[30,34,29]).However,they are hindered by one major obstacle, namely the small sample issue[35].The user feedback in each iteration only gives a tiny number of training samples relative to the high dimen-sion of the feature space and the possible number of classes for general multimedia data.Consequently the results are unreliable on their own, requiring a lot of extra effort,e.g.an off-line training phase following the on-line search as employed in[34]to arrive at meaningful results.This is often undesirable,since it militates against the real-time requirement of relevance feedback.The main advantage of relevance feedback,namely that it allows real-time learning from user interaction to improve the system’s performance during one search session,is thus undermined.A further characteristic of existing systems is how they gain infor-mation about the user’s judgment of relevance.One can distinguish between two distinct approaches:explicit and implicit relevance feed-back.Explicit relevance feedback,which is assumed in most current systems(e.g.,[6,18,30]),asks the user to explicitly state whether a returned document is relevant or not.Therefore,the user interface has to provide for facilities to input this judgment by the user.This (additional)task is often considered as a burden to the user,since it is difficult for most users to assess the degree of relevance of one document in terms of a numeric value[33],which presumes consid-erable knowledge of the retrieval environment.Even though it might be much easier to determine whether an image is actually relevant to the user compared to formulating a good query,it still requires often considerable cognitive effort from the user to communicate this relevance assessment to the system.For this reason,a less-distracting possibility to gain relevance feedback is implicitly from the users,simply by observing their interaction with the system[32].Another assumption underlying nearly all current relevance feedback techniques is that a user’s information need is static and there is no provision for updating user’s judgements.Especially those techniques that attempt to classify or separate the document space into relevant and non-relevant,explicitly rely on the assumption that—within one search session—all documents are either relevant or not regarding the6Urban et aluser’s information need.In other words all documents are assumed of having constant relevance values.However,this is a rather simplifying view of the real-world.Not only are the user’s actions time-dependent—resulting in giving inconsistent feedback,but even more importantly, the user’s goals are also time-dependent and might change either grad-ually or quite abruptly.The trigger for such changes is most often a result of having come across something interesting that they have not even considered at the beginning of the search.For this reason the system proposed here is based on the Ostensive Model,which captures “the intentionality of an information need that is assumed to be devel-oping during the searching session”[2].The details of the model will be described in Section2.4.In order to avoid asking the user for explicit relevance feedback, the approach taken here is the one of interpreting a user’s selection of one document over others as an indication that this document is more relevant.Due to this‘ostensive’approach,and in fact the Ostensive Model underlying this system,only positive examples are there to work with.The positive feedback is used for query learning,in which the query itself is learnt and subject to adaptation.On the basis of the documents selected,the system creates a new query consisting of a combination of these documents’features.This query adapts in every iteration of the retrieval process.2.3.Query Learning ApproachesTo relieve the user from the query formulation problem,a method that is able to“guess”or“learn”the user’s desires purely from a set of exam-ples is believed to be very advantageous.Algorithms for CBIR that rely on query refinement as a way of incorporating relevance feedback have attracted a lot of interest(e.g.,[11,18,20]).They are based on the early work on query shifting in the text retrieval domain[19].Query shifting is the prevalent technique of adapting an initial query,which aims at moving the query toward the region of the feature space containing the set of relevant documents and away from the region of the set of non-relevant documents[11,18,20].The underlying assumption is that the user has an ideal query in mind,and the system’s task is tofind this ideal query.Often query refinement methods are used in combination with feature re-weighting,which is based on a weighted similarity mea-sure where relevance feedback is used to update the weights associated with each feature in order to model the user’s need[11,18,20].The approach proposed in this paper is a form of dynamic query learning,combining both query shifting and feature re-weighting tech-niques.Unlike other query learning methods,which lack the ability toAn Adaptive Technique for CBIR7 adjust the degree of relevance over time,the emphasis in our approach lies on dynamically adapting relevance values.The temporal dimen-sion to the notion of relevance introduced in the Ostensive Model is exploited to achieve this different view of adaptive query.The details of the model will be described in the following.2.4.Ostensive RelevanceThe Ostensive Model(OM)of developing information needs was ini-tially proposed by Campbell and van Rijsbergen[4].It combines the two complementary approaches to information seeking:query-based and browse-based.It supports a query-less interface,in which the user’s indication of interest in an object—by pointing at it—is interpreted as evidence for it being relevant to their current information need.There-fore,it allows direct searching without the need of formally describing the information need.The query is automatically evolved from a path of documents selected in the course of one search session.By accepting that the user’s need is dynamically changing during a search session,the OM adds a temporal dimension to the notion of relevance.A recently selected object is regarded more indicative to the current information need than a previously selected one.So,in this sense,the degree to which a document is considered relevant is continuously updated to reflect the changing context.The definition of Ostensive Relevance summarises the main points[3]:The Ostensive Relevance of an information object is the degree to which evidence from the object is representative/indicative of the current information need.The interaction with an Ostensive Browser follows an intuitive scheme. Here the user starts with one example document as the query,and as a result is presented with a new set of candidate documents(top ranking documents according to the similarity measure used).As a next step,the user—through selecting one of the returned documents—updates the query,which now consists of the original document and the selected document of the set of returned candidates.After a couple of iterations,the query is based on a path of documents.Similarly to the Path Model described in[5]for activity-centred information access, emphasis is set on the user’s activity and the context,rather than the predefined internal representation of the data.A path represents the user’s motion through information,and taken as a whole is used to build up a representation of the instantaneous information need.The weight of how much each document along the path contributes to the next query can be chosen with different objectives in mind. The weighting schemes are referred to as ostensive profiles,and reflect8Urban et alFigure1.The ostensive pathhow relevance(or uncertainty)changes with age(age being interpreted as the order of selection or the position along the path).With the previously elaborated considerations in mind,the most plausible profile supports uncertainty increasing with age.The further back in time one document has been selected during the retrieval process,the more uncertainty is associated with it that it actually reflects the user’s infor-mation need,or in other words,the less relevant it is considered for the query.This profile is also the one favoured by the original definition of Ostensive Relevance.For a comparative evaluation of different profiles and their interpretations please refer to[2].Since the whole path is visible to the users,they can jump back to a previous object along the path if they get the feeling that they are stuck or moving in the wrong direction.From there a new path can be explored,starting from the original object(the root)and the newly selected object.The resulting paths form a tree-like structure, originating from one root and branching at various objects(see Fig.1).The OM thus captures the developing information need of the user during a search process,and incorporates the uncertainty,which nec-essarily exists due to the imprecise awareness of one’s own information need and the difficulties of expressing it.In its original conception the OM was integrated with the Binary Probabilistic Model(BPM)of IR to create an operational retrieval model[3].This was possible,since the images that were used in the implementation of the OM were represented by a set of index terms. However,if one takes into account content-based features to index images,the interpretation of the BPM becomes rather difficult.In the BPM,relevance scores are based on estimating or calculating the prob-abilities that,if the document is relevant(or non-relevant respectively),An Adaptive Technique for CBIR9 a particular feature will be observed.In other words,the probability is assessed depending on whether some chosen feature is either present or absent.This interpretation was developed in the text retrieval domain, where a document can be represented by a set of index terms only. CBIR systems rely on more complex indexing features,in which it is hard to tell whether a particular feature can be observed.It is ques-tionable whether or not content-based image features can be treated in a binary fashion,e.g.is it sensible to say the image contains the index term“green”if the colour histogram contains non-zero values for the bins referring to green?What makes matters even more complicated is the fact that most CBIR systems rely on multiple representations of image content.It becomes apparent that the interpretation of the binary probabilistic model in terms of content-based image features is rather inappropriate.For this reason,we introduce the use of adaptive queries within an operational retrieval system based on the OM.3.The SystemsTo test our ideas about adaptive query learning strategies,three proto-type system have been implemented and evaluated.In this section we will describe these systems.3.1.Features&SimilaritiesThe systems use two distinct features:text annotations and visual features.The text feature is extracted from the keyword annotations of the images,and the visual feature is based on colour histograms representing an image’s global colour distribution represented in the HSV colour space.An image is represented by a two-dimensional feature vector,which is a term vector(text feature)and a histogram bin vector(colour feature)respectively.The term vector is weighted by the tf×id f (term frequency,inverse document frequency)weighting scheme.The similarity between documents is calculated as the combined score of the two similarity values for each feature using the Dempster-Shafer combination(see Section4.1).In the case of text similarity,the cosine measure[22]is used:sim(D,Q)=T V D·T V Q ||T V D||||T V Q||while the visual similarity is determined by histogram intersection[27]:sim(D,Q)= lHi=1min(H D[i],H Q[i]) min(||H D||,||H Q||)where T V stands for a document’s term vector,H for its colour his-togram vector,and l H for the histogram vector length.Both similar-ity measures are widely used in combination with the chosen feature representation.3.2.The Interfaces3.2.1.The Ostensive BrowsersTwo versions of the ostensive browsing approach have been imple-mented:one with a pure ostensive browsing scheme(Fig.2(b))and the other allowing explicit feedback within ostensive browsing(Fig.2(c)). In both systems the user starts with an image in the browse panel (in Fig.2(c)-2).The initial image is obtained in a pre-keyword search from which the user is given the opportunity to choose an image to explore further.When selecting an image,the system returns a set of most similar images as candidate images.We chose to present six images as new candidates.Of those candidates,the user clicks on the most appropriate one.At this stage,the system computes a new set of similar images based on an adapted query and presents it to the user. As in Figure2(b)&(c),this process creates a path of images,which is represented in the interface.At any point the user can go back to previously selected images in the path and also branch off,by selecting a different candidate.The complete search session can continue to iterate between keyword search followed by browsing sessions,as long as the user is not satisfied with the retrieved images.Since the screen space is very limited the different paths are often overlapped resulting in a large degree of clutter,afish-eye view as alternative(see Fig.2(b))is provided.The user can switch between these views during the search.To view details of the image,there is the possibility of viewinga single selected image in full-size in a separate panel(in Fig.2(c)-3).It also contains some meta-data about the document,such as the photographer,title,date,and description.In between the full-size view and the thumbnails,a quick view is shown as a popup when the user moves the mouse over a thumbnail in the browse panel.Both browsers(Fig.2(b-c))attempt to adapt the query based on the user’s implicit feedback,which will be described in Section4.We provided two slightly different versions of the Ostensive Browser to allow for different levels of control.The Pure Ostensive Browser (POB)(Fig.2(b))does not allow for any control of feature terms or(a)MQS(b)POB(c)COBFigure2.The interfaces.weighting between the features.The system automatically adapts the query and also the feature weights.The learning of the feature weights is achieved in a similar fashion to[18],and they will be used as trust values in Dempster-Shafer’s evidence combination(see Section4.1)to combine the similarity scores.In addition,the interface for the Controlled Ostensive Browser (COB)provides options for selecting the features and their associated weights(in Fig.2(c)-1).It displays the search terms the system used to obtain the currently shown candidates.The automatically selected terms(the strategy of the selection is described in Section4),can bechanged by the user and thus the current candidates are exchanged for the ones resulting from the updated query.Another aspect of control is the adjustment of the feature weights.The user can control the weights between the two features by means of a slider.How to start the search?The problem with the ostensive search is the question of how to initiate the search,i.e.how to choose thefirst image that starts the path.As mentioned earlier,the current solution is to ask the user to formulate a keyword query,which returns a set of relevant images based on the textual feature.One of the returned images can then be chosen as the starting point.However,this is a rather ad-hoc approach,which again requires the user to formulate a query.We are currently investigating different solutions to this problem. One approach could be to pre-cluster the whole collection,and let the user browse through these clusters to choose a starting point.3.2.2.The Manual Query SystemAs baseline system,we used the Manual Query System(MQS)(Fig.2(a)) resembling a‘traditional’image retrieval system,which returns a set of relevant images in response to a user-given query.A query can be formulated by a set of keywords,and/or one or more images as‘visual examples’.The user can also set the weighting between the two features. If not satisfied with the results returned by the system,the user has to alter their query and so forth.4.Query Adaptation TechniquesIn the course of a search session,a user creates and moves along a path of images.During each iteration,the path changes and the query needs to be adapted accordingly.The selected documents are treated as evidence of the user’s information need,with a changing degree of uncertainty associated to each document:the older the evidence,the more uncertain we are that it is still indicative of the current infor-mation need.The degree of uncertainty is represented by an ostensive relevance profile[2],used to weigh the contribution of each path doc-ument.A separate query is constructed for each feature as a weighted combination of the documents’features.Text Query:A new text query vector is created by updating the term’s intrinsic weights(e.g.inverse document frequency(idf))with the ostensive relevance weights resulting from the ostensive profile.The query vector then consists of the union of the set of terms that appear in。
计算机工程应用技术本栏目责任编辑:梁书阿里云平台快速接入企业数据带来的益处戴俊梅1,陈龙2(1.南京大学金陵学院,江苏南京210000;2.南京烽火星空通信发展有限公司,江苏南京210000)摘要:据IDC 报告显示我国已进入大数据时代。
众厂商各类服务系统中传统的数据处理逐渐演变成独立的计算业务,从而为社会各界提供服务。
但企业自行建造大数据平台门要求高,诸如资金、场地、人员、技术等。
有幸,阿里云平台提供了一个开放、兼容的大数据生态平台体系,为中、小、微企业对大数据计算的需求提供了坚实后盾。
关键词:大数据;中小微企业;开放的计算平台;集群;在线计算;兼容;优势中图分类号:G642文献标识码:A文章编号:1009-3044(2020)34-0217-02开放科学(资源服务)标识码(OSID ):The Benefit of Enterprise Using Alibaba Cloud Platform DAI Jun-mei 1,CHEN Long 2(1.Nanjing University Jinling College,Nanjing 210000,China;2.Nanjing Fiberhome Starrysky Co.,Ltd,Nanjing 210000,China)Abstract:According to the IDC report,China has entered the era of big data.The traditional data processing in various service sys⁃tems which made by various manufacturers has gradually evolved into an independent business which supplys calculation.Howev⁃er,companies will be encounter with huge difficulties when building own big data platform.luckly,Alibaba Cloud platform can support computing capability of big data compatibly and sharing.these services can satisfy the desire of SME enterprises on big da⁃ta processing.Keywords :big data ;SME enterprises ;opening cloud platform ;cluster ;OLTP;compatibility ;advantage1大数据基本背景2018年IDC 发布的数字研究报告(Digital Universe )显示,我们所产生的数据量将超过40ZB (泽字节)。

专利名称:CONTENT BASED IMAGE RETRIEVAL 发明人:PÉREZ DE LA COBA, Sira申请号:EP2014/067056申请日:20140808公开号:WO2015/032585A1公开日:20150312专利内容由知识产权出版社提供专利附图:摘要:A method and non-transitory computer readable medium for content based image retrieval. The method includes selecting a query image, segmenting the selected query image by applying a segmentation technique, extracting features from the segmented query image by determining at least two feature descriptors, including colorfeature descriptors and texture feature descriptors, and determining a similarity of the query image to a plurality of images included in a database using the determined at least two feature descriptors of the segmented query image, features being extracted from each of the plurality of images included in the database by determining the at least two feature descriptors, the color feature descriptors and the texture feature descriptors including a simultaneous combination of different color spaces, and global and local statistical measurements being carried out on the simultaneous combination of the different color spaces.申请人:SHOT & SHOP地址:Avda. de los Prunos, 15, PE, 1ºB E-28042 Madrid ES国籍:ES代理人:DE CARLOS HERNANDO, Borja更多信息请下载全文后查看。
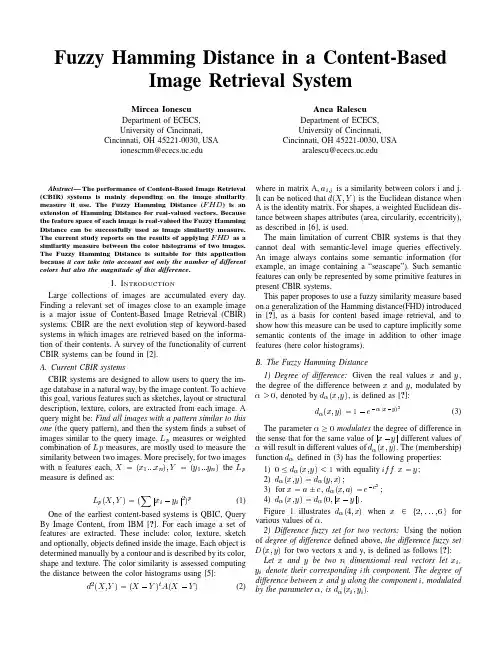
Fuzzy Hamming Distance in a Content-Based Image Retrieval SystemMircea IonescuDepartment of ECECS,University of Cincinnati, Cincinnati,OH45221-0030,USA ionescmm@Anca RalescuDepartment of ECECS,University of Cincinnati, Cincinnati,OH45221-0030,USA aralescu@Abstract—The performance of Content-Based Image Retrieval (CBIR)systems is mainly depending on the image similarity measure it use.The Fuzzy Hamming Distance()is an extension of Hamming Distance for real-valued vectors.Because the feature space of each image is real-valued the Fuzzy Hamming Distance can be successfully used as image similarity measure. The current study reports on the results of applying as a similarity measure between the color histograms of two images. The Fuzzy Hamming Distance is suitable for this application because it can take into account not only the number of different colors but also the magnitude of this difference.I.I NTRODUCTIONLarge collections of images are accumulated every day. Finding a relevant set of images close to an example image is a major issue of Content-Based Image Retrieval(CBIR) systems.CBIR are the next evolution step of keyword-based systems in which images are retrieved based on the informa-tion of their contents.A survey of the functionality of current CBIR systems can be found in[2].A.Current CBIR systemsCBIR systems are designed to allow users to query the im-age database in a natural way,by the image content.To achieve this goal,various features such as sketches,layout or structural description,texture,colors,are extracted from each image.A query might be:Find all images with a pattern similar to this one(the query pattern),and then the systemfinds a subset of images similar to the query image.measures or weighted combination of measures,are mostly used to measure the similarity between two images.More precisely,for two images with n features each,the measure is defined as:(1) One of the earliest content-based systems is QBIC,Query By Image Content,from IBM[?].For each image a set of features are extracted.These include:color,texture,sketch and optionally,objects defined inside the image.Each object is determined manually by a contour and is described by its color, shape and texture.The color similarity is assessed computing the distance between the color histograms using[5]:(2)where in matrix A,is a similarity between colors i and j. It can be noticed that is the Euclidean distance when A is the identity matrix.For shapes,a weighted Euclidean dis-tance between shapes attributes(area,circularity,eccentricity), as described in[6],is used.The main limitation of current CBIR systems is that they cannot deal with semantic-level image queries effectively. An image always contains some semantic information(for example,an image containing a“seascape”).Such semantic features can only be represented by some primitive features in present CBIR systems.This paper proposes to use a fuzzy similarity measure based on a generalization of the Hamming distance(FHD)introduced in[?],as a basis for content based image retrieval,and to show how this measure can be used to capture implicitly some semantic contents of the image in addition to other image features(here color histograms).B.The Fuzzy Hamming Distance1)Degree of difference:Given the real values and, the degree of the difference between and,modulated by ,denoted by,is defined as[?]:(3) The parameter modulates the degree of difference in the sense that for the same value of different values of will result in different values of.The(membership)function defined in(3)has the following properties:1)with equality;2)3)for,;4).Figure1illustrates when for various values of.2)Difference fuzzy set for two vectors:Using the notion of degree of difference defined above,the difference fuzzy set for two vectors x and y,is defined as follows[?]: Let and be two dimensional real vectors let, denote their corresponding th component.The degree of difference between and along the component,modulated by the parameter,is.2 2.53 3.54 4.55 5.560.10.20.30.40.50.60.70.80.91alpha=0.1alpha=0.6alpha=1alpha=20Fig.1.The membership function withand varying from 0.1to 20(some graphs for intermediate values of are removed forclarity).[?]The difference fuzzy set corresponding toiswith membership function given by:(4)In words,is the degree to which the vectors and are different along their th component.The properties of are determined from the properties of .3)The fuzzy Hamming distance as cardinality of a fuzzy set:Since the Hamming distance is the number of components along which two bit vectors are different (which is also in fact,the square of the Euclidean distance between two bit vectors)a fuzzy extension of this concept must necessarily be based on the concept of cardinality of a (discrete)fuzzy set.This concept has been studied by several authors including [?],[?],[?],[?],etc.Here the definition put forward in [?]and further developed in [?]is used.Accordingly,the cardinality of the fuzzy setis the fuzzy setwhere(5)In (5)denotes the th largest value of ;the valuesand are introduced for convenience,and denotes the operation.By analogy with the definition of the classical Hamming distance,and using the cardinality of a fuzzy set [?],[?],[?],the Fuzzy Hamming Distance ()is defined as follows [?]:Definition 1:Given two real dimensional vectors,and ,for which the difference fuzzy set ,with member-ship function defined in (4),the fuzzy Hammingdistance between and ,denoted byis the fuzzy cardinality of the difference fuzzy set,.denotes the member-ship function forcorresponding to the parameter .More precisely,(6)forwhere .In words,(6)means that for a given value ,is the degree to which the vectors andare different on exactly components (with the modulation constant ).Example 1:Considering two vectors and with,their is the same as that betweenthe vector,and(by property (4)of ).Therefore,their is the cardinality of the fuzzy setobtained according to (5).Forthis is obtained to be In words,the meaning of is as follows:the degree to which and differ along exactly components (that is,do not differ)is ,along exactly one component is ,along exactly two components is ,along exactly threecomponents is,and so on.4)Defuzzification of the Fuzzy Hamming Distance:As it is often the case with many fuzzy concepts,a non-fuzzy (crisp)approximation for them is useful.The non-fuzzy cardinality,of a fuzzy set is defined in [?]where it is alsoshown that this approximation of the fuzzy cardinality is equalto the cardinality (in classical sense)ofthe -level set of with .More precisely,denotes the closure of .Since the fuzzy Hamming distance is the (fuzzy)cardinality of the difference fuzzy set ,its defuzzification leads to a non fuzzy approximation for it.It can be easily verified[?],that withthe defuzzification of by taking its 0.5level set is the standard Hamming distance.In other words the defuzzification of ,is the number ofelements ofwith membership greater or equal to 0.5.In the remainder of the paper will denote the crispquantity obtained according to (7)whenis the fuzzy set defined in (6).That is,for the real vectors and ,(8)II.A DAPTINGTHEF UZZY H AMMING D ISTANCEIn this section a closer look is devoted to the modulator parameter .In particular,it is shown that can be tuned,to include a scaling factor which controls the sensitivity to the extent of variation.Tuning of the parameter can be doneso as to include context(other components of the two vectors) or to capture only local(current component)information. One way to set the value for is to impose a lower bound on the membership function subject to constraints on the difference between vector components,such as described in (9)and(10).(9) subject to(10) for a generic component pair,a desired lower bound on the membership value to(as defined in(6)), and some positive constant.In particular,can be set as where and denotes the maximum value in the column domain,which leads tofrom which it follows that(11) This leads to the the following formula for defining a global value for the parameter:M e m b e r s h i p d e g r e eFig.4.Membership function for the distance 2.Fig.5.Distance distribution overA.The Preprocessing ModuleThe images of interest (data based and query image)are preprocessed according to the following steps:1)Segmentation:Each image is segmented in amatrix of regions.For the experiments reported here twovalues,and are used;2)Compute color histograms:The color histogram for each region is computed.Because the RGB color space can have 16M colors,quantization to 4096colors,giving a color histogram of 4096bins,is used.The number of pixels from each region that have the color correspond-ing to each of these bins is computed.The output of the preprocessing module is the collection ofcolor histograms.B.The Similarity Assessment ModuleThe collection of histograms corresponding to the image data base,and the color histogram of the query image,are the input to this module.Each image is represented as a matrix of histograms,more precisely,image is represented as.The query image is represented as .The similarity function,,mapstwo images into a matrix whose entries are the FHD between corresponding regions of the argument images.More precisely,for two images,and ,(13)where thedenotes the Fuzzy Hamming Distance parameterized by (introduced in equation (12)),the per-centage of difference in two colors (relative to the possible range)needed in order to consider these colors different.Forthe current experiments,the value,that is of the maximum range,is used.It is important to note here,that segmentation of the image into regions and evaluation of the similarity between two images as a function of the similarities of their corresponding regions,assures that position information is also considered,along with color information.This way two images which have the same color histogram but different semantic content (e.g.an image and the one obtained by rotation)will not necessarily be identical.C.The Ranking ModuleThis module computes a score from the output of the similarity module and ranks images in order of the values of this score.To achieve this,in the current implementation ranking is done in two steps:1)Defuzzification:The fuzzy sets returned by the simi-larity module are defuzzified.For comparison purpose three defuzzification methods were used:the center of gravity(COG),extracting the crisp version of the Fuzzy Hamming Distance,nFHD (defined in section I-B),and the area under the curve (AUC).2)Aggregation and Ranking:The results of the defuzzi-fication step are aggregated into a final score using a weighted aggregation.Scores are ranked in nondecreas-ing order (images closest to the query have smallest number of different different colors).The first images,where is a user-defined value,are returned as relevant to the query image.IV.R ESULTSThe approach described in the preceding sections is applied to 850images in JPEG format from the Washington database [?](which contains 1000images,the remaining 150are inGIF).Images are represented asregions for both .For comparison purpose,a non-fuzzy similarity measure,based on the Euclidean distance,is also used.For the similarity method using FHD,each of the three defuzzification methods are applied for each query.In the rank-ing module two weighting schemes are used for aggregation: (1)equal weights,and(2)regions in the top portion of an image were assigned higher weights.The latter is important to enforce additional positional requirements(such as“make sure the retrieved image has a sky like the one in the query image”)for the retrieval procedure.Figure6shows the topfive results returned for a query.The first three columns represent,in order,the results obtained using FHD,COG,nFHD,AUC,for similarity assessment, with equal aggregation weights.The last column represents the topfive results returned by the Euclidean distance.The query image appears in thefirst row.To better analyze the results returned by the four methods,it is helpful to notice that the (semantic)category for the query image could be described as “seascape”(the sea in the bottom part of the image,an island across the middle of the image,and the sky in the top part of the image).Above each image is its score.Because of the different defuzzification methods these scores appear in different units. Only the score for the second column(nFHD)has a direct meaning,namely,the number of colors by which the image and the query image differ.As it can be seen fromfigure6each of the four methods re-trieves the query image as the best candidate and indeed,their results also coincide for the second and third image returned as well.From the fourth image on,results differ somewhat. Among the FHD based methods,COG gives the best result (this is quite reasonable since the fuzzy set for which it is applied is convex),followed by nFHD and by AUC.Relative difference between scores decreases when moving down each column.The last image in second column,which also appears as the fourth image in the third column is interesting.This image has a building with glass walls behind what appears to beflowering trees.The walls appear blue due to the reflection of the sky(unseen in the image),therefore,from color point of view and,in fact,from the spatial distribution of the color,this image is similar to the query image.However,this image is in a totally different semantic category than the query image. It appears that the Euclidean distance does essentially as well as the COG as it preserves to almost the same extent the semantic category of the query image.A difference emerges in row four:the image returned as the third candidate(which is the same as the fourth candidate returned by COG)contains some artifacts in the lower part of the image which puts it in a slightly different semantic category(e.g.“seascape with a small bridge or pier”).Therefore,one can conclude that COG preserves the best the image content both as color and semantic category.Indeed this can be even better seen when the next five candidates for the same query are considered as shown in figure7.All the images retrieved by the COG method preserve the semantic category.This method is followed in order by the Euclidean Distance,nFHD andAUC.0.0000000.0000009.0000000.00000029.9023585.00000019.5322960.36321936.53977011.00000023.9182100.54558945.02331615.00000024.6744760.62229145.94798616.00000025.1566320.674405Fig.6.Topfive query result-set using equal weights for each image region. Images have been divided into regions.First three columns correspond to COG,nFHD,AUC respectively;the last column uses Euclidean distance.0.0000000.0000009.0000000.00000029.902358 5.00000019.5322960.36321936.53977011.00000023.9182100.54558945.02331615.00000024.6744760.62229145.94798616.00000025.1566320.67440546.45811617.00000026.9373580.78304147.03379017.00000027.3264560.78609148.08201518.00000027.6411240.80994349.01931918.00000027.8863150.82537450.93927220.00000027.9538530.866814 Fig.7.Nextfive query result-set using equal weight for each image region. Images have been divided into regions.First three columns correspond to COG,nFHD,AUC respectively;the last column uses Euclidean distance.V.C ONCLUSIONS AND FUTURE WORKThe relevance of the result-set of an CBIR system is hard to assess.It is based on what is relevant for a user,given the query image in a particular context.That is,relevance is both subjective and for the same user,it may be context dependent. This study presented initial results on a new approach to measure similarity between images using the notion of Fuzzy Hamming Distance and its use to content based image retrieval.Even with the remark at the beginning of this section, results seem promising:The main advantage of the FHD is that the extent to which two different images are considered indeed different can be tuned to become more context dependent and to capture(implicit)semantic image information.Several mechanisms can be used to rank and aggregate the similarity measures in addition to the simple point-valued mechanisms illustrated here.These would include mechanisms that rank and aggregate directly fuzzy numbers without a(too early)defuzzification.Developing such mechanisms,experi-ments with other image features(HSV histograms,textures), and further experiments with the proposed methods belong to the future work in this direction.A CKNOWLEDGMENTMircea Ionescu’s work for this study was supported by a Graduate Fellowship from the Ohio Board of Regents. Anca Ralescu’s work for this study was partially supported by a JSPS Senior Research Fellowship at the Brain Science Institute,RIKEN,Japan,and grant N000140310706from the Department of the Navy.R EFERENCES[1] A.G.Barto,R.S.Sutton,and C.W.Anderson,“Neuronlike adap-tive elements that can solve difficult learning control problems,”IEEE Trans.Systems,Man,and Cybernetics,vol.SMC-13,pp.834–846, Sept./Oct.1983.[2] A.N.Michel and ler,Qualitative Analysis of Large ScaleDynamical Systems,New York:Academic Press,1977.[3]P.J.Werbos,“Neural networks&the human mind:New mathematicsfits humanistic insight,”Proceedings of the1992IEEE Trans.Systems, Man,and Cybernetics,where,1992,vol.1,pp.78–83.。
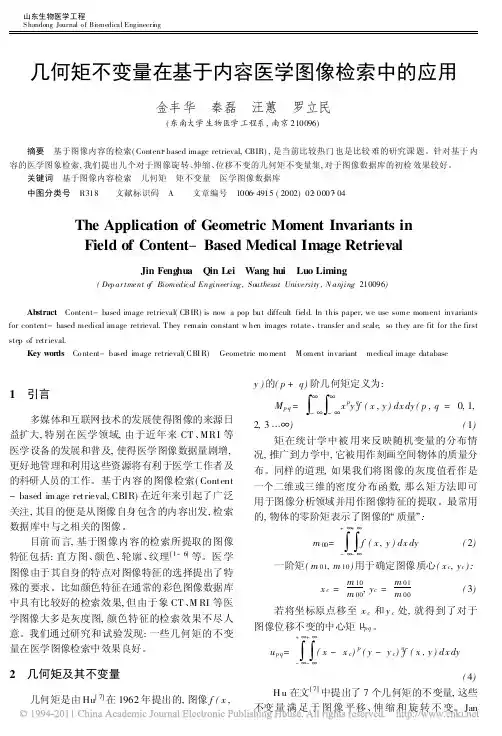
几何矩不变量在基于内容医学图像检索中的应用金丰华 秦磊 汪蕙 罗立民(东南大学生物医学工程系,南京210096)摘要 基于图像内容的检索(Content based image retrieval,CBIR),是当前比较热门也是比较难的研究课题。
针对基于内容的医学图象检索,我们提出几个对于图像旋转、伸缩、位移不变的几何矩不变量集,对于图像数据库的初检效果较好。
关键词 基于图像内容检索 几何矩 矩不变量 医学图像数据库中图分类号 R318 文献标识码 A 文章编号 1006 4915(2002)02 0007 04The Application of Geometric Moment Invariants inField of Content-Based Medical Image RetrievalJin Fenghua Qin Lei Wang hui Luo Liming(Dep ar tment of Biomedical Engineer ing,Southeast University,N anj ing210096)Abstract Content-based image retrieval(CBIR)is now a pop but diffcult field.In this paper,we use some moment invariants for content-based medical image retrieval.T hey r emain constant w hen images rotate、transfer and scale,so they are fit for the first step of retr ieval.Key words Co ntent-based image retrieval(CBI R) Geometric mo ment M oment invariant medical image database1 引言多媒体和互联网技术的发展使得图像的来源日益扩大,特别在医学领域,由于近年来CT、MRI等医学设备的发展和普及,使得医学图像数据量剧增,更好地管理和利用这些资源将有利于医学工作者及的科研人员的工作。

目录摘要 (I)ABSTRACT (II)绪论 (1)1 自动图像标注概述 (3)1.1 研究目的和意义 (3)1.2 现有图像标注算法分类 (3)2 用于图像标注的特征提取 (7)2.1 颜色特征提取 (7)2.2 纹理特征提取 (8)3 支持向量机模型 (12)3.1 SVM模型原理及核函数 (12)3.2 参数设置和训练算法 (16)3.2.1 参数的设置 (16)3.3.2 SVM的训练算法 (17)3.3 LIBSVM软件包 (19)4 SVM技术用于自动图像标注 (23)4.1 特征提取模块 (23)4.2 SVM分类模块 (23)4.3 实验结果及分析 (24)结束语 (26)致谢 (27)参考文献 (28)附录MATLAB程序源代码 (29)摘要近年来,自动图像标注(Automatic Image Annotation,AIA)技术已经成为图像语义理解研究领域的热点。
随着机器学习理论的不断发展,包括相关模型、分类器模型等不同的学习模型已经被广泛地应用于自动图像标注研究领域。
自动图像标注就是让计算机自动地给无标注的图像加上能够反映图像内容的语义关键词。
自动图像标注在图像检索研究领域中非常具有挑战性,是实现图像语义检索的关键。
现有的自动图像标注算法可以大致分为基于分类的标注算法、基于概率关联模型的标注算法以及基于图学习的标注算法等三大类。
本文重点研究了另外一种自动图像标注算法——基于SVM技术的标注算法,研究了SVM原理,构造SVM 分类器,应用matlab对图像进行纹理、颜色特征的提取,通过分类器,实现图像自动标注。
关键词:自动图像标注标注算法分类器SVMABSTRACTIn recent years, automatic image annotation (AIA) technology has become the hot spots of the field of the image semantic understanding. With the continuous development of the theory of machine learning, including the related model, the classification model of different learning models have been widely used in automatic image annotation research areas. Automatic image annotation is to let the computer automatically mark keywords that can reflect the semantics of image content for the non-marked images. Automatic image annotation is very challenging in the research field of image retrieval, and is the key to achieve the image semantic retrieval. Automatic image annotation algorithm tagging algorithm can be broadly divided into three categories, based on the classification, based on the probability associated with tagging algorithm of the model and based on graph learning labeling algorithm. This paper focuses on another kind of automatic image tagging algorithm - SVM-based tagging algorithm, to study the principle of SVM constructed SVM classifier, application MATLAB for image texture and the color feature extraction, by classifier, to achieve image automatic annotation.Key words: automatic image annotation tagging algorithm the classifier SVM绪论随着数码相机和可拍照手机等设备的日益普及,各种各样的图像数量呈现几何级的飞速增长。
Using Very Deep Autoencoders forContent-Based Image RetrievalAlex Krizhevsky and Geo rey E.HintonUniversity of Toronto-Department of Computer Science6King's College Road,Toronto,M5S3H5-CanadaAbstract.We show how to learn many layers of features on color imagesand we use these features to initialize deep autoencoders.We then usethe autoencoders to map images to short binary ing semantichashing[6],28-bit codes can be used to retrieve images that are similar toa query image in a time that is independent of the size of the database.This extremely fast retrieval makes it possible to search using multipledi erent transformations of the query image.256-bit binary codes allowmuch more accurate matching and can be used to prune the set of imagesfound using the28-bit codes.1IntroductionIn this paper we use very deep autoencoders to map small color images to short binary codes.For content-based image retrieval,binary codes have many advan-tages compared with directly matching pixel intensities or matching real-valued codes.They are very cheap to store,and they are very fast to compare using bit-wise operations.If they are su ciently short,e.g.28bits,they can be used as addresses in a semantic memory space in which similar addresses contain pointers to similar images.The codes found by learning a deep autoencoder tend to have this property.Images similar to a query image can then be found by ipping a few bits in the code and performing a memory access.The retrieval time for this semantic hashing method is completely independent of the size of the database:billions of images can be searched in a few milleseconds.This allows some invariances to be implemented by searching with many di erent transformations of the query image.In[6],autoencoders initialised by learning Deep Belief Networks(DBNs) were used to obtain short binary codes for documents and it was shown that these codes could be used for semantic hashing.For documents,however,this may be unnecessary because individual words are very informative so inverted indexing works well.Pixels or low-level image features are much less semantically meaningful,so semantic hashing is much more appropriate for image retrieval. In[8],the authors used a DBN-initialized autoencoder to generate short binary codes,but they were not able to train the DBN on the raw image data so they used the384-dimensional GIST descriptors of the color images.Unfortunately, the GIST descriptors act as a narrow bottleneck which occurs too early in thefeature extraction process to allow a DBN to learn really good short codes.As a result,there has been no proper evaluation of binary codes produced by deep learning for image retrieval.In[9],the authors introduced a new and very fast spectral method for gen-erating binary codes from high-dimensional data and showed that these spectral codes are,in some cases,more useful for image retrieval than binary codes gen-erated by autoencoders trained on the GIST descriptors.We demonstrate that spectral codes do not work as well as the codes produced by DBN-initialized autoencoders trained on the raw pixels.2How the codes are learnedDBNs are multilayer,stochastic generative models that are created by learning a stack of Restricted Boltzmann Machines(RBMs),each of which is trained by using the hidden activities of the previous RBM as its training data.Each time a new RBM is added to the stack,the new DBN has a better variational lower bound on the log probability of the data than the previous DBN,provided the new RBM is learned in the appropriate way[3].We train on1.6million32×32color images that have been preprocessed by subtracting from each pixel its mean value over all images and then dividing by the standard deviation of all pixels over all images.The rst RBM in the stack has8192binary hidden units and3072linear visible units with unit variance gaussian noise.All the remaining RBM's have N binary hidden units and2N binary visible units.Details of how to train an RBM can be found in[1].We use the standard contrastive divergence learning procedure which has four steps: 1.For each data-vector,v,in a mini-batch,stochastically pick a binary statevector,h for the hidden units:p(h j=1|v)=σ(b j+i∈visv i w ij)(1) where b j is the bias,w ij,is a weight,andσ(x)=(1+exp(−x))−1.2.Stochastically reconstruct each visible vector as v using the rst equa-tion for binary visible units and the second for linear visible units,where N(µ,V)is a Gaussian.p(v i=1|h)=σ(b i+j∈hid h j w ij),or v i=N(b i+j∈hidh j w ij,1)(2)3.Recompute the hidden states as h using Eq.1with v instead of v.4.Update the weights using∆w ij∝ v i h j − v i h j where the angle brackets denote averages over the mini-batch.To reduce noise,we actually use the probabilities rather than the stochastic binary states in steps 2,3,and 4,but it important to use stochastic binary hidden units in step 1to avoid serious over tting.The RBMs were initialized with very small random weights and zero biases and trained for 80epochs using mini-batches of size 128.For the linear-binary RBM we used a learning rate of 0.001on the average per-case gradient and for the binary-binary RBM's we used 0.01.We reduced the learning rate at the beginning of learning when the gradient can be big and also at the end of learning in order to minimize uctuations in the nal weights.We also used a momentum of 0.9to speed learning (see [1]for details).In the rst RBM,most of hidden units learned to be high-frequency monotone Gabor-like lters that were balanced in the RGB channels and most of the remaining units became lower frequency lters that responded to color edges.2.1Fine-tuning the autoencoderWe initialized a 28-bit and a 256-bit autoencoder with the weights from two separately trained stacks of RBMs as described in [2]and ne-tuned them us-ing backpropagation to minimise the root mean squared reconstruction errori (v i −ˆvi )2.In each autoencoder,the hidden layers halve in size until they reach the desired size,except that we use 28instead of 32.To force the codes to be binary,we rounded the outputs of the logistic units in the central code layer to 1or 0during the forward pass but ignored this rounding during the backward pass.This is simpler and as good as the binarization method employed in [6],which adds noise to the code layer.For the autoencoders,we used a learning rate of 10−6for all layers and trained for 5epochs.The weights only changed very slightly from the RBM weights,but the image reconstructions improved signi cantly.The entire training procedure for each autoencoder took about 2days on an Nvidia GTX 285GPU.3ResultsFigure 1:Reconstructions of test images from the 256-bit codes.We tested our models on two subsets of the 80million tiny im-ages dataset [7]thatwas produced by us-ing various online im-age search engines tosearch for all the non-abstract English nouns and noun phrases in the WordNet lexical database.Each image in the dataset has a very noisy label,which is the word used to nd it,but we did not use any labels for training.For a qualitative evaluation of the retrieval,we used an unlabeled subset of 1.6million of the images for both training and retrieval.This subset contains only the rst 30images found for each non-abstract English noun.For a quantitative evaluation,we measured what fraction of the retrieved images were of the same256-bit deep 256-bit spectral Euclidean distanceFigure 2:Retrieval results from the 1.6million tiny images dataset using a full linear search with 256-bit deep codes,256-bit spectral codes,and Euclidean distance.The top-left image in each block is the query image.The remaining images are the closest retrieved matches in scan-line order.The dataset contains some near-duplicate images.class as the query image,averaged over 5,000queries.We used exactly the same autoencoders,but used query images from the CIFAR-10dataset [4],which is a carefully labeled subset of the 80million tiny images,containing 60,000images split equally between the ten classes:airplane ,automobile ,bird ,cat ,deer ,dog ,frog ,horse ,ship ,and truck .Each image in CIFAR-10has been selected to contain one dominant object of the appropriate class and only 3%of the CIFAR-10images are in the set of 1.6million training images.3.1Retrieval resultsQualitatively,a full linear search of 1.6million images using 256-bit deep codes produces better results than using Euclidean distance in pixel space and is about 1000times faster.256-bit spectral codes are much worse (see gure 2).Pruning the search by restricting it to images whose 28-bit deep code di ers by 5bits or less from the query image code only very slightly degrades the performance of the 256-bit deep codes.Quantitatively,the ordering of the methods is the same,with 28-bit deep codes performing about as well as 256-bit spectral codes (see gure 3).The best performance is achieved by a more elaborate method described below that creates a candidate list by using many searches with many di erent 28-bit codes each of which corresponds to a transformed version of the query image.4Multiple semantic hashingSemantic hashing retrieves objects in a time that is independent of the size of the database and an obvious question is whether this extreme speed can be traded for more accuracy by somehow using many di erent 28-bit coding schemes and combining their results.We now describe one way of doing this.Figure 3:CIFAR-10retrieval perfor-mance of the various methods tested.Codes obtained by looking at the entire image are good for captur-ing global structure,and hence for nding images that appear globally similar,but they are not invariant to transformations like translation of one object within the image which of-ten have little e ect on the semantic content.We can achieve invariance to translations of medium-sized ob-jects by treating each image as a bag of patches and training an autoen-coder on local patches of images.Weobtained the patches by sampling the 1.6million tiny images with the variable-resolution retina shown in Figure 4.This autoencoder had the following archi-tecture:336-1024-512-256-128-64-28and was trained in the same way as before.4.1SearchAfter some initial exploration of various scoring methods we found that the following procedure worked best.First,construct a 228-element array (the semantic hashing table)that stores at index i the list of images that have image patches with code i (possibly with repetitions,as one image may have multiple patches with the same code).Second,for each of the 81patches of the query image,use the semantic hashing table to quickly nd the set of images that have patches with codes no more than 3bits away from the query patch code.Assign to each found image the score 23−d ,where d is the hamming distance of the query patch code from the found image patch code.We explore the hamming ball around the query patch code in order of increasing distance,so each found image is given the maximal score it could get for a single patch.It does not get additional score if the same query patch matches some other part of the same image equally or less well.This avoids problems such as one query patch of sky matching a large number of other patches of sky in another image.Third,sum the scores for each image over all of the 81patches of the query image and return the images in order of descending score.Finally,combine the ranked list of images found in the second step with the ranked list of images found using 256-bit deep codes by adding the two ranks of each image and re-ordering them.5Future workDeep autoencoders that are pre-trained as DBNs also work well for document retrieval [6],so it should be relatively easy to learn deep binary codes that are good for both reconstructing the image and reconstructing a label or bag of words representation of an image caption.This would encourage the deep codesto extract more semantic information from the images and it scales much better with the size of the database than methods with quadratic time complexity such as non-linear NCA [5]that was tried in [8].6SummaryFigure 4:The variable-resolution retina used to sample the 32×32im-ages.The retina looks at at a 16×16patch of the image,but contains only 112pixels,because the pixels on the out-side are sampled at lower -ing a stride of 2pixels,there are 81dis-tinct patches that can be extracted from a 32×32image in this way.Pre-training with RBM's makes it possible to learn very deep autoen-coders that map similar images to similar binary codes.This allows the speed of hash-coding to be applied to approximate matching.This is partic-ularly relevant for content-based im-age retrieval and we have shown that it works considerably better than a previous attempt [8].The images returned by searching with 256-bit codes are qualitatively and quanti-tatively better than the near neigh-bors in pixel space and this advan-tage is preserved when using seman-tic hashing with 28-bit codes to elim-inate nearly all of the database from the search.References[1]G.E.Hinton.A practical guide to training restricted boltzmann machines.Technical Report UTML2010-003,University of Toronto,2010.[2]G.E.Hinton and R.Salakhutdinov.Reducing the dimensionality of datawith neural networks.Science ,313(5786):504 507,July 2006.[3]G.E.Hinton,S.Osindero,and Y.Teh.A fast learning algorithm for deepbelief nets.Neural Computation ,18:1527 1554,2006.[4]A.Krizhevsky.Learning multiple layers of features from tiny images.Mas-ter's thesis,Department of Computer Science,University of Toronto,2009.[5]R.Salakhutdinov and G.E.Hinton.Learning a nonlinear embedding bypreserving class neighbourhood structure.In Proceedings of AI and Statistics ,2007.[6]R.Salakhutdinov and G.E.Hinton.Semantic hashing.In Proceedings ofthe SIGIR Workshop on Information Retrieval and Applications of Graphical Models ,Amsterdam,2007.[7]A.Torralba,R.Fergus,and W.T.Freeman.80million tiny images:a largedatabase for non-parametric object and scene recognition.IEEE PAMI,30(11):1958 1970,November2008.[8]A.Torralba,R.Fergus,and Y.Weiss.Small codes and large image databasesfor recognition.In Proceedings of the IEEE Conf on Computer Vision and Pattern Recognition,2008.[9]Y.Weiss,A.Torralba,and R.Fergus.Spectral hashing.In Proceedings ofNeural Information Processing Systems,2008.。
PicSOM ±content-based image retrieval with self-organizingmapsJorma Laaksonen *,Markus Koskela,Sami Laakso,Erkki OjaLaboratory of Computer and Information Science,Helsinki University of Technology,P.O.Box 5400,Fin-02015HUT,Espoo,FinlandAbstractWe have developed a novel system for content-based image retrieval in large,unannotated databases.The system is called PicSOM,and it is based on tree structured self-organizing maps (TS-SOMs).Given a set of reference images,PicSOM is able to retrieve another set of images which are similar to the given ones.Each TS-SOM is formed with a di erent image feature representation like color,texture,or shape.A new technique introduced in PicSOM facilitates automatic combination of responses from multiple TS-SOMs and their hierarchical levels.This mechanism adapts to the user's preferences in selecting which images resemble each other.Thus,the mechanism implements a relevance feedback technique on content-based image retrieval.The image queries are performed through the World Wide Web and the queries are iteratively re®ned as the system exposes more images to the user.Ó2000Elsevier Science B.V.All rights reserved.Keywords:Content-based image retrieval;Image databases;Neural networks;Self-organizing map1.IntroductionContent-based image retrieval (CBIR)from unannotated image databases has been an object for ongoing research for a long period (Rui et al.,1999).Digital image and video libraries are be-coming more widely used as more visual infor-mation is produced at a rapidly growing rate.The technologies needed for retrieving and browsing this growing amount of information are still,however,quite immature and limited.Many projects have been started in recent years to research and develop e cient systems for con-tent-based image retrieval.The best-known CBIR system is probably Query by Image Content (QBIC)(Flickner et al.,1995)developed at the IBM Almaden Research Center.Other notable systems include MIT's Photobook (Pentland et al.,1994)and its more recent version,FourEyes (Minka,1996),the search engine family of Visu-alSEEk,WebSEEk,and MetaSEEk (Smith and Chang,1996;Beigi et al.,1998),which all are de-veloped at Columbia University,and Virage (Bach et al.,1996),a commercial content-based search engine developed at Virage Technologies.We have implemented an image-retrieval sys-tem that uses a World Wide Web browser as the user interface and the tree structured self-orga-nizing map (TS-SOM)(Koikkalainen and Oja,www.elsevier.nl/locate/patrecPattern Recognition Letters 21(2000)1199±1207*Corresponding author.Tel.:+358-9-4513269;fax:+358-9-4513277.E-mail addresses:aksonen@hut.®(aksonen),markus.koskela@hut.®(M.Koskela),akso@hut.®(akso),erkki.oja@hut.®(E.Oja).0167-8655/00/$-see front matter Ó2000Elsevier Science B.V.All rights reserved.PII:S 0167-8655(00)00082-9© 2000 Elsevier Science. Reprinted with permission from Pattern Recognition Letters 21, No. 13-14, pages 1199-1207.1990;Koikkalainen,1994)as the image similarity scoring method.The retrieval method is based on the relevance feedback approach(Salton and McGill,1983)adopted from traditional,text-based information retrieval.In relevance feedback, the previous human±computer interaction is used to re®ne subsequent queries to better approximate the need of the user.As far as the current authors are aware,there has not been until now notable image retrieval applications based on the self-organizing map (SOM)(Kohonen,1997).2.Basic operation of PicSOMPicSOM is intended as a general framework for multi-purpose content-based image retrieval.The system is designed to be open and able to adapt to di erent kinds of image databases,ranging from small and domain-speci®c picture sets to large, general-purpose image collections.The features may be chosen separately for each speci®c task. From a user's point of view,the basic operation of the PicSOM image retrieval is as follows.(1) The user connects to the World Wide Web server providing the search engine with her web browser.(2)The system presents a list of databases and feature extraction methods available to that par-ticular user.(3)After the user has made the se-lections,the system presents an initial set of tentative images scaled to a small``thumbnail'' size.The user then indicates the subset of these images which best matches her expectations and to some degree of relevance®ts to her purposes. Then,she hits the``Continue Query''button which sends the information on the selected images back to the search engine.(4)The system marks the images selected by the user with a positive value and the non-selected images with a negative value in its internal data structure.Based on this data, the system then presents the user a new set of images together with the images selected this far.(5)The user again selects the relevant images and the iteration continues.Hopefully,the fraction of relevant images increases in each image set pre-sented to the user and,®nally,one of them is ex-actly what she was originally looking for.2.1.Feature extractionPicSOM may use one or several types of sta-tistical features for image querying.Separate fea-ture vectors can be formed for describing the color,texture,shape,and structure of the images.A separate TS-SOM(see Section 2.2)is then constructed for each feature.These maps are used in parallel to®nd from the database those images which are most similar to the images selected by the user.The feature selection is not restricted in any way,and new features can be included as long as the feature vectors are of®xed dimensionality and the Euclidean metric can be used to measure distances between them.In the®rst stage,®ve di erent feature extraction methods were applied to the images,and the cor-responding TS-SOMs were created.The feature types used in this study included two di erent color and shape features and a simple texture feature.All except one feature type were calculated in®ve separate zones of the image.The zones are formed by®rst extracting from the center of the image a circular zone whose size is approximately one-®fth of the area of the image.Then the re-maining area is divided into four zones with two diagonal lines.Average color(cavg in Tables1and2)is ob-tained by calculating average R-,G-and B-values in the®ve zones of the image.The resulting 3Â5 15-dimensional feature vector thus de-scribes the average color of the image and gives rough information on the spatial color composi-tion.Color moments(cmom)were introduced by Stricker and Orengo(1995).The color moment features are computed by treating the color values in di erent color channels in each zone as separate probability distributions and then calculating the ®rst three moments(mean,variance,and skew-ness)of each color channel.This results in a 3Â3Â5 45-dimensional feature vector.Due to the varying dynamic ranges,the feature values are normalized to zero mean and unit variance. Texture neighborhood(texture)feature in Pic-SOM is also calculated in the same®ve zones.The Y-values of the YIQ color representation of every pixel's8-neighborhood are examined,and theaksonen et al./Pattern Recognition Letters21(2000)1199±1207estimated probabilities for each neighbor being brighter than the center pixel are used as fea-tures.When combined,this results in an8Â5 40-dimensional feature vector.Shape histogram(shist)feature is based on the histogram of the eight quantized directions of edges in the image.When the histogram is sepa-rately formed in the same®ve zones as before,an 8Â5 40-dimensional feature vector is obtained. It describes the distribution of edge directions in various parts of the image and thus reveals the shape in a low-level statistical manner(Brandt et al.,2000).Shape FFT(sFFT)feature is based on the Fourier transform of the binarized edge image. The image is normalized to512Â512pixels before the FFT.No zone division is made.The magni-tude image of the spectrum is low-pass®ltered and decimated by a factor of32,resulting in a128-dimensional feature vector(Brandt et al.,2000).2.2.Tree structured SOM(TS-SOM)The®ve separate feature vectors obtained from each image in the database have to be indexed to facilitate similarity-based queries.For the index-ing,similarity-preserving clustering using SOMs (Kohonen,1997)is used.Due to the high dimen-sionality of the feature vectors and the large size of the image database,computational complexity is a major issue.The TS-SOM(Koikkalainen and Oja,1990; Koikkalainen,1994)is a tree-structured vector quantization algorithm that uses SOMs at each of its hierarchical levels.In PicSOM,all TS-SOM maps are two-dimensional.The number of map units increases when moving downwards in the TS-SOM.The search space on the underlying SOM level is restricted to a prede®ned portion just below the best-matching unit on the above SOM. Therefore,the complexity of the searches in TS-SOM is lower than if the whole bottommost SOM level had been accessed without the tree structure. The computational lightness of TS-SOM facil-itates the creation and use of huge SOMs which,in our PicSOM system,are used to hold the images stored in the image database.The TS-SOMs for all features are sized4Â4,16Â16,64Â64,and 256Â256,from top to bottom.The feature vec-tors calculated from the images are used to train the levels of the TS-SOMs beginning from the top level.During the training,each feature vector is presented to the map multiple,say100,times.In the process,the model vectors stored in the map units are modi®ed to match the distribution and topological ordering of the feature vector space. After the training phase,each unit of the TS-SOMs contains a model vector which may be re-garded as the average of all feature vectors map-ped to that particular unit.In PicSOM,we then search in the corresponding dataset for the feature vector which best matches the stored model vector and associate the corresponding image to that map unit.Consequently,a tree-structured,hierarchical representation of all the images in the database is formed.In an ideal situation,there should be one-to-one correspondence between the images and TS-SOM units at the bottom level of each map.ing multiple TS-SOMsIn an image-based query,the®ve feature vec-tors computed from the images presented to the user are passed to the respective TS-SOMs and the best-matching units are found at each level of the bining the results from several maps can be done in a number of ways.A simple method would be to ask the user to enter weights for dif-ferent maps and then calculate a weighted average. This,however,requires the user to give informa-tion which she normally does not have.Generally, it is a di cult task to give low-level features such weights which would coincide with a human's perception of images at a more conceptual level. Therefore,a better solution is to use the relevance feedback approach in which the results of multiple maps are combined automatically by using the implicit information from the user's responses during the query session.The PicSOM system thus tries to learn the user's preferences over the®ve features from the interaction with her and then sets its own responses accordingly.The rationale behind our approach is as fol-lows:if the images selected by the user are located close to each other on one of the®ve TS-SOM maps,it seems that the corresponding featureaksonen et al./Pattern Recognition Letters21(2000)1199±12071201performs well on the present query,and the rela-tive weight of its opinion should be increased.This can be implemented simply by marking the shown images on the maps with positive and negative values depending on whether the user has selected or rejected them,respectively.The positive and negative responses are then normalized so that their sum equals zero.The combined e ect of positively marked units residing near each other can then be enhanced by convolving the maps with a simple,low-pass®l-tering mask.As a result,those areas which have many positively marked images close together spread the positive response to their neighboring map units.The images associated with the units having largest positive values after the convolution are then good candidates for the next images to be shown to the user.The conversion from the positive and negative marked images to the convolutions in a three-level TS-SOM is visualized in Fig.1.The sizes of the SOM levels are4Â4,16Â16,and64Â64,from top to bottom.First,SOMs displaying the positive map units as white and negative as black are shown on the left.These maps are then low-pass ®ltered,and the resulting map surfaces are shown on the right.It is seen that a cluster of positive images resides at the lower edge of the map.2.4.Re®ning queriesA typical retrieval session with PicSOM consists of a number of subsequent queries during which the retrieval is focused more accurately on images resembling those shown images which the user has accepted.In the current implementation,all posi-tive values on all convolved TS-SOM levels are sorted in descending order in one list.Then,a preset number,e.g.,16,of the best candidate im-ages which have not been shown to the user before are output as the new image selection. Initially,the query begins with a set of reference images picked from the top levels of the TS-SOMs. In the early stages of the image query,the system tends to present the user images from the upper TS-SOM levels.As soon as the convolutions begin to produce large positive values also on lower map levels,the images from these levels are shown to the user.The images are,therefore,gradually picked more and more from the lower map levels as the query is continued.The inherent property of PicSOM to use more than one reference image as the input information for retrievals is important and makes PicSOM di er from other content-based image retrieval systems,such as QBIC(Flickner et al.,1995), which use only one reference image at a time.3.ImplementationWe have wanted to make our PicSOM search engine available to the public by implementing it on the World Wide Web.This also makes the queries on the databases machine independent, because standard web browsers can be used.A demonstration of the system and further infor-mation on it is available at http://www.cis.hut.®/ picsom.The PicSOM user interface in the midst of an ongoing query is displayed in Fig.2.First,the three parallel TS-SOM map structures represent three map levels of SOMs trained with RGB color, texture,and shape features,from left to right.TheFig.1.An example of converting positive and negative mapunits to convolved maps in three-level TS-SOM.Map surfacesdisplaying the positive(white)negative(black)map unitsare shown on the left.The convolved maps are shownaksonen et al./Pattern Recognition Letters21(2000)1199±1207sizes of the SOM levels are 4Â4,16Â16,and 64Â64,from top to bottom.On color terminals,positive map points are seen as red and negative as blue.More saturated shades represent stronger responses and white points are zero valued.Below the convolved SOMs,the ®rst set of 16images consists of images selected by the user on the previous rounds of the retrieval process.These images may then be unselected on any subsequent round.In this example,images representing buildings have been selected as positive.The next images,separated by a horizontal line,are the 16best-scoring new images in this round obtained from the convolved units in the TS-SOMs.The relevant images are marked by checking the ap-propriate checkboxes.Finally,the page has some user-modi®able settings and a ``Continue Query''button which submits the new selections back to the search engine.The user can at any time switch from the iter-ative queries to examining of the TS-SOM surfaces simply by clicking on the map images.A portion of the map around the chosen viewpoint is then shown before the other images.This allows directbrowsing in the image space.Relevant images on the map surface can then also be selected for continuing queries.4.DatabasesCurrently,we have made our experiments with two image databases of di erent sizes.The ®rst database contains 4350miscellaneous images downloaded from the image collection residing at ftp://ftp.sunet.se/pub/pictures/.Most of the images are color photographs in JPEG format.Figs.1and 2were produced using this database.The second image database we have used is the image collection from the Corel Gallery 1000000product (Corel,1999).It contains 59995photo-graphs and arti®cial images with a very wide va-riety of subjects.When this collection is mapped on a 256Â256SOM,each map unit approxi-mately corresponds to one image.All the images are either of size 256Â384or 384Â256pixels.The majority of the images are in color,but there are also a small number of grayscale images.The experiments described in the next sections were performed using this dataset.5.Performance measuresA number of measures for evaluating the ability of various visual features to reveal image similarity are presented in this section.Assume a database D containing a total of N images and an image class C &D with N C images.Such a class can contain,for example,images of aircraft,buildings,nature,human faces,and so on.The process of gathering a class is naturally arbitrary,as there are no dis-tinct and objective boundaries between classes.If the images in the database already have reliable textual information about the contents of the im-ages,it can be used directly;otherwise,manual classi®cation is needed.Then,the a priori proba-bility q C of the class C is q C N C a N .An ideal performance measure should be independent of the a priori probability and the type of images in the imageclass.Fig.2.The web-based user interface of PicSOM.aksonen et al./Pattern Recognition Letters 21(2000)1199±120712035.1.Observed probabilityFor each image I P C with a feature vector f I ,we calculate the Euclidean distance d L 2 I Y J of f I and the feature vectors f J of the other images J P D n f I g in the database.Then,we sort the images based on their ascending distance from the image I and store the indices of the images in an N À1 -sized vector g I .By g I i ,we denote the i th component of g I .Next,for all images I P C ,we de®ne a vector h I as follows:V i P f 0Y F F F Y N À2g X h Ii 1Y if g I i P C Y 0Y otherwise X &1The vector h I thus has value one at location i ,if the corresponding image belongs to the class C .As C has N C images,of which one is the image I itself,each vector h I contains exactly N C À1ones.In the optimal case,the closest N C À1images to image I are also in the same class C ;thus h I i 1for i 0Y F F F Y N C À2,and 0otherwise.We can now de®ne the observed probability p i :V i P f 0Y F F F Y N À2g X p i1N C K P C h KiX 2The observed probability p i is a measure of the probability that an image in C has,as the i th nearest image,according to the feature extrac-tion f ,another image belonging to the same class.5.2.Forming scalars from the observed probability The observed probability p i is a function of the index i ,so it cannot easily be used to compare two di erent feature extractions.Therefore,it is nec-essary to derive scalar measures from p i to enable us to perform such comparisons.We chose to use three ®gures of merit to de-scribe the performance of individual feature types.First,a local measure was calculated as the aver-age of the observed probability p i for the ®rst 50retrieved images,i.e.:g local49i 0p i50X 3The g local measure obtains values between zero and one.For a global ®gure of merit we used the weighted sum of the observed probability p i cal-culated as:g global ReN À2i 0p i e j p i a N À1 N C À1@AX 4 Also g global attains values between zero and one.It favors observed probabilities that are concentrated in small indices and punishes large probabilities in large index values.The third value of merit,g half ,measures the total fraction of images in C found when the ®rst half of the p i sequence is considered:g half N a 2i 0p iN C À1X5 g half obviously yields a value of one in the optimal case and a value of half with the a priori distri-bution of images.For all the three ®gures of merit,g local ,g global ,and g half ,the larger the value the better the dis-crimination ability of the feature extraction.5.3.s measureWe have applied another quantitative ®gure,denoted as the s measure,which describes the performance of the whole CBIR system instead of a single feature type.It is based on measuring the average number of images the system retrieves before the correct one is found.The s measure resembles the ``target testing''method presented in (Cox et al.,1996),but instead of using human test users,the s measure is fully automatic.For obtaining the s measure we use the same subset C of images as before for the single features.We have implemented an ``ideal screener'',a computer program which simulates a human user by examining the output of the retrieval system and marking the retrieved images as either relevant or non-relevant according to whether the images belong to C .The iterative query processing can thus be simulated and performance data collected without any human intervention.aksonen et al./Pattern Recognition Letters 21(2000)1199±1207For each of the images in the class C,we then record the total number of images presented by the system until that particular image is shown.From this data,we calculate the average number of shown images before the hit.After division by N, this®gure yields a values Pq C2Y1hÀq C2iX 6For values s`0X5,the performance of the system is thus better than random picking of images and, in general,the smaller the s value the better the performance.6.ResultsIn order to evaluate the performance of the single features and the whole PicSOM system with di erent types of images,three separate image classes were picked manually from the59995-im-age Corel database.The selected classes were planes,faces,and cars,of which the database contains292,1115,and864images,respectively. The corresponding a priori probabilities are0.5%, 1.9%,and1.4%.In the retrieval experiments,these classes were thus not competing against each other but mainly against the``background''of57724, i.e.,96.2%of other images.Table1shows the results of forming the three scalar measures,g local,g global,and g half,from the measured observed probabilities.It can be seen that the g local measure is always larger than the corresponding a priori probability.Also,the shape features shist and sFFT seem to outperform the other feature types for every image class and every performance measure.Otherwise,it is not yet clear which one of the three performance mea-sures would be the most suitable as a single descriptor.The results of the experiments with the whole PicSOM system are shown in Table2.First,each feature was used alone and then di erent combi-nations of them were tested.The two shape fea-tures again yield better results than the color and texture features,which can seen from the®rst®ve rows in Table2.By examining the results with all the tested classes,it can be seen that the general trend is that using a larger set of features yields better results than using a smaller set.Most notably,using all features gives better results than using any one feature alone.The implicit weighting of the relative impor-tances of di erent features models the semantic similarity of the images selected by the user.This kind of automatic adaptation is desirable as it is generally not known which feature combination would perform best for a certain image query.To alleviate the situation,the PicSOM approach provides a robust method for using a set of dif-ferent features and image maps formed thereof in parallel so that the result exceeds the performances of all the single features.However,it also seems that if one feature vector type has clearly worse retrieval performance than the others,it may be more bene®cial to exclude that particular TS-SOM from the retrieval process. Therefore,it is necessary for the proper operation of the PicSOM system that the used features are well balanced,i.e.,they should,on the average, perform quite similarly by themselves.Table1Comparison of the performances of di erent feature extraction methods for di erent image classes.Each entry gives three performance ®gures(g local a g global a g half)Features ClassesPlanes Faces Carscavg0.06/0.16/0.590.05/0.10/0.560.03/0.21/0.63cmom0.06/0.16/0.590.05/0.10/0.560.04/0.21/0.63texture0.04/0.04/0.520.06/0.16/0.570.07/0.22/0.63shist0.11/0.62/0.840.10/0.54/0.820.13/0.34/0.68sFFT0.04/0.49/0.780.07/0.39/0.720.10/0.30/0.65aksonen et al./Pattern Recognition Letters21(2000)1199±120712057.Conclusions and future plansWe have in this paper introduced the PicSOM approach to content-based image retrieval and methods for quantitative evaluation of its perfor-mance.As a single visual feature cannot classify images into semantic classes,we need to gather the information provided by multiple features to achieve good retrieval performance.The results of our experiments show that the PicSOM system is able to e ectively select from a set of parallel TS-SOMs a combination which coincides with the user's conceptual view of image similarity.One obvious direction to increase PicSOM's retrieval performance is to do an extensive study of di erent feature representations to®nd a set of well-balanced features which,on the average, perform as well as possible.As a vast collection of unclassi®ed images is available on the Internet,we have also made preparations for using PicSOM as an image search engine for the World Wide Web.AcknowledgementsThis work was supported by the Finnish Centre of Excellence Programme(2000±2005)of the Academy of Finland,project New information processing principles,44886.ReferencesBach,J.R.,Fuller,C.,Gupta,A.,et al.,1996.The Virage image search engine:an open framework for image management.In:Sethi,I.K.,Jain,R.J.(Eds.),Storage and Retrieval for Image and Video Databases IV.In:SPIE Proceedings Series,Vol.2670.San Jose,CA,USA.Beigi,M.,Benitez,A.,Chang,S.-F.,1998.MetaSEEk:a content-based metasearch engine for images.In:Storage and Retrieval for Image and Video Databases VI(SPIE).In:SPIE Proceedings Series,Vol.3312.San Jose,CA, USA.Brandt,S.,Laaksonen,J.,Oja,E.,2000.Statistical shape features in content-based image retrieval.In:Proceedings of 15th International Conference on Pattern Recognition, Barcelona,Spain,Vol.2,pp.1066±1069.Corel,1999.The Corel Corporation world wide web home page,.Cox,I.J.,Miller,M.L.,Omohundro,S.M.,Yianilos,P.N., 1996.Target testing and the PicHunter Bayesian multimedia retrieval system.In:Advanced Digital Libraries ADL'96 Forum.Washington,DC.Flickner,M.,Sawhney,H.,Niblack,W.,et al.,1995.Query by image and video content:the QBIC system.IEEE Computer September,23±31.Kohonen,T.,1997.Self-Organizing Maps,second extended ed.In:Springer Series in Information Sciences,Vol.30.Springer,Berlin.Koikkalainen,P.,1994.Progress with the tree-structured self-organizing map.In:Cohn,A.G.(Ed.),11th European Conference on Arti®cial Intelligence.European Committee for Arti®cial Intelligence(ECCAI).Wiley,New York. Koikkalainen,P.,Oja,E.,1990.Self-organizing hierarchical feature maps.In:Proceedings of1990International Joint Conference on Neural Networks,Vol.II.IEEE,INNS,San Diego,CA.Table2The resulting s values in the experimentsFeatures Classescavg cmom texture shist sFFT Planes Faces Cars Â0.300.350.39Â0.310.430.34Â0.260.260.34Â0.160.220.18Â0.190.220.18ÂÂÂ0.160.210.18ÂÂÂ0.170.230.18ÂÂÂÂ0.140.210.16ÂÂÂ0.150.210.18ÂÂÂ0.180.220.19ÂÂÂÂ0.140.200.16ÂÂÂÂÂ0.140.200.16 aksonen et al./Pattern Recognition Letters21(2000)1199±1207。
基于Contourlet变换的纹理图像检索李丽君【摘要】提出了一种基于Contourlet变换的纹理图像检索算法.首先对纹理图像进行Contourlet变换,通过调整子带能量的次序,改进其旋转不变性,再提取不同尺度、不同方向上变换系数矩阵的均值和标准方差作为特征向量,最后采用Canberra 距离进行相似性度量.实验结果表明,此算法在对纹理图像检索时具有良好的检索性能,并具有旋转不变性.%A texture image retrieval algorithm based on Contourlet transform was proposed. Firstly, texture images were transformed based on Contourlet domain, then the rotation in variance was improved by adjusting sequence of sub - band energy parameters. Then means and standard deviation of coefficients matrix in different scale and various directions were extracted to form feature vectors. Finally, similarity measurement was implemented by using Canberra distance. Experimental results show that the new method has better retrieval performance and the properties of rotation invariance.【期刊名称】《科学技术与工程》【年(卷),期】2012(012)013【总页数】3页(P3245-3247)【关键词】图像检索;Contourlet变换;旋转不变性;Canberra距离【作者】李丽君【作者单位】辽宁石油化工大学理学院,抚顺113001【正文语种】中文【中图分类】TP391.41多媒体和通信技术,特别是网络技术的高速发展使得人们对图像的应用日益广泛,如何从海量图像库中快速提取有价值的信息已成为人们的迫切需求。
图像检索(imageretrieval)-8-PARTICULAROBJECTRETRIE。
PARTICULAR OBJECT RETRIEVAL WITH INTEGRAL MAX-POOLING OF CNN ACTIVATIONSABSTRACT最近,建⽴在卷积神经⽹络(CNN)上的图像表征已经被证明可以为图像搜索提供有效的描述符,其性能优于作为短向量表征的前CNN特征。
然⽽,这种模型与⼏何感知重排序⽅法并不兼容,在某些特定对象检索基准上,仍然优于传统的图像搜索系统,这些系统依赖于精确的描述符匹配、⼏何重排序或查询扩展。
这项⼯作回顾了两个检索阶段,即初始搜索和重新排序,使⽤从CNN派⽣的相同原始信息。
我们构建了紧凑的特征向量来编码多个图像区域,⽽不需要向⽹络提供多个输⼊。
此外,我们扩展了积分图像(integral images)来处理卷积层激活上的max-pooling,从⽽允许我们有效地定位匹配的对象。
最终得到的边界框将⽤于图像重新排序。
因此,本⽂显著改进了现有的基于CNN的识别管道:我们⾸次报告了在具有挑战性的Oxford5k和Paris6k数据集中与传统⽅法竞争的结果。
1 INTRODUCTION基于内容的图像检索在过去⼗年中得到了持续的关注,导致了诸如可视化实例检索等任务的成熟系统。
⽬前最先进的⽅法源于Sivic和Zisserman(2003)的Bag-of-Words模型,其成功主要归功于局部不变特征(Lowe, 2004)和⼤型可视码本(Philbin et al., 2007)。
这些⽅法通常包括⼀个初始过滤阶段,其中所有数据库图像根据与查询图像的相似性进⾏排序,以及第⼆个重新排序阶段,这个阶段细化排名最⾼的元素的搜索结果。
过滤阶段是在⼏个⽅⾯改进,如结合weak geometric information (Je g ou et al., 2010),采⽤局部描述符的紧凑近似 (Je g ou et al., 2010),,或学习聪明的码本(Mikulik et al ., 2013;Avrithis & Kalantidis, 2012)。
Region-based Image Retrieval with High-Level Semantic Color NamesYing Liu1, Dengsheng Zhang1, Guojun Lu1 , Wei-Ying Ma21Gippsland School of Computing and Information Technology,Monash University, Vic, 3842, Australia{ying.liu, dengsheng.zhang, guojun.lu}@.au 2Microsoft Research Asia, No. 49 ZhiChun Road, Beijing, 100080, Chinawyma@AbstractPerformance of traditional content-b ased image retrieval systems is far from user’s expectation due to the ‘semantic gap’ b etween low-level visual features and the richness of human semantics. In attempt to reduce the ‘semantic gap’, this paper introduces a region-b ased image retrieval system with high-level semantic color names. In this system, database images are segmented into color-texture homogeneous regions. For each region, we define a color name as that used in our daily life. In the retrieval process, images containing regions of same color name as that of the query are selected as candidates. These candidate images are further ranked b ased on their color and texture features. In this way, the system reduces the ‘semantic gap’ between numerical image features and the rich semantics in the user’s mind. Experimental results show that the proposed system provides promising retrieval results with few features used.1. IntroductionTo support large scale image database retrieval, Content-based image retrieval (CBIR) was introduced in the early 1990’s. CBIR indexes images by their own visual contents, such as color, shape, texture. There are some commercial products and experimental prototype systems developed in the past decade, such as QBIC system [1], Photobook system [2], Netra system [3], SIMPLIcity system [4], etc. Although many sophisticated algorithms have been designed for color, shape, and texture description, such low-level image features in many cases can’t well describe the high level semantic concepts in the user’s mind. The discrepancy between the limited descriptive power of low-level image features and the richness of user semantics, is referred to as the ‘semantic gap [5][6][7].In order to improve the retrieval accuracy of CBIR systems,research focus in CBIR has been shifted from designing sophisticated feature extraction algorithms to reducing the semantic gap between the low-level visual features and the richness of the user semantics [8]. Literature review show that the methods developed for narrowing down the ‘semantic gap’ can be roughly classified into 3 categories: 1) Region-based image retrieval (RBIR). RBIR represents images at region level intending to be close to the perception of human visual system [9]. 2) Relevance feedback (RF). RF is introduced into image retrieval system for continuous learning through on-line interaction with users to improve retrieval performance [7]. 3) High-level semantic features. Mapping low-level image features to high-level concepts to reduce the ‘semantic gap’ [5].In this paper, we develop an image retrieval system combining RBIR with semantic color features in order to reduce the ‘semantic gap’.Although millions of colors can be defined in computer system, the colors that can be named by users are limited [10]. Color naming models intends to relate a numerical color space with semantic color names used in natural language. In [11], Berk, Brownston and Kaufman proposed a semantic color classification system named ‘CNS’(Color Naming System’) which quantized HSL space into 627 distinct colors. In [12], the author presents a color naming model, in which each of the 179 color names corresponds to a particular point in HSL color space and to its neighborhood (defined by Euclidean distance). The author also presents two other related models for comparison. Inspired by the above work, we implemented a color naming method which maps HSV color space to 93 semantic color names. HSV color space was created by A.R. Smith in 1978. It is the most natural color space in visual.By defining a color name for each segmented region, the system relates low-level HSV space color featuresto high-level semantics (for example, ‘pink’, ‘light sky blue’), thus allow users to perform query by keywords (for example, ‘find images with sky blue regions’). This is different from conventional methods of using color histogram or color moments to describe regions [4][9].The remaining of the paper is organized as follows. In section 2, we describe each component of our system, including image segmentation, region color naming and image ranking. Section 3 explains the test data set used and the performance evaluation model. Experimental results are given in Section 4. F inally, Section 5 concludes this paper.2. System DescriptionThis system includes three parts, image segmentation, region color naming and image ranking. F irstly, each database image is segmented into homogeneous regions. Then, for each region, a semantic color name is defined. The query region is an interested region picked up from the query image. In the retrieval process, database images containing regions of same color name as that of the query region are selected as candidates. These candidate images are further ranked according to their similarity to the query image.2.1. Image segmentationNatural scenes are rich in both color and texture, and a wide range of natural images can be considered as a mosaic of regions with different colors and textures. We intent to relate low-level region features to high-level human semantics such as color names used in daily life (grass green, sky blue), real-world texture patterns (grass, sky, trees, etc). For this purpose, image segmentation has to be performed first.In this work, we use ‘JSEG’ segmentation [13] to segment each database image into regions homogeneous in color and texture. Figure 1 gives twoexamples of JSEG segmentation results.14 regions 11 regionsFigure1. JSEG segmentation results 2.2. Region color namingAfter segmentation, each region is described by their color and texture features. We use the three most significant Tamura texture features (coarseness, contrast and directionality)[14] to characterize region texture property.Instead of using traditional color features such as color moments or color histograms [4][9], we use the average HSV value as the color feature of a region. The average HSV value is then converted to a semantic color name. The color naming procedure is described below.F irstly, Hue, Saturation and Value are normalized to the range [0,1). Hue value is usually quantized into a small set of about 10-20 base color names [12]. We uniformly quantize the Hue value into 10 base colors, red, orange, yellow, green, aqua, aquamarine, blue, vio et, purp e, magenta as in [12].Saturation and Value are quantized (not uniformly) into 4 bins respectively as adjectives signifying the saturation and luminance of the color. Table 1 describes the color naming model. Asterisks in the table indicate special cases. F or example, when S<0.1 and 0.1 V<0.8, we get ‘gray’ color; S<0.10 and V 0.8, we get ‘white’ color; when V<0.1, we always get ‘black’. A dash indicates that there is no modifying adjective required. Thus, we obtain a set of 10*3*3+3=93 different semantic color names.Base color names combined with their adjectives may be simplified to common used color names. F or example, ‘bright magenta’ can be named as ‘pink’.F igure 2 gives a few semantic colors with their corresponding quantized HSV values.Table 1 Color naming modelValue ofHSVbase colornamesSadjectivesVadjectives0 -0.1 Orange * *0.1-0.2 Yellow0.2-0.3 green dark0.3-0.4 aqua0.4-0.5 aquanmarinepale0.5-0.6 blue0.6-0.7 violet0.7-0.8 purple--0.8-0.9 magenta0.9-1.0 redpure brightPink Light sky blue Grass green(0.89,0.70,0.99) (0.60, 0.67, 0.92) (0.36, 0.99,0.65)Figure2. Example color names and their quantized HSV values F igure 3 gives two regions with their average colors. The average color of the left region has a HSV value of (0.158,0.37,0.89) and the corresponding color name is ‘pale yellow’. The HSV value of 2(b) is (0.253, 0.4, 0.43) and we name it ‘pale grass green’.In this way, low-level color features are mapped to high-level semantic color names. Thus, users can specify semantic color names as queries. For example ‘find images with sky blue regions’, ‘find images with a large pink color region which accounts for at least 30% of the image’. Such queries are more user-friendly. Hence, the gap between the rich semantics in users’ minds and the limitation of numerical image features isreduced.1(a) 1(b) 2(a) 2(b) Figure3. Region a vera ge color (a ) origina l region (b) average color2.3. Image rankingGiven a query image, the user can specify an interested region. In the retrieval process, the system firstly selects all images containing region(s) with same color name as that of the specified region as candidates. These candidate images are then ranked according to their distance to the query image. The details are described below.Suppose we have a query image Q I with m regions, },...,1|{m i R I Q i Q (1) the system segments the query image and obtains thecolor name Q n Cof the query region Q i R . Then all database images containing region(s) with same colorname are selected and form a candidate set},...,1|{0N T DB I C T (2)0N i s the number of candidate images in C . Suppose the target image T I has n regions,},...,1|{n i R I T i T (3) Each region is described by its average HSV color feature and three Tamura texture features (coarseness, contrast and directionality). Then region Q i R and T j R are characterized by 6-d feature vectors as in (4)(5), with each dimension been normalized to the range [0,1]. },,,,{,iiii i i i Q Q Q Q Q Q Q c drctcr v s h f (4)},,,,{,jjjj j j j T T T T T T T c dr ctcrv s h f (5)The distance between region Q i R and T jR is defined as the Euclidean distance between their features vectors as in (6).222222)()()(*)()()(*),(j i j i j i i i j i i i j TQ TQ TQ t T Q TQ T Q c Tc Qi c ij dr dr ct ct cr cr w v v s s h h w f fd d (6)where t c w w ,are the weights applied to color and texture features, respectively.With region distance defined, we use Earth Mover’s Distance (EMD) [15] to measure the overall distance between Q I and T I .EMD measures the minimal cost required to transform one distribution into another based on a traditional transportation problem from linear optimization, for which efficient algorithms are available. EMD matches perceptual similarity well and can be applied to variable-length representations of distributions, hence it is suitable for image similarity measure in RBIR systems [15][9]. F ormally, the query image Q I and target image T I are represented by signatures)},(),...,,{(11m m Q Q c Q Q c Q w f w f S (7))},(),...,,{(11n n T T c T T c T w f w f S (8) where j i T c Q c f f ,are region features, j i T Q w w , are the weights of the regions. We define the weight of a region as the relative size of the region over the entireimage. ThenProceedings of the 11th International Multimedia Modelling Conference (MMM’05)¦¦¦¦m i nj ijm i nj ijijTQ vdv S S EMD 1111),( (9)where ij d is the ‘ground distance’ between i Q c f andj Tc f as defined in (6), ij v is the optimal admissible flowfrom i Q c f to jT c f that minimizes the value of (9) subject to the following constraints:¦¦¦¦¦¦ d d d d d d d d d d t m i n j mi nj T Q ijT mi ij Q nj ij ij j i jiw w vn j w v m i w v n j m i v 111111),min(;1,;1,;1,1,0 (10)F inally, all the candidate images in C are ranked according to their EMD distances to the query image.3. Database and Performance Evaluation3.1. DatabaseCorel image set is often used to evaluate the performance of image retrieval systems due to its large size, heterogeneous content and human annotated ground truth available (pre-classified into different categories each containing 100 images).However, to be used in image retrieval system as test set, attention has to be paid in the ground truth data because some ‘category labels’ are very abstract and the images within the category can be largely varied in content. For instance, the category ‘Australia’ includes pictures of city building, shopping mall, crowds, Australian wild animals, etc. Due to the difficulty in image similarity measure within such category, it is improper to select query images from such categories and consider images in same category as relevant images.We selected 5,000 Corel images as our test set. ‘JSEG’ segmentation produces 29187 regions (5.84 regions per image on average) with size no less than 3% of the original image. We ignore small regions considering that regions should be large enough for us to study their texture patterns in our future work. It is reasonable to set this threshold within range around 1.1% to 4.5% so that the minimum region size will be between 16*16 and 32*32.3.2. Performance evaluationPrecision and recall are broadly used in image retrieval systems. Precision (Pr) is defined as the ratio of the number of relevant images retrieved rel N to the total number of retrieved images N . Recall (Re) is defined as the number of relevant images retrieved rel N over the total number of relevant images available in the database all N .all rel N N /Re (11) N N rel /Pr (12) In many papers using Corel images, retrieval performance is measured by the average precision of a number of queries with N =100. To describe the retrieval performance more clearly, we calculate theprecision and recall with 1001d d Nand present the precision ~ recall curve.4. Experimental Results4.1. Average color ~color momentsF irstly, we prove that it is reasonable to use average HSV color to describe regions in our system. For this, we compare the performance of RBIR using average HSV color (3-d feature vector) as region feature and the performance of RBIR using color moments (mean, standard derivation and skewness of each channel in HSV space form a 9-d region feature). Similarity between database images and the query image is measured by their EMD distance.The average results of 30 queries in Figure 4 show that the performance of average HSV color is very close to that of color moments. Note that this is true in our case as JSEG provides homogeneous color regions. F ornon-homogeneous regions, this may not be true.5HFDOO3U H F L V L R Q$YH&RORU&RORU0RPHQWVFigure4. Average HSV color ~color momentsThe advantage of using average HSV color is that it is simpler and easier to be converted to semantic color names.Due to segmentation inaccuracy, it may happen that some pixels not of the interested region are included in average color calculation and give us misleading results. Dominant color can be used instead of average color. However, our experimental results show that in most cases average color is good enough to describe region color information, and the performance is no much worse than that of using dominant color which is more difficult to calculate. Hence, in this work, we calculate the average HSV color of a region and convert it to a semantic color name as described in section 2.2.4.2.RBIR with semantic color namesWe compare the performance of RBIR with semantic color names (referred to as ‘R-Cn’) with the performance of RBIR using only low-level color features (referred to as ‘R-Cl’).In ‘R-Cl’, the average HSV color of each region in an image is used as region features. EMD distance between the database image and query image is used to measure image similarity.As described in Section 2.3, in ‘R-Cn’, an interested region is selected from a query image as query region. Examples of query regions/images are given in Figure5.1 2 3Figure5. Query image/region examples The system first obtains the color name of the selected region, then selects images containing region(s) with same color name as candidate images. These candidate images are further ranked according to their EMD distance to the query image.In ‘R-Cn’, the candidate image can be ranked based on different type of features. We compare the performance of ‘R-Cn’ with and without texture features, referred to as ‘R-Cn-C’ and ‘R-Cn-CT’respectively. That is, in the computation of region distance by equation (6), ‘R-Cn-C’ sets 0,1 t c w w , ‘R-Cn-CT’ sets 5.0,5.0 t c w w .Obtaining the average precision and recall over 30 queries, we compare the performance of ‘R-Cn-C’, ‘R-Cn-CT’ and ‘R-Cl’ in Figure 6.The results show that the performance of RBIR with semantic color names is close to that with low-level color features. As can be seen from F igure 6, when Recall is less than about 0.12, performance of ‘R-Cn-C’ is slightly better than that of ‘R-Cl’. When Recall is above 0.12, performance of ‘R-Cl’ is slightly better. Note that in ‘R-Cn-C’, only information from one interested region is used to select the candidate images, while in ‘R-Cl’, all regions are considered.In addition, it can be seen that the performance of ‘R-Cn-CT’ is better than that of ‘R-Cn-C’. This proves that including of texture features in the systems clearlyimproves the retrieval performance.5HFDOO3U H F L V L R Q5 &O5 &Q &5 &Q &7Figure6. Performance comparison of RBIR with/without semantic color names, with/without texture featuresWe observed that ‘R-Cn’ works well when the interested region is well segmented and the color name obtained can well describe the region. For example, in query 1, the semantic meaningful region is the small region -‘eagle’. JSEG successfully segments the ‘eagle’ from the background, and ‘R-Cn’ provides very good retrieval results. The results in Figure 7 show that out of the top 10 images retrieved, ‘R-Cn-CT’ returns 9 relevant images.Another example is query 2 in Figure 5. Since the color name ‘pale grass green’ can well represent the grass region (relevant images in the database are all about ‘horses on the green meadow’), retrieval accuracy of ‘R-Cn-CT’ is high. Among the first 10 images retrieved, the number of relevant images retrieved is 9 as shown in Figure 8.However, in some cases, using color name to select candidate images results in poor retrieval results. F or example, the semantic meaningful region in query 3 is the ‘butterfly’. In the retrieval process, many relevant images containing butterflies of different colors are filtered out. The retrieval results are given in Figure 9. Among the first 10 images retrieved, only 1 relevant image is found. The results tell us that in this case, other information such as shape feature is required to provide more accurate semantic description. Examples of relevant images in the category ‘butterflies’ aregiven in Figure 10.Figure10. Example images in category‘butterflies’ To further explain the retrieval results of query 1,2,3, Table 2 lists the number of relevant images obtained (rel N ) with different total number of retrieved images (N ).Table 2. Number of relevant images retrievedfor query 1,2,3 Q\N 10 20 50 80 100 1 9 17 24 25 27 2 9 18 34 41 48 3 1 1 3 4 44.3 Discussions –RBIR with/without semantic color namesExperimental results show that our RBIR system with semantic color names provides retrieval performance close to that of using only low-level color features. Note that in this work we only use information from one interested region to select candidate images. We expect the performance to be further improved if multiple types of features from multiple regions are considered. F or example, for query 2 in F igure 5, instead of ‘searching for the images with pale grassgreen region’, we can provide more semantic information and form a query as ‘searching images with horses in green grass area’.The most significant advantage of our system over systems using only low-level features lies in its ability to support keyword-based query which is more user-friendly. In addition, by using a specific color name to select a small set of candidate images from the entire database, upon which more complex image ranking is to be performed, database searching time can be greatly reduced.5. ConclusionsThis paper presents a region-based image retrieval system with high-level semantic color names defined for each region. In the retrieval process, database images containing region(s) of same color name as that of the interested query region are selected.In this way, the system reduces the ‘semantic gap’ between numerical image features and the richness of human semantics. Experimental results show that performance of the system is very promising.Using multiple types of features from multiple regions, we expect the performance of the system to be further improved.6. References[1]C.Faloutsos, R.Barber, M.Flickner, J.Hafner, W. Niblack, D.Petkovic, and W.Equitz, “Efficient and Effective Querying by Image Content”, Journal of Intelligent Information System , vol.3, no.3-4, pp231-262,1994.[2]A. Pentland, R.W.Picard, and S.Scaroff, “Photobook: Content-based Manipulation for Image Databases”, Inter. Jour. Computer Vision, vol. 18, no.3, pp233-254, 1996.[3]W.Y.Ma and B.Manjunath, “Netra: A Toolbox for Navigating Large Image Databases”, Proc. of ICIP, pp568-571, 1997.[4]J.Z.Wang, J.Li, and G. Wiederhold, “SIMPLIcity: Semantics-Sentitive Integrated Matching for Picture Libraries,” IEEE Trans. Pattern and Machine. Intell. Vol 23, no.9, pp947-963, 2001.[5]A.Mojsilovic, B.Rogowitz, “Capturing Image Semantics with Low-Level Descriptors”, Proc. of ICIP, pp18-21, 2001[6]X.S. Zhou, T.S.Huang, “CBIR: F rom Low-Level F eatures to High-Level Semantics”, Proc. SPIE Image and Video Communication and Processing, San Jose, CA. Jan.24-28, 2000.[7]Yixin Chen, J.Z.Wang, R.Krovetz, “An Unsupervised Learning Approach to Content-based Image Retrieval”, IEEE Proc. Inter. Symposium on Signal Processing and Its Applications, pp197-200, July 2003.[8]Arnold W.M. Smeulders, Marcel Worring, Amarnath Gupta, Ramesh Jain, “Content-based Image Retrieval at the End of the Early Years”, IEEE Trans. On Pattern Analysis and Machine Intelligence, vol. 22, No.12, Dec. 2000.[9]F eng Jing, Mingjing Li,, Lei Zhang, Hong-Jiang Zhang, Bo Zhang, “Learning in Region-based Image Retrieval”, Proc. Inter. Conf. on Image and Video Retrieval(CIVR2003), 2003.[10]E.B.Goldstein, Sensation and Perception, 5th Edition, Brooks/Cole, 1999.[11]Berk, T., L.Brownston, and A. Kuafman, “A New Color Naming System for Graphics Languages”, IEEE Computer Graphics and Applications, vol.2, no.3, pp37-44, IEEE, May 1982. [12]Conway, D.M., “An Experimental Comparison of Three Natural Language Color Naming Models”, Proc. East-West International Conference on Human-Computer Interactions, St. Petersburg, Russia, pp328-339, 1992.[13]Y.Deng, B.S.Manjunath and H.Shin "Color Image Segmentation", Proc. IEEE Computer Society Conference on Computer Vision and Pattern Recognition, CVPR '99, F ort Collins, CO, vol.2, pp.446-51, June 1999.[14]H. Tamura, S. Mori and T.Yamawaki, “Texture Features Corresponding to Visual Perception”, IEEE Trans. On Systems, Man and Cyb ernetics, vol.8, No.6, pp460-473,1978.[15]Rubner, Y., Tomasi, C., and Guibas, L., “A Metric for Distributions with Applications to Image Databases”, Proc. of the 1998 IEEE Inter. Conf. on Computer Vision, Jan. 1998.Q T T T T TT T F T TFigure7. Retrieval results for query 1.The first image is the query image. ‘Q’ refers to the query region.‘T’ refers to relevant images selected. ‘F’ refers to irrelevant images selected.Q FFigure8. Retrieval results for query 2.The first image is the query image. ‘Q’ refers to the query region.‘F’ refers to irrelevant images selected, all other images are relevant.Q TFigure9. Retrieval results for query 3The first image is the query image. ‘Q’ refers to the query region.‘T’ refers to relevant images selected, all other images are irrelevant.。
Color-Based Descriptors for Image Fingerprinting Marios A.Gavrielides,ElenaˇSikudová,and Ioannis Pitas,Senior Member,IEEEAbstract—Typically,content-based image retrieval(CBIR) systems receive an image or an image description as input and re-trieve images from a database that are similar to the query image in regard to properties such as color,texture,shape,or layout.A kind of system that did not receive much attention compared to CBIR systems,is one that searches for images that are not similar but exact copies of the same image that have undergone some transformation.In this paper,we present such a system referred to as an imagefingerprinting system,since it aims to extract unique and robust image descriptors(in analogy to humanfingerprints). We examine the use of color-based descriptors and provide com-parisons for different quantization methods,histograms calculated using color-only and/or spatial-color information with different similarity measures.The system was evaluated with receiver operating characteristic(ROC)analysis on a large database of 919original images consisting of randomly drawn art images and similar images from specific categories,along with30transformed images for each original,totaling27570images.The transformed images were produced with attacks that typically occur during digital image distribution,including different degrees of scaling, rotation,cropping,smoothing,additive noise and compression,as well as illumination contrast changes.Results showed a sensitivity of96%at the small false positive fraction of4%and a reduced sensitivity of88%when13%of all transformations involved changing the illuminance of the images.The overall performance of the system is encouraging for the use of color,and particularly spatial chromatic descriptors for imagefingerprinting.Index Terms—Color histogram,color quantization,imagefin-gerprinting,image indexing,image representation,retrieval,spa-tial chromatic histogram.I.I NTRODUCTIONR ECENT advances in multimedia technology and the growing worldwide access to fast Internet connections have enabled the wide spread distribution of digital images. This trend is amplified by the availability of digital cameras andManuscript received May20,2004;revised October19,2005.This work was supported by the RTN Project MOUMIR(Models for Unified Multimedia Infor-mation Retrieval,HPRCN-1999-00108)and in part by the European Commis-sion through the IST Programme under Contract IST-2002-507932ECRYPT. The associate editor coordinating the review of this manuscript and approving it for publication was Dr.Alexander Loui.M.A.Gavrielides was with the Artificial Intelligence and Information Analysis Laboratory,Department of Informatics,Aristotle University of Thes-saloniki,Thessaloniki54124,Greece.He is now with the Division of Imaging and Applied Mathematics,Office of Science and Engineering Labs,Center for Devices and Radiological Health,Food and Drug Administration,and the National Institute of Biomedical Imaging and Bioengineering,Rockville,MD 20852USA(e-mail:marios.gavrielides@.).E.ˇSikudováwas with the Artificial Intelligence and Information Analysis Laboratory,Department of Informatics,Aristotle University of Thessaloniki, Thessaloniki54124,Greece.She is now with the Department of Applied Infor-matics,Faculty of Mathematics,Physics and Informatics,Comenius University, Bratislava,Slovakia(e-mail:sikudova@fmph.uniba.sk).I.Pitas is with the Artificial Intelligence and Information Analysis Labora-tory,Department of Informatics,Aristotle University of Thessaloniki,Thessa-loniki54124,Greece(e-mail:pitas@zeus.csd.auth.gr).Digital Object Identifier10.1109/TMM.2006.876290scanners in an increasing number of households.The enormous amount of the produced media information created the need for intelligent systems for browsing,retrieval,and storage of im-ages.In particular,significant research effort has been devoted to content-based information retrieval systems that enable users to search and retrieve images based on the users’needs and interests.Content-based image retrieval systems(CBIR)aim to provide an automatic way to extract information from images that depends only on the content of the image.Typically,CBIR systems receive an image or an image description as input and retrieve images from a database that are similar to the query image in regard to properties such as color,texture,shape,or layout.A comprehensive survey of CBIR systems can be found in[1].A kind of system that did not receive much attention com-pared to CBIR systems,is one that searches for images that are not only similar to but versions(possibly modified)of the same image.The internet isflooded with copies of certain im-ages that have undergone a number of transformations which typically occur during image distribution,such as resizing,crop-ping,compression etc.Such transformations are essentially“at-tacks”from the viewpoint of intellectual property protection or digital rights management.A copyright owner of images would find useful a system that would detect only those images that are transformed versions of his/her own images.Detecting trans-formed versions of images could be used tofight piracy of such material and additionally,it could be used to trace the distri-bution of their products in the Internet for marketing purposes. Moreover,users would be able to search for different versions of their image of choice without getting back a large number of similar images.In order for such a system to be successful,it would need to fulfill the following characteristics:1)Robustness against a number of frequent attacks,includingscaling,rotation,cropping,compression,additive noise, and smoothing,which can be easily performed by nonex-perts due to the abundance of image manipulation software in the market.2)Good discriminating ability to avoid the retrieval of falsealarms.3)Efficient storage of extracted image descriptors that wouldbe used for image matching.4)Efficient search mechanism that would compare the imagedescription of the query image to those in a database of image descriptors.Research related to the retrieval of different versions of the same image within a database has been given a number of names depending on the application.More specifically,the term image fingerprinting has been used,as the extraction of a unique de-scription of an image that would be resilient to transformations, in an analogous manner to humanfingerprints.Fingerprinting1520-9210/$20.00©2006IEEEhad been originally proposed as a tool to track music and video broadcasting in order to perform copyright infringement moni-toring or to provide input to Digital Rights Management systems for revenue distribution.Imagefingerprinting differs from the body of work falling under image watermarking in the sense that watermarking involves embedding information into the image that is recovered to trace the image,whereasfingerprinting,as defined here,involves descriptors extracted from the image con-tent.Watermarking changes the content of an image(in a varying degree,usually related to the effectiveness of the watermark) whereasfingerprinting is a passive technique.Moreover,finger-printing can be used to search for those copies of an image that have already been circulating in the internet with no watermarks embedded on them.Despite the volume of research conducted in thefield of CBIR,limited efforts have focused in imagefingerprinting. Published work has suffered from limitations regarding the types of attacks(i.e.algorithm addressing only rotation invari-ance etc)and/or the degree of an attack(i.e.,algorithm limited to images scaled by only10%etc.).In the digital communi-cation era,it is important for imagefingerprinting methods to be resistant to distribution“attacks”such as compression and down scaling,which are common in the internet.Moreover,the published methods suffer from the small size of the evaluation database and the lack of quantitative evaluations(including sensitivity and false alarm rates).Related work includes the method of Schmid et al.[2]for matching an image to an image database.They used local gray value invariants detected at corner points and a voting algo-rithm for the retrieval of correct matches.Their method is lim-ited by scale constraints,due to stability issues of the corner de-tector.The extracted invariants were tested only for zooming by a factor of two,rotation,viewpoint change and partial visibility, without addressing other common attacks such as down scaling or compression.No complete quantitative evaluation was pre-sented other than recognition rates for a few examples.Datta et al.[3]developed a method where they used texture measures to segment an image into regions and extracted a feature vector of invariant moments and region properties.The extracted vector was used for image authentication against images under certain transformations.Transformations used included down scaling to 50%,cropping up to10%and rotation limited to90and180. However,they only presented results comparing the distance of the vector of an original image to that of transformed images without demonstrating how such measures would perform in a general database of other images.Moreover,they only used a single image for their evaluation.Johnson et al.[4]proposed another system based on salient points.They detected corner points in an image and used normalized cross-correlation be-tween the neighborhoods of points to select salient corner points for image representation.Their method was designed to with-stand affine transformations but,since it is based on gradient detectors for corner location,it is sensitive to blurring and com-pression attacks.No evaluation other than a few examples was presented.Recently,Seo et al.[5]developed afingerprinting method based on the Radon Transform,log mapping and the Fourier transform.They used bit error rate(BER)to evaluate the performance of their algorithm in the presence of several kinds of image degradations.The results for four images showed good performance for compression,smoothing,rotation and scaling. However,the method did not perform well for cropping.The authors did not present BER results in-between the four test im-ages or in a larger database to give some indication of false alarm rates.Another research area closely linked to this work is thefield of hashing,which is more concerned with security issues and image authentication.Schneider et al.[6]presented a method-ology for designing content-based digital signatures for image authentication but did not provide any experimental results. Venkatesan et al.[7]proposed an algorithm using randomized signal processing strategies for a nonreversible compression of images into random binary strings.They evaluated the robust-ness of their algorithm on a variety of attacks with satisfactory results.However,they used small degrees of scaling and rota-tion.Johnson et al.[8]used compressed dither-based sequences for secure image hashing.They evaluated their method on a small set of images and limited attacks(i.e1%rotation,1% cropping).An overview of image security techniques focusing on copyright protection was reported by Wolfgang and Delp[9]. In this manuscript,we examine the use of novel color-based descriptors for an imagefingerprinting system and its robust-ness to most common attacks in degrees beyond which an image would no longer be the same.It is well known that color and more specifically,color histogram is a robust global descriptor as long as there is uniqueness in the color pattern held against the pattern in the rest of the data set[1].However,there are many factors affecting the performance of color-based descriptors. We identified the following factors and examined the perfor-mance of our system in relation to them:a)various quantization methods,b)various color descriptors including color-only and color-spatial information,c)reduced number of colors,d)type of histogram-similarity measures,including measures incorpo-rating perceptual similarity between colors,e)effect of transfor-mations,including scale,cropping,compression,smoothing,ro-tation,additive noise and luminance change on the performance of afingerprinting system,and f)effect of data set used,by eval-uating color descriptors on a set of random images but also on sets of similar images.The method was evaluated on a rela-tively large database of27570transformed images,produced from919original images,from which meaningful conclusions can be deduced regarding thefingerprinting performance when using color descriptors for image representation.The contribu-tion of this work is the thorough analysis and comparison of the factors affecting the performance of color-based descriptors when applied to the specific problem of imagefingerprinting and the comprehensive evaluation of such an application on a large data set.The manuscript is organized as follows.In Section II,the database used for the evaluation,along with a description of the transformations that will be used to examine the robustness of the algorithm are presented.In Sections III and IV,the methods for the extraction of imagefingerprints as well as the matching process are described in detail.Section V includes the perfor-mance evaluation of the method,along with a discussion of the results.Finally,this study is summarized and conclusions are presented in Section VI.TABLE II MAGE D ATABASE U SED FOR E V ALUATION OF C OLOR DESCRIPTORSII.M ATERIALSA database of 919color images was used to evaluate the method.The database consisted of the following subsets:a)The BAL-Original set,including 450randomly selected art images provided by the Bridgeman Art Library (BAL),b)The Similar-Original set,including 469images from ten sets of categories,acquired from /research/image-database/.The categories along with their corresponding number of images are tabulated in Table I.The Similar-Original set was used to examine the performance of color descriptors on similar images.All images were in JPEG format and had variable sizes.The set of 30transformations shown in Table II was applied to each image using MATLAB (The MathWorks,Inc.)software.The images were resized using nearest neighbor interpolation.For the image rotation,it has to be noted that MATLAB adds a black frame around the image,thus producing an additional source of degradation,except for the case of 90.We chose not to remove that frame for the calculation of the descriptors since we wanted to treat it as an additional form of attack.Illumination changes were implemented by using nonlinear mapping of the color values for different gamma values,keeping in mind that a gamma value of 1.0indicates linear mapping.Moreover,contrast adjustment was implemented by stretching the image so that 2%of low and high intensities were saturated.Additive noise was implemented using three types of noise:salt and pepper,gaussian and speckle.All parameters used to create the different transformations are given in Table II,along with the notation for the different subsets.A total of 30transformed images were created for each of the 919original images,resulting in the Transformed-Image set of 27570images.III.C OLOR -B ASED F INGERPRINT E XTRACTIONAn image fingerprinting system consists mainly of two parts:fingerprint extraction and fingerprint matching.In the first part a descriptor is extracted from each image and is used to createan indexed database.In the second part,the index for an image (query image)is compared to the indices of the rest of the data-base (target images),using some kind of similarity measure to determine close matches between the query image and target im-ages.For this particular application,only transformed versions of the same image are considered good matches and should be retrieved.The fingerprint extraction procedure involves the quantiza-tion of the image colors and the calculation of color histograms based on the resulting colors.As can be seen below,the choices of the quantization method and the colors used have a direct ef-fect on the performance of the fingerprinting algorithm.A.Color QuantizationWe examined two methods for color quantization.One in-volves the sampling of a color space using fibonacci lattices ,as will be explained below.With this method,it was possible to control the number of colors in the resulting palette,and examine the effect of various color palettes on the algorithm performance.The other method uses a prede fined color palette,which was designed to match human perception of colors.In this section the two methods for color quantization are described in detail.1)Color Quantization Using Fibonacci Lattices:The first quantization method was an implementation of a palette gener-ation procedure proposed by Mojsilovic et al.[10].They usedfibonacci lattices to quantizetheplaneof space.The technical details of this method can be found elsewhere [10].Brie fly,the method consists of the following procedure.First,images are transformed fromthespace tothe space as described in [11].Chrominance sampling isperformed on a lattice de fined by a set ofpoints ,where,,.Parametersand in fluence the distribution of its points in the plane.Forand ,this lattice is called a Fibonacci lattice .For samplingof a color space,the lattice can be rotated by a smallangle for better alignment with the boundaries of the color space.In such case,the lattice points are givenby(1)To design a palette,the luminance axis is quantizedinto levels.For each luminancelevel,points are generated using (1).The lattice is scaled so that it covers theentirechrominance plane.The points chosen in this way are uniformly distributed,assuring that,there is neither crowding in the center nor scarcity at the borders.But,since the slice section ofthecolor space is not circular,some of the generatedpoints can lie outside the valid colors inthe cube space.Therefore,all the points whose,,or value was not within [0,1]range were discarded.The remaining points de fined the palette.The parameters de fining a palette are thefollowing:number of discrete luminancelevels;number of generated pixels per slice;,latticeparameters;initial angle.We experimented with four palettes of various sizes,created using the above procedure.All had theparameter settoTABLE IIT RANSFORMATIONS A PPLIED TO O RIGINAL IMAGESTABLE IIIP ARAMETERS U SED FOR C REATING P ALETTES OF V ARIABLEN UMBER OF C OLORS U SING F IBONACCI LATTICES.Using the parameters given in Table III,four palettes were generated with sizes of 10,24,43,and 101colors.2)Color Palette Based on Macbeth Color Checker Chart:The second type of quantization involved the use of a palette based on a commercial color chart known as the Gretag Mac-beth Color Checker.The Macbeth chart is a standard used to test color reproduction systems and it consists of 24colors,sci-enti fically prepared to represent a variety of different naturally occurring colors.The procedure for the generation of the color chart is reported in [12].We created a color palette based on theMacbethvalues found in [11,Table G.10].The coor-dinates were transformedtousing Theresulting coordinates were transformedto values using the following equations:Let,,,based on speci fications for the D65illuminant.Then the following pseudo-code below was used according to [11]:ifthenelseifthenelseifthenelseThe resulting palette of24coordinates,thereof de finedas the Macbeth palette,is given in Table IV.B.Color DescriptorsColor histograms have been used extensively in CBIR systems due to the simplicity of their calculation and their robustness to common image transformations.Many types of histograms exist in the literature falling mainly into two categories:those based only on the quantized colors and those incorporating information on the spatial color distribution.We examined the use of both kinds of color histograms.The first one was the normalized color-only histogram ,providing the occurrence of a color in animage givenby:TABLE IVLab V ALUES FOR M ACBETH -B ASED C OLOR PALETTEwhere is the number of pixels with color,is the totalnumber of pixels in theimageandis the number of colors in the palette.The normalized color histogram depends only on the color properties of an image without providing any information on the spatial distribution of colors.In order to examine any ad-vantages of using histograms incorporating color-spatial infor-mation for image fingerprinting,we also experimented with the spatial chromatic histogram proposed by Cinque et al.[13].The spatial chromatic histogram descriptor gives information on color presence,and color spatial distribution.Technical de-tails related to the calculation of the histogram can be found in [13].Here we give a brief outline of this method.Letbe the absolute number of the pixels inimage of size nxm having colorsand be the normalized color histogram.Then the following features are de fined:Baricenter:,whereandfor all palette colors found in the image.The baricenter gives a measure of the position of pixels having the same color.The standard deviation is de finedas:where is a pixel in relativecoordinates,denotes apixel having the color ,andis the Euclidean dis-tance between two pixels.The standard deviation gives a mea-sure of the pixel spread around the baricenter.Then,the spatial chromatic histogram is a vector of the three above mentionedfeaturesusing the notation mentioned above.For each image,we calcu-lated the normalized color histogram and the spatial chromatic histogram using the palettes described in Section III-A.The resulting vectors were saved as indices for all the images in the database.The average size of the vectors per image,depending on the presence of zeros,was 0.18KB,0.36KB,0.56KB,0.95KB,and 0.46KB for the Fibonacci-10,Fi-bonacci-24,Fibonacci-43,Fibonacci-101and Macbeth-24palettes respectively.IV .C OLOR -B ASED F INGERPRINT M ATCHINGIn order to retrieve the transformed versions of an original image,the descriptors of that image were matched against all image descriptors from the Transformed-Image Set.Image matching between color histogram descriptors depends on the choice of similarity measures,so we investigated the use of four different measures given below to match the normalized color histograms.A fifth measure was used for the spatial chromatic histogram.We used modi fied versions of some measures to scale them in the range 0to 1,with 1denoting a perfect match.Vectors,denote the normalized color histograms extracted fromimages,respectively,anddenotes the number of colors in a palette.The matching measures used were the following.i)Scaled -norm distance,de finedasii)Scaled -norm distance,de finedasThe above two measures are scaled versions ofthe -,and-norms which have been previously used for matching color histograms [14],[15].iii)Scaled Histogram Intersection de finedasThis measure is a modi fied version of the Histogram In-tersection measure [14].Only colors present in the image contribute to this metric.iv)Histogram Quadratic Distance ,as de fined in[16]where is a similarity matrix between colorsandand is expressedbyand is the Euclidean distance between two colors,inthe space givenbyFinally,in order to compare the spatial chromatic histograms betweenimages,,we used the spatial chromatic distance [13]de finedasusing the notation used in Section III-B.V .R ESULTS AND D ISCUSSIONThe use of color-based descriptors for the application of image fingerprinting was evaluated using Receiver Operator Characteristic (ROC)analysis [17].Speci fically,the evaluation consisted of taking the color descriptors from each original image and matching them against the descriptors from each of the 27570images in the Transformed-Images Set.Matches were determined by applying a threshold on the similarity measures and identifying those images with measures higher than the threshold.The goal was,for each image,to retrieve all of its 30transformed versions without any false positive matches.In order to evaluate the performance of this experi-ment,the well-known measures True Positive Fraction (TPF or sensitivity)and False Positive Fraction (FPF)were used [17],de fined asfollows:Fig.1.ROC curves comparing different color palettes.The normalized colorhistogram with the scaled histogram intersection similarity measure was used to match images.where versions refers to transformed images of I,andBy sweeping the threshold from 0to 1and averaging the mea-sures of TPF and FPF over all images in the Original Image Set,pairs of (Average TPF,Average FPF)were collected and were used to construct ROC curves.An ideal ROC curve passes through the {TPF,FPF}pair point of 1.0,0.0.The ROC curves in Fig.1compare the effect of the choice of palette on the performance of the system to match the 919images in the All-Original set with their transformed versions.Each curve was constructed using one of the palettes and the scaled histogram intersection measure.It can be seen from the curves that for the four palettes created with the Mojsilovic method the performance increases as the number of colors in-crease from ten to 43and is maintained at a similar level when the colors increase to 101.It is interesting to notice though,that almost equal performance with the palettes of 43and 101colors can be achieved with the Macbeth palette of only 24colors.Moreover,comparing the two quantization methods for the equal number of 24colors,the results with the Macbeth quantization outperform the ones using the Fibonacci palette.The small size of the descriptor is bene ficial for the ef ficient storage and functionality of the fingerprinting system.A similar pattern was observed for the rest of the histogram measures.Another parameter affecting the performance of the finger-printing performance was the choice of similarity measures.The ROC curves for the five similarity measures described in Section IV are plotted in Fig.2.The first four measures,scaled-norm ,scaled -norm ,scaled histogram intersec-tion and histogram quadratic distance ,apply to the normalizedFig.2.ROC curves comparing the different similarity measures for matching of color histograms.The spatial chromatic distance was used to match spatial chromatic histograms whereas the rest of the measures were used to match nor-malized color histograms.color-only histogram,whereas the spatial chromatic distance was used to match spatial chromatic histograms.All similarity measures used the24colors of the Macbeth palette.It can be seen from the graph,that the spatial chromatic histogram shows the best performance for sensitivities above90%whereas the quadratic histogram measure shows the worst performance. The color-spatial information was proven to be useful for this database that includes images that have the same colors but in different locations,resulting in more specific discrimination. In order to examine the performance of the color descrip-tors when similar images to the query are present in the data-base,a comparison was made between results taken using the BAL-Original set and the Similar-Original set.As described in Section II,the BAL-Original set consisted of images randomly drawn from a generic art database whereas the Similar-Original set consisted of images belonging in specific subject categories. The results are demonstrated using the ROC curves of Fig.3. The24-color Macbeth palette and the spatial chromatic distance were used in this experiment.It can be seen from the plots that the overall system performance was degraded when the set of images included similar images since those images not only tend to share similar color vectors affecting the discrimination ability of the color descriptors but often have the same color layout. Another experiment examined the robustness of color-based descriptors for specific transformations.The ROC curves of Fig.4,taken using the spatial chromatic distance,demonstrate the invariance of color-based descriptors to resizing,to JPEG compression,to additive noise,to medianfiltering,and to rotation of90,keeping in mind that for that particular angle no black frame was added to the image.As expected,the performance dropped for higher degrees of cropping and for rotations where a black frame is added,since some colorsmay Fig.3.ROC curves comparing the performance of thefingerprinting system for the different data sets.The plot shows that performance is degraded when similar images are included in thedataset.Fig.4.ROC curves for different transformations.Matching was done using the spatial chromatic distance and the Macbeth color palette consisting of24colors. get lost when a large piece of it is cut.It can be seen for the plots that color-based descriptors fail to match images when their illumination contrast is changed since the colors of the image are severely altered.The effect is maximal when nonlinear mapping was used and less severe when contrast stretching was used.The performance of the system for different transfor-mations is shown in more detail in Fig.5.Regarding additive noise,the system seems to be invariant to salt and pepper and speckle noise and is more affected by Gaussian noise.This can be explained by the fact that salt and pepper and speckle noise。
Content Based Image Retrieval usingColor and TextureManimala Singha* and K.Hemachandran$Dept. of Computer Science, Assam University, SilcharIndia. Pin code 788011*n.manimala888@,$khchandran@A BSTRACTThe increased need of content based image retrieval technique can be found in a number of different domains such as Data Mining, Education, Medical Imaging, Crime Prevention, Weather forecasting, Remote Sensing and Management of Earth Resources. This paper presents the content based image retrieval, using features like texture and color, called WBCHIR (Wavelet Based Color Histogram Image Retrieval).The texture and color features are extracted through wavelet transformation and color histogram and the combination of these features is robust to scaling and translation of objects in an image. The proposed system has demonstrated a promising and faster retrieval method on a WANG image database containing 1000 general-purpose color images. The performance has been evaluated by comparing with the existing systems in the literature.KeywordsImage Retrieval, Color Histogram, Color Spaces, Quantization, Similarity Matching, Haar Wavelet, Precision and Recall.1.INTRODUCTIONResearch on content-based image retrieval has gained tremendous momentum during the last decade. A lot of research work has been carried out on Image Retrieval by many researchers, expanding in both depth and breadth [1]-[5]. The term Content Based Image Retrieval (CBIR) seems to have originated with the work of Kato [6] for the automatic retrieval of the images from a database, based on the color and shape present. Since then, the term has widely been used to describe the process of retrieving desired images from a large collection of database, on the basis of syntactical image features (color, texture and shape). The techniques, tools and algorithms that are used, originate from the fields, such as statistics, pattern recognition, signal processing, data mining and computer vision. In the past decade, many image retrieval systems have been successfully developed, such as the IBM QBIC System [7], developed at the IBM Almaden Research Center, the VIRAGE System [8], developed by the Virage Incorporation, the Photobook System [9], developed by the MIT Media Lab, the VisualSeek System [10], developed at Columbia University, the WBIIS System [11] developed at Stanford University, and the Blobworld System [12], developed at U.C. Berkeley and SIMPLIcity System [13]. Since simply color, texture and shape features cannot sufficiently represent image semantics, semantic-based image retrieval is still an open problem. CBIR is the most important and effective image retrieval method and widely studied in both academia and industry arena. In this paper we propose an image retrieval system, called Wavelet-Based Color Histogram Image Retrieval (WBCHIR),based on the combination of color and texture features.The color histogram for color feature and wavelet representation for texture and location information of an image. This reduces the processing time for retrieval of an image with more promising representatives. The extraction of color features from digital images depends on an understanding of the theory of color and the representation of color in digital images. Color spaces are an important component for relating color to its representation in digital form. The transformations between different color spaces and the quantization of color information are primary determinants of a given feature extraction method. Color is usually represented by color histogram, color correlogram, color coherence vector and color moment, under certain a color space [14-17]. The color histogram feature has been used by many researchers for image retrieval [18 and 19]. A color histogram is a vector, where each element represents the number of pixels falling in a bin, of an image [20]. The color histogram has been used as one of the feature extraction attributes with the advantage like robustness with respect to geometric changes of the objects in the image. However the color histogram may fail when the texture feature is dominant in an image [21].Li and Lee [22] have proposed a ring based fuzzy histogram feature to overcome the limitation of conventional color histogram.The distance formula used by many researchers, for image retrieval, include Histogram Euclidean Distance, Histogram Intersection Distance, Histogram Manhattan Distance and Histogram Quadratic Distance[23-27].Texture is also considered as one of the feature extraction attributes by many researchers [28-31]. Although there is no formal definition for texture, intuitively this descriptor provides measures of the properties such as smoothness, coarseness, and regularity. Mainly the texture features of an image are analyzed through statistical, structural and spectral methods [32].The rest of the paper is organized as follows: In section 2, a brief review of the related work is presented. The section 3 describes the color feature extraction. The section 4, presents the texture feature extraction and the section 5, presents the similarity matching. The proposed method is given in section 6 and section 7 describes the performance evaluation of the proposed method. Finally the experimental work and the conclusions are presented in section 8 and section 9 respectively.2.RELATED WORKLin et al. [14] proposed a color-texture and color-histogram based image retrieval system (CTCHIR). They proposed (1) three image features, based on color, texture and color distribution, as color co-occurrence matrix (CCM), difference between pixels of scan pattern (DBPSP) and color histogram for K-mean (CHKM) respectively and (2) a method for image retrieval by integrating CCM, DBPSP and CHKM to enhance image detection rate and simplify computation of image retrieval. From the experimental results they found that, their proposed method outperforms the Jhanwar et al. [33] and Hung and Dai [34] methods. Raghupathi et al.[35] have made a comparative study on image retrieval techniques, using different feature extraction methods like color histogram, Gabor Transform, color histogram+gabour transform, Contourlet Transform and color histogram+contourlet transform. Hiremath and Pujari [36] proposed CBIR system based on the color, texture and shape features by partitioning the image into tiles. The features computed on tiles serve as local descriptors of color and texture features. The color and texture analysis are analyzed by using two level grid frameworks and the shape feature is used by using Gradient Vector Flow. The comparison of experimental result of proposed method with other system [37]-[40] found that, their proposed retrieval system gives better performance than the others. Rao et al. [41] proposed CTDCIRS (color-texture and dominant color based image retrieval system), they integrated three features like Motif co-occurrence matrix (MCM) and difference between pixels of scan pattern (DBPSP) which describes the texture features and dynamic dominant color (DDC) to extract color feature. Theycompared their results with the work of Jhanwar et al. [33] and Hung and Dai [34] and found that their method gives better retrieval results than others.3. COLOR FEATUREThe color feature has widely been used in CBIR systems, because of its easy and fast computation [42]-[43]. Color is also an intuitive feature and plays an important role in image matching. The extraction of color features from digital images depends on an understanding of the theory of color and the representation of color in digital images. The color histogram is one of the most commonly used color feature representation in image retrieval. The original idea to use histogram for retrieval comes from Swain and Ballard [27], who realized the power to identify an object using color is much larger than that of a gray scale.3.1 COLOR SPACE SELECTION AND COLOR QUANTIZATIONThe color of an image is represented, through any of the popular color spaces like RGB, XYZ, YIQ, L*a*b*, U*V*W*, YUV and HSV [44]. It has been reported that the HSV color space gives the best color histogram feature, among the different color spaces [45]-[49]. The application of the HSV color space in the content-based image retrieval has been reported by Surel et al. [50]. In HSV color space the color is presented in terms of three components: Hue (H), Saturation (S) and Value (V) and the HSV color space is based on cylinder coordinates [51 and 52].Color quantization is a process that optimizes the use of distinct colors in an image without affecting the visual properties of an image. For a true color image, the distinct number of colors is up to 224 = 16777216 and the direct extraction of color feature from the true color will lead to a large computation. In order to reduce the computation, the color quantization can be used to represent the image, without a significant reduction in image quality, thereby reducing the storage space and enhancing the process speed [53]. The effect of color quantization on the performance of image retrieval has been reported by many authors [53 and 54].3.2 Color HistogramA color histogram represents the distribution of colors in an image, through a set of bins, where each histogram bin corresponds to a color in the quantized color space. A color histogram for a given image is represented by a vector:H = ሼH ሾ0ሿ,H ሾ1ሿ,H ሾ2ሿ,H ሾ3ሿ,…………H ሾi ሿ,………,H ሾn ሿሽWhere i is the color bin in the color histogram and H[i] represents the number of pixels of color i in the image, and n is the total number of bins used in color histogram. Typically, each pixel in an image will be assigned to a bin of a color histogram. Accordingly in the color histogram of an image, the value of each bin gives the number of pixels that has the same corresponding color. In order to compare images of different sizes, color histograms should be normalized. The normalized color histogram H ᇱ is given as:H ᇱ=ሼH ᇱ ሾ0ሿ,H ᇱሾ1ሿ,H ᇱሾ2ሿ,……,H ᇱሾi ሿ,….,H ᇱሾn ሿሽWhere H ᇱሾi ሿ=ୌሾ୧ሿ, p is the total number of pixels of an image [55].4. TEXTURE FEATURELike color, the texture is a powerful low-level feature for image search and retrieval applications. Much work has been done on texture analysis, classification, and segmentation for the last four decade, still there is a lot of potential for the research. So far, there is no unique definition fortexture; however, an encapsulating scientific definition as given in [56] can be stated as, “Texture is an attribute representing the spatial arrangement of the grey levels of the pixels in a region or image”. The common known texture descriptors are Wavelet Transform [57], Gabor-filter [58], co-occurrence matrices [59] and Tamura features [60]. We have used Wavelet Transform, which decomposes an image into orthogonal components, because of its better localization and computationally inexpensive properties [30 and 31].4.1 Haar Discrete Wavelet TransformsDiscrete wavelet transformation (DWT) [61] is used to transform an image from spatial domain into frequency domain. The wavelet transform represents a function as a superposition of a family of basis functions called wavelets. Wavelet transforms extract information from signal at different scales by passing the signal through low pass and high pass filters. Wavelets provide multi-resolution capability and good energy compaction. Wavelets are robust with respect to color intensity shifts and can capture both texture and shape information efficiently. The wavelet transforms can be computed linearly with time and thus allowing for very fast algorithms [28]. DWT decomposes a signal into a set of Basis Functions and Wavelet Functions. The wavelet transform computation of a two-dimensional image is also a multi-resolution approach, which applies recursive filtering and sub-sampling. At each level (scale), the image is decomposed into four frequency sub-bands, LL, LH, HL, and HH where L denotes low frequency and H denotes high frequency as shown in Figure1.Figure 1. Discrete Wavelet Sub-band DecompositionHaar wavelets are widely being used since its invention after by Haar [62]. Haar used these functions to give an example of a countable orthonormal system for the space of square-integrable functions on the real line. In this paper, we have used Haar wavelets to compute feature signatures, because they are the fastest to compute and also have been found to perform well in practice [63]. Haar wavelets enable us to speed up the wavelet computation phase for thousands of sliding windows of varying sizes in an image. The Haar wavelet's mother wavelet function ψ(t) can be described as:ψሺt ሻ=ەۖ۔ۖۓ1 ,0≤t ≤12−1 ,12≤t <10 ,otherwiseሺ1ሻ and its scaling function φ(t) can be described as:Signal & Image Processing : An International Journal (SIPIJ) Vol.3, No.1, February 2012φሺtሻ= ቄ1 ,0≤t <10 ,otherwiseሺ2ሻ5. FEATURE SIMILARITY MATCHINGThe Similarity matching is the process of approximating a solution, based on the computation of a similarity function between a pair of images, and the result is a set of likely values. Exactness, however, is a precise concept. Many researchers have used different similarity matching techniques [23]-[27]. In our study, we have used the Histogram Intersection Distance method, for the reasons given in [64].5.1 Histogram Intersection Distance:Swain and Ballard [27] proposed histogram intersection for color image retrieval. Intersection of histograms was originally defined as:d ୍ୈ=∑minൣQ ሾi ሿ, D ሾi ሿ൧୧ୀ୬୧ୀଵሾ| D ሾi ሿ|ሿ ሺ3ሻSmith and Chang [55] extended the idea, by modifying the denominator of the original definition, to include the case when the cardinalities of the two histograms are different and expressed as:d ୍ୈ∑minሾQሾiሿ,Dሾiሿሿ୧ୀ୬୧ୀଵmin ሾ|Qሾiሿ|,Dሾiሿሿሺ4ሻand |Q| and |D| represents the magnitude of the histogram for query image and a representative image in the Database.6. PROPOSED METHODIn this study we are proposing two algorithms for image retrieval based on the color histogram and Wavelet-based Color Histogram. The block diagrams of the proposed methods are shown in Figure 2. and Figure 3.6.1. Color HistogramStep 1. Convert RGB color space image into HSV color space.Step 2. Color quantization is carried out using color histogram by assigning 8 level each tohue, saturation and value to give a quantized HSV space with 8x8x8=512 histogram bins.Step 3. The normalized histogram is obtained by dividing with the total number of pixels. Step 4. Repeat step1 to step3 on an image in the database.Step 5. Calculate the similarity matrix of query image and the image present in the database. Step 6. Repeat the steps from 4 to 5 for all the images in the database. Step 7. Retrieve the images.Figure 2. Block diagram of proposed Color Histogram6.2. Wavelet-Based Color Histogram (WBCH).Step1. Extract the Red, Green, and Blue Components from an image.Step2. Decompose each Red, Green, Blue Component using Haar Wavelet transformation at 1st level to get approximate coefficient and vertical, horizontal and diagonal detail coefficients.Step3. Combine approximate coefficient of Red, Green, and Blue Component.Step4. Similarly combine the horizontal and vertical coefficients of Red, Green, and Blue Component.Step5. Assign the weights 0.003 to approximate coefficients, 0.001 to horizontal and 0.001 to vertical coefficients (experimentally observed values).Step6. Convert the approximate, horizontal and vertical coefficients into HSV plane.Step7. Color quantization is carried out using color histogram by assigning 8 level each to hue, saturation and value to give a quantized HSV space with 8x8x8=512 histogram bins. Step8. The normalized histogram is obtained by dividing with the total number of pixels.Step9. Repeat step1 to step8 on an image in the database.Step10. Calculate the similarity matrix of query image and the image present in the database. Step11. Repeat the steps from 9 to 10 for all the images in the database.Step12. Retrieve the images.Figure 3. Block diagram of proposed Wavelet-Based Color Histogram (WBCH). (A-approximate coefficient, H-horizontal detail coefficient, V-vertical detail coefficient).7.PERFORMANCE EVALUATIONThe performance of retrieval of the system can be measured in terms of its recall and precision. Recall measures the ability of the system to retrieve all the models that are relevant, while precision measures the ability of the system to retrieve only the models that are relevant. It has been reported that the histogram gives the best performance through recall and precision value [35, 44]. They are defined as:Precision=୳୫ୠୣ୰ ୭ ୰ୣ୪ୣ୴ୟ୬୲ ୧୫ୟୣୱ ୰ୣ୲୰୧ୣ୴ୣୢ୭୲ୟ୪ ୬୳୫ୠୣ୰ ୭ ୧୫ୟୣୱ ୰ୣ୲୰୧ୣ୴ୣୢ=ା (5)R ecall = ୳୫ୠୣ୰ ୭ ୰ୣ୪ୣ୴ୟ୬୲ ୧୫ୟୣୱ ୰ୣ୲୰୧ୣ୴ୣୢ୭୲ୟ୪ ୬୳୫ୠୣ୰ ୭ ୰ୣ୪ୣ୴ୟ୬୲ ୧୫ୟୣୱ=ାେ (6)Where A represent the number of relevant images that are retrieved, B, the number of irrelevant items and the C, number of relevant items those were not retrieved. The number of relevant items retrieved is the number of the returned images that are similar to the query image in this case. The total number of items retrieved is the number of images that are returned by the search engine. The average precision for the images that belongs to the q th category (A q) has been computed by [65]ᇱ=ሺ݅ሻหܣห∈ሺ7ሻWhere q=1, 2……10.Finally, the average precision is given by:ᇱ=∑ᇱ/10.ଵୀଵ ሺ8ሻ8.EXPERIMENTThe proposed method has been implemented using Matlab 7.3 and tested on a general-purpose WANG database [66] containing 1,000 images of the Corel stock photo, in JPEG format of size 384x256 and 256x386 as shown in Figure 4. The search is usually based on similarity rather than the exact match. We have followed the image retrieval technique, as described in the section 6.1 on different quantization schemes. The quality of the image retrieval, with different quantization schemes like (4, 4, 4), (4, 8, 8), (8, 4, 4), (8, 8, 4), (8, 8, 8), (16, 4, 4) and (18, 3, 3) has been evaluated by randomly selecting 10 query images, of each category, from the image database. Each query returns the top 10 images from database, and the calculated precision values, using the equation 5, and average precision using equation 8 are given in the Table 1. The average precision (7.8) value of (8, 8, 8) quantization bin indicates the better retrieval results than the others.Table 1. Precision Using Different Quantization SchemesCategory 4,4,4 4,4,8 4,8,8 8,4,4 8,8,4 8,8,8 16,4,4 18,3,3African9 9 9 9 9 9 10 9PeopleBeach 6 5 5 4 6 6 3 5Building 6 6 6 6 7 6 8 9Buses 9 9 9 9 9 9 9 8Dinosaurs 8 10 9 7 8 9 8 8Elephants 7 8 8 7 8 9 7 7Flowers 6 6 6 7 7 7 7 6Horses 9 9 9 10 9 9 10 10Mountains 6 6 6 5 5 6 6 5Food 8 7 9 8 8 8 8 8Average7.4 7.5 7.6 7.2 7.6 7.8 7.6 7.5precisionThe WBCH method, as discussed in section 6.2, has been used to study the image retrieval using (8,8,8) color quantization bin and the performance of the proposed image retrieval technique has been evaluated by comparing the results with the results of different authors [14, 35, 36 and 41] as shown in the Table 2. The effectiveness of the WBCH retrieval method is evaluated by selecting 10 query images under each category of different semantics. For each query, we examined the precision of the retrieval, based on the relevance of the image semantics. The semantic relevance is determined by manual truthing the query image and each of the retrieved images in the retrieval. The precision values, calculated by using the equation 5 and also the average precision using the equation 8 are shown in Table 2. The 10 query retrievals by the proposed method are shown in Figures 5-14, with an average retrieval time as 1min. These results clearly show that the performance of the proposed method is better than the other methods.Table 2: Precision of the Retrieval by different methodsClasses Category WBCH CH [14] [35] [36] [41]1 African people 0.65 0.72 0.68 0.75 0.54 0.5622 Beach 0.62 0.53 0.54 0.6 0.38 0.5363 Building 0.71 0.61 0.56 0.43 0.30 0.614 Buses 0.92 0.93 0.89 0.69 0.64 0.8935 Dinosaurs 0.97 0.95 0.99 1 0.96 0.9846 Elephants 0.86 0.84 0.66 0.72 0.62 0.5787 Flowers 0.76 0.66 0.89 0.93 0.68 0.8998 Horses 0.87 0.89 0.8 0.91 0.75 0.789 Mountains 0.49 0.47 0.52 0.36 0.45 0.51210 Food 0.77 0.82 0.73 0.65 0.53 0.694Average Precision0.762 0.742 0.726 0.704 0.585 0.7048Figure 4. Sample of WANG Image DatabaseFigure 5. Retrieve results for African PeopleFigure 6. Retrieve results for BeachFigure 7. Retrieve results for BuildingFigure 8. Retrieve results for BusFigure 9. Retrieve results for DinosaursFigure 10. Retrieve results for ElephantsFigure 11. Retrieve results for FlowersFigure 12. Retrieve results for HorsesFigure 13. Retrieve results for MountainsFigure 14. Retrieve results for Food9.CONCLUSIONIn this paper, we presented a novel approach for Content Based Image Retrieval by combining the color and texture features called Wavelet-Based Color Histogram Image Retrieval (WBCHIR). Similarity between the images is ascertained by means of a distance function. The experimental result shows that the proposed method outperforms the other retrieval methods in terms of Average Precision. Moreover, the computational steps are effectively reduced with the use of Wavelet transformation. As a result, there is a substational increase in the retrieval speed. The whole indexing time for the 1000 image database takes 5-6 minutes.ACKNOWLEDGEMENTSOne of us (*) is grateful to the Prof. Tapodhir Bhattacharjee (VC), Assam University, Silchar for the award of UGC Fellowship.REFERENCES1.R. Datta, D. Joshi, J. Li and J. Z. Wang, “Image retrieval: Ideas, influences, and trends of the newage”, ACM computing Survey, vol.40, no.2, pp.1-60, 2008.2.J. Eakins and M. Graham, “Content-Based Image Retrieval”, Technical report, JISC TechnologyApplications Programme, 1999.3.Y. Rui, T. S. Huang and S.F. Chang, “Image Retrieval: Current Techniques, Promising Directions andOpen Issues. Journal of Visual Communication and Image Representation. 10(4): pp. 39-62. 1999. 4. A. M. Smeulders, M. Worring and S. Santini, A. Gupta and R. Jain, “Content Based Image Retrievalat the End of the Early Years”, IEEE Transactions on Pattern Analysis and Machine Intelligence, 22(12): pp. 1349-1380, 2000.5.Y. Liu, D. Zang, G. Lu and W. Y. Ma, “A survey of content-based image retrieval with high-levelsemantics”, Pattern Recognition, Vol-40, pp-262-282, 2007.6.T. Kato, “Database architecture for content-based image retrieval”, In Proceedings of the SPIE - TheInternational Society for Optical Engineering, vol.1662, pp.112-113, 1992.7.M. Flickner, H Sawhney, W. Niblack, J. Ashley, Q. Huang, B. Dom, M. Gorkani, J. Hafne, D. Lee, D.Petkovic, D. Steele and P. Yanker, “Query by Image and Video Content The QBIC System” IEEE Computer, pp-23-32, 1995.8. A. Gupta and R. Jain. Visual information retrieval, Communications of the ACM 40 (5), 70–79. 1997.9. A. Pentland, R.W. Picard and S. Scaroff, “Photobook: Content-Based Manipulation for ImageDatabases”, International Journal of Computer Vision 18 (3), pp233–254. 1996.10.J. R. Smith and S.F. Chang, “VisualSEEk: a fully automated content-based image query system”,ACM Multimedia, 1996.11.J. Wang, G. Wiederhold, O. Firschein and S. We, “Content-based Image Indexing and SearchingUsing Daubechies’ Wavelets”, International Journal on Digital Libraries (IJODL) 1, (4). pp. 311–328, 1998.12. C. Carson, S. Belongie, H. Greenspan and J. Malik, “Blobworld: image segmentation usingexpectation-maximization and its application to image querying”, IEEE Trans. Pattern Anal. Mach.Intell. 8 (8), pp. 1026–1038, 2002.13.J. Wang, J. LI and G. Wiederhold, “SIMPLIcity: Semantics-sensitive integrated matching for picturelibraries”, IEEE Transactions on Pattern Analysis and Machine Intelligence. 23, 9, pp. 947–963, 2001.14. C.H. Lin, R.T. Chen and Y.K. Chan, “A smart content-based image retrieval system based on colorand texture feature”, Image and Vision Computing vol.27, pp.658–665, 2009.15.J. Huang and S. K. Ravi, “Image Indexing Using Color Correlograms” , Proceedings of the IEEEConference, Computer Vision and Pattern Recognition, Puerto Rico, Jun. 1997.16.G. Pass and R. Zabih, “Refinement Histogram for Content-Based Image Retrieval”, IEEE Workshopon Application of Computer Vision, pp. 96-102. 1996.17.M. Stricker and A. Dimai, “Color indexing with weak spatial constraints”, IS&T/SPIE Conf. onStorage and Retrieval for Image and Video Databases IV, Vol. 2670, pp.29-40, 1996.18.P. S. Suhasini, K. R Krishna and I. V. M. Krishna, “CBIR Using Color Histogram Processing”,Journal of Theoretical and Applied Information Technology, Vol. 6, No.1, pp-116-122, 2009.19.R. Chakarvarti and X. Meng, “A Study of Color Histogram Based Image Retrieval”, SixthInternational Conference on Information Technology: New Generations, IEEE, 2009.20.X. Wan and C.C. Kuo, “Color Distrbution Analysis and Quantization for Image Retrieval”, In SPIEStorage and Retrieval for Image and Video Databases IV, Vol. SPIE 2670, pp. 9–16, 1996.21.S. Li and M. C. Lee, “Rotation and Scale Invariant Color Image Retrieval Using Fuzzy Clustering”,Published in Computer Science Journal, Chinese university of Hong Kong, 2004.22. F. Tang and H. Tae, “Object Tracking with Dynamic Feature Graph”, ICCCN’05. Proceeding of the14th International Conference on Computer Communications and Networks, 2005.23.M. Ioka, “A Method of defining the similarity of images on the basis of color information”, TechnicalReport IBM Research, Tokyo Research Laboratory, 1989.24.H. James. H, S. Harpreet, W. Equits, M. Flickner and W. Niblack, “Efficient Color HistogramIndexing for Quadratic Form Distance Functions”, IEEE Transactions on Pattern Analysis and Machine Intelligence, Vol. 17, No. 7, 1995.25.J.R. Smith and S.F. Chang, “Automated Image Retrieval using Color and Texture”, Technical Report,Columbia University, 1995.26.V. V. Kumar, N. G. Rao, A. L. N. Rao and V. V. Krishna, “IHBM: Integrated Histogram BinMatching For Similarity Measures of Color Image Retrieval”, International Journal of Signal Processing, Image Processing and Pattern Recognition Vol. 2, No.3, 2009.27.M. Swain, D. Ballard, “Color indexing”, International Journal of Computer Vision, 7, pp-11–32,1991.28. A. Natsev, R. Rastogi and K. Shim, “WALRUS: A Similarity Retrieval Algorithm for ImageDatabases”, In Proceeding. ACM SIGMOD Int. Conf. Management of Data, pp-395–406, 1999. 29.S. Ardizzoni, I. Bartolini, and M. Patella, “Windsurf: Region based Image Retrieval using Wavelets”,In IWOSS’99, pp. 167–173, 1999.30.G. V. D. Wouwer, P. Scheunders and D. V. Dyck, “Statistical texture characterization from discretewavelet representation”, IEEE Transactions on Image Processing, Vol.8, pp-592–598, 1999.31.S. Livens, P. Scheunders, G. V. D. Wouwer and D. V. Dyck, “Wavelets for texture analysis, anoverview”, Proceedings of Sixth International Conference on Image Processing and Its Applications, Vol. 2, pp-581–585, 1997.32.R. C. Gonzalez and E.W. Richard, Digital Image Processing, Prentice Hall. 2001.33.N. Jhanwar, S. Chaudhurib, G. Seetharamanc and B. Zavidovique, “Content based image retrievalusing motif co-occurrence matrix”, Image and Vision Computing, Vol.22, pp-1211–1220, 2004. 34.P.W. Huang and S.K. Dai, “Image retrieval by texture similarity”, Pattern Recognition, Vol. 36, pp-665–679, 2003.35.G. Raghupathi, R.S. Anand, and M.L Dewal, “Color and Texture Features for content Based imageretrieval”, Second International conference on multimedia and content based image retrieval, July-21-23, 2010.36.P. S. Hiremath and J. Pujari, “Content Based Image Retrieval based on Color, Texture and Shapefeatures using Image and its complement”, 15th International Conference on Advance Computing and Communications. IEEE. 2007.37.Y. Chen and J. Z. Wang, “A Region-Based Fuzzy Feature Matching Approach to Content BasedImage Retrieval”, IEEE Transactions on Pattern Analysis and Machine Intelligence. Vol. 24, No.9, pp. 1252-1267, 2002.38.J. Li, J.Z. Wang and G. Wiederhold, “IRM: Integrated Region Matching for Image Retrieval”, InProceeding of the 8th ACM Intermational Conference on Multimedia, pp- 147-156, Oct. 2000.39.M. Banerjee, M. K. Kundu and P. K. Das, “Image Retrieval with Visually Prominent Features usingFuzzy set theoretic Evaluation”, ICVGIP, 2004.40.Y. Rubner, L. J. Guibas and C. Tomasi, “The earth mover’s distance, multidimensional scaling, andcolor-based image retrieval”, Proceedings of DARPA Image understanding Workshop. Pp- 661-668, 1997.41.M. B. Rao, B. P. Rao, and A. Govardhan, “CTDCIRS: Content based Image Retrieval System basedon Dominant Color and Texture Features”, International Journal of Computer Applications, Vol. 18– No.6, pp-0975-8887, 2011.42.J. M. Fuertes, M. Lucena, N. P. D. L Blanca and J. C. Martinez, “A Scheme of Color Image Retrievalfrom Databases”, Pattern Recognition Vol. 22, No. 3, pp- 323-337, 2001.43.Y. K. Chan and C. Y. Chen, “Image retrieval system based on color-complexity and color-spatialfeatures”, The Journal of Systems and Software, Vol. 71, pp-65-70, 2004.44.T. Gevers, Color in image Database, Intelligent Sensory Information Systems, University ofAmsterdam, the Netherlands. 1998.45.X. Wan and C. C. Kuo, “Color distribution analysis and quantization for image retrieval”, In SPIEStorage and Retrieval for Image and Video Databases IV, Vol. SPIE 2670, pp- 9–16. 1996.46.M. W. Ying and Z. HongJiang, “Benchmarking of image feature for content-based retrieval”, IEEE.Pp-253-257, 1998.47.Z. Zhenhua, L. Wenhui and L. Bo, “An Improving Technique of Color Histogram in Segmentation-based Image Retrieval”, 2009 Fifth International Conference on Information Assurance and Security, IEEE, pp-381-384, 2009.。