雅思小作文写作中趋势图的写作结构
- 格式:doc
- 大小:25.50 KB
- 文档页数:4

雅思小作文写作技巧及范文一.图表类型饼状图,直方图或柱形图趋势曲线图表格图流程图或过程图程序图二.解题技巧A. 表格图1 横向比较: 介绍横向各个数据的区别,变化和趋势2 纵向比较:介绍横向各个数据的区别,变化和趋势3 无需将每一个数据分别说明,突出强调数据最大值和最小值,对比时要总结出数据对比最悬殊的和最小的说明:考察例举数字的能力和方法。
注意怎样通过举一些有代表性的数据来有效地说明问题。
B. 曲线图1 极点说明: 对图表当中最高的,最低的点要单独进行说明2 趋势说明: 对图表当中曲线的连续变化进行说明,如上升,下降,波动,持平3 交点说明: 对图表当中多根曲线的交点进行对比说明说明:关键是把握好曲线的走向和趋势,学会 general classification, 即在第二段的开头部分对整个曲线进行一个阶段式的总分类,使写作层次清晰。
接下来在分类描述每个阶段的 specific trend, 同时导入数据作为你分类的依据。
注意不要不做任何说明就机械性的导入数据!可以使用一些比较 native 的单词和短语来描述 trend。
C. 饼状图1 介绍各扇面及总体的关系2 各个扇面之间的比较,同类扇面在不同时间,不同地点的比较3 重点突出特点最明显的扇面:最大的,最小的,互相成倍的D. 柱状图1. 比较 : similarity2.对比 : difference)3.横向总结所有柱状图表的共性特征 & 分别描写各个柱子的个性特征E.流程图1.首先说明:做什么工作的过程,目的是什么 2.准备工作 3.按时间/过程先后描述4.结果 5.简单总结说明:注意流程图里的“因果关系” 或每一流程的“承前启后” 关系;表达每一流程的主体内容,阐明这种关系;揭示其内在联系或规律;最后,给予简要归纳和总结。
F. 实物/器具工作过程 1.实物的名称,功能 2.基本结构 3.工作过程 4.简单总结G. 综合图1 不求甚解,不拘泥于细节2 分门别类,分段落详细介绍各个图表3 不画蛇添足,主观臆断或猜测图表之间的关系三.写作结构框架结构1.开头:该图阐述的是______ 的______.共有以下几个部分组成。
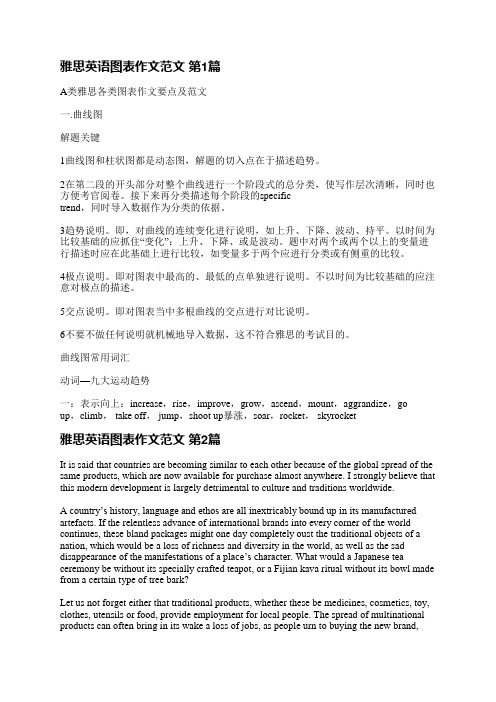
雅思英语图表作文范文第1篇A类雅思各类图表作文要点及范文一.曲线图解题关键1曲线图和柱状图都是动态图,解题的切入点在于描述趋势。
2在第二段的开头部分对整个曲线进行一个阶段式的总分类,使写作层次清晰,同时也方便考官阅卷。
接下来再分类描述每个阶段的specifictrend,同时导入数据作为分类的依据。
3趋势说明。
即,对曲线的连续变化进行说明,如上升、下降、波动、持平。
以时间为比较基础的应抓住“变化”:上升、下降、或是波动。
题中对两个或两个以上的变量进行描述时应在此基础上进行比较,如变量多于两个应进行分类或有侧重的比较。
4极点说明。
即对图表中最高的、最低的点单独进行说明。
不以时间为比较基础的应注意对极点的描述。
5交点说明。
即对图表当中多根曲线的交点进行对比说明。
6不要不做任何说明就机械地导入数据,这不符合雅思的考试目的。
曲线图常用词汇动词—九大运动趋势一:表示向上:increase,rise,improve,grow,ascend,mount,aggrandize,goup,climb, take off, jump,shoot up暴涨,soar,rocket, skyrocket雅思英语图表作文范文第2篇It is said that countries are becoming similar to each other because of the global spread of the same products, which are now available for purchase almost anywhere. I strongly believe that this modern development is largely detrimental to culture and traditions worldwide.A country’s history, language and ethos are all inextricably bound up in its manufactured artefacts. If the relentless advance of international brands into every corner of the world continues, these bland packages might one day completely oust the traditional objects of a nation, which would be a loss of richness and diversity in the world, as well as the sad disappearance of t he manifestations of a place’s character. What would a Japanese tea ceremony be without its specially crafted teapot, or a Fijian kava ritual without its bowl made from a certain type of tree bark?Let us not forget either that traditional products, whether these be medicines, cosmetics, toy, clothes, utensils or food, provide employment for local people. The spread of multinational products can often bring in its wake a loss of jobs, as people urn to buying the new brand,perhaps thinking it more glamorous than the one they are used to. This eventually puts old-school craftspeople out of work.Finally, tourism numbers may also be affected, as travelers become disillusioned with finding every place just the same as the one they visited previously. To see the same products in shops the world over is boring, and does not impel visitors to open their wallets in the same way that trinkets or souvenirs unique to the particular area too.Some may argue that all people are entitled to have access to the same products, but I say that local objects suit local conditions best, and that faceless uniformity worldwide is an unwelcome and dreary prospect.Heres my full answer:The line graphs show the average monthly amount that parents in Britain spent on their children’s s porting activities and the number of British children who took part in three different sports from 2008 to is clear that parents spent more money each year on their children’s participation in sports over the six-year period. In terms of the number of children taking part, football was significantly more popular than athletics and 2008, British parents spent an average of around £20 per month on their children’s sporting activities. Parents’ spending on children’s sports increased gradually over the followi ng six years, and by 2014 the average monthly amount had risen to just over £ at participation numbers, in 2008 approximately 8 million British children played football, while only 2 million children were enrolled in swimming clubs and less than 1 million practised athletics. The figures for football participation remained relatively stable over the following 6 years. By contrast, participation in swimming almost doubled, to nearly 4 million children, and there was a near fivefold increase in the number of children doing athletics.剑桥雅思6test1大作文范文,剑桥雅思6test1大作文task2高分范文+真题答案实感。

雅思写作备考中的图表数据描述与分析方法在雅思写作备考中,图表数据的描述与分析方法是一个关键的技巧。
图表数据描述与分析旨在帮助考生清晰地传达图表中的信息,并展示对数据的深入理解。
本文将介绍一些有效的方法来描述和分析雅思写作中的图表数据。
一、图表数据描述1. 描述整体趋势:首先,我们可以描述图表中呈现的整体趋势。
可以使用类似于“总体来看”、“总体趋势是”等短语来引出描述。
例如,如果图表显示了过去几年某个城市的人口变化情况,可以说“总体来看,该城市的人口在近几年稳定增长”。
2. 细节描述:接下来,我们需要针对图表中的具体数据进行描述。
可以使用具体的数字、比例或百分比等来描述。
例如,如果图表显示了某个国家不同年龄段的人口比例,可以说“18至30岁年龄段的人口占总人口的30%,是各个年龄段中的最高比例”。
3. 时间和地点描述:如果图表中涉及到时间和地点的变化,我们也需要对其进行描述。
可以使用时间词和地点词来具体说明。
例如,如果图表显示了某个地区不同月份的降水量情况,可以说“6月份的降水量最高,为100毫米”。
二、图表数据分析1. 找出关键信息:在分析图表数据时,需要从中挑选出关键的信息。
这些关键信息可能是特殊的数据点、变化的趋势或者与主题相关的数据。
通过找出这些关键信息,可以帮助我们进行更有针对性的分析。
2. 建立对比:图表数据可以提供不同变量之间的比较基础。
在分析时,可以通过对比不同变量的数据来突出差异和相似之处。
例如,如果图表显示了不同国家的能源消耗量,可以对比两个或多个国家之间的差异并分析原因。
3. 确定影响因素:对图表数据进行深入分析时,需要确定可能影响数据变化的因素。
这些因素可能是经济因素、政治因素、社会因素等。
通过分析这些因素与数据的关系,可以深入理解数据的背后含义。
4. 展望未来趋势:在分析图表数据时,考生可以尝试根据已有数据预测未来的趋势。
这要求考生具备一定的推理能力和对数据的深入理解。
通过展望未来,可以增加文章的可读性和独特性。
小作文趋势表达I:上升,下降,波动1-变量+ V (趋势)+ adv + 其它2-变量+ V (experience/undergo/have/see)+ a/some + adj+N (趋势) + 其它3-A/Some +adj+ N (趋势) + V (occur/can be observed)+ in + 变量+ 其它4-There be a/some +adj+ N (趋势) + in + 变量+ 其它5-时间/地点+ V (see / witness)+ a/some +adj+ N (趋势) + in + 变量+ 其它II:平稳1,变量+ V (stay/remain)+ adj. (unchanged /stable/constant) + at + 数据+ 其它。
2,变量+ V (experience/undergo/see/have)+ no/little + change + 其它。
3,No/Little change + V (occur/can be observed ) + in + 变量+ 其它。
4,There be + no/little + change + in + 变量+其它。
III:趋势中最高值,最低值1-变量+ V (reach/hit)+ a/the + peak/summit/highest point + of/at + 最高值2-变量+ peak at + 最高值3-变量+ V (reach/hit)+ a/the + bottom/lowest point + of/at + 最低值4-变量+ bottom out + at + 最低值IV:带有波动趋势句+ with + N (波动)表示百分比的句子公式:部分量+ V 占据+ 百分比数据+ of + 总量The percentage/ proportion of + 部分量+ BE + 百分比数据The percentage/proportion of 部分量A + BE + bigger than that of 部分量B (, with the difference of XXX%)部分量A + V 占据+ a bigger percentage/proportion than 部分量B (, with the difference of XXX%).The percentage/proportion of 部分量+ BE + the biggest of all, at 百分比数据.部分量+ V 占据+ the biggest percentage / proportion of 百分比数据.V= account for,make up,take up,constitute,claim,report,represent,stand atAdj= big, large, great, highsmall, lowWhen you are old and grey and full of sleep, And nodding by the fire, take down this book, And slowly read, and dream of the soft look Your eyes had once, and of their shadows deep; How many loved your moments of glad grace, And loved your beauty with love false or true, But one man loved the pilgrim soul in you,And loved the sorrows of your changing face; And bending down beside the glowing bars, Murmur, a little sadly, how love fledAnd paced upon the mountains overheadAnd hid his face amid a crowd of stars.The furthest distance in the worldIs not between life and deathBut when I stand in front of youYet you don't know thatI love you.The furthest distance in the worldIs not when I stand in front of youYet you can't see my loveBut when undoubtedly knowing the love from bothYet cannot be together.The furthest distance in the worldIs not being apart while being in loveBut when I plainly cannot resist the yearningYet pretending you have never been in my heart.The furthest distance in the worldIs not struggling against the tidesBut using one's indifferent heartTo dig an uncrossable riverFor the one who loves you.倚窗远眺,目光目光尽处必有一座山,那影影绰绰的黛绿色的影,是春天的颜色。

雅思A类写作TASK 1第一讲折线图与趋势折线图和部分柱状图、饼状图以及表格通常用来显示某一段时间内事物的变化情况以及变化趋势,因此首先我们要先学习如何描述趋势变化。
总体来讲,趋势描写:(1)要总结事物变化的总体趋势;(2)要叙述事物某个时间段内的变化情况。
描写趋势六要素要素含义与难点例子事物要素指的是线条所代表的事物,常由名词、词组或代词体现Tourists, food方向要素上升/增加;下降/减少;保持平稳;反复波动;到达顶点;到达低谷(最基本的六种)Increase, decrease程度要素急剧地/突然地轻微的/逐渐的(主要有两类)Slightly,slowly数据要素难点为数据前所加介词的用法to,by,from...to..,between....and.. . From 50 miles to 200 miles时间要素难点为时间前所加介词的用法:in, on, at,from..to.., during, between..and...In January, at 6.00am连接要素句子间运用对比、比较、递进、增补、时间等连接手段Whereas, whenExample:The graph shows the sales of laptops in a company in 2010.趋势描写常用的词汇Peaked at A peak of FluctuatedaroundA fluctuation around Stood at Plateaued at Reached a plateau at剧烈的dramatically dramatic substantially substantial surprisingly surprising noticeably noticeable strikingly Striking considerably considerable remarkable remarkable obviously obvious enormously enormous significantly significant轻微的moderately moderate gradually gradual slightly Slight slowly slow steadily Steady minimally small最高点Arrived at a climax Reached a maximum number/amount ofHit a peak/peak at Soared/rocketed to a highest point of最低点Hit a historic low Touched/reached the bottom ofHit a trough Reached a lowest point of Exercise 1:1.There was an_______in the number of machines sold in 2012.2.The number of machines sold_________in 2012.3.The number of machines sold________steadily in 2012.4.2012 saw a steady ________in the number of machines sold.5.The number of machines sold_______in 2012.6.There was an obviously ________trend in the number of machines sold in 2012.7.The number of machines sold was_____________(on the .....) on the way up/on the up/on the riseExercise 2: Follow the pattern of Exercise 1 finish 7 sentences describing the chart below.1.__________________________________________________ ___________________________________________________2.__________________________________________________ ___________________________________________________3.__________________________________________________ ___________________________________________________4.__________________________________________________ ___________________________________________________5.__________________________________________________ ___________________________________________________6.__________________________________________________ ___________________________________________________7.__________________________________________________ ___________________________________________________●引入段的写法图表作文第一段要写的成功需要牢记以下几点:➢概括介绍图表的所有要素:图表类型、研究对象、数据形式、地区和时间等。

雅思小作文 T A S K 1 图表题规律注意事项:1 . Task1 是客观写作,要求客观真实。
2 . 客观性:不应该有任何图里没有而靠自己主观想象加入的成分。
结尾段针对图形做出的总结性结论也应该是根据图表的实际内容做出的符合逻辑的总结。
准确性:图表里面的数据介绍要力求精确,不能抄错数字。
但当一个特征点没有落在一个准确的坐标值上时,允许进行合理的目测或估计一个大概数值。
详尽性:要有层次感,并不需要把所有的数字都推到文章里。
3 . 类型Table 表格题Line Graph 线图Bar Chart 柱状图Pie Chart 饼状图Process Chart 流程图4 . 看图要注意单位,标题和图例。
5 . 对于多数小作文题,题中给出了几个图就对应的写出几个主体段。
题目里只给出一个图,根据图中包含几类图形元素写几个主体段。
图中只给了一个图,但图中所含图形元素很多,则分类。
题目中出现多线多柱多饼,用“对应提取法“,把每组里的对应元素提出来组织主体段。
6 . 时态和发生时间意义对应。
陈述永恒事实的句型,其主句的谓语动词必定用一般现在时。
若题目里没有出现时间,则全文都使用一般现在时。
7 . 结构开头段(1~2句)改写原题主体段1 总体概括具体介绍数字主体段N 总体概括具体介绍数字结尾段(1~2句)介绍总数(若图里并没有明确的给出总数,则省略)结论(根据图里的数据得出有一定合理性的结论)8 . 开头段的改写题目中ShowProportion InformationThe number/amount of FamilyMalesFemaleInfluence改写成illustrate /compare percentagedatathe figure for householdmenwomenaffect/effectCategories kinds/typesSubway system Storeunderground railway/train system shop9 . 介绍数据或描述变化趋势的常用词。
英语趋势图作文模板英文回答:Line Graph Writing Template。
Introduction。
Begin by paraphrasing the topic in your own words.Identify the trend and its direction (increasing, decreasing, stable).State the time frame and source of the data.Body Paragraphs。
Paragraph 1:Describe the overall trend and any significant changes.Provide specific data points to support your observations.Explain the factors that may have contributed to the trend.Paragraph 2 (optional):Discuss any additional notable features of the graph.Compare different time periods or categories within the data.Identify any potential limitations or implications of the data.Conclusion。
Summarize the main findings and restate the trend.Predict potential future developments or implications based on the data.Example Template:Introduction:The line graph provided depicts the global consumption of coffee over the past decade, based on data collected by the International Coffee Organization. The graph shows a steady increase in coffee consumption over the ten-year period.Body Paragraph 1:Overall, global coffee consumption has increased by 25% from 2010 to 2020. In 2010, the world consumed approximately 9 million metric tons of coffee, which increased to almost 11.25 million metric tons in 2020. This growth in consumption is driven by factors such as rising demand in emerging markets and increased popularity of specialty coffee.Body Paragraph 2:Notably, the increase in coffee consumption has been more pronounced in Asia and Eastern Europe. In 2010, Asia accounted for 30% of global coffee consumption, but this Anteil has risen to 35% in 2020. Similarly, Eastern Europe's consumption Anteil has grown from 15% to 18% over the same period. This suggests that the growth in coffee consumption is being driven by new markets rather than established coffee-consuming regions.Conclusion:Based on the data presented, it is evident that global coffee consumption has been steadily increasing over the past decade. Factors such as rising demand in emerging markets and increased popularity of specialty coffee have contributed to this trend. As the demand for coffee continues to grow, it is likely that global consumption will continue to rise in the years to come.中文回答:折线图写作模板。
雅思写作图表描述在雅思写作任务1中,经常会出现关于图表描述的题目。
图表描述是考察考生对数据的理解和组织能力,同时也要求考生能够准确地用英文词汇和语法进行描述和分析。
本文将介绍如何写一篇清晰、准确的雅思写作图表描述。
一、引言段在引言段,我们需要简要介绍图表所展示的数据内容。
我们可以涵盖以下几个方面: - 简单描述图表类型:如线形图、柱状图、饼状图等。
- 图表展现的主题:如能源消耗、人口增长、教育水平等。
- 时间和地点范围:如1990年至2020年、全球、某个国家等。
段落一:总体概述在第一个段落,我们需要给出整个图表数据的总体描述和比较。
我们可以使用以下结构进行描述:- 展示数据的总体趋势和变化:如上升、下降、保持稳定等。
- 用具体的数据支持总体概述的观点:如数据增长了百分之几、达到了多少等。
- 对比不同的数据:如不同类别之间的比较、不同时间段的比较等。
段落二:细节描述在第二个段落,我们需要更具体地描述图表中的数据细节。
我们可以运用以下组织结构来实现:- 描述数据中的每个细节:以从最高到最低的顺序逐个描述每个数据点。
- 使用具体的数字和百分比来支持描述:如“从10%上升到了20%”、“增长了50%”等。
- 引入相关的词汇或表达来进行准确的描述:如“达到峰值”、“有显著的下降”等。
段落三:总结观点在第三个段落,我们需要总结我们在前面段落中得出的观点和结论。
我们可以运用以下结构进行总结:- 概括整篇图表描述的主要内容:简要回顾我们在前面段落中的描述。
- 强调图表中的关键点:如最高点、最低点、显著的变化等。
- 提供对于数据可能存在的原因和影响的解释:如政策变化、经济发展等。
段落四:个人观点(可选)在最后一个段落,我们可以根据需要提出个人观点。
这一段主要用于表达个人意见和看法,可以更自由地阐述个人观点,并且提供支持观点的例子。
通过以上的组织结构和写作技巧,我们可以编写出一篇清晰、准确的雅思写作图表描述。
在实际写作过程中,我们要避免重复使用相同的表达和词汇,要注重句型的变化和对比的描述。
雅思小作文写作中趋势图的写作结构
雅思小作文写作中趋势图的写作结构为你带来在雅思A类的小作文当中,一种最为常见的图表------趋势图,也就是我们所说的曲线图的写作结构和审题的注意点。
曲线图是图表当中用来表示数据变化的最常用的图表。
对于这种以数据变化为描写点的图表,我们应该怎样在作文中将数据的变化清楚地表达出来呢?请看下文。
雅思图表作文通常涉及几种题型,即曲线图、柱状图、饼状图、文字图表以及流程图。
在这几种题型中,以曲线图考的频率为最高。
加之曲线图可以理解为任何其他一种图形的原型,对于曲线图写作的把握对于考生来说尤为重要。
曲线图式主要以横轴、纵轴为主要指标(一般横轴表示时间,纵轴表示数值),以曲线的形式来表达图中所描述对象(一般不止一个)在不同的时间所对应指标的变化。
描写图表信息中,第一个步骤是审题。
审题过程中,重要的是要看清楚题目要求我们所描写的主题对象是什么,即subject,描述的时间范围(对应文章时态的选择)以及描述的信息单位,即time and unit。
这些信息的捕捉的正确与否直接影响到文章是否切题。
在审题结束,开始写作时所要遵循的基本原则是根据曲线数量来决定段落数量。
主体段落描述过程中要注意几个方面:
一、是否有具体数值的描述。
小作文所要达到的最终目的应为读文章的人看完文章后可以了解大致图形的概况,所以如果没了具体的数值,描述也就失去了意义。
另外,描述数值不可忽视数值的单位。
二、描述图形所运用的词汇。
曲线图的走势一般分为上升、下降、波动、持平四中,而每种走势都可以用不同的词汇进行表达。
如:描述上升可以用increase, go up, climb, 下降可用decrease, go down, drop,持平的表达可以用level out, remain stable等等。
对于同一走势的不同程度,我们也应用相应的词汇加以区别。
如:急剧下降可说成decrease drastically,缓慢上升increase gradually。
对于考生来说,运用多种词汇来表达曲线的走势对于小作文拿高分意义相当重大。
三、文章中出现的句式。
在小作文评分中,句子结构是重要考察项。
中国考生往往因为母语的影响,对运用不同句式作文掌握还有所欠缺。
特别是在描写曲线时,很多曲线在不同阶段有相似的走势,在描述的过程中,更加应该注意尽量避免同种句式频繁出现。
如要表示男性人均收入在1月到3月中上升很快,我们可以说:Average income for male workers in Australia increased greatly from January to March in 2001. 也可以用名词来表示:There was a great increase for average income for male workers from January to March in 2001。
类似的表达还有很多,考生们可
以在备考的过程中加以总结归纳。
主体段落写完,最后就剩下总结工作了。
文章的结尾段一般的不会有很多新信息的出现,主要目的是将主体段落中所描述的信息加以总结,也可以将不同的描述对象的趋势进行大致的比较。
描述雅思考试中的趋势图(曲线图)的4种方法
一. 雅思小作文线图趋势描述方法一
以对象为主语
1.1对象+趋势v
1.2对象+经历+趋势n
二. 雅思小作文线图趋势描述方法二
以there be为主语
2.there be +趋势+in 对象
三. 雅思小作文线图趋势描述方法三
以趋势做主语
3.1趋势+被看到+in对象
3.2 趋势+发生+in 对象
3.3趋势+in对象+be+乐观/糟糕
四. 雅思小作文线图趋势描述方法四
以时间为主的主语
4.时间+witness +趋势+in 对象
以上就是雅思小作文写作中趋势图的写作结构的内容。
我们
可以看出在小作文的写作中,审题是一个非常重要的步骤。
在审题时,我们要审什么?一个是图表类型,一个是图表的极值和走势趋向。
对于趋势图这种图形,我们更应该重视数据的趋势,在写作当中多描述数据的走向和到达的极值。
如果是几组数据进行对比,我们还应该注意描述它们的不同。