外文翻译--资本结构影响因素的分析研究
- 格式:docx
- 大小:21.75 KB
- 文档页数:7
资本结构外文文献翻译外文资料翻译—英文原文How Important is Financial Risk?IntroductionThe financial crisis of 2008 has brought significant attention tothe effects of financial leverage. There is no doubt that the highlevels of debt financing by financial institutions and households significantly contributed to the crisis. Indeed, evidence indicates that excessive leverage orchestrated by major global banks (e.g., through the mortgage lending and collateralized debt obligations) and the so-called “shadowbanking system” may be the underlying cause of the recent economic and financialdislocation. Less obvious is the role of financial leverage among nonfinancial firms. To date, problems in the U.S. non-financial sector have been minor compared to the distress in the financial sector despite the seizing of capital markets during the crisis. For example, non-financial bankruptcies have been limited given that the economic decline is the largest since the great depression of the 1930s. In fact, bankruptcy filings of non-financial firms have occurred mostly in U.S. industries (e.g., automotive manufacturing, newspapers, and real estate) that faced fundamental economic pressures prior to the financial crisis.This surprising fact begs the question, “How important is financialrisk for non-financial firms?” At the heart of this issue is the uncertainty about the determinants of total firm risk as well as components of firm risk.StudyRecent academic research in both asset pricing and corporate finance has rekindled an interest in analyzing equity price risk. A current strand of the asset pricing literature examines the finding of Campbell et al. (2001) that firm-specific (idiosyncratic) risk has tended to increase over the last 40 years. Other work suggests that idiosyncratic risk may be a priced risk factor (see Goyal and Santa-Clara, 2003, among others). Also related to these studies is work by Pástor and Veronesi (2003) showing how investor uncertainty about firm profitability is an important determinant of idiosyncratic risk and firm value. Other research has examined the role of equity volatility in bond pricing (e.g., Dichev, 1998, Campbell, Hilscher, and Szilagyi, 2008).However, much of the empirical work examining equity price risktakes the risk of assets as given or tries to explain the trend in idiosyncratic risk. In contrast, this外文资料翻译—英文原文paper takes a different tack in the investigation of equity price risk. First, we seek to understand the determinants of equity price risk at the firm level by considering total risk as the product of risks inherent in the firms operations (i.e., economic or business risks) andrisks associated with financing the firms operations (i.e., financial risks). Second, we attempt to assess the relative importance of economic and financial risks and the implications for financial policy.Early research by Modigliani and Miller (1958) suggests thatfinancial policy may be largely irrelevant for firm value because investors can replicate many financial decisions by the firm at a low cost (i.e., via homemade leverage) and well-functioningcapital markets should be able to distinguish between financial and economic distress. Nonetheless, financial policies, such as adding debt to the capital structure, can magnify the risk of equity. In contrast, recent research on corporate risk management suggests that firms mayalso be able to reduce risks and increase value with financial policies such as hedging with financial derivatives. However, this research is often motivated by substantial deadweight costs associated withfinancial distress or other market imperfections associated withfinancial leverage. Empirical research provides conflicting accounts of how costly financial distress can be for a typical publicly traded firm.We attempt to directly address the roles of economic and financialrisk by examining determinants of total firm risk. In our analysis we utilize a large sample of non-financial firms in the United States. Our goal of identifying the most important determinants of equity price risk (volatility) relies on viewing financial policy as transforming asset volatility into equity volatility via financial leverage. Thus, throughout the paper, we consider financial leverage as the wedgebetween asset volatility and equity volatility. For example, in a static setting, debt provides financial leverage that magnifies operating cash flow volatility. Because financial policy is determined by owners (and managers), we are careful to examine the effects of firms? asset and operating characteristics on financial policy. Specifically, we examine a variety of characteristics suggested by previous research and, as clearly as possible, distinguish between those associated with the operations of the company (i.e. factors determining economic risk) and those associated with financing the firm (i.e. factors determining financial risk). We then allow economic risk to be a determinant of financial policy in the structural framework of Leland and Toft (1996), or alternatively,外文资料翻译—英文原文in a reduced form model of financial leverage. An advantage of the structural model approach is that we are able to account for both the possibility of financial and operating implications of some factors (e.g., dividends), as well as the endogenous nature of the bankruptcy decision and financial policy in general.Our proxy for firm risk is the volatility of common stock returns derived from calculating the standard deviation of daily equity returns. Our proxies for economic risk are designed to capture the essential characteristics of the firms? operations andassets that determine the cash flow generating process for the firm. For example, firm size and age provide measures of line of- businessmaturity; tangible assets (plant, property, and equipment) serve as ap roxy for the …hardness? of a firm?s assets;capital expenditures measure capital intensity as well as growth potential. Operating profitability and operating profit volatility serve as measures of the timeliness and riskiness of cash flows. To understand how financial factors affect firm risk, we examine total debt, debt maturity, dividend payouts, and holdings of cash and short-term investments.The primary result of our analysis is surprising: factorsdetermining economic risk for a typical company explain the vastmajority of the variation in equity volatility.Correspondingly, measures of implied financial leverage are much lower than observed debt ratios. Specifically, in our sample covering 1964-2008 average actual net financial (market) leverage is about 1.50 compared to our estimates of between 1.03 and 1.11 (depending on model specification and estimation technique). This suggests that firms may undertake other financial policies to manage financial risk and thus lower effective leverage to nearly negligible levels. These policies might include dynamically adjusting financial variables such as debt levels, debt maturity, or cash holdings (see, for example, Acharya, Almeida, and Campello, 2007). In addition, many firms also utilize explicit financial risk management techniques such as the use of financial derivatives, contractual arrangements with investors (e.g. lines of credit, call provisions in debt contracts, or contingencies insupplier contracts), special purpose vehicles (SPVs), or other alternative risk transfer techniques.The effects of our economic risk factors on equity volatility are generally highly statistically significant, with predicted signs. In addition, the magnitudes of the effects are substantial. We find that volatility of equity decreases with the size and age of the firm. Thisis intuitive since large and mature firms typically have more stable lines of英文原文外文资料翻译—business, which should be reflected in the volatility of equity returns. Equity volatility tends to decrease with capital expenditures though the effect is weak. Consistent with the predictions of Pástor and Veronesi (2003), we find that firms with higher profitability and lower profit volatility have lower equity volatility. This suggests that companies with higher and more stable operating cash flows are less likely to go bankrupt, and therefore are potentially less risky. Among economic risk variables, the effects of firm size, profit volatility, and dividend policy on equity volatility stand out. Unlike some previous studies, our careful treatment of the endogeneity of financial policy confirms that leverage increases total firm risk. Otherwise, financial risk factors are not reliably related to total risk.Given the large literature on financial policy, it is no surprise that financial variables are,at least in part, determined by the economic risks firms take. However, some of the specific findings areunexpected. For example, in a simple model of capital structure, dividend payouts should increase financial leverage since they represent an outflow of cash from the firm (i.e., increase net debt). We find that dividends are associated with lower risk. This suggests that paying dividends is not as much a product of financial policy as a characteristic of a firm?s operations (e.g., a maturecompany with limited growth opportunities). We also estimate how sensitivities to different risk factors have changed over time. Our results indicate that most relations are fairly stable. One exception is firm age which prior to 1983 tends to be positively related to risk and has since been consistently negatively related to risk. This is related to findings by Brown and Kapadia (2007) that recent trends in idiosyncratic risk are related to stock listings by younger and riskier firms.Perhaps the most interesting result from our analysis is that our measures of implied financial leverage have declined over the last 30 years at the same time that measures of equity price risk (such as idiosyncratic risk) appear to have been increasing. In fact, measures of implied financial leverage from our structural model settle near 1.0 (i.e., no leverage) by the end of our sample. There are several possible reasons for this. First, total debt ratios for non-financial firms have declined steadily over the last 30 years, so our measure of implied leverage should also decline. Second, firms have significantly increased cash holdings, so measures of net debt (debtminus cash and short-term investments) have also declined. Third, the composition of publicly traded firms has changed with more risky (especially technology-oriented)英文原文外文资料翻译—firms becoming publicly listed. These firms tend to have less debtin their capital structure. Fourth, as mentioned above, firms can undertake a variety of financial risk management activities. To the extent that these activities have increased over the last few decades, firms will have become less exposed to financial risk factors.We conduct some additional tests to provide a reality check of our results. First, we repeat our analysis with a reduced form model that imposes minimum structural rigidity on our estimation and find very similar results. This indicates that our results are unlikely to be driven by model misspecification. We also compare our results with trends in aggregate debt levels for all U.S. non-financial firms andfind evidence consistent with our conclusions. Finally, we look at characteristics of publicly traded non-financial firms that file for bankruptcy around the last three recessions and find evidence suggesting that these firms are increasingly being affected by economic distress as opposed to financial distress.ConclusionIn short, our results suggest that, as a practical matter, residual financial risk is now relatively unimportant for the typical U.S. firm. This raises questions about the level of expected financial distresscosts since the probability of financial distress is likely to be lower than commonly thought for most companies. For example, our results suggest that estimates of the level of systematic risk in bond pricing may be biased if they do not take into account the trend in implied financial leverage (e.g., Dichev, 1998). Our results also bring into question the appropriateness of financial models used to estimatedefault probabilities, since financial policies that may be difficult to observe appear to significantly reduce risk. Lastly, our results imply that the fundamental risks born by shareholders are primarily related to underlying economic risks which should lead to a relatively efficient allocation of capital.Some readers may be tempted to interpret our results as indicating that financial risk does not matter. This is not the proper interpretation. Instead, our results suggest that firms are able to manage financial risk so that the resulting exposure to shareholders is low compared to economic risks. Of course, financial risk is important to firms that choose to take on such risks either through high debt levels or a lack of risk management. In contrast, our study suggeststhat the typical non-financial firm chooses not to take these risks. In short, gross financial risk may be important, but firms can manage it. This contrasts with fundamental economic and business risks that 外文资料翻译—英文原文are more difficult (or undesirable) to hedge because they represent the mechanism by which the firm earns economic profits.References[1]Shyam,Sunder.Theory Accounting and Control[J].An Innternational Theory on PublishingComPany.2005[2]Ogryezak,W,Ruszeznski,A. Rom Stomchastic Dominance to Mean-Risk Models:Semide-Viations as Risk Measures[J].European Journal of Operational Research.[3] Borowski, D.M., and P.J. Elmer. An Expert System Approach to Financial Analysis: the Case of S&L Bankruptcy [J].Financial Management, Autumn.2004;[4] Casey, C.and N. Bartczak. Using Operating Cash Flow Data to Predict Financial Distress: Some Extensions[J]. Journal of Accounting Research,Spring.2005;[5] John M.Mulvey,HafizeGErkan.Applying CVaR for decentralized risk management of financialcompanies[J].Journal of Banking&Finanee.2006;[6] Altman. Credit Rating:Methodologies,Rationale and DefaultRisk[M](RiskBooks,London.译文:财务风险的重要性引言2008年的金融危机对金融杠杆的作用产生重大影响。
资本结构决定因素以中国企业为案例【外文翻译】XXX titled "XXX Structure: Evidence from XXX's n-making process in regards to their capital structure。
The article XXX: the "pecking order" theory and the "trade-off" theory.XXX external sources。
XXX。
This is due to the XXX seeks external XXX that a financial manager will first use internal capital。
then issue debt。
and only as a last resort。
XXX。
This is because the market may perceive the issuance of equity as a signal of poor XXX.2.2 The trade-off XXXIn contrast。
the XXX and potential financial distress costsare low。
XXX and financial distress costs are high.Overall。
XXX's n-making process in regards to their capital structure。
By examining the pecking order and trade-off theories。
the article sheds light on the complex nature of this XXX inform future research in this area.XXX。
![资本结构的决定因素研究:基于土耳其房屋租赁公司[文献翻译]](https://uimg.taocdn.com/a7683f91c1c708a1284a4451.webp)
lodging companies出处:International Journal of Contemporary Hospitality Management 作者:Erdinc Karadeniz, Serkan Yilmaz Kandir, Mehmet Balcilar andYildirim Beyazit Onal原文Determinants of capital structure:evidence from Turkish lodging companiesBy Erdinc Karadeniz, Serkan Yilmaz Kandir, Mehmet Balcilar and Yildirim BeyazitOnalIntroductionCap ital structure refers to the composition of a firm’s liabilities and owners’ equity. Capital structure decisions are related to the magnitudes of liabilities and owners’equity. Capital structure decisions are one of the three financing decisions –investment, financing, and dividend decisions – finance managers have to make (Van Horne and Wachowicz, 1995).Capital structure of a firm determines the weighted average cost of capital (WACC).WACC is the minimum rate of return required on a firm’s investments an d used as the discount rate in determining the value of a firm. A firm can create value for its shareholders as long as earnings exceed the costs of investments (Damodaran, 2000).A number of theoretical and empirical studies investigated the optimal capital structure of a firm. These studies pointed out the importance of the relationships among capital structure, cost of capital, capital budgeting decisions, and firm value.Lodging companies are capital intensive, as they require huge capital at both investment and operating stages. Since assets of lodging companies mostly consist of fixed assets share of long-term debt and owners’ equity becomes rather high. Furthermore, because of the structure of the industry, lodging companies are highly sensitive to systematic risks. Therefore, lodging companies face high operating andfinancial risks (Andrew and Schmidgall, 1993). All these make it important to determine the composition of capital structure and the factors affecting leverage decisions and debt ratio.The trade-off and pecking order theoriesThe relationship between capital structure decisions and firm value has been extensively investigated in the past few decades. Over the years, alternative capital structure theories have been developed in order to determine the factors that affect capital structure decisions. Modigliani and Miller (1958) is a milestone among capital structure studies. In their first proposition, Modigliani and Miller (1958) state that market is fully efficient when there are no taxes. Thus, capital structure and financing decisions affect neither cost of capital nor market value of a firm. In their second proposition, they maintain that interest payments of debt decrease the tax base, thus cost of debt is less than the cost of equity. The tax advantage of debt motivates the optimal capital structure theory, which implies that firms may attain optimal capital structure and increase firm value by altering their capital structures. Bankruptcy and financial distress costs (Myers, 1977) and agency costs (Jensen and Meckling, 1976) constitute the basics of trade-off theory. Trade-off theory asserts that firms set a target debt to value ratio and gradually move towards it. According to this theory, any increase in the level of debt causes an increase in bankruptcy, financial distress and agency costs, and hence decreases firm value. Thus, an optimal capital structure may be reached by establishing equilibrium between advantages (tax advantages) and disadvantages (financial distress and bankruptcy costs) of debt. In order to establish this equilibrium firms should seek debt levels at which the costs of possible financial distress offset the tax advantages of additional debt.Data and methodologyWe investigate the determinants of capital structure decisions of lodging companies using a panel data on five companies traded in the ISE. Although there are eight lodging companies traded in the ISE, there of these companies are excluded from the study since these are traded only after 2000 and including would substantially reduce the number of observations. The sample period of the data set spans the period1994-2006. There are totally 65 observations and all data are expressed in local currency (Turkish lira). We specify a dynamic fixed effects panel data model to investigate the factors that affect the capital structure of lodging companies. Various estimation techniques, including the Arellano-Bond System GMM method, are used for the estimation. In the theoretical model specified to test the capital structure decisions of the lodging companies in Turkey the dependent variable is specified as the debt ratio. The debt ratio is defined as the book value of liabilities divided by the book value of total assets. This variable measures the share of liabilities in total assets of a company and is widely used in capital structure studies. Explanatory variables are specified as follows:. growth opportunities defined as the market value divided by the book value of the firm, often referred as market-to-book ratio;. share of fixed assets (tangibility) defined as the net fixed tangible assets divided by total assets;. effective tax rates defined as the corporate tax divided by taxable income;. non-debt tax shields defined as the depreciation divided by total assets;. firm size defined as the net sales adjusted by the inflation rate, where the inflation rate is computed as the annual percentage change in the wholesale price index;. profitability (return on assets-ROA) calculated by dividing net profit by total assets; . free cash flows computed by adding interest payments and depreciation to earnings before taxes;. net commercial trade position (inter-enterprise debt) defined as the difference between commercial receivables and liabilities divided by total assets.Empirical findingsIn this section, we present the various estimation results and discuss the implications of the empirical findings. The specification of the debt ratio equation introduces correlation between the errors and the lagged first-differenced endogenous variable. This correlation is handled using instrumental variables (IVs). Anderson and Hsiao (1982) proposed using lagged past differences or levels of endogenous variables as instruments (Anderson-Hsiao IV approach). These IVs are proposedwithin the framework of the GMM, since they may not be highly correlated with the first-differenced dependent variable. Alternatively, Arellano and Bond (1991) suggested that first differences of the endogenous variable be instrumented with lags of its own levels. This is known as the Arellano-Bond GMM approach. Blundell and Bond (1998) pointed out that lagged levels are often poor instruments for first differences. They proposed using all information on both endogenous and exogenous variables. This is known as the Arellano and Bond system (Arellano-Bond System GMM approach) method and provides more efficient and unbiased estimates in small Samples。
中文3160字1 外文翻译原文Capital structure influencing factor analysis research Material Source:Theory of Optimal Capital StructureAuthor : R. BareaSince the Modigliani and Miller (1958) since the academic structure of the capital a large number of theoretical and empirical research, trying to identify the potential impact of capital structure choice factors. A lot of literature suggests that the choice of capital structure by the asset structure, firm size, non-debt tax shields, growth, volatility, product uniqueness, profitability and other firm characteristics factors. In addition, the choice of capital structure is also affected by industry characteristics, macroeconomic and institutional environment factors. Harris and Raviv (1991) from the experience of many U.S. companies to sum up: "leverage ratio of fixed assets, non-debt tax shields, growth and company size increases, with the volatility, advertising costs, bankruptcy the possibility of profitability and product uniqueness increases less. "Chinese listed companies due to the particularity of the system, what factors determine the choice of capital structure? Characteristics of institutional factors influenced how the company capital structure choice? Experiences and things like that to be the model and empirical test. In recent years, researchers began to affect the capital structure of listed companies in an empirical study of factors, such as Lu Zhengfei, and Xin Yu (1998), Lishan Min and Su Yun (1999), Xiaozuo Ping and Wu Shinong (2002), and achieved certain results, However, most studies are using a simple regression technique factors on capital structure for empirical analysis. Titman and Wessels (1988) pointed out the shortcomings of this approach: First, there is no wish to measure the sole representative of the property; Second, it is difficult to find and other relevant property is not related to the measurement of a particular property; third, As can be observed variable is not perfectly representative of its properties should be measured, they are used in the regression analysis will lead to errors in variable problem; fourth, the agent variables and measurement error 2 may be explained by variables related to measurement error will produce false (Spurious) related. In this paper, two-stage multiple procedures, application of factor analysis-based model to reduce measurement error, to expand the capital structure of Chinese listed companies Empirical Study.Capital StructureTo build the empirical model, the author according to the capital structure theory and relevant empirical research on factors affecting capital structure analysis, and gives a proxy variable to capture these factors.I, the asset structure Agency theory, balance theory and the theory of asymmetric information are considered assets for capital structure choice. According to agency theory, high-leverage the company's shareholders tend to sub-optimal investment (Jensen and Meckling, 1976; Myers, 1977). The assets of the company secured an opportunity to limit such behavior. Therefore, the value of assets and leverage are related to security. Another problem comes from a proxy service managers tend to consumption. Assets can be secured with fewer companies more vulnerable to such agency costs, because these companies on the capital expenditure monitoring more difficult (Grossman and Hart, 1982). Companies can increase the level of debt as a monitoring tool to mitigate this problem. Therefore, security assets and leverage can be negative. Theory from the balance with debt secured creditors to reduce the potential loss of the debtor's insolvency and, therefore, limit the amount of shareholder wealth, occupation of the debtor. Meanwhile, in bankruptcy the value of tangible assets higher than the value of intangible assets. Therefore, the value of assets and leverage are related to security. Under asymmetric information theory, tangible assets, more businesses will face less information asymmetry, therefore, should issue equity rather than debt. And the existence of asymmetric information, to the sale of secured debt had a negative because it reduces information premium. For asset structure, we use stock / total assets (INV) and fixed assets / total assets (FIX) two proxy variables.II, firm size Many studies suggest that large companies tend to diversify, with more stable cash flow, so low probability of bankruptcy. Warner (1997), Angclua and Meconnel (1982) study found that direct costs of financial distress and negatively related to firm size. Fama and Jensen (1983) that large corporations to smaller companies tend to provide more information on lenders. Therefore, less monitoring costs of large 3 companies, large companies than small companies with high borrowing capacity. Therefore, firm size should be positively correlated with leverage. And Rajan and Zingales (1995) that the large companies than small companies tend to provide more information to the public, may be related to internal investment company size and level of external investment in human negative correlation of asymmetric information. Under asymmetric information theory, large companies should be inclined to equity financing and therefore havelower leverage. The size of the company, we use the natural logarithm of total assets (LN (TA)) and the main business income of the natural logarithm (LN (S)) of two proxy variables.III, the tax That the use of tax-based model of the main benefits of debt financing is tax credits. According to tax-based theory, companies with higher marginal tax rates should use more debt to get the tax shield benefits. Therefore, the effective marginal tax rates should be positively correlated with leverage. Unable to obtain relevant data to calculate the marginal tax rate, we use the average tax rate (TAX) to analyze the tax impact of capital structure choice.IV, non-debt tax shield DeAngelo and Masulis (1980) that non-debt tax shield can be used as an alternative to debt financing, tax benefits, the same as in other cases, the non-debt tax shields have more companies should use less debt. Barton et al (1989), Prowse (1990), Wald (1999), Kim and Sorensen (1986) research shows that non-debt tax shields and leverage negative. In this paper, depreciation / total assets as non-debt tax shield (DEP) of the proxy variables.V. Growth According to agency theory, equity-controlled companies tend to sub-optimal investment will be deprived of their wealth came from the hands of creditors. For high growth companies, because of its future investment opportunities in the choice of greater flexibility, these companies may be more serious agency problems. Myers (1977) that high growth companies lower the future investment in growth companies have more options. If the high-growth companies need external equity financing options to implement in the future, then the company has a large debt may give up this opportunity, because such investment will transfer wealth from shareholders to creditors of the body, which produces the problem of insufficient investment. Therefore, growth should be negatively correlated with leverage. For growth, this growth rate with total assets (GRTA) and the equity value-added rate (GREQ) two 4 proxy variables.VI, volatility Regular payment of debt obligations involved, the highly leveraged company is more vulnerable to financial distress costs. Finance theory suggests that the risk of the company or bankrupt companies should not have a high probability of higher leverage. Therefore, the main business income volatility or commercial risk as the possibility of occurrence of financial distress proxy variables, which should be negatively correlated with leverage. Bradley et al (1984), Titman and Wesssels (1988), Wald (1999) and Booth et al (2001) and other studies have shown that volatility negatively correlated with leverage. In this paper, the main business of the standards slip ((VOL) as a proxy for volatility.VII ability to generate internal resources Trade-off theory is that ability to generate internal resources to leverage a positive correlation, because a strong ability to generate internal resources, companies choose higher leverage to get more debt tax shield. Jensen (1986) pointed out that instead of borrowing to pay dividends to ensure that the management discipline empire method. The benefits of debt "can improve the efficiency of managers and their organizations", which act as a "control effect" role. Therefore, the company has a large free cash flow should have higher debt to limit management's discretion. According to the Theory of Optimal Financing (Pecking order theory), because the existence of asymmetric information, the company follows the financial pecking order model: companies prefer internal resources, internal resources have been exhausted if the company was to issue debt, and finally the issue of equity. Therefore, the ability to generate internal resources, negatively correlated with leverage. The ability to generate internal resources, this paper, the cash rate of sale (NOCFS) and total assets of cash recovery rate (NOCFA) two proxy variables, but to test the Jensen (1986) free cash flow hypothesis proposed in this paper with a cash rate of sales / total Asset growth rate (FCFS) and total assets of cash recovery rate / total assets growth rate (FCFA), as free cash flow (Note: free cash flow is difficult to quantify, can not be obtained directly from the financial data, must be used in other empirical research cash flow concept, and in line with the growth of the company (such as Tobin'Q, growth rate of total assets), investment opportunities, free cash flow and other indicators in order to explain the problem.) proxy variables.VIII, product uniqueness 5 From the stakeholder theory of capital structure and product / factor market theory perspective, the company has a unique product should have less leverage. Titman and Wessels (1988) that, in liquidation, the production of unique or specialized products company, its customers, suppliers, workers will suffer from higher costs. Their workers and suppliers may have the skills and capital, job characteristics, and the customer service more difficult to find a replacement phase. From the agency cost perspective, the expected cost of employees looking for work products and services depends on whether there is unique. Employees working on the implementation of mass-specific work with respect to employees engaged in the former expected to find lower cost. Therefore, when other conditions being equal, and human-related costs for the agency to provide specialized products and services relative to the companies higher. Due to higher leverage will have higher agency costs and bankruptcy costs, sothe uniqueness of products and services will affect the degree of capital structure choice. These companies promote their unique products will suffer more sales costs and advertising costs. In this paper, operating expenses / Income from principal operations (SEXP) as a proxy for product uniqueness.IX liquidity Current ratio of capital structure choice is mixed. On the one hand, high flow rate paid by the company short-term debt due ability. Therefore, liquidity should be positively correlated with leverage. On the other hand, companies with more liquid assets may use these assets to finance its investments. Therefore, the flow of state assets would negatively affect leverage. And, as Prowse (1990) points out, can be used to indicate the liquidity of the assets to creditors, the interests of shareholders to manipulate the expense of the extent of these assets. In this paper, the current ratio (CR) and the quick ratio (QR) as a proxy for liquidity.Ten, industry characteristics The asset risk, asset type, and the demand for external funds vary by industry, the average leverage will vary with the industry. Industry characteristics and capital structure characteristics of the fact that the leverage within the same industry in different sectors of the lever more than the similar, leverage levels to remain relatively the same industry (Bowen et al, 1982; Bradley et al 1984). Bradley et al (1984) studies have shown that regulated industries (telecommunications, electronics, utilities and aviation industry) with higher leverage. This article uses the industry dummy variables to control the impact of industry factors on the lever.2、译文资本结构影响因素的分析研究资料来源: 最优资本结构原理作者: 巴里亚自Modigliani 和Miller(1958) 以来,学术界对资本结构进行了大量的理论和实证研究,试图辨别影响资本结构选择的潜在因素。
本科毕业设计(论文)中英文对照翻译(此文档为word格式,下载后您可任意修改编辑!)文献出处:Ashkanasy N M. The study on capital structure theory and the optimization of enterprise capital [J]. Journal of Management, 2016, 5(3): 235-254.原文The study on capital structure theory and the optimization ofenterprise capital structureAshkanasy N MAbstractIn this paper, corporate finance is an important content of modern enterprise management decision. Around the existence of optimal capitalstructure has been a lot of controversy. Given investment decisions, whether an enterprise to change its value by changing the capital structure and the cost of capital, namely whether there is a market make the enterprise value maximization, or make the enterprise capital structure of minimizing the cost of capital? To this problem has different answers in different stages of development, has formed many theory of capital structure.Key words: Capital structure; financial structure; Optimization; Financial leverage1 IntroductionIn financial theory, capital structure due to the different understanding of "capital" in the broad sense and narrow sense two explanations: one explanation is that the "capital" as all funding sources, the structure of the generalized capital structure refers to the entire capital, the relationship between the contrast of their own capital and debt capital, as the American scholar Alan c. Shapiro points out that "the company's capital structure - all the debt and equity financing; an alternative explanation is that if the" capital "is defined as a long-term funding sources, capital structure refers to the narrow sense of their own capital and long-term debt capital, and the tension and the short-term debt capital as the business capital management. Whether it is a broad concept ornarrow understanding of the capital structure is to discuss the proportion of equity capital and debt capital relations. 2 The capital structure theory Capital structure theory has experienced a process of gradually forming, developing and perfecting. First proposed the theory of American economist David Durand (David Durand) thinks that enterprise's capital structure is in accordance with the method of net income, net operating income method and traditional method, in 1958 di Gayle Anne (Franco Modigliani and Miller (Mertor Miller) and put forward the famous MM theory, created the modern capital structure theory, on this basis, the later generations and further put forward many new theory: 2.1 Net Income Theory (Net Income going) Net income theory on the premise of two assumptions --, investors with a fixed proportion of investment valuation or enterprise's net income. Enterprises to raise debt funds needed for a fixed rate. Therefore, the theory is that: the enterprise use of debt financing is always beneficial, can reduce the comprehensive cost of capital of enterprise. This is because the debt financing in the whole capital of enterprise, the bigger the share, the comprehensive cost of capital is more c lose to the cost of debt, and because the cost of debt is generally low, so, the higher the debt level, comprehensive capital cost is lower, the greater the enterprise value. When the debt ratio reached 100%, the firm will achieve maximum value.2.2 Theory of Net Operating Income (Net Operating Income going) Netoperating income theory is that, regardless of financial leverage, debt interest rates are fixed. If enterprises increase the lower cost of debt capital, but even if the cost of debt remains unchanged, but due to the increased the enterprise risk, can also lead to the rising cost of equity capital, it a liter of a fall, just offset, the enterprise cost of capital remain unchanged. Is derived as a result, the theory "" does not exist an optimal capital structure of the conclusion.2.3 Traditional Theory (Traditional going) Traditional theory is that the net income and net operating income method of compromise. It thinks, the enterprise use of financial leverage although will lead to rising cost of equity, but within limits does not completely offset the benefits of using the low cost of debt, so can make comprehensive capital cost reduction, increase enterprise value. But once exceed this limit, rights and interests of the rising cost of no longer can be offset by the low cost of debt, the comprehensive cost of capital will rise again. Since then, the cost of debt will rise, leading to a comprehensive capital costs rise more rapidly. Comprehensive cost of capital from falling into a turning point, is the lowest, at this point, to achieve the optimal capital structure. The above three kinds of capital structure theory is referred to as "early capital structure theory", their common features are: three theories are in corporate and personal income tax rate is zero under the condition of the proposed. Three theories and considering the capital structure of the dual effects of the cost of capital and enterprise value.Three theories are prior to 1958. Many scholars believe that the theory is not based on thorough analysis.3 Related theories3.1 Balance TheoryIt centered on the MM theory of modern capital structure theory development to peak after tradeoff theory. Trade-off theory is based on corporate MM model and miller, revised to reflect the financial pinch cost (also known as the financial crisis cost) and a model of agent cost.(1) the cost of financial constraints. Many enterprises always experience of financial constraints, some of them will be forced to go bankrupt. When the financial constraints but also not bankruptcy occurs, may appear the following situation: disputes between owners and creditors often leads to inventory and fixed assets on the material damaged or obsolete. Attorney fees, court fees and administrative costs to devour enterprise wealth, material loss and plus the legal and administrative expenses referred to as the "direct costs" of bankruptcy. Financial pinch will only occur in business with debt, no liability companies won't get into the mud. So with more debt, the fixed interest rate, and the greater the profitability of the probability of large leading to financial constraints and the cost of the higher the probability of occurrence. Financial pinch probability high will reduce the present value of the enterprise, to improve the cost ofcapital.(2) the agency cost. Because shareholders exists the possibility of using a variety of ways from the bondholders who benefit, bonds must have a number of protective constraint clauses. These terms and conditions in a certain extent constrained the legal management of the enterprise. Also must supervise the enterprise to ensure compliance with these terms and conditions, the cost of supervision and also upon the shareholders with higher debt costs. Supervise cost that agency cost is will raise the cost of debt to reduce debt interest. When the tax benefits and liabilities of financial constraints and agency costs when balance each other, namely the costs and benefits offset each other, determine the optimal capital structure. Equilibrium theory emphasizes the liabilities increase will cause the risk of bankruptcy and rising costs, so as to restrict the enterprise infinite pursuit of the behavior of tax preferential policies. In this sense, the enterprise the best capital structure is the balance of tax revenue and financial constraints caused by all kinds of costs as a result, when the marginal debt tax shield benefit is equal to the marginal cost of financial constraints, the enterprise value maximum, to achieve the optimal capital structure.3.2 Asymmetric Information TheoryAsymmetric Information and found)Due to the trade-off theory has long been limited to bankruptcy cost and tax benefit both conceptual framework, to the late 1970 s, the theory is centered on asymmetricinformation theory of new capital structure theory. So-called asymmetric information is in the information management and investors are not equal, managers than investors have more and more accurate information, and managers try to existing shareholders rather than new seeks the best interests of shareholders, so if business prospect is good, the manager will not issue new shares, but if the prospects, will make the cost of issuing new shares to raise too much, this factor must be considered in the capital structure decision. The significance of these findings to the enterprise's financial policy lies in: first it prompted enterprise reserve a certain debt capacity so as to internal lack of funding for new investment projects in the future debt financing. In addition, in order to avoid falling stock prices, managers often don't have to equity financing, and prefer to use external funding. The central idea is: internal financing preference, if you need external finance, preferences of creditor's rights financing. Can in order to save the ability to issue new debt at any time, the number of managers to borrow is usually less than the number of enterprises can take, in order to keep some reserves. Ross (s. Ross) first systematically introduce the theory of asymmetric information from general economics enterprise capital structure analysis, then, tal (e. Talmon), haeckel (Heikel) development from various aspects, such as the theory. After the 1980 s, thanks to the new institutional economics, and gradually formed a financial contract theory, corporate governance structure theory of capitalstructure theory, both of which emphasize enterprise contractual and incomplete contract, financial contract theory focuses on the design of optimal financial contract, and the arrangement of enterprise governance structure theory focuses on the right, focuses on the analysis of the relationship between capital structure and corporate governance.4 the capital structure theory of adaptability analysis On the one hand, capital structure theory especially the theory of modern capital structure is the important contribution is not only put forward "the existence of the optimal capital structure" this financial proposition, and that the optimal combination of the capital structure, objectively and make us on capital structure and its influence on the enterprise value have a clear understanding. The essence of these theories has direct influence and infiltrate into our country financial theory, and gives us enlightenment in many aspects: Because of various financing way, channel in financing costs, risks, benefits, constraints, as well as differences, seeking suitable capital structure is the enterprise financial management, especially the important content of financing management, must cause our country attaches great importance to the financial theory and financial practice. Capital structure decision despite the enterprise internal and external relationships and factor of restriction and influence, but its decision-making is the enterprise, the enterprise to the factors related to capital structure and the relationship between the quantitativeand qualitative analysis, discusses some principles and methods of enterprise capital structure optimization decision. Any enterprise capital structure in the design, all should leave room, maintain appropriate maneuver ability of financing, the financing environment in order to cope with the volatility and deal with unexpected events occur at any time. In general, businesses leverage ratio is high, has an adverse effect on the whole social and economic development, easily led to the decrease of the enterprise itself the economic benefits and losses and bankruptcies, deepen the entire social and economic development is not stable, increase the financial burden, cause inflation, not conducive to the transformation of industrial structure, and lower investment efficiency. Therefore, the enterprise capital structure should be in accordance with the business owners, creditors, and the public can bear the risk of the society in different aspects.译文资本结构理论与企业资本结构优化Ashkanasy N M摘要企业融资是现代企业经营决策的一项重要内容。
中英文对照外文翻译(文档含英文原文和中文翻译)The effect of capital structure on profitability : an empirical analysis of listed firms in Ghana IntroductionThe capital structure decision is crucial for any business organization. The decision is important because of the need to maximize returns to various organizational constituencies, and also because of the impact such a decision has on a firm’s ability to deal with its competitive environment. The capital structure of a firm is actually a mix of different securities. In general, a firm can choose among many alternative capital structures. It can issue a large amount of debt or very little debt. It can arrange lease financing, use warrants, issue convertible bonds, sign forward contracts or trade bond swaps. It can issue dozens of distinct securities in countless combinations; however, it attempts to find the particular combination that maximizes its overall market value.A number of theories have been advanced in explaining the capital structure of firms. Despite the theoretical appeal of capital structure, researchers in financial management have not found the optimal capital structure. The best that academics and practitioners have been able to achieve are prescriptions that satisfy short-term goals. For example, the lack of a consensus about what would qualify as optimal capital structure has necessitated the need for this research. A better understanding of the issues at hand requires a look at the concept of capital structure and its effect on firm profitability. This paper examines the relationship between capital structure and profitability of companies listed on the Ghana Stock Exchange during the period 1998-2002. The effect of capital structure on the profitability of listed firms in Ghana is a scientific area that has not yet been explored in Ghanaian finance literature.The paper is organized as follows. The following section gives a review of the extant literature on the subject. The next section describes the data and justifies the choice of the variables used in the analysis. The model used in the analysis is then estimated. The subsequent section presents and discusses the results of the empirical analysis. Finally, the last section summarizes the findings of the research and also concludes the discussion.Literature on capital structureThe relationship between capital structure and firm value has been the subject of considerable debate. Throughout the literature, debate has centered on whether there is an optimal capital structure for an individual firm or whether the proportion of debt usage is irrelevant to the individual firm’s value. The capital structure of a firm concerns the mix of debt and equity the firm uses in its operation. Brealey and Myers (2003) contend that the choice of capital structure is fundamentally a marketing problem. They state that the firm can issue dozens of distinct securities in countless combinations, but it attempts to find the particular combination that maximizes market value. According to Weston and Brigham (1992), the optimal capital structure is the one that maximizes the market value of the firm’s outstanding shares.Fama and French (1998), analyzing the relationship among taxes, financing decisions, and the firm’s value, concluded that the debt does not concede tax b enefits. Besides, the high leverage degree generates agency problems among shareholders and creditors that predict negative relationships between leverage and profitability. Therefore, negative information relating debt and profitability obscures the tax benefit of the debt. Booth et al. (2001) developed a study attempting to relate the capital structure of several companies in countries with extremely different financial markets. They concluded thatthe variables that affect the choice of the capital structure of the companies are similar, in spite of the great differences presented by the financial markets. Besides, they concluded that profitability has an inverse relationship with debt level and size of the firm. Graham (2000) concluded in his work that big and profitable companies present a low debt rate. Mesquita and Lara (2003) found in their study that the relationship between rates of return and debt indicates a negative relationship for long-term financing. However, they found a positive relationship for short-term financing and equity.Hadlock and James (2002) concluded that companies prefer loan (debt) financing because they anticipate a higher return. Taub (1975) also found significant positive coefficients for four measures of profitability in a regression of these measures against debt ratio. Petersen and Rajan (1994) identified the same association, but for industries. Baker (1973), who worked with a simultaneous equations model, and Nerlove (1968) also found the same type of association for industries. Roden and Lewellen (1995) found a significant positive association between profitability and total debt as a percentage of the total buyout-financing package in their study on leveraged buyouts. Champion (1999) suggested that the use of leverage was one way to improve the performance of an organization.In summary, there is no universal theory of the debt-equity choice. Different views have been put forward regarding the financing choice. The present study investigates the effect of capital structure on profitability of listed firms on the GSE.MethodologyThis study sampled all firms that have been listed on the GSE over a five-year period (1998-2002). Twenty-two firms qualified to be included in the study sample. Variables used for the analysis include profitability and leverage ratios. Profitability is operationalized using a commonly used accounting-based measure: the ratio of earnings before interest and taxes (EBIT) to equity. The leverage ratios used include:. short-term debt to the total capital;. long-term debt to total capital;. total debt to total capital.Firm size and sales growth are also included as control variables.The panel character of the data allows for the use of panel data methodology. Panel data involves the pooling of observations on a cross-section of units over several time periods and provides results that are simply not detectable in pure cross-sections or pure time-series studies. A general model for panel data that allows the researcher to estimate panel data with great flexibility and formulate the differences in the behavior of thecross-section elements is adopted. The relationship between debt and profitability is thus estimated in the following regression models:ROE i,t =β0 +β1SDA i,t +β2SIZE i,t +β3SG i,t + ëi,t (1) ROE i,t=β0 +β1LDA i,t +β2SIZE i,t +β3SG i,t + ëi,t (2) ROE i,t=β0 +β1DA i,t +β2SIZE i,t +β3SG i,t + ëi,t (3)where:. ROE i,t is EBIT divided by equity for firm i in time t;. SDA i,t is short-term debt divided by the total capital for firm i in time t;. LDA i,t is long-term debt divided by the total capital for firm i in time t;. DA i,t is total debt divided by the total capital for firm i in time t;. SIZE i,t is the log of sales for firm i in time t;. SG i,t is sales growth for firm i in time t; and. ëi,t is the error term.Empirical resultsTable I provides a summary of the descriptive statistics of the dependent and independent variables for the sample of firms. This shows the average indicators of variables computed from the financial statements. The return rate measured by return on equity (ROE) reveals an average of 36.94 percent with median 28.4 percent. This picture suggests a good performance during the period under study. The ROE measures the contribution of net income per cedi (local currency) invested by the firms’ stockholders; a measure of the efficiency of the owners’ invested capital. The variable SDA measures the ratio of short-term debt to total capital. The average value of this variable is 0.4876 with median 0.4547. The value 0.4547 indicates that approximately 45 percent of total assets are represented by short-term debts, attesting to the fact that Ghanaian firms largely depend on short-term debt for financing their operations due to the difficulty in accessing long-term credit from financial institutions. Another reason is due to the under-developed nature of the Ghanaian long-term debt market. The ratio of total long-term debt to total assets (LDA) also stands on average at 0.0985. Total debt to total capital ratio(DA) presents a mean of 0.5861. This suggests that about 58 percent of total assets are financed by debt capital. The above position reveals that the companies are financially leveraged with a large percentage of total debt being short-term.Table I.Descriptive statisticsMean SD Minimum Median Maximum━━━━━━━━━━━━━━━━━━━━━━━━━━━━━ROE 0.3694 0.5186 -1.0433 0.2836 3.8300SDA 0.4876 0.2296 0.0934 0.4547 1.1018LDA 0.0985 0.1803 0.0000 0.0186 0.7665DA 0.5861 0.2032 0.2054 0.5571 1.1018SIZE 18.2124 1.6495 14.1875 18.2361 22.0995SG 0.3288 0.3457 20.7500 0.2561 1.3597━━━━━━━━━━━━━━━━━━━━━━━━━━━━━Regression analysis is used to investigate the relationship between capital structure and profitability measured by ROE. Ordinary least squares (OLS) regression results are presented in Table II. The results from the regression models (1), (2), and (3) denote that the independent variables explain the debt ratio determinations of the firms at 68.3, 39.7, and 86.4 percent, respectively. The F-statistics prove the validity of the estimated models. Also, the coefficients are statistically significant in level of confidence of 99 percent.The results in regression (1) reveal a significantly positive relationship between SDA and profitability. This suggests that short-term debt tends to be less expensive, and therefore increasing short-term debt with a relatively low interest rate will lead to an increase in profit levels. The results also show that profitability increases with the control variables (size and sales growth). Regression (2) shows a significantly negative association between LDA and profitability. This implies that an increase in the long-term debt position is associated with a decrease in profitability. This is explained by the fact that long-term debts are relatively more expensive, and therefore employing high proportions of them could lead to low profitability. The results support earlier findings by Miller (1977), Fama and French (1998), Graham (2000) and Booth et al. (2001). Firm size and sales growth are again positively related to profitability.The results from regression (3) indicate a significantly positive association between DA and profitability. The significantly positive regression coefficient for total debt implies that an increase in the debt position is associated with an increase in profitability: thus, the higher the debt, the higher the profitability. Again, this suggests that profitable firms depend more on debt as their main financing option. This supports the findings of Hadlock and James (2002), Petersen and Rajan (1994) and Roden and Lewellen (1995) that profitable firms use more debt. In the Ghanaian case, a high proportion (85 percent)of debt is represented by short-term debt. The results also show positive relationships between the control variables (firm size and sale growth) and profitability.Table II.Regression model results━━━━━━━━━━━━━━━━━━━━━━━━━━━━━Profitability (EBIT/equity)Ordinary least squares━━━━━━━━━━━━━━━━━━━━━━━━━━━━━Variable 1 2 3SIZE 0.0038 (0.0000) 0.0500 (0.0000) 0.0411 (0.0000)SG 0.1314 (0.0000) 0.1316 (0.0000) 0.1413 (0.0000)SDA 0.8025 (0.0000)LDA -0.3722(0.0000)DA -0.7609(0.0000)R²0.6825 0.3968 0.8639SE 0.4365 0.4961 0.4735Prob. (F) 0.0000 0.0000 0.0000━━━━━━━━━━━━━━━━━━━━━━━━━━━━ConclusionsThe capital structure decision is crucial for any business organization. The decision is important because of the need to maximize returns to various organizational constituencies, and also because of the impact such a decision has on an organization’s ability to deal with its competitive environment. This present study evaluated the relationship between capital structure and profitability of listed firms on the GSE during a five-year period (1998-2002). The results revealed significantly positive relation between SDA and ROE, suggesting that profitable firms use more short-term debt to finance their operation. Short-term debt is an important component or source of financing for Ghanaian firms, representing 85 percent of total debt financing. However, the results showed a negative relationship between LDA and ROE. With regard to the relationship between total debt and profitability, the regression results showed a significantly positive association between DA and ROE. This suggests that profitable firms depend more on debt as their main financing option. In the Ghanaian case, a high proportion (85 percent) of the debt is represented in short-term debt.译文加纳上市公司资本结构对盈利能力的实证研究论文简介资本结构决策对于任何商业组织都是至关重要的。
外文文献翻译译文原文:Capital Structure around the World: The Roles of FirmandCountry-Specific DeterminantsWe analyze the importance of firm-specific and country-specific factors in the leverage choice of firms from 42 countries around the world. Our analysis yields two new results. First, we find that firm-specific determinants of leverage differ across countries, while prior studies implicitly assume equal impact of firm-specific factors. Second, although we concur with the conventional direct impact of country-specific factors on the capital structure of firms, we show that there is an indirect impact because country-specific factors also influence the roles of firm-specific determinants of leverage.Prior research (e.g. Demirgüç-Kuntand Maksimovic, 1999; Booth, Demirgüç-Kunt andMaksimovic, 2001; Claessens, Djankov and Nenova, 2001; Bancel and Mittoo, 2004) finds thata firm’s capital structure is not only influenced by firm-specific factors but also by country specificfactors. In this study, we demonstrate that country-specific factors can affect corporateleverage in two ways. On the one hand, these factors can influence leverage directly. Forexample, a more developed bond market facilitating issue and trading of public bonds may leadto the use of higher leverage in a country, while a developed stock market has theoppositeeffect. On the other hand, we show that country-specific factors can also influence corporateleverage indirectly through their impact on firm-specific factors’ roles. For example, althoughthe dev eloped bond market of a country stimulates the use of debt, the role of asset tangibility ascollateral in borrowing will be rather limited for firms in the same country. In other words,country-characteristics may explain why in one country a firm’s tangibi lity affects leverage, butnot in another country. Previous studies have not systematically investigated these indirecteffects.International studies comparing differences in the capital structure between countriesstarted to appear only during the last decade. An early investigation of seven advancedindustrialized countries is performed by Rajan and Zingales (1995). They argue that althoughcommon firm-specific factors significantly influence the capital structure of firms acrosscountries, several country-specific factors also play an important role. Demirgüç-Kunt andMaksimovic (1999) compare capital structure of firms from 19 developed countries and 11developing countries. They find that institutional differences between developed and developingcountries explain a large portion of the variation in the use of long-term debt. They also observethat some institutional factors in developing countries influence the leverage of large and smallfirms differently. Several recent studies on the field have indicated that even amongdevelopedeconomies like the U.S. and European countries, the financing policies and managers’ behaviorare influenced by the institutional environment and international operations (see, for example, Graham and Harvey, 2001; Bancel and Mittoo, 2004; and Brounen, De Jong and Koedijk,2006).The literature specifically discusses only the direct impact of country characteristics onleverage. In an analysis of ten developing countries, Booth et al. (2001) find that capitalstructure decisions of firms in these countries are affected by the same firm-specific factors as indeveloped countries. However, they find that there are differences in the way leverage isaffected by country-specific factors such as GDP growth and capital market development. Theyconclude that more research needs to be done to understand the impact of institutional factors onfirms’ capital structure choices. The importance of country-specific factors in determining crosscountrycapital structure choice of firms is also acknowledged by Fan et al. (2006) who analyzea larger sample of 39 countries. They find a significant impact of a few additional country-specificfactors such as the degree of development in the banking sector, and equity and bondmarkets. In another study of 30 OECD countries, Song and Philippatos (2004) report that mostcross-sectional variation in international capital structure is caused by the heterogeneity of firm-,industry-, and country-specific determinants. However, they do notfind evidence to support theimportance of cross-country legal institutional differences in affecting corporate leverage.Giannetti (2003) argues that the failure to find a significant impact of country-specific variablesmay be due to the bias induced in many studies by including only large listed companies. Sheanalyzes a large sample of unlisted firms from eight European countries and finds a significantinfluence on the leverage of individual firms of a few institutional variables such as creditorprotection, stock market development and legal enforcement. Similarly, Hall et al. (2004) analyze a large sample of unlisted firms from eight European countries. They observe crosscountryvariation in the determinants of capital structure and suggest that this variation could bedue to different country-specific variables.A remarkable feature of existing studies on international capital structure is the implicitassumption that the impact of firm-specific factors on leverage is equal across countries (see forexample Booth et al., 2001; Giannetti, 2003; Song and Philippatos, 2004; and Fan et al., 2006). By reporting the estimated coefficients for firm-specificdeterminants of leverage per country, these papers, on the one hand, acknowledge that theimpact of firm-level determinants does differ in terms of signs, magnitudes and significancelevels. On the other hand, in the analysis of country-specific determinants of corporateleverage,these papers also make use of country dummies in pooled firm-year regressions, thus forcing thefirm-specific coefficients to have the same value. With an extremely large number of firm-yearobservations, it is more likely for this procedure to produce statistically significant results formany country-specific variables. But, utilizing an alternative regression framework where asingle average capital structure for each country is used as an observation, one hardly findsstrong evidence on this issue. As an additional contribution of our paper, we show the invalidity of this implicit assumption. Our analysis without imposing such restriction thus provides a more reliable analysis on theimportance of country-specific variables.The study encompasses a large number of countries (42 in total) from every continent forthe period 1997-2001. We construct a database of nearly 12,000 firms (about 60,000 firm-yearobservations). All types of firms –large and small – are included as long as a reasonable amountof data is available. We analyze the standard firm-specific determinants of leverage like firmsize, asset tangibility, profitability, firm risk and growth opportunities. Besides, we incorporate alarge number of country-specific variables in our analysis, including legal enforcement,shareholder/creditor right protection, market/bank-based financial system, stock/bond marketdevelopment and growth rate in a country’s gross domestic product (GDP).Firm-specific and country-specific determinants are the two major types of variables thatwe take into account when analyzing the impacts on firms’ leverage choice.The firms in our sample cover 42 countries that are equally divided between developedand developing countries. Data for leverage and firm-specific variables are collected fromCOMPUSTAT Global database. We exclude financial firms and utilities. Data on country-specificvariables are collected from a variety of sources, mainly World Development Indicatorsfiles and Financial Structure Database of the World Bank. Few country-specific variables aretaken from previous studies including La Porta et al. (1998), Claessens and Klapper (2002) andBerkowitz et al. (2003).Our sample period covers the years 1997-2001. The selection of a time-period involves atrade-off between the number of countries that can be included in the study and the availabilityof enough firm-specific data. Whenever needed, we resort to some other sources to collect anymissing data. It is still impossible to obtain data for each and every variable from all 42countries during this time period. The final sample consists of 59,225 observations on 11,845firms. Even though we aim to keep the number of countries high enough and also maintain a reasonable number of firms, our dataset has unavoidably a limited number of firms in a fewcountries.Analyzing the direct impact of country-specific factors on leverage, the evidencesuggests that creditor right protection, bond market development,and GDP growth rate have asignificant influence on corporate capital structure. In measuring the impact indirectly, we findevidence for the importance of legal enforcement, creditor/shareholder right protection, andmacro-economic measures such as capital formation and GDP growth rate. It implies that incountries with a better legal environment and more stable and healthier economic conditions, firms are not only likely to take more debt, but also the effects of firm-level determinants of leverageare also reinforced. Overall, the evidence provided here highlights the importance of country-specificfactors in corporate capital structure decisions. Our conclusion is that country-specificfactors do matter in determining and affecting the leverage choice around the world, and it isuseful to take into account these factors in the analysis of a country’s capital structure. If thelimitations of data, especially the number of countries, can be overcome, one might find evenmore significant results with respect to the impact of country-specificfactors.We first make a detailed comparative analysis of the impact of various firm-specificfactors. We find across a large number of countries that the impact of some factors liketangibility, firm size, risk, and profitability and growth opportunities is strong and consistent withstandard capital structure theories. Our study shows that, in terms of firm-specific determinantsof leverage, capital structure theories doexplain the corporate leverage choice in a large numberof countries. Using a model with several firm-specific explanatory variables, we find a relativelylarge explanatory power of leverage regressions in most countries. However, a few determinantsremain insignificant, and in some countries one or two coefficients are significant with anunexpected sign. Performing a simple statistical test, we reject the hypothesis that firm-specificcoefficients across countries are equal. It indicates that the often-made implicit assumption ofequal firm-level determinants of leverage across countries does not hold.In the analysis of the direct impact of country-specific factors, we observe that certainfactors like GDP growth rate, bond market development and creditor rightprotectionsignificantly explain the variation in capital structure across countries. Moreover, we findconsiderable explanatory power of country-specific variables beyond firm-specific factors. Wethen proceed to measure the indirect impact of country-specific variables. The resultsconsistently show the importance of country factors as we document significant effects of thesevia firm-specific determinants. For example, we observe that in countries with a better lawenforcement system and a more healthy economy, firms are not only likely to take more debt,but the effects of some firm-level determinants of leverage such as growth opportunities,profitability and liquidity are also reinforced. Our findings indicate that theconventionaltheories on capitalstructure developed using listed firms in the United States as a role model,work well in similar economies with developed legal environment and high level of economicdevelopment. The indirect impact analysis also indicates that firm-specific variables aresignificantly influenced by several country-specific variables but in different ways.Capital structure theories have been mostly developed and tested in the single-countrycontext. Researchers have identified several firm-specific determinants of a firm’s leverage,based on the three most accepted theoretical models of capital structure, i.e. the static trade-offtheory, the agency theory and the pecking-order theory. A large number of studies have beenconducted to date investigating to what extent these factors influence capital structures of firmsoperating within a specific country. In this paper, we examine the role of firm-specificdeterminants of corporate leverage choice around the world. We analyze a large sample of 42countries, divided equally between developed and developing countries. Our main objective isto verify the role of various country-specific factors in determining corporate capital structure.We distinguish two types of effects: the direct effect on leverage and the indirect effect throughthe influence on firm-specific determinants of corporate leverage.We find that the impact of several firm-specific factors liketangibility, firm size, risk,growth and profitability on cross-country capital structure is significant and consistent with theprediction of conventional capital structure theories. On the other hand, we also observe that ineach country one or more firm-specific factors are not significantly related to leverage. Forsome countries, we find results that are inconsistent with theoretical predictions.Several studies analyzing international capital structure assume cross-country equality offirm-level determinants. We show that this assumption is unfounded. Rather, it is necessary toconduct an analysis of country-specific factors by including countries as observations and avoida specification using a pooled regression method. We conduct regressions using country-specificfactors to explain coefficients of country dummies as well as firm-specificdeterminants.Source:Abede Jong, RezaulK abir, 2007.9 “Capital Structure around the World: The Roles of FirmandCountry-Specific Determinants”. ERIM Report Series Reach in Management.September.pp.58-63.译文:世界各地的资本结构:公司和国家因素在其中的影响我们从世界42个国家中分析了公司在选择财务杠杆所需要考虑的公司特有因素和国家因素的重要性。
资本结构层次因素甲,乙爱德华光加代?,赫伯特木村一Universidade圣保罗,圣保罗,巴西bUniversidade Presbiteriana麦肯齐,圣保罗,巴西文章资讯摘要:文章历史:我们分析了时间,固件,行业和国家一级的资本结构决定因素的影响。
收到2019年2月3日第一,我们使用阶层线性模式,以评估这些水平的相对重要性。
接受2019年8月16日我们发现,时间和企业一级公司的杠杆解释78%。
第二,我们包括随机拦截可在线二○一○年八月二十日和随机系数以分析公司的直接和间接的影响力/行业/国家characteristicsonfirmleverage.Wedocumentseveralimportantindirectinfluences ofvariablesatindus - JEL分类:尝试和国家层面的杠杆公司决定因素,以及在一些结构上的差异F30金融行为与发达国家和新兴国家的公司。
G32 2019埃尔塞维尔B.诉保留所有权利。
关键词:资本结构层次分析企业层面的决定因素行业水平的决定因素国家一级的决定因素1。
导言等,2019;。
曼西和里布,2019年;。
德赛等,2019)的比较与跨国公司的国内企业融资政策这些研究对资本结构的优势主要basedontheargumentthatglobalfactorsmightinfluencefinancial重点是分析某些公司特征- 例如,利润杠杆。
如果,一方面,它很容易找到研究,分析能力,有形性,大小等- 作为杠杆的决定因素。
在阿迪,公司/作为国家的资本结构影响因素的特点,tion,资本结构可能各不相同的时间(例如,Korajczyk和ontheotherhand,theliteratureoftenneglectstheroleofindustry。
利维,2019年),尽管常常相对稳定云集帽虽然大多数研究包括资本结构虚拟需求面实证结构(莱蒙等。

资本结构影响因素研究综述Document serial number【UU89WT-UU98YT-UU8CB-UUUT-UUT108】上市公司资本结构影响因素研究综述【摘要】资本结构是公司理财活动的核心组成部分,涉及到企业筹资、经营、利益分配等各个方面,是反映企业资金实力的重要指标。
本文通过对资本结构影响因素的理论分析和实证研究的回顾,分析了现有研究的成果。
【关键词】资本结构;实证研究;文献综述Abstract: Capital structure is the core part of corporate finance activities, which is related to the financing, management, profit distribution and other aspects, and is an important index of reflectsing the enterprise's financial strength. Based on the influencing factors of the capital structure theory analysis and empirical study review, the article analyses the existing study results.Key words: capital structure empirical study literature review一、引言资本结构系指长期负债与权益(普通股、特别股、保留盈余)的分配情况。
最佳资本结构便是使股东财富最大或股价最大的资本结构,亦即使公司资金成本最小的资本结构。
资本结构是指企业各种资本的价值构成及其比例。
企业融资结构,或称资本结构,反映的是企业债务与股权的比例关系,它在很大程度上决定着企业的偿债和再融资能力,决定着企业未来的盈利能力,是企业财务状况的一项重要指标。
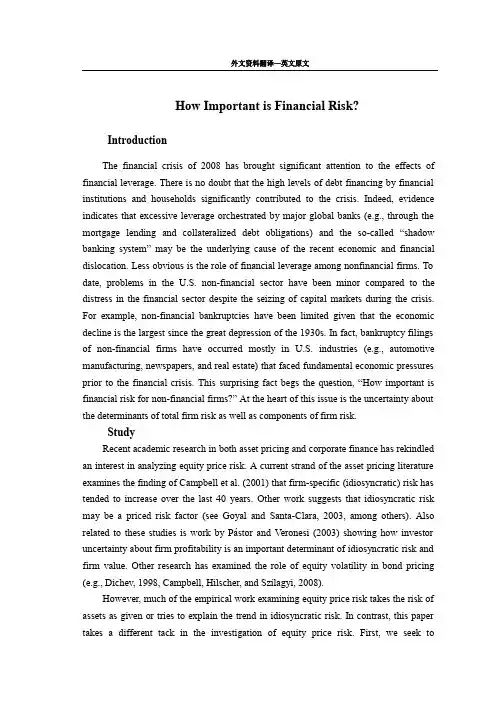
How Important is Financial Risk?IntroductionThe financial crisis of2008has brought significant attention to the effects of financial leverage.There is no doubt that the high levels of debt financing by financial institutions and households significantly contributed to the crisis.Indeed,evidence indicates that excessive leverage orchestrated by major global banks(e.g.,through the mortgage lending and collateralized debt obligations)and the so-called“shadow banking system”may be the underlying cause of the recent economic and financial dislocation.Less obvious is the role of financial leverage among nonfinancial firms.To date,problems in the U.S.non-financial sector have been minor compared to the distress in the financial sector despite the seizing of capital markets during the crisis. For example,non-financial bankruptcies have been limited given that the economic decline is the largest since the great depression of the1930s.In fact,bankruptcy filings of non-financial firms have occurred mostly in U.S.industries(e.g.,automotive manufacturing,newspapers,and real estate)that faced fundamental economic pressures prior to the financial crisis.This surprising fact begs the question,“How important is financial risk for non-financial firms?”At the heart of this issue is the uncertainty about the determinants of total firm risk as well as components of firm risk.StudyRecent academic research in both asset pricing and corporate finance has rekindled an interest in analyzing equity price risk.A current strand of the asset pricing literature examines the finding of Campbell et al.(2001)that firm-specific(idiosyncratic)risk has tended to increase over the last40years.Other work suggests that idiosyncratic risk may be a priced risk factor(see Goyal and Santa-Clara,2003,among others).Also related to these studies is work by Pástor and Veronesi(2003)showing how investor uncertainty about firm profitability is an important determinant of idiosyncratic risk and firm value.Other research has examined the role of equity volatility in bond pricing (e.g.,Dichev,1998,Campbell,Hilscher,and Szilagyi,2008).However,much of the empirical work examining equity price risk takes the risk of assets as given or tries to explain the trend in idiosyncratic risk.In contrast,this paper takes a different tack in the investigation of equity price risk.First,we seek tounderstand the determinants of equity price risk at the firm level by considering total risk as the product of risks inherent in the firms operations(i.e.,economic or business risks)and risks associated with financing the firms operations(i.e.,financial risks). Second,we attempt to assess the relative importance of economic and financial risks and the implications for financial policy.Early research by Modigliani and Miller(1958)suggests that financial policy may be largely irrelevant for firm value because investors can replicate many financial decisions by the firm at a low cost(i.e.,via homemade leverage)and well-functioning capital markets should be able to distinguish between financial and economic distress. Nonetheless,financial policies,such as adding debt to the capital structure,can magnify the risk of equity.In contrast,recent research on corporate risk management suggests that firms may also be able to reduce risks and increase value with financial policies such as hedging with financial derivatives.However,this research is often motivated by substantial deadweight costs associated with financial distress or other market imperfections associated with financial leverage.Empirical research provides conflicting accounts of how costly financial distress can be for a typical publicly traded firm.We attempt to directly address the roles of economic and financial risk by examining determinants of total firm risk.In our analysis we utilize a large sample of non-financial firms in the United States.Our goal of identifying the most important determinants of equity price risk(volatility)relies on viewing financial policy as transforming asset volatility into equity volatility via financial leverage.Thus, throughout the paper,we consider financial leverage as the wedge between asset volatility and equity volatility.For example,in a static setting,debt provides financial leverage that magnifies operating cash flow volatility.Because financial policy is determined by owners(and managers),we are careful to examine the effects of firms’asset and operating characteristics on financial policy.Specifically,we examine a variety of characteristics suggested by previous research and,as clearly as possible, distinguish between those associated with the operations of the company(i.e.factors determining economic risk)and those associated with financing the firm(i.e.factors determining financial risk).We then allow economic risk to be a determinant of financial policy in the structural framework of Leland and Toft(1996),or alternatively, in a reduced form model of financial leverage.An advantage of the structural modelapproach is that we are able to account for both the possibility of financial and operating implications of some factors(e.g.,dividends),as well as the endogenous nature of the bankruptcy decision and financial policy in general.Our proxy for firm risk is the volatility of common stock returns derived from calculating the standard deviation of daily equity returns.Our proxies for economic risk are designed to capture the essential characteristics of the firms’operations and assets that determine the cash flow generating process for the firm.For example,firm size and age provide measures of line of-business maturity;tangible assets(plant,property,and equipment)serve as a proxy for the‘hardness’of a firm’s assets;capital expenditures measure capital intensity as well as growth potential.Operating profitability and operating profit volatility serve as measures of the timeliness and riskiness of cash flows. To understand how financial factors affect firm risk,we examine total debt,debt maturity,dividend payouts,and holdings of cash and short-term investments.The primary result of our analysis is surprising:factors determining economic risk for a typical company explain the vast majority of the variation in equity volatility. Correspondingly,measures of implied financial leverage are much lower than observed debt ratios.Specifically,in our sample covering1964-2008average actual net financial (market)leverage is about1.50compared to our estimates of between1.03and1.11 (depending on model specification and estimation technique).This suggests that firms may undertake other financial policies to manage financial risk and thus lower effective leverage to nearly negligible levels.These policies might include dynamically adjusting financial variables such as debt levels,debt maturity,or cash holdings(see,for example, Acharya,Almeida,and Campello,2007).In addition,many firms also utilize explicit financial risk management techniques such as the use of financial derivatives, contractual arrangements with investors(e.g.lines of credit,call provisions in debt contracts,or contingencies in supplier contracts),special purpose vehicles(SPVs),or other alternative risk transfer techniques.The effects of our economic risk factors on equity volatility are generally highly statistically significant,with predicted signs.In addition,the magnitudes of the effects are substantial.We find that volatility of equity decreases with the size and age of the firm.This is intuitive since large and mature firms typically have more stable lines of business,which should be reflected in the volatility of equity returns.Equity volatility tends to decrease with capital expenditures though the effect is weak.Consistent withthe predictions of Pástor and Veronesi(2003),we find that firms with higher profitability and lower profit volatility have lower equity volatility.This suggests that companies with higher and more stable operating cash flows are less likely to go bankrupt,and therefore are potentially less risky.Among economic risk variables,the effects of firm size,profit volatility,and dividend policy on equity volatility stand out. Unlike some previous studies,our careful treatment of the endogeneity of financial policy confirms that leverage increases total firm risk.Otherwise,financial risk factors are not reliably related to total risk.Given the large literature on financial policy,it is no surprise that financial variables are,at least in part,determined by the economic risks firms take.However, some of the specific findings are unexpected.For example,in a simple model of capital structure,dividend payouts should increase financial leverage since they represent an outflow of cash from the firm(i.e.,increase net debt).We find that dividends are associated with lower risk.This suggests that paying dividends is not as much a product of financial policy as a characteristic of a firm’s operations(e.g.,a mature company with limited growth opportunities).We also estimate how sensitivities to different risk factors have changed over time.Our results indicate that most relations are fairly stable. One exception is firm age which prior to1983tends to be positively related to risk and has since been consistently negatively related to risk.This is related to findings by Brown and Kapadia(2007)that recent trends in idiosyncratic risk are related to stock listings by younger and riskier firms.Perhaps the most interesting result from our analysis is that our measures of implied financial leverage have declined over the last30years at the same time that measures of equity price risk(such as idiosyncratic risk)appear to have been increasing. In fact,measures of implied financial leverage from our structural model settle near1.0 (i.e.,no leverage)by the end of our sample.There are several possible reasons for this. First,total debt ratios for non-financial firms have declined steadily over the last30 years,so our measure of implied leverage should also decline.Second,firms have significantly increased cash holdings,so measures of net debt(debt minus cash and short-term investments)have also declined.Third,the composition of publicly traded firms has changed with more risky(especially technology-oriented)firms becoming publicly listed.These firms tend to have less debt in their capital structure.Fourth,as mentioned above,firms can undertake a variety of financial risk management activities.To the extent that these activities have increased over the last few decades,firms will have become less exposed to financial risk factors.We conduct some additional tests to provide a reality check of our results.First,we repeat our analysis with a reduced form model that imposes minimum structural rigidity on our estimation and find very similar results.This indicates that our results are unlikely to be driven by model misspecification.We also compare our results with trends in aggregate debt levels for all U.S.non-financial firms and find evidence consistent with our conclusions.Finally,we look at characteristics of publicly traded non-financial firms that file for bankruptcy around the last three recessions and find evidence suggesting that these firms are increasingly being affected by economic distress as opposed to financial distress.ConclusionIn short,our results suggest that,as a practical matter,residual financial risk is now relatively unimportant for the typical U.S.firm.This raises questions about the level of expected financial distress costs since the probability of financial distress is likely to be lower than commonly thought for most companies.For example,our results suggest that estimates of the level of systematic risk in bond pricing may be biased if they do not take into account the trend in implied financial leverage(e.g.,Dichev,1998).Our results also bring into question the appropriateness of financial models used to estimate default probabilities,since financial policies that may be difficult to observe appear to significantly reduce stly,our results imply that the fundamental risks born by shareholders are primarily related to underlying economic risks which should lead to a relatively efficient allocation of capital.Some readers may be tempted to interpret our results as indicating that financial risk does not matter.This is not the proper interpretation.Instead,our results suggest that firms are able to manage financial risk so that the resulting exposure to shareholders is low compared to economic risks.Of course,financial risk is important to firms that choose to take on such risks either through high debt levels or a lack of risk management.In contrast,our study suggests that the typical non-financial firm chooses not to take these risks.In short,gross financial risk may be important,but firms can manage it.This contrasts with fundamental economic and business risks that are more difficult(or undesirable)to hedge because they represent the mechanism by which the firm earns economic profits.References[1]Shyam,Sunder.Theory Accounting and Control[J].An Innternational Theory on PublishingComPany.2005[2]Ogryezak,W,Ruszeznski,A.Rom Stomchastic Dominance to Mean-Risk Models:Semide-Viations as Risk Measures[J].European Journal of Operational Research.[3]Borowski,D.M.,and P.J.Elmer.An Expert System Approach to Financial Analysis:the Case of S&L Bankruptcy[J].Financial Management,Autumn.2004;[4]Casey, C.and ing Operating Cash Flow Data to Predict Financial Distress:Some Extensions[J].Journal of Accounting Research,Spring.2005;[5]John M.Mulvey,HafizeGErkan.Applying CVaR for decentralized risk management of financialcompanies[J].Journal of Banking&Finanee.2006;[6]Altman.Credit Rating:Methodologies,Rationale and Default Risk[M].Risk Books,London.译文:财务风险的重要性引言2008年的金融危机对金融杠杆的作用产生重大影响。
资本结构外文文献资本结构是一个公司的股权和负债的组合,可以通过权益比率和负债比率来描述。
资本结构的选择与公司的风险、财务灵活性、成本效益等有联系,因此,对于公司来说,资本结构的选择至关重要。
在本文中,我们将介绍两篇外国文献,以了解资本结构的现状和选择对公司的影响。
第一篇文献第一篇文献名为“Capital Structure and Corporate Performance in China: Evidence from Foreign Listed Firms”,作者为Sung C. Bae、Chang-Soo Kim和Akihiko Takahashi。
这篇文章研究了中国外资上市公司的资本结构与业绩之间的关系,并通过样本回归分析得出。
文章首先介绍了中国外资上市公司的资本结构情况,指出了其负债比率高、权益比率低的特点,这些特点也反映在其经营绩效上。
然后,文章对不同的资本结构与公司绩效之间的关系进行了实证研究。
分析发现,在外籍公司中,负债比率与公司绩效呈倒U型关系,而权益比率与公司绩效呈现正向关系。
同时,还发现公司规模和成长率对资本结构选择具有重要影响。
文章得出:在中国外资上市公司中,权益比率对公司绩效具有显著的正向作用;负债比率和公司绩效之间存在倒U型关系;公司规模和成长率都对资本结构选择有重要影响。
第二篇文献第二篇文献名为“Capital Structure and Firm Performance: Evidence from Malaysia”,作者为Chee-Wooi Hooy、Chin-Fei Goh和Yew-Ming Chia。
这篇文章研究了马来西亚公司的资本结构选择与公司绩效之间的关系。
文章首先介绍了马来西亚公司的资本结构特点,包括股权比例高、负债比例低的现象。
然后,文章通过样本回归分析研究了资本结构选择与公司绩效之间的关系。
分析发现,在马来西亚公司中,权益比率和公司绩效呈现正相关关系,负债比率与公司绩效之间没有显著关系。
外文翻译原文The analysis of company's capital and evaluation of factors, which influencecreation of the optimal capital structureMaterial Source: Author: Svetlana Saksonova This is the primary information gathering stage, which is necessary for the effective planning afterwards. At this stage the objective of the financial manager is to determine the existing tendencies of the development of capital structure, as well as its volume, and their influence on the financial stability of the company. Efficiency of the existing financing arrangements can also be considered at this stage. This stage can conditionally be split into three parts –one more concerned with qualitative characteristics and the two other ones concerned with quantifying the results of the analysis.The first (qualitative) stage involves comparing the dynamics of the total capital and its ingredients compared to the dynamics of production and sales, assessing the proportion of the borrowed and equity and the history of this proportion. Borrowed capital is further split into long-term and short-term financial obligations, overdue financial obligations are discovered (if they exist) and the causes for the inabilities of a company to meet financial commitments are analyzed.The second (more quantitative) stage of the analysis uses the system of coefficients of financial stability of a company to asses the capital structure.This stage utilizes well known financial indicators, such as different liquidity ratios.The purpose of these coefficients of financial stability is to show the degree of the possible risk of bankruptcy of a company that is related to the use of borrowed financial resources. Obviously, if the company does not use any borrowed funds the risk of bankruptcy related to the usage of borrowed funds is equal to zero. As the proportion of the borrowed capital grows, the risk of bankruptcy is also growing, because of the increase in company’s liabilities.Therefore, financial coefficients are mostly of interest for the existing andpotential creditors of the company.As a rule, debts to the ordinary creditors are paid, after the payment of taxes, wages and repayment of claims of secured creditors, who provided loans secured by collateral, such as office space or production machinery. The assessment of company’s liquidity helps to make a judgment of the extent to which the ordinary (unsecured) creditor is protected.Another group of financial coefficients helps to determine the dependency of the company on the borrowed capital (how does the company use financial leverage) and therefore to compare the positions of the creditors and owners of the company. The concept of financial leverage states that the successful use of the borrowed capital leads to the increased profits for the owners of the company, since they have the rights to profits obtained by the use of the borrowed capital, which leads to the increase in company’s equity.However, one has to keep in mind that any loans and interest on those loans have to be repaid even in case, if the profits obtained are not enough to cover these payments. The owners of the company always have to cover the claims of the creditors, which can negatively influence the equity of the company. The concept of leverage is therefore a double-edged sword. The positive and negative influence of the financial leverage grows in proportion to the volume of the borrowed capital that the company uses. The risk of the creditor, therefore, also grows in tandem with the risk of the owners. The coefficients in this group include:• Debt to assets ratio is the primary and the most utilized evaluation, which can be made, while evaluating the risk of the creditor. This indicator is calculated by the following formula:Debt to assets ratio = Total Liabilities / Total AssetsThis indicator is calculated for a point in time, but not for a period. It calculates the share of the “other money” in the total amount of claims on the assets of the company. The higher this coefficient, the larger is the probable risk for the creditor. Let us assume, for example, that the results of the computation for the last three years of business operation of Company X are presented (along with several other financial coefficients that will be discussed below) in Table 1.This data indicates that around 50 % of the financial resources at company’s disposal come from the borrowed resources. Naturally, a question arises: whether this is a positive or negative development? This question doesnot have a unanimous answer. Everything depends on the preferences of company’s owners and its management, most importantly, on their attitude to risk. Managers, who are risk averse, will try to achieve lower levels of this indicator and will attempt attracting additional finance by issuing new shares. One the other hand, managers and owners who are risk neutral and have higher tolerance for risk, will attempt to boost the share of borrowed funds in assets, aiming to exploit the positive aspects of financial leverage and increase profits.If a company has a well-developed and positive credit history, creditors will gladly lend money, in spite of the large value of the debt to asset ratio. In practice, this indicator can reach levels as high as 90 %.I f the company is not considered a “reliable borrower” (not necessarily due to a failure to repay obligations, but, for example, due to the fact that the company is newly created), then the debt to asset ratio of 50 % can be considered critical for the company, in a sense, that after that level, the prospective of obtaining additional loan financing is significantly decreased.However, one cannot simply conclude that the coefficient described above is a perfectly correct evaluation of the company’s abilities to repay its debts. The reason for this is that the asset book value (used to calculate the coefficient) does not always correspond to the real economic value of those assets or even the value, for which they can be sold quickly. Apart from that, this coefficient does not provide any insights on the possible changes in profits of the company, which can influence the payments of interest and the repayment of the principal. • Debt to capital ratio is an indicator that is computed based on the proportion between the size of the long-term debt and the size of the capital. This indicator presents the analyst witha clearer picture of risk due to the usage of borrowed funds. In this calculation, capital is defined as the total amount of company’s capital (includi ng common and preferred stock as well as long-term debt), minus the short term liabilities. The coefficient can be computed according to the following formula:Debts to capital ratio = Long-term Liabilities /Total capitalBy definition, capital in this case includes the amount of long-term claims on company’s assets by the creditors as well as the owners but does not include current (short-term) claims. The total amount of those corresponds to what can be called net assets”, if no adjustments have been mad e, such as excluding deferred taxes from the calculation. For example, if deferred taxes have notbeen excluded a calculation of this indicator for the company leads to the results that are summarized in the second line of Table 1.Debt to capital ratio tends to get lower over time, due to the fact that part of the long-term financial liabilities is usually repaid over time. This coefficient gets a large share of attention, because a lot of contracts on lending, whether it’s the private company or a public corporation being financed, contain certain conditions that regulate the maximum share of company’s borrowed capital, which is expressed in terms of the debt to capital ratio.The same characteristics, but in a different ratio, are represented by the indicator of the debt to equity ratio. This indicator is directly related to the previous indicator and can be calculated, with the help of the previous indicator. Consider the following calculation:Let D be the amount of the long-term debt in the company, E – the size of company‘s equity, then DC –debt to capital ratio can be calculated by the following formula:DC = D / (D+E).If we now let, DE to denote debt to equity ratio, such as DE = D/E, then by simple algebraic manipulation, we obtain that:DE = DC / (1 – DC).The value of the debt to equity ratio for Company X is also summarized in Table 1.Using this indicator, one can easily interpret the condition of capital structure. A potential creditor, for example, can clearly see that on January 1st, 2005, company X long term debts are around 22 % of the size of the equity. If the company X has sufficiently high liquidity (that is the ability to repay its short term obligations), then it can be granted additional credit. Note, that if one only had the access to the first ratio considered (debt to assets ratio), it would not have been possible to make that conclusion, because there long-term debtswere not separated from the short-term ones.A number of other ratios can be considered, for example, the previous calculation of the debt to equity ratio can be modified to include current liabilities (short term debts) divided by the total equity of the company. This coefficient represents a yet another way to indicate relative shares in claims of creditors and owners and is also used to determine the dependency of the company on borrowed capital.If the values of this coefficient are significantly higher than the values of the previously described coefficients, then there’s a large share of the short term liabilities in the overall capital structure.Another possible coefficient used in financial ratio analysis is capital to asset ratio, which indicates the share of company’s equity in its assets. The existence of such a variety of coefficients serves to underscore how carefully the rules of financial analysis and conditions that regulate credit access are developed. However, coefficients only serve to provide the first overall idea of the risks and rewards that stem from the usage of the borrowed capital.On the third (also quantitatively oriented) stage of the analysis, the objective of the analyst is to assess the efficiency of capital utilization as a whole, as well as the efficiency of utilizing separate sources of capital. This stage also envisages a set of useful quantitative indicators, which can be calculated and analyzed. These indicators can include:• Capital intensity of production. This indicator aims to show the amount of capital necessary to produce one unit of firm’s output. It is mostly dependent on the natur e of firm’s output (for example, clothes vs. electronics manufacturing). Information about capital intensity is vital for planning firm’s capital requirements in the future.• Capital turnover period.This coefficient is the number of days, in which the company turns over capital that is capital, generates the projected amount of profit. This coefficient can be computed for equity, borrowed capital as well as the total capital of the company. Since every turnover of capital means generating a certain amount of profit, the lower the company manages to make capital turnover period, the more efficient is capital utilization.• Return on equity. This indicator characterizes the amount of earnings generated by a single unit of equity and is one of the most important pieces of information, necessary for decisions on optimizing capital structure.• Return on investment (total capital).This indicator is somewhat equivalent。
How Important is Financial Risk?IntroductionThe financial crisis of 2008 has brought significant attention to the effects of financial leverage。
There is no doubt that the high levels of debt financing by financial institutions and households significantly contributed to the crisis。
Indeed,evidence indicates that excessive leverage orchestrated by major global banks (e。
g。
, through the mortgage lending and collateralized debt obligations)and the so-called “shadow banking system” may be the underlying cau se of the recent economic and financial dislocation。
Less obvious is the role of financial leverage among nonfinancial firms. To date, problems in the U.S. non-financial sector have been minor compared to the distress in the financial sector despite the seizing of capital markets during the crisis。
For example,non-financial bankruptcies have been limited given that the economic decline is the largest since the great depression of the 1930s. In fact,bankruptcy filings of non-financial firms have occurred mostly in U.S。
外文题目:Comparative Research on Capital Structure of Sino-US Investment Banks出处:Bank of Qingdao,P.R.China作者:LIU Ruibo,ZHAI Yinjia原文:Comparative Research on Capital Structure of Sino-US Investment BanksAfter more than 20 years of development, China’s investment banks have demonstrated scale economy characteristics tentatively, and the concentration ratio of capital market improves progressively.Comparing the capital structure of China’s investment banks with that of the USA's,we can see that the shareholders’equity-liabilities ratio of our investment banks is much higher than the American investment banks of the same period,which indicates that the capital structure of China’s investment banks is still unreasonable,and their financing ability is still not strong enough.The future reform is oriented to increase the financing channels of investment banks in capital and securities market。
本科毕业论文(设计)外文翻译原文:The Determinants of Capital Structure ChoiceI. Determinants of Capital StructureIn this section, we present a brief discussion of the attributes that different theories of capital structure suggest may affect the firm's debt-equity choice. These attributes are denoted asset structure, non-debt tax shields, growth, uniqueness, industry classification, size, earnings volatility, and profitability. The attributes, their relation to the optimal capital structure choice, and their observable indicators are discussed below.A. Collateral Value of AssetsMost capital structure theories argue that the type of assets owned by a firm in some way affects its capital structure choice. Scott suggests that, by selling secured debt, firms increase the value of their equity by expropriating wealth from their existing unsecured creditors.Arguments put forth by Myers and Majluf also suggest that firms may find it advantageous to sell secured debt. Their model demonstrates that there may be costs associated with issuing securities about which the firm's managers have better information than outside shareholders. Issuing debt secured by property with known values avoids these costs. For this reason, firms with assets that can be used as collateral may be expected to issue more debt to take advantage of this opportunity.Work by Galai and Masulis , Jensen and Meckling , and Myers suggests that stockholders of leveraged firms have an incentive to invest yet to expropriate wealth from the firm's bondholders. This incentive may also induce a positive relation between debt ratios and the capacity of firms to collateralize their debt. If the debt can be collateralized, the borrower is restricted to use the funds for a specified project. Since no such guarantee can be used for projects that cannot be collateralized, creditors may require more favorable terms, which in turn may lead such firms to use equity rather than debt financing.The tendency of managers to consume more than the optimal level of perquisites mayproduce the opposite relation between collateralized capital and debt levels. Grossman and Hart suggest that higher debt levels diminish this tendency because of the increased threat of bankruptcy. Managers of highly levered firms will also be less able to consume excessive perquisites since bondholders (or bankers) are inclined to closely monitor such firms. The costs associated with this agency relation may be higher for firms with assets that are less collateralized since monitoring the capital outlays of such firms is probably more difficult. For this reason, firms with less collateralized assets may choose higher debt levels to limit their managers' consumption of perquisites.The estimated model incorporates two indicators for the collateral value attribute. They include the ratio of intangible assets to total assets (INT/TA) and the ratio of inventory plus gross plant and equipment to total assets (IGP/TA). The first indicator is negatively related to the collateral value attribute, while the second is positively related to collateral value.B. Non-Debt Tax ShieldsDeAngelo and Masulis present a model of optimal capital structure that incorporates the impact of corporate taxes, personal taxes, and non-debt-related corporate tax shields. They argue that tax deductions for depreciation and investment tax credits are substitutes for the tax benefits of debt financing. As a result, firms with large non-debt tax shields relative to their expected cash flow include less debt in their capital structures.Indicators of non-debt tax shields include the ratios of investment tax credits over total assets (ITC/TA), depreciation over total assets (DITA), and a direct estimate of non-debt tax shields over total assets (NDT/TA). The latter measure is calculated from observed federal income tax payments (T), operating income (OI), interest payments (i), and the corporate tax rate during our sample period (48%), using the following equation:NDT = OI-i-T/0.48which follows from the equalityT= 0.48(0I- i-NDT)These indicators measure the current tax deductions associated with capital equipment and, hence, only partially capture the non-debt tax shield variable suggested by DeAngelo and Masulis. First, this attribute excludes tax deductions that are not associated with capital equipment, such as research and development and selling expenses. (These variables, used as indicators of anotherattribute, are discussed later.) More important, our non-debt tax shield attribute represents tax deductions rather than tax deductions net of true economic depreciation and expenses, which is the economic attribute suggested by theory. Unfortunately, this preferable attribute would be very difficult to measure.C. GrowthAs we mentioned previously, equity-controlled firms have a tendency to invest suboptimally to expropriate wealth from the firm's bondholders. The cost associated with this agency relationship is likely to be higher for firms in growing industries, which have more flexibility in their choice of future investments. Expected future growth should thus be negatively related to long-term debt levels. Myers, however, noted that this agency problem is mitigated if the firm issues short-term rather than long-term debt. This suggests that short-term debt ratios might actually be positively related to growth rates if growing firms substitute short-term financing for long-term financing. Jensen and Meckling, Smith and Warner, and Green argued that the agency costs will be reduced if firms issue convertible debt. This suggests that convertible debt ratios may be positively related to growth opportunities.It should also be noted that growth opportunities are capital assets that add value to a firm but cannot be collateralized and do not generate current taxable income. For this reason, the arguments put forth in the previous subsections also suggest a negative relation between debt and growth opportunities.Indicators of growth include capital expenditures over total assets (CE/TA) and the growth of total assets measured by the percentage change in total assets (GTA). Since firms generally engage in research and development to generate future investments, research and development over sales (RD/S) also serves as an indicator of the growth attribute.D. UniquenessTitman presents a model in which a firm's liquidation decision is causally linked to its bankruptcy status. As a result, the costs that firms can potentially impose on their customers, suppliers, and workers by liquidating are relevant to their capital structure decisions. Customers, workers, and suppliers of firms that produce unique or specialized products probably suffer relatively high costs in the event that they liquidate. Their workers and suppliers probably have job specific skills and capital, and their customers may find itdifficult to find alternative servicing for their relatively unique products. For these reasons, uniqueness is expected to be negatively related to debt ratios.Indictors of uniqueness include expenditures on research and development over sales (RD/S), selling expenses over sales (SEIS), and quit rates (QR), the percentage of the industry's total work force that voluntarily left their jobs in the sample years. It is postulated that RD/S measures uniqueness because firms that sell products with close substitutes ar'e likely to do less research and development since their innovations can be more easily duplicated. In addition, successful research and development projects lead to new products that differ from those existing in the market. Firms with relatively unique products are expected to advertise more and, in general, spend more in promoting and selling their products. Hence, SE/S is expected to be positively related to uniqueness. However, it is expected that firms in industries with high quit rates are probably relatively less unique since firms that produce relatively unique products tend to employ workers with high levels of job-specific human capital who will thus find it costly to leave their jobs.It is apparent from two of the indicators of uniqueness, RD/S and SEIS, that this attribute may also be related to non-debt tax shields and collateral value. Research and development and some selling expenses (such as advertising) can be considered capital goods that are immediately expensed and cannot be used as collateral. Given that our estimation technique can only imperfectly control for these other attributes, the uniqueness attribute may be negatively related to the observed debt ratio because of its positive correlation with non-debt tax shields and its negative correlation with collateral value.E. Industry ClassificationTitman suggests that firms that make products requiring the availability of specialized servicing and spare parts will find liquidation especially costly. This indicates that firms manufacturing machines and equipment should be financed with relatively less debt. To measure this, we include a dummy variable equal to one for firms with SIC codes between 3400 and 4000 (firms producing machines and equipment) and zero otherwise as a separate attribute affecting the debt ratios.F. SizeA number of authors have suggested that leverage ratios may be related to firm size.Warner and Ang, Chua, and McConnell provide evidence that suggests that direct bankruptcy costs appear to constitute a larger proportion of a firm's value as that value decreases. It is also the case that relatively large firms tend to be more diversified and less prone to bankruptcy. These arguments suggest that large firms should be more highly leveraged.The cost of issuing debt and equity securities is also related to firm size. In particular, small firms pay much more than large firms to issue new equity (see Smith) and also somewhat more to issue long-term debt. This suggests that small firms may be more leveraged than large firms and may prefer to borrow short term (through bank loans) rather than issue long-term debt because of the lower fixed costs associated with this alternative.We use the natural logarithm of sales (LnS) and quit rates (QR) as indicators of size. The logarithmic transformation of sales reflects our view that a size effect, if it exists, affects mainly the very small firms. The inclusion of quit rates, as an indicator of size, reflects the phenomenon that large firms, which often offer wider career opportunities to their employees, have lower quit rates.G. V olatilityMany authors have also suggested that a firm's optimal debt level is a decreasing function of the volatility of earnings. We were only able to include one indicator of volatility that cannot be directly affected by the firm's debt level. It is the standard deviation of the percentage change in operating income (SIGOI). Since it is the only indicator of volatility, we must assume that it measures this attribute without error.H. ProfitabilityMyers cites evidence from Donaldson and Brealey and Myers that suggests that firms prefer raising capital, first from retained earnings, second from debt, and third from issuing new equity. He suggests that this behavior may be due to the costs of issuing new equity. These can be the costs discussed in Myers and Majluf that arise because of asymmetric information, or they can be transaction costs. In either case, the past profitability of a firm, and hence the amount of earnings available to be retained, should be an important determinant of its current capital structure. We use the ratios of operating income over sales (OI/S) and operating income over total assets (OI/TA) as indicators of profitability.II. Measures of Capital StructureSix measures of financial leverage are used in this study. They are long-term, short-term, and convertible debt divided by market and by book values of equity.8 Although these variables could have been combined to extract a common "debt ratio" attribute, which could in turn be regressed against the independent attributes, there is good reason for not doing this. Some of the theories of capital structure have different implications for the different types of debt, and, for the reasons discussed below, the predicted coefficients in the structural model may differ according to whether debt ratios are measured in terms of book or market values. Moreover, measurement errors in the dependent variables are subsumed in the disturbance term and do not bias the regression coefficients.Data limitations force us to measure debt in terms of book values rather than market values. It would, perhaps, have been better if market value data were available for debt. However, Bowman demonstrated that the cross-sectional correlation between the book value and market value of debt is very large, so the misspecification due to using book value measures is probably fairly small. Furthermore, we have no reason to suspect that the cross-sectional differences between market values and book values of debt should be correlated with any of the determinants of capital structure suggested by theory, so no obvious bias will result because of this misspecification.Source: Sheridan Titman; Roberto Wessels,1988.“The Determinants of Capital Structure Choice”. The Journal of Finance. Vol.43, No.1, march.pp.1-19.译文:资本结构的影响因素I、资本结构的决定因素在本节中,我们提出了一个简短讨论资本结构的不同理论认为可能会影响公司的债务权益选择的属性。
外文翻译Determinants of Capital StructureMaterial Source: http://journal.fsv.cuni.cz Author:Patrik BAUER The modern theory of capital structure was established by Modigliani and Miller (1958). Thirty-seven years later, Rajan and Zingales (1995,p. 1421) stated: “Theory has clearly made some progress on the subject. We now understand the most important departures from the Modigliani and Miller assumptions that make capital structure relevant to a firm’s value. However, very little is known about the empirical relevance of the different theories.”Similarly, Harris and Raviv (1991, p. 299) in their survey of capital structure theories claimed: “The models surveyed have identified a large number of potential determinants of capital structure. The empirical work so far has not, however, sorted out which of these are important in various contexts.” Thus, several conditional theories of capital structure exist (none is universal), but very little is known about their empirical relevance. Moreover, the existing empirical evidence is based mainly on data from developed countries (G7 countries). Findings based on data from developing countries have not appeared until recently –for example Booth et al. (2001) or Huang and Song (2002). So far, no study has been published based on data from transition countries of Central and Eastern Europe, at least to the extent of this author’s knowledge. The main goal of this paper is to fill this gap, exploring the case of the Czech Republic.1.TheoreticalAccording to Myer s (2001,p.81), “there is no universal theory of the debtequity choice, and no reason to expect one”. However, there are several useful conditional theories, each of which helps to understand the debt-to-equity structure that firms choose. These theories can be divided into two groups –either they predict the existence of the optimal debt-equity ratio for each firm (so-called static trade-off models) or they declare that there is no well-defined target capital structure (pecking-order hypothesis).Static trade-off models understand the optimal capital structure as an optimal solution of a trade-off, for example the trade-off between a tax shield and the costs of financial distress in the case of trade-off theory. According to this theory the optimal capital structure is achieved when the marginal present value of the tax shield on additional debt is equal to the marginal present value of the costs of financial distress on additional debt. The trade-off between the benefits of signaling and the costs of financial distress in the case of signaling theory implies that acompany chooses debt ratio as a signal about its type. Therefore in the case of a good company the debt must be large enough to act as an incentive compatible signal, i.e., it does not pay off for a bad company to mimic it. In the case of agency theory the trade-off between agency costs4 stipulates that the optimal capital structure is achieved when agency costs are minimized. Finally, the trade-off between costs of financial distress and increase of efficiency in the case of free cash-flow theory, which is designed mainly for firms with extra-high free cash-flows, suggests that the high debt ratio disciplines managers to pay out cash instead of investing it below the cost of capital or wasting it on organizational inefficiencies. On the other hand, the pecking-order theory suggests that there is no optimal capital structure. Firms are supposed to prefer internal financing (retained earnings) to external funds. When internal cash-flow is not sufficient to finance capital expenditures, firms will borrow, rather than issue equity. Therefore there is no well-defined optimal leverage, because there are two kinds of equity, internal and external, one at the top of the pecking order and one at the bottom.Existing empirical evidence is based mainly on data from developed countries. For example Bradley et al. (1984), Kim and Sorensen (1986), Friend and Lang (1988), Titman and Wessels (1988) and Chaplinsky and Niehaus(1993) focus on United States companies; Kester (1986) compares United States and Japanese manufacturing corporations; Rajan and Zingales(1995) examine firms from G7 countries; and Wald (1999) uses data for G7 countries except Canada and Italy. Findings based on data from developing countries have appeared only in recent years, for example Booth et al. (2001) or Huang and Song (2002).2. Determinants of Capital Structure2.1 SizeFrom the theoretical point of view, the effect of size on leverage is ambiguous.As Rajan and Zingales (1995, p. 1451) claim: “Larger firms tend to be more diversified and fail less often, so size (computed as the logarithm of net sales) may be an inverse proxy for the probability of bankruptcy. If so, size should have a positive impact on the supply debt. However, size may also be a proxy for the information outside investors have, which should increase their preference for equity relative to debt.”Also empirical studies do not provide us with clear information. Some authors find a positive relation between size and leverage, for example Huang and Song (2002), Rajan and Zingales (1995)7 and Friend and Lang (1988). On the other hand,some studies report a negative relation, for example (Kester, 1986), (Kim – Sorensen, 1986) and (Titman – Wessels, 1988). Moreover, the results are very often weak as far as the level of statistical significance is concerned.2.2 ProfitabilityThere are no consistent theoretical predictions on the effects of profitability on leverage. From the point of view of the trade-off theory, more profitable companies should have higher leverage because they have more income to shield from taxes. The free cash-flow theory would suggest that more profitable companies should use more debt in order to discipline managers, to induce them to pay out cash instead of spending money on inefficient projects. However, from the point of view of the pecking-order theory, firms prefer internal financing to external. So more profitable companies have a lower need for external financing and therefore should have lower leverage.Most empirical studies observe a negative relationship between leverage and profitability, for example (Rajan – Zingales, 1995)8, (Huang – Song, 2002), (Booth et al., 2001), (Titman – Wessels, 1988), (Friend – Lang, 1988)and (Kester, 1986).2.3 TangibilityIt is assumed, from the theoretical point of view, that tangible assets can be used as collateral. Therefore higher tangibility lowers the risk of a creditor and increases the value of the assets in the case of bankruptcy. As Booth et al. (2001, p. 101) state: “The more tangible the firm’s assets, the greater its ability to issue secured debt and the less information revealed about future profits.” Thus a positive relation between tangibility and leverage is predicted.Several empirical studies confirm this suggestion, such as (Rajan –Zingales, 1995), (Friend – Lang, 1988) and (Titman – Wessels, 1988) find. On the other hand, for example Booth et al. (2001) and Huang and Song (2002) experience a negative relation between tangibility and leverage. In this study, tangibility is defined as tangible assets divided by total assets.2.4 Growth OpportunitiesAccording to Myers (1977), firms with high future growth opportunities should use more equity financing, because a higher leveraged company is more likely to pass up profitable investment opportunities. As Huang and Song (2002, p. 9) claim: “Such an investment effectively transfers wealth from stockholders to debt holders.” Therefore a negative relation between growth opportunities and leverage is predicted.Some empirical studies confirm the theoretical prediction, such as (Rajan–Zingales, 1995), (Kim – Sorensen, 1986) or (Titman – Wessels, 1988) report. However, for example, Kester (1986) and Huang and Song (2002) demonstrate apositive relation between growth opportunities and leverage.2.5 TaxAccording to the trade-off theory, a company with a higher tax rate should use more debt and therefore should have higher leverage, because it has more income to shield from taxes. However, for example Fama and French (1998) declare that debt has no net tax benefits. As MacKie-Mason (1990,p. 1471) claims: “Nearly everyone believes taxes must be important to financing decision, but little support has been found in empirical analysis.” As he also points out (MacKie-Mason, 1990, p. 1471): “This paper provides clear evidence of substantial tax effects on the choice between issuing debt or equity; most studies fail to find significant effects. [...] Other papers miss the fact that most tax shields have a negligible effect on the marginal tax rate for most firms. New predictions are strongly supported by an empirical analysis; the method is to study incremental financing decisions using discrete choice analysis. Previous researchers examined debt-equity ratios, but tests based on incremental decisions should have greater power.”As he adds, debt-equity ratios “are the cumulative result of years of separate decisions. Tests based on a single aggregate of different decisions are likely to have low power for effect s at the margin.” (MacKie-Mason, 1990,p. 1472).However, as data to perform similar analysis as (MacKie-Mason, 1990) is not available in the Czech Republic, the average tax rate defined as the difference between earnings before taxes and earnings after taxes, scaled by earnings before taxes, is used as a proxy variable to analyse the tax effects on leverage in this study.2.6 Non-debt Tax ShieldsOther items apart from interest expenses, which contribute to a decrease in tax payments, are labelled as non-debt tax shields (for example the tax deduction for depreciation). According to Angelo –Masulis(1980, p. 21): “Ceteris paribus, decreases in allowable investment-related tax shields (e.g., depreciation deductions or investment tax credits)due to changes in the corporate tax code or due to changes in inflation which reduce the real value of tax shields will increase the amount of debt that firms employ. In cross-sectional analysis, firms with lower investment related tax shields (holding before-tax earnings constant) will employ greater debt in their capital structures.” So they argue that non-debt tax shields are substitutes for a debt-related tax shield and therefore the relation between non-debt tax shields and leverage should be negative.Some empirical studies confirm the theoretical prediction, for example Kim and Sorensen (1986, p. 140) declare: “DEPR9 has a significantly negative coefficient. [...] This is consistent with the notion that depreciation is an effective tax shield, and thus offsets the ta x shield benefits of leverage.” A negative relation between non-debt tax shields and leverage is also found by (Huang – Song, 2002) and (Titman – Wessels, 1988). However, for example Bradley et al. (1984) and Chaplinsky and Niehaus(1993) observe a positive relationship between non-debt tax shields and leverage. Depreciation divided by total assets is used in order to proxy for non-debt tax shields in this study.2.7 V olatilityV olatility may be understood as a proxy for risk of a firm (probability of bankruptcy). Therefore it is assumed that volatility is negatively related to leverage. However, as Huang and Song (2002, p. 9) state based on findings of Hsia (1981): “As the variance of the value of the firm’s assets increases, the systematic risk of equity decreases. So the business risk is expected to be positively related to leverage.”The positive relation between volatility and leverage is confirmed by (Kim–Sorensen, 1986) and (Huang –Song, 2002). Conversely, a negative relation is found by (Bradley et al., 1984) and (Titman –Wessels, 1988).In this study, standard deviation of return on assets is used as a proxy for volatility.2.8 Industry ClassificationSome empirical studies identify a statistically significant relationship between industry classification and leverage, such as (Bradley et al., 1984),(Long –Malitz, 1985), and (Kester, 1986). As Harris and Raviv (1991, p. 333)claim, based on a survey of empirical studies: “Drugs, Instruments, Electronics, and Food have consistently low leverage while Paper, Textile Mill Products, Steel, Airlines, and Cement have consistently large leverage.”译文资本结构的决定因素资料来源:http://journal.fsv.cuni.cz作者:Patrik BAUER 现代资本结构理论的建立始于Modigliani和Miller(1958)。
外文题目:How firm characteristics affect capital structure:an empirical study出处:Managerial Finance作者:Nikolaos Eriotis原文:How firm characteristics affect capital structure: an empirical studyBy Nikolaos EriotisIntroductionThe various financing decisions are vital for the financial welfare of the firm. A false decision about the capital structure may lead to financial distress and eventually to bankruptcy. The management of a firm sets its capital structure in a way that firm’s value is maximized. However, firms do choose different financial leverage levels in their effort to attain an optimal capital structure. Although theoretical and empirical research suggests that there is an optimal capital structure, there is no specified methodology, yet, that financial managers can use in order to achieve an optimal debt level. However, financial theory does provide some help in understanding how the chos en financing mix affects the firm’s value.This paper shed some light on the determinants of the capital structure of the major Greek firms listed on the Athens Stock Exchange (ASE). We examine the cross sectional variation in leverage among the Greek firms for the time period 1997-2001. We include variables that are based on different capital structure theories and have never been investigated for the Greek market before, such as the interest coverage ratio and the quick ratio. We also differentiate the firms that heavily use debt capital (i.e. a debt ratio more than 50 per cent) using a dummy variable. Thus, the conclusions of this paper are expected to enlighten the darksome scientific area of the capital structure determination for the Greek firms.The paper is organized as follows. In the next session, we review some of the theoretical and empirical literature concerning the determinants and effects ofleverage. In section 3, we describe our data and we justify the choice of the variables used in our analysis. The fourth section presents the result of the empirical analysis and a discussion of the conclusions that can be derived from the results. Finally, we summarize our findings in the last section.Theoretical backgroundModigliani and Miller (1958) were the pioneers in theoretically examining and algebraically demonstrating the effect of capital structure on firm value. Assuming perfect capital markets, they concluded to the broadly known theory of ‘‘capital structure irrelevance’’ which means that the capital structure that a firm chooses does not affect its value. Thereafter, many researchers, including Modigliani and Miller, examined the effects of less restrictive assumptions on the relationship between capital structure and the firm’s value. For ex ample, Modigliani and Miller (1963) took taxation under consideration and they proposed that firms should employ as much debt capital as possible in order to achieve the optimal capital structure. Along with corporate taxation, researchers were also interested in analyzing the case of personal taxes imposed on individuals. Miller (1977) discerns three tax rates in the tax legislation of the USA that determine the total value of the firm. These are the corporate tax rate, the tax rate imposed on the income of the dividends and the tax rate imposed on the income of interest inflows. According to Miller, the value of the firm depends on the relative height of each tax rate, compared with the other two.Data and measurement of variablesIn this paper, we investigate the determinants of capital structure for the firms listed in the ASE market during the period 1997-2001. All the companies included in the sample fulfill the following two criteria; they were all listed in the market in 1996 and none of them was expelled during the period 1997-2001. These criteria were imposed to ensure that the capital structure was not distorted by the effects of a recent official listing. We form our variables using data derived from the financial statements contained in the ASE database. The final sample, after considering any missing data, consists of 129 firms. This figure represents the 63 per cent of the listed companies on the ASE in 1996. Thus, our sample consists of a significant proportion of the listedfirms in the ASE during the five-year-period 1997-2001.Our dependent variable is the debt ratio (variable: DR i,t) which is defined as the ratio of total debt divided by the total assets of the firm. Total debt contains both long-term and short-term liabilities. Although the strict notion of capital structure refers exclusively to long-term leverage, we have decided to include short-term debt as well, mainly because Greek firms use either very little – less than 10 per cent – or no long-term capital. Banks in Greece are hesitant in providing long-term financing with attractive terms. Therefore, Greek firms turn to short-term borrowing even when financing their long-term investments. That is why we also consider short-term financing as a measure of gearingThe modelIn order to combine cross-sectional with time series data and formulate the characteristics of the market, we use pooling methods for our panel data. The models for panel data are powerful research instruments, which give the researcher the ability to take in to account any kind of effect that the cross-sectional data may have, and finally to estimate the appropriate empirical model. A general model for panel data that allows the researcher to empirically estimate the relation between dependent and independent variables with great flexibility and formulate the differences in the behavior of the cross-section elements is theoretically as follows[5]:where yit is the dependent variable, xi the matrix with the independent variables and zi a matrix which contains a constant term and/or a set of individual or group specific variables (depending on the sample), which may be observed or unobserved.Empirical resultsIn order to estimate the effect of the independent variables on the dependent and to improve our results we consider the three different econometric approaches presented in the previous section. Under the hypothesis that there are no group or individual effects among the firms included in our sample we estimate the total model. The results are presented in Table I. The diagnostics provide us with useful resultsconcerning the theoretical model presented in equation 1. All the variables proved to be significant in confidence level of 5 per cent. The power of the model is given by the high F-statistic of 1,352.4. According to adjusted R2 the independent variables explain the 92 per cent of the size in the debt ratio.In the analysis of panel data, where cross-section combined with time series data, there might be cross-section effects on each firm or on a set of groups of firms. There are two procedures to deal with those effects and each of them has already presented in the beginning of section 4. These two approaches are the random and the fixed effects models for panel data. The case where all the effects are uncorrelated with the regressors and can be formulated as constant terms for each individual or group of firms in the known matrix z, is presented in Table II. The diagnostics from the random effects model suggest that the variable of growth is not statistically significant and does not affect the debt ratio. The adjusted R2 is lower than that of the total model at 83.5 per cent.In random effects model there are three assumptions about the cross-section effects. The first is that there exist group or individual effects, the second that those effects are uncorrelated with the independent variables and the third that the effects can be formulated. The case where the major assumption about the effects does not hold (i.e. there are no effects) has already presented in Table I. The next step is to stay consistent with the major assumption, there are effects, and relax the last two restrictions concerning them. The results from the fixed effect model are presented in Table III. According to Table III all the independent variables of our model are statistically significant at 5 per cent. The F-statistic proves the high explanatory power of the estimated model and the high R2 (adjusted) indicates that the estimated model explain the 97.2 per cent of the size in the dependent variable. According to our findings there is a contradictory result concerning the variable of growth. The total and the fixed effects model accept this variable but the random effects model does not. These controversial results indicate that further analysis has to be done. As we mention in section 4 the random effects model assumes that the individual effects are uncorrelated with the independent variables. In consequence, the random effectsmodel may suffer from inconsistency as a result of omitted variables, something that does not happen with the fixed effects model. On the other hand, the fixed effects model uses the individual effects as given by the sample. In order to see if the individual effects are uncorrelated with the regressors we perform a Hausman test. The test statistic is 565.3 and the critical value of the chi–square table with five degrees of freedom, at 95 per cent, is 11.7, which is lower than the test’s value. Hence, the hypothesis that the individual effects are uncorrelated with the regressors can be rejected. The random effects model estimates suffer from inconsistency probably due to omitted variables (see section 4). Hence, according to our sample and findings, the appropriate model to explain the market is the one that includes the GROWTH variable. According to our findings the SIZE of the firm has a positive relation with the debt ratio, something that has been confirmed by Marsh (1982) and Bennett and Donnelly (1993), which found similar results with us. This suggests that larger firms use more debt. The short-term leverage coverage is an indication of the liquidity of the firm. As we expected there is a negative relation between the debt ratio of the firm and its liquidity. The negative relation confirms that firms finance their activities following the financing pattern implied by the ‘‘pecking order’’ theory. As we expected the negative relation between debt and growth has been confirmed from our data. The statistical significance of the dummy variable and its positive sign indicate that there is a distinction in the capital structure between firms who have debt ratio greater than 50 per cent and those that do not have. According to our results from the fixed effects model these firms use, compared to the market, an extra debt of 19 per cent.ConclusionsIn this study, we conduct our analysis in order to investigate how some specific firm characteristics determine the firm’s capital structure.We use the panel data derived by the financial statements of 129 Greek firms listed in the ASE. In ourcalculations we consider the total model, the fixed effects model and the random effects model. Our dependent variable is the debt ratio expressed as total liabilities divided by total assets. The debt ratio includes both long-term and short-term liabilities mainly because Greek firms use either very little or no long-term debt capital at all. According to the results, the debt ratio of the firm is positively related to its size which is measured by the sales figure. Thus, larger firms employ more debt capital in comparison with smaller firms, a finding which is consistent with the theoretical background mentioned in the second section of the paper.On the other hand, our findings show that the liquidity of the firm is negatively related to its financial leverage. We consider the liquidity of the firms using the quick, or acid test ratio which is equal to current assets minus inventories divided by current liabilities. This ratio shows the ability of the firm to deal with its short-term liabilities. Firms with high liquidity tend to use less debt. This finding can be considered as an indication that firms generally finance their activities following the financing procedure implied by the pecking order theory. Firms with high liquidity maintain a relatively high amount of current assets, which means that they maintain high cash inflows. This means that they also generate high cash inflows. As a consequence, they are able to use these inflows in order to finance their operating and financing activities. Thus, they do not use much debt capital in comparison with firms that are not so profitable because they prefer to use these funds rather than debt capital; this is an indication of pecking order financing. This finding is further supported by the result of the negative relation between the interest coverage ratio of the firms and their capital structure. The interest coverage ratio is expressed as net income before taxes divided by interest payments. Thus, firms that maintain a relatively high interest coverage ratio prefer to use less debt capital. If a firm has a high interest coverage ratio, this means that it has the ability to generate relatively high earnings. The negative relation implies that firms probably prefer to use these earnings to finance their activities and thus use less debt capital; this is also an implication of the pecking order financing. The negative relation between the growth of the firm and its capital structure shows that firms with high growth potential employ less debt in their capitalstructure. We proxy our growth measurement as the annual change on earnings. Thus, high growth means high variation in earnings which can be interpreted as higher risk. Firms that are risky generally find it difficult to raise debt capital, simply because the lenders will demand higher returns making debt capital more expensive. According to the results of the dummy variable, we find strong evidence that there is a capital structure differentiation among the firms which heavily use debt capital (more than 50 per cent of their total assets) and those that use less debt capital.The results and conclusions are consistent with the theoretical background as presented in the second section of the present paper. All the three models conclude in the same remarks except for the situation of the growth variable. The growth variable is not statistically significant in the random effects model, but it is in the other two models. However, the Hausman test indicates that the fixed effects model fits better to our specific set of variables and thus prevails over the random effects model. Thus, growth does affect the determination of capital structure.外文题目:How firm characteristics affect capital structure:an empirical study出处:Managerial Finance作者:Nikolaos Eriotis译文:关于公司特征如何影响资产结构的实证研究简介多样化融资决策对公司的金融福利是至关重要的。
中文3160字 1外文翻译原文Cap ital structure influencing factor analysis research Material Source:Theory of Op timal Ca pital StructureAuthor : R. BareaSince the Modigliani and Miller (1958) since the academic structure of the capital a large number of theoretical and empirical research, trying to identify the potential impact of capital structure choice factors. A lot of literature suggests that the choice of cap ital structure by the asset structure, firm size, non-debt tax shields, growth, volatility, p roduct uniquen ess, p rofitability and other firm characteristics factors. In addition, the choice of capital structure is also affected by industry characteristics, macroeconomic and institutional environment factors. Harris and Raviv (1991) from the exp erie nee of many U.S. companies to sum up: "leverage ratio of fixed assets, non-debt tax shields, growth and company size in creases, with the volatility, advertis ing costs, bankruptcy the po ssibility of p rofitability and p roduct uniquen ess in creases less."Chin ese listed companies due to the p articularity of the system, what factors determ ine thechoice of cap ital structure? Characteristics of in stituti onal factors in flue need how the company cap ital structure choice? Exp erie nces and things like that to be the model and emp irical test.In recent years, researchers bega n to affect the cap ital structure of listed companies in an emp irical study offactors, such as Lu Zhengfei, and Xin Yu (1998), Lishan Min and Su Yun (1999),Xiaozuo Ping and Wu Shinong (2002), and achieved certain results, However, most studies are using a simple regressi on tech nique factors on cap ital structure for emp irical an alysis. Titma n andWessels (1988) poin ted out the shortco mings of this app roach: First, there is no wish to measure the sole rep rese ntative of the prop erty; Secon d, it is difficult to find and other releva nt prop erty is not related to the measureme nt of a p articular prop erty; third, As can be observed variable is not perfectly representative of its properties should be measured, they are used in the regression an alysis will lead to errors in variable p roblem; fourth, the age nt variables and measureme nt error 2 may be explained by variables related to measureme nt error will p roduce false (Sp urious) related.In this paper, two-stage mult iple pro cedures, app licati on of factor an alysis-based model to reduce measureme nt error, to expand the cap ital structure of Chin ese listed companies Emp irical Study.Cap ital StructureTo build the emp irical model, the author accord ing to the cap ital structure theory and releva nt empirical research on factors affecting capital structure analysis, and gives a proxy variable to cap ture these factors.I,the asset structure Age ncy theory, bala nee theory and the theory of asymmetric in formati on are con sidered assets for cap ital structure choice. Accord ing to age ncy theory, high-leverage the company's shareholders tend to sub-optimal investment (Jensen and Meckling, 1976; Myers, 1977). The assets of the company secured an opportun ity to limit such behavior. Therefore, the value of assets and leverage are related to security. Ano ther p roblem comes from a proxy service man agers tend to consump tio n. Assets can be secured with fewer companies more vuln erable to such age ncy costs, because these companies on the cap ital expen diture mon itori ng more difficult (Grossma n and Hart, 1982). Companies can in crease the level of debt as a mon itori ng tool to mitigate this p roblem. Therefore, security assets and leverage can be n egative. Theory from the bala nee with debt secured creditors to reduce the poten tial loss of the debtor's in solve ncy and, therefore, limit the amount of shareholder wealth, occupation of the debtor. Meanwhile, in bankruptcy the value of tan gible assets higher tha n the value of intan gible assets. Therefore, the value of assets and leverage are related to security. Un der asymmetric in formatio n theory, tan gible assets, more bus in esses will face less in formatio n asymmetry, therefore, should issue equity rather than debt. And the existe nee of asymmetric in formati on, to the sale of secured debt had a n egative because it reduces in formatio n premium. For asset structure, we use stock / total assets (INV) andfixed assets / total assets (FIX) two proxy variables.more stable II,firm size Many studies suggest that large companies tend to diversify, with cash flow, so low probability of bankrup tcy. Warner (1997), An gclua and Meco nn el (1982) study found that direct costs of finan cial distress and n egatively related to firm size. Fama and Jensen (1983) that large corpo rati ons to smaller companies tend to p rovide more in formati on on len ders.Therefore, less mon itori ng costs of large 3 compani es, large companies tha n small companies with high borrow ing cap acity. Therefore, firm size should be po sitively correlated with leverage. AndRajan and Zin gales (1995) that the large companies tha n small companies tend to p rovide more in formatio n to the p ublic, may be related to internal in vestme nt company size and level of exter nal investment in human negative correlation of asymmetric information. Under asymmetric information theory, large companies should be inclined to equity financing and therefore have lower leverage. The size of the company, we use the n atural logarithm of total assets (LN (TA)) and the main bus in ess in come of the n atural logarithm (LN (S)) of two proxy variables.Ill, the tax That the use of tax-based model of the main ben efits of debt financing is tax credits. Accord ing to tax-based theory, companies with higher marg inal tax rates should use more debt to get the tax shield ben efits. Therefore, the effective marg inal tax rates should be po sitively correlated with leverage. Un able to obta in releva nt data to calculate the marg inal tax rate, we use the average tax rate (TAX) to an alyze the tax imp act of cap ital structure choice.IV,non-debt tax shield DeAn gelo and Masulis (1980) that non-debt tax shield can be used as an alter native to debt financing, tax ben efits, the same as in other cases, the non-debt tax shields have more compan ies should use less debt. Barton et al (1989), Prowse (1990), Wald (1999), Kim and Sorensen (1986) research shows that non-debt tax shields and leverage n egative .In this paper, dep reciati on / total assets as non-debt tax shield (DE P) of the p roxy variables.V.Growth Accord ing to age ncy theory, equity-c on trolled companies tend to sub-op timal in vestme nt will be dep rived of their wealth came from the hands of creditors. For high growth compani es, because of its future in vestme nt opportun ities in the choice of greater flexibility, these companies may be more serious agency problems. Myers (1977) that high growth companies lower the future investment in growth companies have more options. If the high-growth companies n eed exter nal equity financing op ti ons to imp leme nt in the future, the n the company has a large debt may give up this opportuni ty, because such in vestme nt will tran sfer wealth from shareholders to creditors of the body, which produces the problem of insufficient investment.Therefore, growth should be n egatively correlated with leverage. For growth, this growth rate with total assets (GRTA) and the equity value-added rate (GREQ) two 4 proxy variables.VI,volatility Regular p ayme nt of debt obligati ons in volved, the highly leveraged company is more vuln erable to finan cial distress costs. Finance theory suggests that the risk of the company or bankrupt companies should not have a high probability of higher leverage. Therefore, the main bus in ess in come volatility or commercial risk as the po ssibility of occurre nee of finan cial distress p roxy variables, which should be n egatively correlated with leverage. Bradley et al (1984), Titma n and Wesssels (1988), Wald (1999) and Booth et al (2001) and other studies have shown that volatility n egatively correlated with leverage. In this paper, the mai n bus in ess of the sta ndards slip ((VOL) as a proxy for volatility.VII ability to gen erate internal resources Trade-off theory is that ability to gen erate internal resources to leverage a po sitive correlati on, because a stro ng ability to gen erate internal resources, companies choose higher leverage to get more debt tax shield. Jensen (1986) pointed out that in stead of borrow ing to pay divide nds to en sure that the man ageme nt disci pli ne empire method.The ben efits of debt "ca n imp rove the efficie ncy of man agers and their orga ni zati on s", which act as a "con trol effect" role. Therefore, the company has a large free cash flow should have higher debt to limit management's discretion. According to the Theory of Optimal Financing (Pecking order theory), because the existe nee of asymmetric in formati on, the company follows the financial p eck ing order model: companies p refer internal resources, internal resources have bee nexhausted if the company was to issue debt, and fin ally the issue of equity. Therefore, the ability to gen erate internal resources, n egatively correlated with leverage. The ability to gen erate internal resources, this paper, the cash rate of sale (NOCFS) and total assets of cash recovery rate (NOCFA) two p roxy variables, but to test the Jensen (1986) free cash flow hypo thesis propo sed in this paper with a cash rate of sales / total Asset growth rate (FCFS) and total assets of cash recovery rate / total assets growth rate (FCFA), as free cash flow (Note: free cash flow is difficult to qua ntify, can not be obta ined directly from the finan cial data, must be used in other emp irical research cash flow concept, and in line with the growth of the company (such as TobinQ growth rate of total assets), investment opportunities, free cash flow and other indicators in order to explain the problem.) p roxy variables.VIII, product uniqueness 5 From the stakeholder theory of capital structure and product / factor market theory perspective, the company has a unique product should have less leverage.Titma n and Wessels (1988) that, in liquidati on, the p roduct ion of unique or sp ecialized p roducts company, its customers, suppliers, workers will suffer from higher costs. Their workers and suppliers may have the skills and capital, job characteristics, and the customer service more difficult to find a replacement phase. From the agency cost perspective, the expected cost of empio yees look ing for work p roducts and services depends on whether there is uniq ue. Empio yees work ing on the imp leme ntati on of mass-s pecific work with resp ect to empio yees en gaged in the former expected to find lower cost. Therefore, when other conditions being equal, and human-related costs for the agency to provide specialized products and services relative to the companies higher. Due to higher leverage will have higher age ncy costs and bankruptcy costs, so the uniquen ess of p roducts and services will affect the degree of cap ital structure choice. These companies pro mote their unique p roducts will suffer more sales costs and advertis ing costs. In this paper, op erati ng expen ses / In come from principal op erati ons (SEX P) as a proxy for p roduct uniquen ess.IX liquidity Current ratio of cap ital structure choice is mixed. On the one hand, high flow rate paid by the company short-term debt due ability. Therefore, liquidity should be positively correlated with leverage. On the other hand, companies with more liquid assets may use these assets to finance its investments. Therefore, the flow of state assets would negatively affect leverage. And, as Prowse (1990) points out, can be used to in dicate the liquidity of the assets to creditors, the in terests of shareholders to manipu late the expense of the exte nt of these assets. In this paper, the curre nt ratio (CR) and the quick ratio (QR) as a proxy for liquidity.Ten, in dustry characteristics The asset risk, asset type, and the dema nd for exter nal funds vary by industry, the average leverage will vary with the industry. Industry characteristics and cap ital structure characteristics of the fact that the leverage with in the same in dustry in differe nt sectors of the lever more tha n the similar, leverage levels to rema in relatively the same in dustry (Bowen et al, 1982; Bradley et al 1984). Bradley et al (1984) studies have show n that regulated in dustries (telecom muni cati ons, electro nics, utilities and aviati on in dustry) with higher leverage.This article uses the in dustry dummy variables to con trol the imp act of in dustry factors on the lever.2、译文资本结构影响因素的分析研究资料来源:最优资本结构原理作者:巴里亚自Modigliani和Miller(1958)以来,学术界对资本结构进行了大量的理论和实证研究,试图辨别影响资本结构选择的潜在因素。