A Redshift Survey of the Submillimeter Galaxy Population
- 格式:pdf
- 大小:849.91 KB
- 文档页数:29

2025届高三英语下学期模拟试题11(含解析)(满分:120分,时间:100分钟)第一部分阅读理解(共两节,满分50分)第一节(共15小题;每小题2.5分,满分37.5分)阅读下列短文,从每题所给的A、B、C、和D四个选项中,选出最佳选项。
AVehicles often come into conflict with other vehicles and pedestrians when their intended courses of travel intersect(交叉), and end up being in each other's way. The general principle that establishes who has the right to go first is called “right of way”,or “priority”. It determines who has the right to use the conflicting part of the road and who has to wait. Signs, signals, markings and other features are often used to make priority clear.A driver must yield(让行) the right of way to other drivers:●When approaching a YIELD sign. Slow down or stop to avoid a crash.●Even after the light turns green when there are vehicles in the i ntersection.●When approaching emergency vehicles using sounding or flashing sirens.●After coming to a complete stop at an intersection where there is a stop sign or a flashing red signal. If there is no stop line, stop before the crosswalk.●When making a left turn on a red light after a stop from a oneway street to another oneway street with traffic moving to the left. (See Figure A.)●When two vehicles on different roadways arrive at a four way stop intersection at the same time, the vehicle should yield to the vehicle on its night. (See Figure B.)●When coming out of an alley, building, private road or driveway after coming to a complete stop. (See Figure C.)●When crossing traffic at the end of a “T” road with no traffic control signs or signals. (See Figure D.)1.What's the purpose of the text?A.To explain the law of right of way. B.To illustrate traffic signs and signals.C.To inform drivers of general traffic rules. D.To introduce traffic rules to pedestrians.2.Which is the right behavior according to the text?A.Drive on once the light turns green. B.Keep driving if there is no stop line.C.Yield to emergency vehicles at any time. D.Slow down when approaching a YIELD sign.3.Which of the following description is TRUE according to the figures?A.Figure A:B should yield to A. B.Figure B:A should yield to B.C.Figure C:A should yield to B. D.Figure D:A should yield to B.B[2024·贵阳市高三适应性考试(一)] Elena Griffing has just spent her 72nd year working for the same San Francisco Bay Area hospital, and she has no plans to stop working anytime soon. The hospital has seen her recent 92nd birthday.For Griffing, who has held several different positions in her decades of employment, every day on the job is a celebration. She can't wait to go to work every day and likes doing anything to help patients and others. She has taken only four days of sick leave in her 72 years of work.On a Sunday about 17 years ago, she had her appendix(阑尾) cut off at the Berkeley facility. The following day, she put on her dress, walked one floor down from her hospital room and got to work. But when the doctor got wind, he sent her home.Griffing's first day on the job was April 10, 1946, when she was 20. She worked there with founder and nurse Alta Alice Miner Bates. Her first job in the hospital was in the lab, where a woman's urine(尿) was put into animals like frogs and rabbits to determine if she had a baby. Griffing was the_righthand_woman_to_the_doctor and quickly becameexperienced in the job.Now, she is living a regular and comfortable life, enjoying gardening, jazz and coming to work. If she has her way, she'll keep working “until they throw me out or they carry me out in a box”.4.What does Griffing think about her work in the hospital?A.It is a moneyearning job. B.It is a birthday celebration.C.It is enjoyable. D.It is helpful to her illness.5.What does the underlined part “the righthand woman to the doctor” mean?A.The woman newly being a doctor.B.The woman good at helping the doctor.C.The woman good at using the doctor's right hand.D.The woman knowing nothing about the doctor.6.When will Griffing probably stop working?A.When she is 94 years old. B.When she is dead.C.When she is 72 years old. D.When her appendix is cut off.7.Which of the following is the best title for the passage?A.Never Too Old to Work B.A Righthand WomanC.The Oldest Woman in the Hospital D.An Old Woman Without Her AppendixC[2024·青岛市质量检测] The long, white robot weighs more than 450 kilograms. Like other robots, it is equipped with cameras and mechanical arms to automatically perform many different jobs.Angus is a major part of operations at Alexander's indoor robot farm about 40 kilometers south of San Francisco. The 743squaremeter farm uses a hydroponic system that grows plants without soil. The plants grow inside equipment that provides a continuous flow of water. The indoor farm uses electrical light instead of sunlight.This kind of farm uses much less water and does not require human labor to run. The main job for Angus is to move thousands of plants around the farm, from small containersto larger ones as they grow. Angus also carries plants to another robot that does not have a name yet. Angus moves slowly to complete its work. But the robot is very strong and can lift about 300 kilograms.For now, the farm uses humans to collect vegetables and other crops when they are ready. But Alexander says he is working on a robot that will eventually take over that job too.Alexander helped start the company Iron Ox after leaving Google, where he worked on robotics at the company's Google X project. He teamed up with another former Google employee, Jon Binney. Together they founded Iron Ox.Iron Ox's website says the hydroponic growing system uses 90 percent less water. It also says the growing method is up to 30 times more productive than growing crops on land.Alexander says growing food robotically throughout the year in major cities will provide more consistent and fresh products. Most of the vegetables sold in the U.S. are grown in California, Arizona, Mexico and other nations. That means that many people in the U.S. cities are eating vegetables that are nearly a week old by the time they arrive at stores.Indoor farms operate all year round and are not generally affected by bad weather. This will permit the company to provide a steady flow of goods without major price changes. 8.How does Angus work in the farm?A.It provides a continuous flow of water for the plants.B.It directs other robots to work in the farm.C.It works on collecting vegetables.D.It is in charge of transferring plants.9.What do we know about Alexander?A.He used to work on robotics at Google.B.He started a company studying robotics with Binney.C.He works on collecting crops when they are ready.D.He started Iron Ox by himself.10.What's the advantage of Alexander's farm?A.The vegetables from his farm sell at a higher price.B.The vegetables from his farm are more nutritious.C.It uses electrical light instead of sunlight.D.It uses less water but produces more.11.Which of the following can be a suitable title for the test?A.Robot Farm, the Future of the AgricultureB.Robot Farm, Aiming to Bring Fresher Food to the U.S. CitiesC.Alexander, an Extraordinary Scientist on RoboticsD.Hydroponic System, the New Way of FarmingD[2024·陕西省部分学校第一学期摸底检测] While we may think it feels good to complain, complaining has some bad effects associated with it.Why isn't complaining beneficial? Research shows that it connects our brain with negativity. The brain is designed to work efficiently. This means that when we repeat a thought, negative or positive, the nerve cells form a bridge between each other to pass information in a higher speed. Therefore, the next time we have a similar type of thought, it is more easily passed. This explains why certain thought patterns become habits.Yet the harmful effects don't stop there. A study show that complaining causes the hippocampus(海马), which plays a vital role in problemsolving, to become smaller.In addition to causing brain damage, complaining also releases a stress hormone:cortisol(皮质醇), a kind of chemical the body produces when we meet with some danger. Constantly having a high level of cortisol results in high blood pressure, high blood sugar, and lower immunity(免疫力).The ill effects of our complaining aren't just limited to ourselves:they also involve those around us. We tend to mirror the moods of our friends. For this reason, we should be cautious about having stubborn complainers in our circle of companions.The best way to deal with constant negativity is to develop a sense of gratitude. Just like complaining acts as a poison, gratitude acts as a medicine. Research shows it lowers cortisol levels by 23 percent, as well as reduces blood pressure and blood sugar. It also decreases tiredness and depression. Gratitude is the perfect cure for complaining, a behavior that steals our brain power, happiness and physical wellbeing.What have you observed about the effects of complaining in your own life or in the lives of others? Have you noticed that when you are grateful, you feel better all round? Please share your thoughts in the comments section below.12.What do Para. 2 and Para.3 mainly talk about?A.The diseases caused by complaining.B.The decrease of a vital part of our brain.C.The bad effects of complaining on brain power.D.The reason why certain thought patterns become habits.13.What can we know about cortisol from the passage?A.Gratitude is an effective cure for cortisol.B.Our body produces cortisol when we feel excited.C.Cortisol is a chemical that can cause brain damage.D.Having a high level of cortisol can lead to many health problems.14.What attitude does the writer take to stubborn complainers?A.Grateful. B.Tolerant. C.Disapproving. D.Skeptical. 15.Where can the passage most probably appear?A.In a newspaper. B.In a medical report.C.On a website. D.In a radio program. 其次节(共5小题;每小题2.5分,满分12.5分)依据短文内容,从短文后的选项中选出能填入空白处的最佳选项。

高二英语科研项目实施困难重重练习题30题答案解析版1.The research project is full of _____.A.difficultiesB.easinessC.simplicityD.lightness答案解析:A。
“difficulties”表示困难,符合科研项目充满困难的语境。
“easiness”是容易;“simplicity”是简单;“lightness”是轻。
这三个选项都不符合科研项目充满困难的意思。
2.They encountered many _____ in implementing the research project.A.obstaclesB.advantagesC.benefitsD.strengths答案解析:A。
“obstacles”表示障碍,在实施科研项目中会遇到很多障碍,符合语境。
“advantages”是优势;“benefits”是好处;“strengths”是力量。
这三个选项都与遇到困难不相符。
3.The research project faced a series of _____.A.challengesB.opportunitiesC.luckD.fortune答案解析:A。
“challenges”表示挑战,科研项目面临一系列挑战,也就是困难。
“opportunities”是机会;“luck”是运气;“fortune”是财富。
这三个选项都不符合题意。
4.There are numerous _____ in carrying out this research project.A.hindrancesB.helpsC.aidsD.assists答案解析:A。
“hindrances”表示阻碍,实施这个科研项目有很多阻碍,即困难。
“helps”是帮助;“aids”是援助;“assists”是协助。
这三个选项都不是困难的意思。
5.The research team overcame many _____.A.troublesB.pleasuresC.happinessD.joys答案解析:A。

高二英语科研项目实施单选题40题(带答案)1.In the scientific research project, we need to collect data _____.A.accuratelyB.exactlyC.preciselyD.correctly答案:A。
“accurately”强调准确地,在科研项目中收集数据需要准确无误。
“exactly”表示确切地、完全地;“precisely”精确地,和“accurately”意思较为接近但在科研收集数据的场景下,“accurately”更常用;“correctly”正确地,通常用于方法等正确,不太符合收集数据的语境。
2.When presenting the research results, we should express our ideas _____.A.clearlyB.obviouslyC.apparentlyD.visibly答案:A。
“clearly”清晰地,在展示研究结果时要表达清晰。
“obviously”明显地;“apparently”显然地;“visibly”看得见地,后三个选项不太符合表达想法的语境。
3.The scientific research project requires ______ teamwork.A.cohesiveB.unitedC.cooperativeD.joined答案:C。
“cooperative”合作的,科研项目需要合作的团队合作。
“cohesive”有结合力的;“united”联合的;“joined”连接的,这三个选项不太符合团队合作的语境。
4.We must analyze the data ______ to draw accurate conclusions.A.thoroughlypletelyC.entirelyD.wholely答案:A。
“thoroughly”彻底地,分析数据需要彻底才能得出准确结论。

高中英语学术研究单选题30题1.The research paper is highly ______.A.accurateB.exactC.preciseD.correct答案:C。
“accurate”侧重于准确无误,一般指数据等的准确性;“exact”强调精确、确切,丝毫不差;“precise”更强调细致、精确到细节,在学术语境中形容研究论文的严谨和精确性更合适;“correct”只是正确的意思,范围比较宽泛。
2.In academic research, we need to be ______ in our methods.A.thoroughpleteC.entireD.whole答案:A。
“thorough”表示彻底的、全面的,在学术研究中强调方法的全面性和细致性;“complete”侧重于完整,不缺任何部分;“entire”和“whole”都表示整个的,通常用于形容整体,不太适合形容方法。
3.The data analysis should be ______.A.meticulousB.carefulC.cautiousD.prudent答案:A。
“meticulous”强调极其细心、一丝不苟,在学术研究中的数据分析需要这种细致;“careful”只是一般的小心;“cautious”和“prudent”更多的是谨慎,不一定是在细心方面。
4.The scholar is known for his ______ research.A.intensiveB.extensiveC.expansiveprehensive答案:B。
“intensive”表示集中的、密集的;“extensive”强调广泛的,学者以广泛的研究出名比较符合语境;“expansive”有扩张的意思;“comprehensive”虽然也有全面的意思,但更多的是整体的全面,不如“extensive”在这个语境中合适。
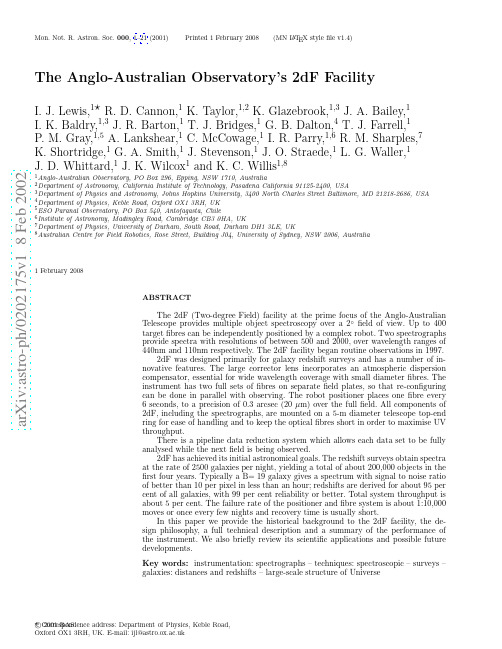
a r X i v :a s t r o -p h /0202175v 1 8 F eb 2002Mon.Not.R.Astron.Soc.000,1–21(2001)Printed 1February 2008(MN L A T E X style file v1.4)The Anglo-Australian Observatory’s 2dF FacilityI.J.Lewis,1⋆R.D.Cannon,1K.Taylor,1,2K.Glazebrook,1,3J.A.Bailey,1I.K.Baldry,1,3J.R.Barton,1T.J.Bridges,1G.B.Dalton,4T.J.Farrell,1P.M.Gray,1,nkshear,1C.McCowage,1I.R.Parry,1,6R.M.Sharples,7K.Shortridge,1G.A.Smith,1J.Stevenson,1J.O.Straede,1L.G.Waller,1J.D.Whittard,1J.K.Wilcox 1and K.C.Willis 1,81Anglo-AustralianObservatory,PO Box 296,Epping,NSW 1710,Australia2Department of Astronomy,California Institute of Technology,Pasadena California 91125-2400,USA3Department of Physics and Astronomy,Johns Hopkins University,3400North Charles Street Baltimore,MD 21218-2686,USA 4Department of Physics,Keble Road,Oxford OX13RH,UK 5ESO Paranal Observatory,PO Box 540,Antofagasta,Chile6Institute of Astronomy,Madingley Road,Cambridge CB30HA,UK7Department of Physics,University of Durham,South Road,Durham DH13LE,UK8Australian Centre for Field Robotics,Rose Street,Building J04,University of Sydney,NSW 2006,Australia1February 2008ABSTRACTThe 2dF (Two-degree Field)facility at the prime focus of the Anglo-Australian Telescope provides multiple object spectroscopy over a 2◦field of view.Up to 400target fibres can be independently positioned by a complex robot.Two spectrographs provide spectra with resolutions of between 500and 2000,over wavelength ranges of 440nm and 110nm respectively.The 2dF facility began routine observations in 1997.2dF was designed primarily for galaxy redshift surveys and has a number of in-novative features.The large corrector lens incorporates an atmospheric dispersion compensator,essential for wide wavelength coverage with small diameter fibres.The instrument has two full sets of fibres on separate field plates,so that re-configuring can be done in parallel with observing.The robot positioner places one fibre every 6seconds,to a precision of 0.3arcsec (20µm)over the full field.All components of 2dF,including the spectrographs,are mounted on a 5-m diameter telescope top-end ring for ease of handling and to keep the optical fibres short in order to maximise UV throughput.There is a pipeline data reduction system which allows each data set to be fully analysed while the next field is being observed.2dF has achieved its initial astronomical goals.The redshift surveys obtain spectra at the rate of 2500galaxies per night,yielding a total of about 200,000objects in the first four years.Typically a B=19galaxy gives a spectrum with signal to noise ratio of better than 10per pixel in less than an hour;redshifts are derived for about 95per cent of all galaxies,with 99per cent reliability or better.Total system throughput is about 5per cent.The failure rate of the positioner and fibre system is about 1:10,000moves or once every few nights and recovery time is usually short.In this paper we provide the historical background to the 2dF facility,the de-sign philosophy,a full technical description and a summary of the performance of the instrument.We also briefly review its scientific applications and possible future developments.Key words:instrumentation:spectrographs –techniques:spectroscopic –surveys –galaxies:distances and redshifts –large-scale structure of Universe⋆Correspondence address:Department of Physics,Keble Road,Oxford OX13RH,UK.E-mail:ijl@c 2001RAS2Lewis et al.1INTRODUCTIONThe value of equipping telescopes with a largefield of view has been recognised for some time.In1986the Royal As-tronomical Society report“Review of Scientific Priorities for UK Astronomical Research1990–2000”(RAS Report1986) put a wide-field multi-object spectroscopic facility at the top of its priority list for new projects.Subsequently the UK Large Telescope Panel recommended that a wide-field sur-vey facility be pursued in tandem with an8metre telescope project.The general scientific case for a wide-field spectroscopic facility on a4m telescope was two-fold:to provide spectra for large samples of objects found in the multi-colour imaging surveys from the UK,ESO and Oschin(Palomar)Schmidt telescopes;and to generate targets for the coming genera-tion of8-10m optical telescopes.The biggest specific science driver was to obtain redshifts of tens or even hundreds of thousands of galaxies and quasars,to elucidate the three-dimensional structure and evolution of the universe.Other major projects required spectra for large samples of stars,to determine their kinematics and composition and hence the dynamical and chemical history of our Galaxy;for similar studies of the Magellanic Clouds;and for detailed studies of star clusters and clusters of galaxies.One possibility was to provide a multi-fibre upgrade to the3.9metre Anglo-Australian Telescope(AAT).This was particularly advantageous for two reasons.Firstly,the opti-cal design of the telescope(a hyperboloidal primary mirror and relatively slow f-ratio of f/3.3at prime focus)enabled a widefield of2◦to be achieved using a large but straight-forward optical corrector.Secondly,the Anglo-Australian Observatory(AAO)already had extensive experience with multi-objectfibre spectroscopy.This dates from the pioneer-ing days of opticalfibres and its brass plug-plate system FOCAP(Gray1983)and more recently the fully automated AUTOFIBfibre positioner system(Parry&Gray1986).At the end of1988the AAT Board(AATB)commis-sioned a full design study of a wide-fieldfibre-optic spectro-scopic facility for the AAT(Taylor&Gray1990).Following further detailed investigations into cost and budgets,and in the expectation of some additional funding from both the Australian and UK Governments,the AATB gave its approval to begin the Two-degree Field(or2dF)project in March1990.Initially the direct budget allocated was A$2.25M(for components and certain specific tasks which could not be done in-house)and it was expected to take 4-5years to complete.Since the project would dominate the AAO’s activities for several years,a Project Manage-ment Committee was established with several external ex-pert members.In developing the2dF facility the AAO wished to build on the techniques already used for the fully automated AUT-OFIB instrument in use at the Cassegrain focus of the AAT. Since2dF would offer almost an order of magnitude increase in multiplex advantage over AUTOFIB and would be lo-cated at the more challenging prime focus,several technical problems had to be solved beforefinal approval was given for commencement of the project.The technical problems were addressed in the initial de-sign study reports and covered areas such as the accuracy required of the robotic positioner,the design of thefibre retraction systems,location and design of thefibre spectro-graphs and the requirement for a doublefieldplate system to maximise observing time.The mechanical constraints were eased by the strength and rigidity of the telescope tube structure and the size of the dome,which meant that a large instrument could be housed at prime focus without clearance andflexure prob-lems.Commissioning of the2dF facility began with the new prime focus corrector in the latter part of1993.The in-strument was officially declared open at a ceremony on1995 November20,and thefirst spectroscopic data were obtained in mid-1996.The facility began to provide scheduled scien-tific observations in September1997with almost full func-tionality.The project ran about40per cent over the orig-inal time estimate and20per cent over budget(these two are linked,in that2dF could have been completed sooner had more funds been available).The effective total cost was subsequently estimated to have been about A$8M,includ-ing all staffcosts and overheads.The bulk of the design and construction work was eventually done in-house using the AAO’s facilities in Sydney and Coonabarabran,partly because many aspects involved innovative design features which could not be easily specified or contracted out,and partly to contain costs.Progress reports describing the evolution of the design of2dF have been published(Gray&Taylor1990;Gray et al. 1993;Taylor,Cannon&Watson1996;Cannon1997;Lewis, Glazebrook&Taylor1998a;Lewis,Glazebrook&Taylor 1998b)and project updates have featured regularly in the quarterly AAO Newsletter.In this paper we provide a full technical description of the2dF facility and its performance.Section2gives an overview of the instrumentation and its relationship to other multiple objectfibre spectroscopy systems.In section 3,a detailed description of the individual components of the2dF facility is given.Operation of the2dF facility is covered in section4and actual performance is detailed in section5.Sections6and7describe the range of projects being done with2dF and some scientific possibilities for the future.Up to date technical information and signal to noise calculators are available on the2dF WWW pages (.au/2df/).2OVER VIEW OF INSTRUMENT2.1Objectives and design philosophyThe2dF facility was developed with the aim of providing the AAT with a dedicated prime focus spectroscopy facility, with order of magnitude improvements over existing sys-tems in terms of thefield area and number of objects that it is possible to observe simultaneously(the multiplex ad-vantage).While2dF was designed from the outset to be a versatile common-user instrument,suitable for a wide range of astronomical projects on an international research facil-ity,it was always clear that the dominant project would be to obtain redshifts and hence distances for a very large sam-ple of galaxies(a few times105objects),to map out the three-dimensional structure of the relatively local universe.Two separate but linked large redshift surveys wherec 2001RAS,MNRAS000,1–21The AAO’s 2dF Facility3the initial main projects with 2dF:one for 250,000galaxies brighter than b J =19.45with a median redshift of 0.1(Col-less et al.2001)and one for 30,000colour-selected quasars covering redshifts up to 4(Croom et al.2001).This meant that 2dF had to be optimised to obtain low dispersion spec-tra of a few thousand targets per night,over a wide wave-length range,for mainly non-stellar objects which were in the magnitude range 15<B <20and spread across more than 1000square degrees of sky.These requirements are very well met by a system providing two sets of 400fibres cover-ing 3square degrees of sky,and capable of reconfiguring one set of fibres in about an hour,which happens to be equal to the time needed to take adequate signal-to-noise ratio spectra of 19-20magnitude galaxies.Whenever choices had to be made on design features,instrument parameters or priorities,the driver was to max-imise 2dF’s efficiency as a redshift engine.The requirements of other projects,such as taking higher resolution spectra of stars,doing longer integrations on fainter galaxies,or work-ing on densely clustered targets,were incorporated where possible,but not if they involved any compromise of perfor-mance for the redshift surveys.2.2Other multi-fibre systemsPrevious multi-object fibre spectroscopy systems on 4me-tre class telescopes have used smaller fields of view and significantly smaller multiplex advantage.For example the William Herschel Telescope’s AUTOFIB-2(Parry et al.1994)and WYFFOS (Jenkins et al.1993)instruments pro-vide fibre spectroscopy of up to 150objects over a 1◦field (40arcminutes unvignetted).The HYDRA instrument (Barden et al.1994)on the 3.5m WIYN telescope uses approximately 100optical fibres to cover an unvignetted field of 1◦.Earlier fibre instruments on the AAT were FOCAP with 50fibres (Gray 1983)and AUTOFIB with 64fibres (Parry &Gray 1986),both covering a 40arcminute field at the Cassegrain focus.Some smaller telescopes offer a larger field of view or larger multiplex advantage.For example,the 2.5m DuPont telescope at Las Campanas with a 2.1◦field and up to 200optical fibres (Shectman 1993)has been used for the largest previous galaxy redshift survey.At the 1.2-m UK Schmidt Telescope the FLAIR fibre system with 92fibres covered a 6◦field (Watson et al.1993).FLAIR has now been re-placed by a semi-automatic successor:6dF (Parker,Watson &Miziarski 1998)with 150fibres.The 2.5m Sloan Digital Sky Survey (SDSS)telescope has a 3◦field of view and 640optical fibres;this is a dedicated telescope carrying out both multi-colour imaging and a spectrosopic survey of a million galaxies (York et al.1998).Multi-object systems are also being built for several of the new 8-10m class telescopes;these will be able to observe fainter objects but cover much smaller fields of view.2.3Key features of 2dFMulti-object fibre systems come in three varieties:plug plates or other off-line field preparation,for example the SDSS fibre system;‘fishermen around the pond’type in-struments with separate remotely controlled mechanismsFigure 1.The effect of differential atmospheric refraction at the latitude of the AAT (-31◦).The contours show the maximum possible observation times for 2dF fields centred at different Hour Angles and declinations,if all targets are to remain within one third of a diameter of the centre of their fibres.to simultaneously place each fibre at a target position,forexample MX (Hill &Lesser 1986)and MEFOS (Guerin et al.1993);and ‘pick and place’systems involving consec-utive placement of fibres with a single complex robot.The most versatile are the single robot systems,but they have the drawback that placing the fibres consumes a significant amount of observing time.2dF gets around this drawback by having two independent sets of 400fibres and two field plates,mounted back-to-back on a tumbler assembly within the instrument.While one set of fibres is being used for ob-servations,the second set is being reconfigured for the next target field.In order to give an unvignetted field of over 2◦with a flat focal plane,a special corrector lens system had to be designed and manufactured (Taylor &Gray 1994).Any wide field multi-fibre system must be able to cope with two separate atmospheric refraction effects,the vari-able distortion of the field as the telescope tracks across the sky,and variation of distortion with wavelength,which turns point images into very low dispersion spectra as zenith distance increases.The first effect means that for any one target field con-figuration,there is a maximum exposure time after which some of the target objects move out of the fixed fibre aper-tures.If we specify that a target field must be reconfigured once the target objects have moved more than a third of the fibre diameter (0.7arcsec in the case of 2dF),this de-fines the maximum time available for the robotic positioner to reconfigure the next set of fibres.The effect of differen-tial refraction is dependent on hour angle and declination as shown in Fig.1.Evidently a reconfiguration time of at most an hour is required for an efficient system which can access most of the sky with minimal loss of observing time.The second effect arises because the atmosphere is a refracting medium whose refractive index depends on wave-length.For example,at a zenith distance of 60◦,the light from a point source with wavelengths between 365–1100nm is spread out over 4.2arcsec,which would make it impossi-ble to use 2arcsec fibres for low dispersion spectroscopy overc2001RAS,MNRAS 000,1–214Lewis etal.Figure 2.Schematic diagram of the 2dF top end showing the main components located on the mounting ring.a wide wavelength range.2dF has an atmospheric disper-sion compensator (ADC)built into the front two elements of the corrector.These two elements are slightly prismatic and are automatically counter-rotated during observations to provide an equal but opposite dispersion,to counteract the atmosphere as the telescope tracks across the sky.The fibres feed a pair of spectrographs which are mounted at the top of the AAT near the prime focus,to keep the fibres short and maximise the UV throughput.Each spectrograph takes 200spectra simultaneously,with reso-lutions of between 500and 2000,on Tektronix 1024pixel square CCD detectors.Mechanisms inside the spectrographs switch the fibre feeds in phase with the tumbling of the field plates.All of the hardware making up the 2dF facility,includ-ing the spectrographs and electronics racks,is mounted on a purpose-built top end ring allowing straightforward inter-change with the other three original alternative top ends of the AAT.In particular,the entire fibre system can be left assembled and available for maintenance when 2dF is not scheduled on the telescope.3MAIN COMPONENTS OF 2DFThis section contains technical descriptions of the main com-ponents of the 2dF facility.At the end of this section table 1summarises the main instrument properties.3.1Top End RingThe new 2dF top end ring (Fig.2)is a direct copy of the three original AAT top end rings (f/8and f/15+f/35secon-daries and f/3prime focus)(AAO Observing Guide 1991).This allows a fast (<1hour)interchange between top ends using the semi-automated mechanisms built into the AAT dome.3.2Design constraints on the prime focus correctorAt the heart of the 2dF facility is the corrector lens system which provides the 2.1◦diameter field of view at the AAT prime focus.The development of a corrector was initiated with a design by C.G.Wynne (Wynne 1989)offering a 2◦field with 1.5arcsec images using a 4-element corrector.Fur-ther work by D.Jones and R.G.Bingham emphasised the need for an atmospheric dispersion compensator,the im-portance of chromatic variation in distortion (CVD)and of the telecentricity of the optical design.A relatively flat focal surface was also a requirement.The atmospheric dispersion of uncorrected images when sampled with a small fixed aperture size (an optical fibre)will reduce the throughput of the system significantly,by an amount which varies strongly with wavelength and zenith distance.When combined with small positioning and astro-metric errors this will place severe limits on the ability to flux calibrate the resulting data.In order to minimise this effect an atmospheric dispersion compensator built into the corrector optics must provide a variable amount of disper-sion in the opposite direction to the atmospheric dispersion,for as large as possible a range of zenith distances.All of the initial designs (except for a significantly as-pheric design by Bingham)exhibited chromatic variation of distortion (CVD)to some extent.This effect causes off–axis,broadband images to be spread radially by up to about 2arcsec for the 350–1000nm wavelength range,with maxi-mum effect at about 0.5◦field radius.This is a smaller effect than that of atmospheric dispersion and is independent of zenith distance;it determines the ultimate limit to spectro-photometric accuracy with 2dF.The telecentricity of an optical corrector design defines how the principal ray of each cone of light reaches the focal plane of the telescope.For an ideal fibre system the principal ray should be orthogonal to the focal surface.If the input light cone is not perpendicular to the focal surface then even in the absence of fibre focal ratio degradation (FRD)the ef-fective focal ratio of the output beam is decreased.In initial designs the angle of the principal ray varied across the field (usually increasing towards the edge of the field)by as much as 4◦from the normal to the focal plane.This variation in input angle is effectively the same as reducing the input fo-cal ratio of light to the fibre from f/3.5to f/2.3.Note that this is a much more severe effect that that of FRD within the fibre itself,which is minimal when working at this input focal ratio.If the spectrograph collimator is oversized to allow for this decrease in focal ratio,then we will reduce the spectral resolution for a fixed spectrograph beam size and camera focal ratio.Alternatively,if the collimator is sized correctly for the f/3.5beam,fibres accepting light from near the edge of the field (the worst affected)will be severely vignetted.Unfortunately,the non-telecentricity of the final optical de-sign means that the principal ray varies by up to 4◦from the orthogonal case.This effect is partly compensated for in the design of the fibre probes (detailed in section 3.4).A slight oversizing of the spectrograph collimator also reduces the effect of the non-telecentricity and any fibre FRD.The design of corrector finally selected (Jones 1994)contains counter-rotating prismatic doublets as the first twoc2001RAS,MNRAS 000,1–21The AAO’s 2dF Facility5lens elements (see Fig.3).These provide atmospheric dis-persion compensation for zenith distances of up to 67◦.The prismatic lenses are designed to give zero deviation of the optical path.CVD is maintained below 1.0arcsec across the field for the maximum bandbass used by the spectrographs.The CVD is zero at the centre and edges of the field and reaches its maximum value at 30arcmin field radius.The 2dF project is exceptional in that the scientific im-peratives drove the design towards a large field and high multiplex advantage,while the fixed fibre size,realistic as-trometric errors and relatively poor average site seeing (me-dian value 1.5arcsec)all reduce the importance of the abso-lute imaging performance of the corrector optics.In response to these criteria and the three design issues raised above,ex-tensive system modelling was performed on the design (Tay-lor &Gray 1993).This allowed not only the quantitative assessment of performance issues,but also the evaluation of the cost and risk implications of each potential design as work proceeded.3.3Building the corrector lensAt 0.9metre diameter,the corrector optics contain some of the largest refracting elements made for an astronomical telescope.The glass blanks for the corrector were manufactured by Ohara (Japan).Since some of the corrector lenses are of a deep meniscus shape,a technique known as slumping was used to avoid a large and expensive wastage of glass and prolonged grinding.Instead of cutting a lens from a thick blank,a thinner glass blank was heated and allowed to soften and slump under gravity over a convex mould.This technique does have the risk of increased internal stress and hence variable refractive index within the slumped blank.Tests before and after slumping showed that any variations in refractive index were within specification.The internal transmittance,particularly in the UV and blue,was also an important consideration in selection of the glass.The catalogue specification of UV and blue trans-mittance of BK7and F2glass types is significantly worse than that of UBK7and LLF6glass.However,discussions with the glass manufacturers revealed that the actual melt values were likely to be substantially better than the cat-alogue specification.Fig.4shows the corrector throughput using actual glass melt transmittance measurements,com-pared to the catalogue values for the glasses used in the 2dF corrector.The glass blanks were figured,coated with a MgF 2quar-ter wavelength anti-reflection coating (optimised for 500nm)and mounted by Contraves (USA).The two ADC elements are prismatic doublet lenses with the BK7and F2elements in contact to reduce the number of air-glass surfaces.An optical coupling compound is used between each of the lenses making up the doublets.After optical alignment in the corrector cells using tem-porary adjustment screws,the glass elements were mounted using flexible silicone rubber which allows for the differen-tial thermal expansion of the steel corrector housing and the glass.The two lens elements that form the atmospheric dis-persion compensator are rotated using stepper motors.These automatically move the ADC elements to the requiredFigure 3.Schematic diagram of the 2dF prime focus corrector incross-section.The lower two lens elements are the prismatic dou-blets making up the ADC,these are the first and second elements of the corrector in the light path.position whenever the telescope is slewed and then track continuously during observations.A mechanical switch acts as an index mark for each ADC element.Step counting is used to measure the position angle of the dispersing element.Each long slew of the ADC elements takes up to 3minutes and includes a pass through the index marks to ensure that lost steps in the stepper motor do not accumulate and con-tribute to incorrect positioning of the lens elements.The optical corrector was received from Contraves as a complete unit and commissioned on the AAT between July 1993and October 1993,by taking direct night sky images with photographic plates and both cooled and un-cooled CCD detectors (Taylor &Gray 1994).These tests in-cluded verification of the broad band imaging performance and the operation of the atmospheric dispersion compen-sator,as well as the initial distortion mapping of the correc-tor and telescope optics.c2001RAS,MNRAS 000,1–216Lewis etal.Figure 4.The wavelength dependence of the optical corrector transmission.This is based on measured and catalogue values of the bulk glass transmission and the predicted transmission of 8air–glass surfaces with quarter wavelength MgF 2anti–reflection coatings tuned for 500nm.The actual transmission exceeds 80per cent for wavelengths between 385and 700nm,falls to 60per cent at 360nm and is negligible below 340nm.3.4Optical fibres and retractor unitsThe focal plane of the telescope is populated by a total of404deployable optical fibre probes which may be moved to cover any part of the available field of view of the correc-tor.The fibre probes are divided into two types;one for target objects and the other for guide stars.The 400object fibres each consist of a single 8-m long optical fibre of core diameter 140µm,corresponding to an average diameter of 2.1arcsec on the sky (the effective diameter decreases non-linearly from 2.16arcs at the field centre to 2.0arcsec at the edge of the field).The 4guide fibre bundles each consist of a 4m long coherent bundle of 7×100µm core diameter fibres in which 6fibres are arranged in a hexagon around a central fibre (Fig.5).Each individual fibre probe can access an area extending from the edge of the focal plane to just beyond the centre of the focal plane,and can cover a sector with apex angle of 28◦.For the object fibre probes there is sufficient overlap between adjacent fibres to allow full field coverage.The four guide fibre bundles can access a total of about 30per cent of the focal plane.The guide fibres are arranged at the four cardinal points on each fieldplate.At the focal plane the incoming light is folded into theFigure 5.Fibre arrangement for a single guide fibre probe show-ing the arrangement of the seven individual optical fibres and their size and separation on the skyFigure 6.Optical fibre throughput as a function of wavelength (ignoring end losses).Fibre is Polymicro FVP 8m in length.optical fibres using 92◦prisms (1.2mm on a side)made from Schott SF5high refractive index glass,with the input face anti-reflection coated.The prism is glued to the polished end of the optical fibre using UV-curing cement,after being optically aligned with the fibre core.The 92◦angle of the prism was chosen to be half way between the extreme ranges of the beam angle for the non-telecentric corrector design.The prism material is a high refractive index glass so that the fast focal ratio input beam is totally internally reflected on the prism hypotenuse.This removes the requirement to aluminise the external reflecting face which would result in lower efficiency.The optical fibre used is a high OH or wet fibre manu-factured by Polymicro Technologies.This has the advantage of good blue throughput at some cost of additional OH ab-sorption bands in the far red (see Fig.6).The optical fibre is a step index fibre with core diameter of 140µm,cladding di-ameter of 168µm and a polyimide protective buffer 198µm in diameter.Each fibre and prism assembly is held in the focal plane by a small steel button 4mm long and 2mm wide containingc2001RAS,MNRAS 000,1–21。

小学上册英语第五单元期末试卷英语试题一、综合题(本题有100小题,每小题1分,共100分.每小题不选、错误,均不给分)1.ers open up in the morning and ______ at night. (有些花在早晨开放,晚上闭合。
) Some fru2.How many hearts does an octopus have?A. OneB. TwoC. ThreeD. Four3.The _____ (栖息地) of many animals relies on plants.4.The ______ (自然环境) supports diverse plant life.5.The ______ helps with the development of bones.6.The _____ (卡通) is funny.7.The _____ (自然景观) features a variety of plant habitats.8.Natural disasters like earthquakes can cause ______ damage.9.What is 25 + 25?A. 40B. 50C. 60D. 70B10.The ________ was a series of wars fought between England and France.11.What do we call a group of wolves?A. PackB. SchoolC. FlockD. ClutchA12.The law of conservation of mass states that mass is neither __________ nor created.13.The sun is shining ___. (brightly)14.What is the name of the famous American actress known for "A Star is Born"?A. Lady GagaB. Jennifer LopezC. Scarlett JohanssonD. Emma StoneA15.What do we call a person who studies the effects of climate change on agriculture?A. Agricultural ScientistB. Environmental ScientistC. BiologistD. EcologistA16.The chemical symbol for thorium is _______.17.What is the opposite of empty?A. FullB. LightC. HeavyD. ClearA18.My dad is a __________ (生意人).19.He can ________ (跑) fast.20.What do you call a young buffalo?A. CalfB. KitC. PupD. Cub21.I see a _____ frog by the pond. (small)22.I see a _______ (fox) in the forest.23.What do we call an animal that only eats plants?A. CarnivoreB. HerbivoreC. OmnivoreD. Insectivore24.What do we call the map line that measures distance north or south of the equator?A. LongitudeB. LatitudeC. MeridianD. EquatorB25.The __________ is a region known for its natural parks.26.What color do you get when you mix red and white?A. PinkB. PurpleC. OrangeD. Green27.What is the term for removing the outer layer of something?A. PeelingB. CuttingC. ChoppingD. SlicingA28. A hawk can spot prey from a great _______ (距离).29.What do we call the act of telling someone a story?A. NarrationB. StorytellingC. RecitingD. Reading30. A solution that resists changes in pH is called a ______ solution.31.What do we call a young female cat?A. KittenB. PuppyC. CubD. ChickA32.The capital of Armenia is __________.33.Which instrument has black and white keys?A. GuitarB. ViolinC. PianoD. DrumsC34.The duck quacks when it is _________. (高兴)35. A diverse garden can attract a wide variety of ______. (多样化的花园可以吸引各种动物。
高二英语数学建模方法单选题20题1. When doing a math modeling project, we can collect data by _____.A. making surveysB. doing experimentsC. reading booksD. asking teachers答案:A。
本题考查数学建模中数据收集的方法。
选项A“making surveys”(做调查)是一种常见的数据收集方式,可以收集到大量的实际数据。
选项B“doing experiments”(做实验)主要是为了验证假设,不一定能收集到广泛的数据。
选项C“reading books”(读书)可以获取知识,但不是直接的数据收集方法。
选项D“asking teachers”(问老师)可以得到一些指导和建议,但不是主要的数据收集方法。
2. In a math modeling project, which is NOT a proper way to collect data?A. Interviewing expertsB. Observing phenomenaC. Guessing randomlyD. Analyzing historical data答案:C。
选项A“Interviewing experts”((采访专家)可以获得专业的意见和数据。
选项B“Observing phenomena”((观察现象)能直接收集实际数据。
选项D“Analyzing historical data”((分析历史数据)也是一种有效的数据收集方法。
而选项C“Guessing randomly”((随机猜测)不是科学的数据收集方法,不能得到可靠的数据。
3. For a math modeling project about traffic flow, we can collect data by _____.A. counting cars on the roadB. imagining the traffic situationC. making up numbersD. asking friends for opinions答案:A。
高二英语词汇学术应用单选题30题1. In this scientific research, the data ______ a clear pattern that requires further analysis.A. emergeB. presentC. showD. display答案解析:B。
选项A“emerge”主要指从隐蔽处或暗处出现,常表示事物的浮现,如“New ideas emerged during the discussion”,在表示数据呈现某种模式时不适用;选项B“present”有呈现、展现的意思,在学术语境中常用来表示数据、研究等呈现出某种情况,这里数据呈现出一种清晰的模式,是合适的;选项C“show”和选项D“display”都有展示的意思,但“present”更侧重于把某种抽象的东西呈现出来,在学术文章里更为常用,而“show”和“display”更强调展示具体的事物或形象。
2. The experiment ______ the hypothesis that plants grow better in a certain type of soil.A. verifiesB. confirmsC. provesD. testifies答案解析:A。
选项A“verifies”强调通过检验、核查等方式来证实某事的真实性,在学术实验中,通过实验来核实假设是很常见的用法;选项B“confirms”侧重于确认某事,使某事更确定,但没有“verifies”那种检验的意味;选项C“proves”一般表示证明某事为真,语气比较绝对,在科学实验中通常用“verify”来表示对假设的验证;选项D“testifies”主要指为某事作证,多用人作主语,不符合此语境。
3. When writing an academic paper, we should ______ relevant sources to support our arguments.A. quoteB. citeC. referD. mention答案解析:B。
高二英语科研项目实施困难重重单选题30题(答案解析)1. In a scientific research project, we need to collect a lot of _____.A.datarmationsC.newsD.advices答案:A。
“data”是“数据”,是不可数名词;“information”也是不可数名词,没有复数形式;“news”是“新闻”;“advice”是“建议”,也是不可数名词。
在科研项目中,我们需要收集大量的数据。
2. The research project requires accurate _____.A.experimentB.experimentsC.experimentalD.experimentation答案:D。
“experiment”是“实验”,可数名词;“experiments”是“实验”的复数形式;“experimental”是形容词“实验性的”;“experimentation”是“实验法”,名词。
科研项目需要准确的实验法。
3. We need to analyze the _____ of the research project.A.resultB.resultsC.resultantD.resultants答案:B。
“result”是“结果”,可数名词;“results”是“结果”的复数形式;“resultant”是形容词“合成的”;“resultants”是名词“合力”。
我们需要分析科研项目的结果,结果通常是多个的,用复数形式。
4. The success of the research project depends on good _____.A.methodB.methodsC.methodicalD.methodology答案:D。
“method”是“方法”,可数名词;“methods”是“方法”的复数形式;“methodical”是形容词“有方法的”;“methodology”是“方法论”,名词。
公共课英语二模拟题2020年(56)(总分100,考试时间150分钟)ClozeLanguage is the most astonishing behavior in the animal kingdom. It is the species-typical behavior that sets **pletely【C1】______from all other animals. Language is a means of communication,【C2】______it is much more than that. Many animals can【C3】______. The dance of the **municates the location of flowers【C4】______other members of the hive (蜂群). But human language **munication about anything,【C5】______things like unicorn (独角兽) that have never existed. The key【C6】______in the fact that the units of meaning, words, can be【C7】______together in different ways, according to【C8】______. to communicate different meanings.Language is the most important learning we do. Nothing【C9】______humans so much as our ability to communicate abstract thoughts,【C10】______about the universe, the mind, love, dreams, or ordering a drink. It is an **plex【C11】______that we take for granted. Indeed, we are not aware of most【C12】______of our speech and understanding. Consider what happens when one person is speaking to【C13】______. The speaker has to translate thoughts into【C14】______language. Brain imaging studies suggest that the time from thoughts to the【C15】______of speech is extremely fast, only 0.04 seconds! The listener must hear the sounds to【C16】______out what the speaker means. He must use the sounds of speech to【C17】______the words spoken, understand the pattern of 【C18】______of the words (sentences), and finally【C19】______the meaning. This takes somewhat longer, a minimum of about 0.5 seconds. But【C20】______started, it is of course a continuous process.1. 1.【C1】A. apartB. offC. upD. down2. 2.【C2】A. soB. butC. orD. for3. 3.【C3】A. transferB. transmitC. conveyD. communicate4. 4.【C4】A. toB. fromC. overD. on5. 5.【C5】A. onlyB. almostC. evenD. just6. 6.【C6】A. staysB. situatesC. hidesD. lies7. 7.【C7】A. stuckB. strungC. rungD. consisted8. 8.【C8】A. rulesB. scalesC. lawsD. standards9. 9.【C9】A. combinesB. containsC. definesD. declares10. 10.【C10】A. whatB. whetherC. whileD. if11. 11.【C11】A. prospectB. progressC. processD. produce12. 12.【C12】A. aspectsB. abstractsC. anglesD. assumptions13. 13.【C13】A. anybodyB. anotherC. otherD. everybody14. 14.【C14】A. bodyB. gestureC. writtenD. spoken15. 15.【C15】A. growingB. fixingC. beginningD. building16. 16.【C16】A. putB. takeC. drawD. figure17. 17.【C17】A. identifyB. locateC. revealD. discover18. 18.【C18】A. performanceB. organizationC. designD. layout19. 19.【C19】A. prescribeB. justifyC. utterD. interpret20. 20.【C20】A. sinceB. afterC. onceD. untilReading ComprehensionAdvertising has been among England's biggest growth industries since the war, in terms of the ratio of money earnings to demonstrable achievement. Why all this fantastic expenditure?Perhaps the answer is that advertising saves the manufactures from having to think about the customer. At the stage of designing and developing a product, there is quite enough to think about without worrying over whether anybody will want to buy it. The designer is busy enough without adding customer-appeal to all his other problems of man-hours and machine tolerances and stress factors. So they just go ahead and make the thing and leave it to the advertiser to find eleven ways of making it appeal to purchasers after they have finished it, by pretending that it confers (授予) status, or attracts love, or signifies manliness. If the advertising agency can do this authoritatively enough, the manufacturer is in clover(生活舒适).Other manufacturers find advertising saves them from changing their product. And manufacturers hate change. The ideal product is one which goes on unchanged for ever. If, therefore, for one reason or another, some alteration seems called for, how much better to change the image, the packet or the pitch made by the product, rather than go to all the inconvenience ofchanging the product itself.The advertising man has to combine the qualities of the three most authoritative professions: Church, Bar, and Medicine. The great skill required of our priests, most highly developed in missionaries but present, indeed mandatory, in all, is the skill of getting people to believe in and contribute money to something which can never be logically proved. At the Bar, an essential ability is that of presenting the most persuasive case you can to a jury of ordinary people, with emotional appeals masquerading as logical exposition: a case you do not necessarily have to believe in yourself, just one you have studiously avoided discovering to be false. As for Medicine, any doctor will confirm that a large part of his job is not clinical treatment but faith healing. His apparently scientific approach enables his patients to believe that he knows exactly what is wrong with them and exactly what they need to put them right, just as advertising does—"Run down? You need...""No one will dance with you? A dab of... will make you popular."Advertising men use statistics rather like a drunk uses a lamppost for support rather than illumination. They will dress anyone up in a white coat to appear like an unimpeachable authority or, failing that, they will even be happy with the announcement,"As used by 90% of the actors who play doctors on television." Their engaging quality is that they enjoy having their latest ruses uncovered almost as much as anyone else.21. 21.Advertising are appreciated by manufacturers because they______.A. advise them on ways of giving a product customer appealB. accept responsibility for giving a product customer appealC. advise them on the best time to go ahead with productionD. consult them during the design and development stages22. 22.The passage tells us that some manufacturers, instead of changing their product, would prefer to change its______.A. production costB. qualityC. market valueD. appeal23. 23.According to the passage, doctors are most successful when they are______.A. authoritativeB. logicalC. emotionalD. scientific24. 24.Advertising men dress people up in white coats because______.A. it makes their advertisements more conspicuousB. it makes their advertisements more convincingC. the majority of TV doctors are dressed up in white coatsD. it makes the actors take the job seriously25. 25.The advertisers'attitude is based on the hope that consumers______.A. know deep down what they really wantB. are interested in what is being designedC. are indifferent to what is being advertisedD. are uncritical and easily influencedSome of the concerns surrounding Turkey's application to join the European Union, to bevoted on by the EU's Council of Ministers on December 17th, are economic—in particular, the country's relative poverty. Its GDP per head is less than a third of the average for the 15 pre-2004 members of the EU. But it is not far off that of one of the ten new members which joined on May lst,2004 (Latvia), and it is much the same as those of two countries, Bulgaria and Romania, which this week concluded accession talks with the EU that could make them full members on January 1st, 2007.Furthermore, the country's recent economic progress has been, according to Donald Johnston, the secretary-general of the OECD, "stunning."GDP in the second quarter of the year was 13.4% higher than a year earlier, a rate of growth that no EU **es close to matching. Turkey's inflation rate has just fallen into single figures for the first time since 1972, and this week the country reached agreement with the IMF on a new three-year, $10 billion economic programme that will, according to the IMF's managing director, Rodrigo Rato, "help Turkey... reduce inflation toward European levels, and enhance the economy's resilience."Resilience has not historically been the country's economic strong point. As recently as 2001, GDP fell by over 7%. It fell by more than 5% in 1994, and by just under 5% in 1999. Indeed, throughout the 1990s growth oscillated like an electrocardiogram recording a violent heart attack. This irregularity has been one of the main reasons (along with red tape and corruption) why the country has failed dismally to attract much-needed foreign direct investment. Its stock of such investment (as a percentage of GDP) is lower now than it was in the 1980s, and annual inflows have scarcely ever reached $1 billion (whereas Ireland attracted over $25 billion in 2003, as did Brazil in every year from 1998 to 2000).One deterrent to foreign investors is due to disappear on January 1st, 2005. On that day, Turkey will take away the right of virtually every one of its citizens to call themselves a millionaire. Six naughts will be removed from the face value of the lira, one unit of the local currency will henceforth be worth what 1 m are now—ie, about ¢0.53 ($0.70). Goods will have to be priced in both the new and old lira for the whole of the year, but foreign bankers and investors can begin to look forward to a time in Turkey when they will no longer have to juggle mentally with indeterminate strings of zeros.26. 26.What is Turkey's economic situation now?A. Its GDP per head is far lagging behind that of the EU members.B. Its inflation rate is still rising.C. Its economy grows faster than any EU member.D. Its economic resilience is very strong.27. 27.We can infer from the second paragraph that______.A. Turkey will soon catch the average GDP level of the 15 pre-2004 EU membersB. inflation rate in Turkey used to be very highC. Turkey's economy will keep growing at present rateD. IMF's economic program will help Turkey join the EU28. 28.The word "oscillated" (Paragraph 3) most probably means______.A. fellB. climbedC. developedD. swang29. 29.Speaking of Turkey's foreign direct investment, the author implies that______.A. it's stock is far less than that of other countriesB. it does not have much influence on Turkey's economic progressC. steady GDP growth will help Turkey attract more foreign direct investmentD. Turkey's economic resilience relies on foreign direct investment30. 30.We can draw a conclusion from the text that______.A. foreign investment environment in Turkey will become betterB. Turkey's citizens will suffer heavy loss due to the change of the face value of the liraC. the local currency will depreciate with the removal of six naughts from the face valueD. prices of goods will go upThe giant Mirafiori plant in Turin is the heart of Fiat Auto, the troubled car division of the Fiat group. As the early shift trooped home at 2 pm on October 9th, the mood was pessimistic. The workers knew that the bosses were meeting union leaders later that afternoon in Rome to announce 8,100 job cuts across the group's car factories. This is on top of 3,000 job losses announced earlier this year. Workers expect one-third of Mirafiori's 12,000 employees to be gone by next July. Fiat says that all but 500 of the total are temporary lay-offs, to last about a year. But the morose workers passing through Mirafiori's gates doubt that the jobs will **e back, whatever the firm says about new models and future investment.Fiat Auto will lose around € 1 billion ($987m) this year, wiping out profits in other parts of the group, which makes everything from lorries and tractors to robots. Fiat's bosses have been in denial for years about **pany's massive over-capacity, the cause of growing losses as sales slumped. Five years ago Fiat Auto made 2.6m cars a year and profits of ¢758m. Since then it has recorded a loss in every year bar one. This year it will produce barely 1.9m cars. Its banks forced a restructuring in May, and the chief executive of its Fiat group parent had to resign a few weeks later.The pain is bad enough in northern Italy, where unemployment is barely 4%, but it will be felt more elsewhere. The Termini Imerese plant in Sicily is to lay off 1,800 workers. Unions say that cuts among suppliers could double the number of people hit. The local official jobless rate is already 18% (though this ignores a lively "informal" economy). This is posing a nasty problem for the government of Silvio Berlusconi, which polled strongly in Sicily but is not inclined to aid troubled firms.Fiat's belated willingness to take tough steps to align capacity with demand is down to the group's new boss, Gabriele Galateri, chosen in June to rescue the firm, which is 30% owned by Agnelli family interests. His aim is to restore credibility, arrest the alarming plunge in **pany's share price and persuade the banks that he is sorting out the Fiat Auto mess, so as to win their support for a further recapitalisation.Closely watching this Italian drama are bosses of General Motors, owners of 20% of Fiat Auto. The Italians have an option to sell the remaining shares to GM from January 2004. GM, which has its own problems in Europe, is desperate for Fiat Auto to sort itself out before it can be forced to take over. Although the Agnelli family patriarch, the ailing 81-year-old Gianni Agnelli, is opposed to such a sale, most analysts expect that Italy's proudest **pany will end up in American hands.31. 31.The workers in Fiat's plant were pessimistic because______.A. the car division of the Fiat group was in troubleB. new models and future investment promised no hope of getting their jobs backC. there will be heavy job losses in the giant Mirafiori plantD. they were facing the threat of losing their jobs32. 32.We learn from the second paragraph that______.A. the market demand for Fiat cars now is far lower than it was five years agoB. Fiat Auto is the only part of the group that is running at a lossC. Fiat Auto is selling cars more than they can produceD. the cause of Fiat's trouble is the sluggish Italian economy33. 33.According to the text, Fiat's job cutsA. trigger a wave of job cuts in **paniesB. become a headache of Italian governmentC. double the number of jobless people in northern ItalyD. force Italian government to aid it34. 34.Which of the following is NOT a measure Fiat Auto took to combat growing losses?A. Preventing share price from fallingB. Laying off workersC. Reducing productionD. Replacement of the boss35. 35.We can draw a conclusion from the last paragraph thatA. Fiat Auto can hardly solve its own problemsB. GM will be happy to buy the remaining shares of Fiat AutoC. the Agnelli family has a final say to whether Fiat Auto should be sold outD. Americans are better at running **paniesThanks to slumping markets, investment banks are shedding many of their highly-paid traders. When markets recover, the banks might be tempted to replace them with rather cheaper talent. One alternative has been around for a while but has yet to catch on: autonomous trading **puters programmed to act like the human version without such pesky costs as holidays, lunch breaks or bonuses. Program trading has, of course, been done before; some blamed the 1987 stockmarket crash on computers instructed with simple decision-making rules. But robots can be smarter than that.Dave Cliff, a researcher at Hewlett-Packard Laboratories in Bristol, England, has been creating trading robots for seven years. In computer simulations he lets them evolve "genetically," and so allows them to adapt and fit models of real-world financial markets. His experiments have suggested that a redesign of some markets could lead to greater efficiency. Last year, a research group at IBM showed that Mr Cliff's artificial traders could consistently beat the human variety, in various kinds of market. Nearly all take the shape of an auction. One well-known type is the English auction, familiar to patrons of the salesrooms of Christie's and Sotheby's, where sellers keep mum on their offer price, and buyers increase their bids by stages until only one remains.At the other extreme is the Dutch auction, familiar to 17th-century tulip-traders in the Netherlands as well as to bidders for American Treasury bonds. Here, buyers remain silent, and a seller reduces his price until it is accepted. Most markets for shares, commodities, foreign exchange and derivatives are a hybrid of these two types: buyers and sellers can announce their bid or offer prices at any time, and deals are constantly being closed, a so-called "continuous double auction."Mr Cliff's novel idea was to apply his **puter programs to marketplaces themselves. Why not, he thought, try and see what types of auction would let traders converge most quickly towards anequilibrium price? The results were surprising. In his models, auctions that let buyers and sellers bid at any time like most of today's financial exchanges were less efficient than ones that required relatively more bids from either buyers or sellers. These "evolved auctions" also withstood big market shocks, such as crashes and panics, better than today's real-world versions. Mr Cliff's most recent results, which will be presented in Sydney, Australia, on December 10th, show that the best type of auction for any market depends crucially on even slight differences in the number of buyers and sellers.Bank of America has been investigating these new auctions, along with robotic traders, for possible use in electronic exchanges. The hope is that today's financial auctions and online marketplaces might work better by becoming more like their English and Dutch forebears. But what to call such multi-ethnic hybrids? Here's introducing the "Cliffhanger."36. 36.The passage is mainly______.A. a review of two kinds of auctionsB. an introduction of trading robotsC. a survey of the trading marketD. about trading alternatives37. 37.Which of the following is true according to the text?A. David's robot traders have now been used in real-world markets.B. Robot traders can evolve like creatures.C. There is room for improvement in efficiency in trading markets.D. The English auction is the most popular trading form.38. 38.If you were trading American Treasury bonds, you would most likely take the trading form of______.A. the English auctionB. the continuous double auctionC. the Dutch auctionD. the evolved auction39. 39.We can infer from the text that______.A. existing auctions can not withstand market shocksB. the Dutch auction is better than the continuous double auctionC. it's hard for traders to reach an equilibrium priceD. the best type of auction takes place when the number of the buyers is equal to that of sellers40. 40.Toward robot traders, the writer's attitude can be said to be______.A. biasedB. objectiveC. pessimisticD. optimisticRead the following text and choose the best answer from the right column to complete each of the unfinished statements in the left column.There are two extra choices in the right column. Mark your answer on the ANSWER SHEET.(10 points)Take much of what you know about how the best executives make decisions. Now, forget it. For instance, we all "know" that tight deadlines lead to inspiration. Except they often don't. Instead, they typically are counterproductive—making people less creative precisely when they need to be. Or most of us assume that when we try to solve problems, we're drawing on the logicalparts of our brains. But, in fact, great strategists seem to draw on the emotional and intuitive parts of their brain much more.Here's a closer look at some of the discoveries researchers have made.Want innovation? Be wary of deadlines.We often think a deadline can help us shake off inertia and focus on getting a job done. But the brain research suggests precisely the opposite is true. A deadline, instead, more often limits our thinking and can lead to much worse decision making.Richard Boyatzis is a professor in Case Western Reserve University. He—along with others—has found that a tight deadline increases people's urgency and stress levels. "The research shows us that the more stressful a deadline is, the less open you are to other ways of approaching the problem,"he says. "The very moments when in organizations we want people to think outside the box, they can't even see the box."Does that **panies should get rid of deadlines? In most cases, that's not realistic. So Srini Pillay, an assistant clinical professor at Harvard Medical School, suggests **panies help employees reduce stress and access the creative parts of the brain even when they're under pressure.Big unknowns lead to bad choices.The ticking clock of a deadline isn't the only kind of pressure that makes for bad decisions. So does uncertainty, such as feeling that your job or **pany's future is under threat.Srini Pillay cites a study that discovered that feelings of uncertainty activated brain centers associated with anxiety and disgust, and that such concerns naturally lead to certain kinds of decisions. "In times of uncertainty," he says, "you start acting out of that sense of doom and gloom."Good thinkers look past facts.Everybody is aware of the revered image of the hardheaded decision. maker, who goes after cold facts. But researchers are finding the truth is much **plex; The best leaders seem to lean on their emotions much more than logic. Roderick Gilkey, a professor of management at Emory University, conducted a study with colleagues to look at what happens when executives are making strategic decisions.For example, a good strategic thinker would pay attention to emotional reaction and think through the full, long-term impact of the cuts on things like employee morale, retention and productivity. The result might be a different way of improving profitability."When you're making a decision in an organization, you also need to think about people and their reactions,"says David Rock, director of the research organization NeuroLeadership Institute. "A lot of the strategies that go wrong are because managers haven't thought through what happens when this hits people."41. 41.42. 42.43. 43.44. 44.45. 45.Translation46. 46.Think this way, it's your inability to resist cheesecake that's making it tough to fit into your skinny jeans? Well, a new study shows your bacteria may share some of the blame.Because the new study in mice reveals that the response of intestinal microbes to a high-fat diet ends up triggering the release of a hormone that makes mammals feel hungry, causing them to eat even more. The finding is served up in the journal Nature.Previous work has shown that the types of bacteria in the gut in diabetic or obese individuals are different from the bacteria in healthy people. But does this bacterial makeup contribute to these disorders? Or is it just a side effect?To unravel this mystery, researchers put mice on a high-fat diet. As a result, the animals experienced a buildup of a chemical called acetate (醋酸盐), particularly in the large intestine.Writing47. 47.Suppose you had been admitted by a famous university for postgraduate education. Your friend, Jack, wrote a letter to congratulate you, and ask advice on how to prepare for the postgraduate entrance exam. Write him a reply to1) thank him;2) give your advice.You should write about 100 words on the ANWSER SHEET.Do not sign you own name, use "Li Ming " instead.Do not write your address.48. 48.In this section, you are asked to write an essay based on the following chart. In your writing, you should1) Interpret the chart, and2) Give **ments.You should write at least 150 words.Write your essay on the ANSWER SHEET. (15 points)。
a r X i v :a s t r o -p h /0412573v 3 23 D e c 2004Draft version February 2,2008Preprint typeset using L A T E X style emulateapj v.04/03/99A REDSHIFT SURVEY OF THE SUBMILLIMETER GALAXY POPULATIONS.C.Chapman,1A.W.Blain,1Ian Smail,2R.J.Ivison 3,4Submitted to Astrophysical JournalABSTRACTWe have obtained spectroscopic redshifts using the Keck-I telescope for a sample of 73submillimeter (submm)galaxies,with a median 850µm flux density of 5.7mJy,for which precise positions are available through their faint radio emission.The galaxies lie at redshifts out to z =3.6,with a median redshift of 2.2and an interquartile range z =1.7–2.8.Modeling a purely submm flux-limited sample,based on the expected selection function for our radio-identified sample,suggests a median redshift of 2.3with a redshift distribution remarkably similar to the optically-and radio-selected Quasars.The observed redshift distributions are similar for the AGN and starburst sub-samples.The median R AB =24.6for the sample.However,the dust-corrected ultraviolet (UV)luminosities of the galaxies rarely hint at their huge bolometric luminosities indicated by their radio/submm emission,underestimating the true luminosity by a median factor of ∼100for SMGs with pure starburst spectra.Radio and submm observations are thus essential to select the most luminous,high-redshift galaxies.The 850µm,radio,and redshift data is used to estimate the dust temperatures,and characterize photometric ing 450µm measurements for a subset of our sample we confirm that the median dust temperature of T d =36±7K,derived assuming the local FIR–radio correlation applies at high redshift,is reasonable.Individual 450µm detections are consistent with the local radio-FarIR relation holding at z ∼2.This median T d is lower than that estimated for similarly luminous IRAS 60µm galaxies locally.We demonstrate that dust temperature variations make it impossible to estimate redshifts for individual submm galaxies using simple long-wavelength photometric methods to better than ∆z ≃1.We calculate total infrared and bolometricluminosities (the median infrared luminosity estimated from the radio is 8.5+7.4−4.6×10¹²L ⊙),construct a luminosity function,and quantify the strong evolution of the submm population across z =0.5–3.5,relative to local IRAS galaxies.We use the bolometric luminosities and UV-spectral classifications to determine a lower limit to the active galactic nucleus (AGN)content of the population,and measure directly the varying contribution of highly-obscured,luminous galaxies to the luminosity density history of the Universe for the first time.We conclude that bright submm galaxies contribute a comparable star formation density to Lyman-break galaxies at z =2−3and including galaxies below our submm flux limit this population may be the dominant site of massive star formation at this epoch.The rapid evolution of submm galaxies and QSO populations contrasts with that seen in bolometrically lower luminosity galaxy samples selected in the restframe UV,and suggests a close link between submm galaxies and the formation and evolution of the galactic halos which host QSOs.Subject headings:cosmology:observations —galaxies:evolution —galaxies:formation —galaxies:starburst1.INTRODUCTIONThe submillimeter (submm)galaxy population was first detected seven years ago with the Submillimetre Common User Bolometer Array (SCUBA –Holland et al.1999)on the JCMT (Smail,Ivison &Blain 1997;Hughes et al.1998;Barger et al.1998;Eales et al.1999).Their discovery mo-tivated a variety of surveys using both SCUBA and a sim-ilar instrument,MAMBO (Bertoldi et al.2000;Kreysa et al.2002),on the IRAM 30-m telescope.Several surveys were undertaken of blank fields,using different strategies to determine their depths and area coverage (Barger et al.1999a,2002;Eales et al.2000;Scott et al.2002;Borys et al.2003;Serjeant et al.2003;Webb et al.2003a;Danner-bauer et al.2004;Greve et al.2004).These surveys detect sources at a rate of approximately one source per night.A second class of survey utilized massive clusters to providea mild gravitational lensing boost to aid in the detection and study of SMGs.These surveys uncovered sources at a rate of about two per night,and examples of such sur-veys include Smail et al.(2002),Chapman et al.(2002a),Cowie,Barger &Kneib (2002),and Knudsen (2004).These surveys have gradually built up a large enough sample of Sub-Millimeter Galaxies (SMGs)to produce a statistically useful count (e.g.,Blain et al.2002).How-ever,until very recently most of our detailed knowledge of the properties of SMGs came from a handful of SMGs identified in lensing cluster fields (e.g.,Ivison et al.1998,2000,2001;Frayer et al.1998,1999,2004),as follow-up of blank field sources without the lensing boost required significantly more resources (e.g.,Gear et al.2000;Lutz et al.2001;Dannerbauer et al.2002;Dunlop et al.2004).A breakthrough in our understanding of the proper-1California Institute of Technology,Pasadena,CA,91125,U.S.A.2Institutefor Computational Cosmology,University of Durham,South Rd,Durham DH13LE,UK3Astronomy Technology Centre,Royal Observatory,Blackford Hill,Edinburgh EH93HJ,UK 4Institute for Astronomy,University of Edinburgh,Blackford Hill,Edinburgh EH93HJ,UK12ties of SMGs came from exploiting ultradeep20-cm radio maps.A strong correlation exists between the far-infrared (FIR)and radioflux densities of galaxies,both locally and at high redshifts(e.g.,Helou et al.1985;Condon1992; Garrett2002),and so deep radio imagery with the Very Large Array(VLA)5can be used to help pinpoint and study SMGs(Ivison et al.1998;Smail et al.2000;Barger, Cowie&Richards2000;Chapman et al.2001,2002b). These radio maps provide a∼1.5′′beam and∼0.5′′as-trometric precision relative to the optical frame,sufficient to accurately locate the counterpart of a submm source. The use of radio imaging has culminated in the success-ful identification of at least65%of SMGs brighter than S850µm>5mJy and their photometric characterization in the optical/near-infrared waveband(Ivison et al.2002; Chapman et al.2003a;Wang et al.2004;Borys et al.2004; Greve et al.2004).The ability to precisely locate the position of a submm emitting source is essential if we wish to study their prop-erties in any detail.In particular,this is a necessaryfirst step when trying to derive redshifts and luminosities for these systems.It had been hoped that long-wavelength ob-servations of the dust emission spectrum of these galaxies might be prove a reliable route to derive their redshifts and luminosities.The submm/radioflux ratio wasfirst used by Carilli&Yun(1999)in this manner to estimate the typical redshift of SMGs,however the technique was rec-ognized immediately to have limited accuracy(∼50%red-shift errors)if there was a range of dust temperatures(T d) present.This uncertainty is particularly important when deriving luminosities and related properties from submmobservations as the submmflux density is S850µm∝T≃3.5d for afixed FIR luminosity at z≃2.In addition,there is a strong degeneracy between T d and(1+z)(Blain1999), which limits the usefulness of simple photometric redshifts for estimating luminosities for the SMG population.Re-finement of the modeling andfitting techniques appears not to have overcome this basic source of uncertainty(e.g., Aretxaga et al.2003;Wiklind2003).Indeed,even surveys at several submm wavelengths(e.g.,Hughes et al.2002) cannot completely overcome the degeneracy between dust temperature and redshift(Blain1999;Blain,Barnard& Chapman2003–see also Aretxaga et al.2004for a con-trary view).As a consequence,precise redshifts are crucial for in-terpreting almost every aspect of SMGs.Prior to2002, only a handful of spectroscopic redshifts were available for unambiguously-identified SMGs(Ivison et al.1998,2000; Barger et al.1999b;Lilly et al.1999).Recent attempts to measure redshifts for SMGs have met with more suc-cess(Chapman et al.2002c,2003a;Barger et al.2002; Ledlow et al.2002;Smail et al.2003a,2003b;Kneib et al.2004).However,the resulting sample is still restricted in size and unrepresentative of the general properties of the SMG population(with a bias towards optically-bright counterparts and a preponderance of strong-lined AGN).A redshift survey of a large and representative sample of submm galaxies is therefore urgently required. Chapman et al.(2003b–hereafter C03)demonstrated that spectroscopic redshifts can be obtained for even the optically faintest SMGs,spanning a factor of100×in I-bandflux,allowing a much more representative sample of the population to be studied.Their approach involved constructing densely-packed distributions of submm galax-ies across∼10′fields(matched to the area coverage of multi-object spectrographs on10-m telescopes)with pre-cise positions from radio counterparts.These samples could then be efficiently and effectively targeted using deep spectroscopy in the UV/blue spectral region.With a large, unbiased sample of SMGs constructed in this manner it is possible to address questions about the SMG population with more certainty:including their dust temperatures (T d)and SED properties,their luminosities at various wavelengths and luminosity evolution,their contribution to the FIR background,and their relation to other popu-lations of galaxies and AGN at high redshift.In this paper,we present an expanded sample from the ten SMGs with robust spectroscopic redshifts described by C03,to provide a total sample of73redshifts for unambiguously-identified SMG’s.We discuss the prop-erties and observations of this sample,along with selec-tion effects in§2.We present the basic observational re-sults obtained for this sample,including the redshift distri-butions,variation in SEDs with redshift as characterized by the submm/radioflux ratio,and optical properties in §3.In§4we then use basic assumptions to derive dust temperatures and bolometric luminosities for our sample, compare the UV properties of the galaxies with their ra-dio/submm emission,assess their contribution to the lu-minosity and star formation histories of the Universe and the FIR background(FIRB)and discuss their evolution-ary connections with other high-redshift populations.Fi-nally,in§5we give our main conclusions.All calcula-tions assume aflat,ΛCDM cosmology withΩΛ=0.7and H0=71km s−1Mpc−1.2.SAMPLE DEFINITION,OBSERVATIONS AND ANALYSIS The parent sample of SMG’s used for our survey con-sists of150sources detected at850µm(>3σ)with SCUBA/JCMT,lying in seven separatefields(field centers listed in Table1):CFRS03,Lockman Hole,HDF,SSA13, Westphal-14,ELAIS-N2,and SSA22.104of these SMGs have radio identifications from deep VLA radio maps at 1.4GHz.This radio-identified subset are the focus of this paper.In allfields the SCUBA submm data was retrieved from the JCMT archive6and reduced in a consistent man-ner using the SURF reduction tools(Jenness et al.1998) and our own software to extract beam-weighted submm fluxes.7In some cases,additional radio sources were tar-geted in SCUBA’s photometry mode(Holland et al.1999) to efficiently construct large samples of SMGs to target5The National Radio Astronomy Observatory is a facility of the National Science Foundation operated under cooperative agreement by Associated Universities,Inc.6The JCMT is operated by the Joint Astronomy Centre on behalf of the United Kingdom Particle Physics and Astronomy Research Council, the Netherlands Organisation for Scientific Research,and the National Research Council of Canada.The JCMT archive is provided through the Canadian Data Archive Center.7Mapfluxes are obtained by extracting the effective beam imprint,(−0.5,1,−0.5)×δSCUBA chopping/nodding profile(e.g.,Scott et al. 2002;Borys et al.2003).Chapman et al.3in contiguous regions aroundfields mapped by SCUBA (e.g.,Chapman et al.2001a,2002b,2003a).In addition, follow-up SCUBA photometry was used to verify the real-ity and submmflux densities of11of the sources detected in SCUBA maps.These new SCUBA observations were obtained during JCMT observing runs in2002and2003, with sky opacity at225GHz,τ225=0.04–0.09.The ob-serving strategy was to integrate for afixed length of time (1.0hrs)on all targeted galaxies,with additional time allo-cated to targets which did not achieve our nominal RMS sensitivity goal of dS850=1.5mJy due to weather condi-tions.We note the observational mode used to identify sources in Table3,based on whether their submm de-tection was obtained entirely in photometry mode(′P′), entirely in mapping mode(′M′)or through a combination of the two modes(′MP′).Radio data for thesefields either existed from previous work by members of our group(Lockman Hole,ELAIS-N2),was rereduced for the purpose of this study(CFRS-03,SSA22,Westphal-14),or obtained from the public release(HDF,Richards2000).The SSA13radio data were obtained from E.A.Richards(private communica-tion),and is so far unpublished(a subsequent reduction of the SSA13data is described in Fomalont et al.2004). The radio data for the Lockman Hole and ELAIS-N2fields come from Ivison et al.(2002)who identified counterparts to the submm galaxies in these regions from Scott et al. (2002).For thosefields which we rereduced the radio data was retrieved from the VLA archive when available and combined with new data obtained by our group in SSA22(36hrs,A-array),Westphal-14(24hrs,B-array), and CFRS-03(16hrs,B-array).The radio maps were re-duced in an identical manner to those described in Ivison et al.(2002).The resulting radio maps have depths range from4µJy to15µJy rms;see Table1.Deep optical imaging in the B,R,and I passbands is available for all of ourfields.This consists of several hour integrations with mosaic CCD cameras on4-m and 8-m class telescopes,taken either from public archives,or obtained by our group during observing runs throughout 2000–2002.HDF(BRI),SSA13(I),and Lockman(RI) imaging was obtained with the SUPRIME camera on the Subaru telescope.The HDF data was retrieved from the public release presented in Capak et al.(2004).The SSA13 and Lockman data was retrieved from the Subaru archive and reduce by our group.The BR imaging in SSA13was obtained with the Kitt Peak4m telescope and the MO-SAIC camera,and reduced with the MSCRED tasks in IRAF.The B imaging in Lockman and the ELAIS-N2 imaging(BRI)was obtained with the wide-field camera on the William Herschel Telescope(WHT)and reduced in a standard manner using IRAF.g,Rs,I imaging in SSA22and Westphal-14was obtained from the public re-lease in Steidel et al.(2003),and the details are described therein.Additional SSA22imaging was obtained with the LFC instrument(g)on the Palomar5m telescope and the CFHT-12k mosaic camera(R,I),and was reduced with MSCRED in IRAF.References to all these instruments are listed in Table1.Near-infrared imaging is also avail-able for the majority of submm sources in ourfields from a number of different instruments and telescopes,typically reaching at least K=20and J=22.Details of the opti-cal,radio,and submm data in eachfield is given in Table1. The near-IR properties of our SMGs are discussed fully in Smail et al.(2004a).SMGs with radio identifications allow the position of the rest-frame FIR emission to be unambiguously identi-fied with a position in the optical imaging to within the relative astrometric alignment of the radio/optical frames. Optical images were distortion corrected,and tied to the same astrometric grid as the radio data using large num-bers of optically-bright radio sources across thefield,re-sulting in an rms positional uncertainty of typically∼0.5′′(see the detailed discussions in Richards2000;Ivison et al. 2002).The R AB-magnitudes(subsequently called R)in2′′apertures of the targets range from R=18.3to R>27.5 (Fig.1).Targets were selected for spectroscopic followup from the sevenfields,chosen at random and prioritized equally, without preference for optical brightness.Observations of two sources were obtained with ESI echelle spectrograph on the Keck-II telescope on the night of2001July16 and have been previously discussed by Chapman et al. (2002c).Over the course of seven observing runs between 2002March and2004February we observed98of the104 sources in our radio-SMG sample with the Low Resolu-tion Imaging Spectrograph(LRIS,Oke et al.1995)spec-trograph on the Keck-I telescope8,obtaining reliable red-shifts for a total of73galaxies.Thefirst ten spectroscopic identifications from our program were presented in C03. The details of the spectroscopic configurations for our observing runs and their success rates are presented in Table2.Observations taken with LRIS using several dif-ferent settings of gratings and cameras.Data taken before 2002March was obtained before the commissioning of the large mosaic CCD blue camera,and used a smaller format blue device.All subsequent data was taken with the larger format(4k×4k)blue camera(Steidel et al.2004).Our ob-servations use either the5600˚A[D560]or6800˚A[D680] dichroic to divide the light between the red and blue cam-eras.The400l/mm[B400]grism was always used in the blue arm to provide wavelength coverage from the atmo-spheric limit out to the dichroic wavelength for most of the slitlets on the masks.This grism provides reasonable resolution(∼5–6˚A)with our adopted1.2–1.4′′slitwidths. Either the400l/mm[R400]or600l/mm[R600]gratings were used in the red arm,dependent on the dichroic se-lected.Spectral resolutions of∼6–8˚A are achieved in the red.Integration times were between1.5–6.0hrs in dark or gray conditions,split into30-min exposures.Conditions varied from photometric to light cirrus,and seeing ranged between0.7′′and1.1′′.Data reduction followed standard multi-slit techniques using custom iraf scripts.The spec-tra typically probe an observed wavelength range of3100–8000˚A.2.1.Spectroscopic Identifications8The data presented herein were obtained at the W.M.Keck Observatory,which is operated as a scientific partnership among the California Institute of Technology,the University of California and the National Aeronautics and Space Administration.The Observatory was made possible by the generousfinancial support of the W.M.Keck Foundation.4Fig.1.—Thisfigure compares the properties of our spectroscopically-identified sample to the parent catalog of all submm galaxies identified in the radio waveband and observed spectroscopically.We show the relative distributions of R-magnitude,radioflux, and submmflux(the shaded histograms are the spectroscopic sample).As expected the spectroscopically-unidentified galaxies are typically fainter in the optical,but have similar1.4GHz/850µm ratios,consistent with the suggestion that they are likely to lie at similar redshifts to our spectroscopically-identified sample,but are on average more obscured in their restframe UV.To obtain redshifts from our spectroscopic observa-tions,one-dimensional spectra were compared with tem-plate spectra and emission line catalogs.Of the98radio-SMGs observed,redshifts were obtained with confidencefor73galaxies,for a total spectroscopic completeness of74%.The distribution of the optical,radio,and submmfluxes of the parent and spectroscopically identified sam-ple are shown in Fig.1.Representative spectra are shownin Fig.3.Table1lists the number of radio-SMGs ob-served with LRIS in eachfield,and the number of success-ful redshift measurements.Field tofield variations reflectweather quality,as well as intrinsic source properties(e.g.,Lyαline strength).Twelve SMGs from our sample have pre-viously published redshifts from other groups:SMM J141741.90+522823.6,SMM J141742.20+523026.0by Eales et al.(2000);SMM J030244.56+000632.3by Webb et al.(2003);SMM J123629.13+621045.8,SMM J123632.61+620800.1,SMM J123634.51+621241.0,SMM J123635.59+621424.1,SMM J123607.53+621550.4,SMM J123721.87+621035.3,SMM J131201.17+424208.1,SMM J131215.27+423900.9,SMM J131225.20+424344.5by Barger et al.(2001a,2001b,2003).9The R AB magsof these sources are amongst the brightest in our sample,with an average R=22.3±2.2.All these redshifts fromthe literature are in agreement with our measurementswithin errors.Three further sources were tentatively identi-fied by Simpson et al.(2004)using the Subaru-OHS spectrograph.SMM J163658.19+410523.8agreeswith our redshift as noted in Simpson et al.(2004).However,SMM J105158.02+571800.3andSMM J141809.00+522803.8disagree with our measuredredshifts by d z=0.20and d z=0.16respectively.Our red-shift for SMM J105158.02+571800.3(z=2.239)is de-rived from two UV-absorption features and the detec-tion of Hα(Swinbank et al.2004),and we regard ourredshift as a more robust identification.Our redshiftfor SMM J141809.00+522803.8is derived primarily fromstrong Lyαin emission,but lies at a redshift(z=2.71)that makes it difficult to followup in nebular lines usingnear-IR spectrographs,casting some doubt on the realityof the Simpson et al.redshift(Simpson et al.2004in factsuggest that their redshift is likely to be spurious basedon the weakness of the features and the residuals presentfrom sky-line subtraction).The primary criteria for considering a redshift as robustis the identification of multiple emission/absorption lines.Our redshift identifications are confirmed by the detec-tion of other lines and continuum features in75%(55)ofthe identified spectra:AGN lines(C ivλ1549,S ivλ1397,N vλ1240),as well as weaker stellar and interstellar fea-tures,and continuum breaks.We also consider redshiftsto be robust if we detected a large equivalent width line(>20˚A),and there is supporting evidence that this lineis Lyα.Only one quarter(18)of the73spectroscopicredshifts are single-line identifications.There are threeitems of supporting evidence which are used to supportthe single-line Lyαidentifications:the identification of a 9Note that not all these sources were measured as SMGs,but were listed with spectroscopic redshifts in catalogs of radio or X-ray sources.Chapman et al.5continuum break (if the continuum is detected)across the proposed Ly αline from the red to the blue (3/18),the ab-sence of emission lines which do not match the proposed Ly α-derived redshift (all 18),and an asymmetrical line profile,with the blue-wing truncated,typical of Ly αemis-sion from high-redshift galaxies (8/18).In very few cases were identifications ambiguous using thesecriteria.Fig. 2.—We show possible SEDs describing the emissionfrom a typical SMG,lying near the median redshift for the model-corrected sample (z =2.4),with flux densities of 6mJy at 850µm and 50µJy at 1.4-GHz (near our radio detection limit).Overlaid are SED templates at three dust tempera-tures (25,32&45K)spanning the typical range observed in the SMGs.In the upper panel,the SEDs are normalized to the radio point to emphasize how sources with hotter charac-teristic dust temperatures,and lower implied dust masses,are missed in the submm at z >∼2.In the lower panel,the SEDs are normalized to the 850-µm point,highlighting how sources with cooler characteristic temperatures are undetectable in the radio at the redshifts higher than the sample median.While single line Ly αidentifications may not be convinc-ing to some readers,several arguments support our inter-pretation.For many of the single emission line detections,the observed wavelength lies below 4000˚A (sometimes be-low 3700˚A ),precluding a reasonable identification as [O ii ]λ3727at z <0.07given the optical faintness and submm/radio detection.We also have two independent tests of the reliability of our redshifts.Firstly,we have obtained Keck/NIRSPEC and VLT/ISAAC near-IR spectroscopic observations for a significant fraction of our sample to probe the nebular line emission to measure the star formation rates,estimate metallicities and study kinematics.These observations have successfully detected restframe H α(and frequently [N ii ])emission in 26cases (Swinbank et al.2004),con-firming the UV-based redshifts in the present paper.Ten of the 18single-line identifications have been confirmed in H α.The near-IR H αspectra were also able to break de-generacies in 5cases where spectral identifications basedonly on UV-absorption lines were consistent with two sim-ilar redshifts.These H α/[N ii ]results were also used to aid in the spectroscopic classification of our sample,as indi-cated in Table 3.Secondly,15of our SMG redshifts have been confirmed with CO line emission using the IRAM Plateau de Bure Interferometer (Neri et al.2003;Greve et al.2005),includ-ing 2single-line identifications.These detections not only confirm the precision of the UV-based redshifts for the counterparts we targeted,but equally importantly they also confirm that these galaxies are gas-rich systems suit-able to be the source of the luminous far-infrared emission detected in the submm waveband.The strength of the Ly αlines for the SMGs vary tremen-dously in both line flux (L νfrom 1–60µJy)and restframe equivalent width,which ranges from −3˚A (absorption)to >150˚A (we note that we see no obvious variation in the radio/submm properties of SMGs as a function of Ly αline strength).With the generally faint rest-frame UV continua exhibited by our SMG (65%are fainter than R AB >24.4),there is a bias in our sample against ob-taining redshifts for the weaker emission line sources at the faintest continuum fluxes.This is reflected in Fig.1,where the increased failure rate for obtaining spectroscopic redshifts is apparent for R AB >∼24.This bias is highlighted by the fact that sources with identifiable Ly αabsorption only appear in our sample for SMGs with R AB <∼25.We discuss the spectral properties and incompleteness of our sample in more detail in §3.4.3.RESULTS3.1.Sample properties and submm-radio selection effects To understand the characteristics of the submm popu-lation we first have to quantify how the selection criteria for our sample (e.g.,radio,submm and optical flux lim-its,spectroscopic incompleteness)may have influenced the observed properties.Fig.1shows our spectroscopic completeness as a func-tion of R -band magnitude,1.4-GHz radio flux and 850µm submm flux.The median properties of the parent sample are R AB =25.4±1.8,S 1.4GHz =75±127µJy and S 850µm =6.0±2.9mJy,while the spectroscopically-identified popu-lation has R AB =24.6±1.7,S 1.4GHz =78±106µJy and S 850µm =5.7±3.0mJy,As expected,our spectroscopic sample is biased towards the optically brighter galaxies (the median R -band magnitude for the unidentified spec-troscopic targets is R AB =26.1±1.2),but there is no discernable difference in the submm or radio distributions (which are effectively decoupled from the restframe UV emission).This suggests that the long-wavelength proper-ties of our spectroscopic sample are likely to be represen-tative of the more general submm population.A crucial feature of the present study is that by analyz-ing only the radio-identified SMG we are considering only part of the total SMG population.We must therefore de-termine the influence of the resulting selection function be-fore drawing wider conclusions about flux-limited submm samples.About 65%of the bright (>5mJy)SMG population are detectable in the deepest radio maps obtainable with the VLA (Ivison et al.2002;Chapman et al.2003a;Wang et al.2004;Borys et al.2004).Greve et al.(2004)and6Fig. 3.—Representative spectra for twelve SMGs from our complete sample.The strongest UV lines used in the redshift identifications are marked by dashed lines.All spectra have been shifted to a common rest-frame wavelength scale.。