ABSTRACT Correlative Multi-Label Video Annotation
- 格式:pdf
- 大小:575.51 KB
- 文档页数:10
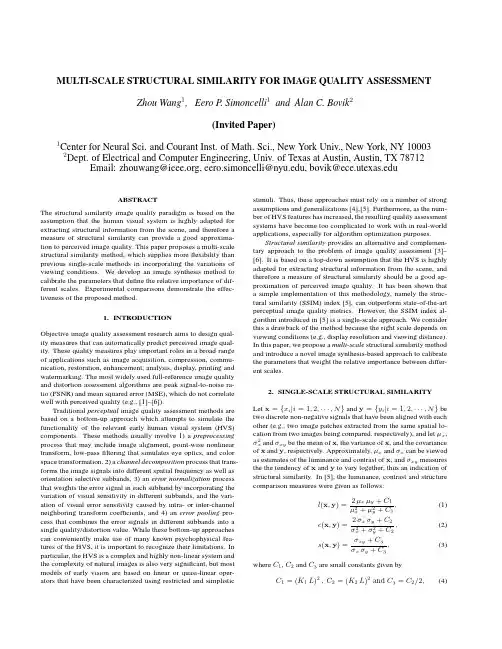
MULTI-SCALE STRUCTURAL SIMILARITY FOR IMAGE QUALITY ASSESSMENT Zhou Wang1,Eero P.Simoncelli1and Alan C.Bovik2(Invited Paper)1Center for Neural Sci.and Courant Inst.of Math.Sci.,New York Univ.,New York,NY10003 2Dept.of Electrical and Computer Engineering,Univ.of Texas at Austin,Austin,TX78712 Email:zhouwang@,eero.simoncelli@,bovik@ABSTRACTThe structural similarity image quality paradigm is based on the assumption that the human visual system is highly adapted for extracting structural information from the scene,and therefore a measure of structural similarity can provide a good approxima-tion to perceived image quality.This paper proposes a multi-scale structural similarity method,which supplies moreflexibility than previous single-scale methods in incorporating the variations of viewing conditions.We develop an image synthesis method to calibrate the parameters that define the relative importance of dif-ferent scales.Experimental comparisons demonstrate the effec-tiveness of the proposed method.1.INTRODUCTIONObjective image quality assessment research aims to design qual-ity measures that can automatically predict perceived image qual-ity.These quality measures play important roles in a broad range of applications such as image acquisition,compression,commu-nication,restoration,enhancement,analysis,display,printing and watermarking.The most widely used full-reference image quality and distortion assessment algorithms are peak signal-to-noise ra-tio(PSNR)and mean squared error(MSE),which do not correlate well with perceived quality(e.g.,[1]–[6]).Traditional perceptual image quality assessment methods are based on a bottom-up approach which attempts to simulate the functionality of the relevant early human visual system(HVS) components.These methods usually involve1)a preprocessing process that may include image alignment,point-wise nonlinear transform,low-passfiltering that simulates eye optics,and color space transformation,2)a channel decomposition process that trans-forms the image signals into different spatial frequency as well as orientation selective subbands,3)an error normalization process that weights the error signal in each subband by incorporating the variation of visual sensitivity in different subbands,and the vari-ation of visual error sensitivity caused by intra-or inter-channel neighboring transform coefficients,and4)an error pooling pro-cess that combines the error signals in different subbands into a single quality/distortion value.While these bottom-up approaches can conveniently make use of many known psychophysical fea-tures of the HVS,it is important to recognize their limitations.In particular,the HVS is a complex and highly non-linear system and the complexity of natural images is also very significant,but most models of early vision are based on linear or quasi-linear oper-ators that have been characterized using restricted and simplistic stimuli.Thus,these approaches must rely on a number of strong assumptions and generalizations[4],[5].Furthermore,as the num-ber of HVS features has increased,the resulting quality assessment systems have become too complicated to work with in real-world applications,especially for algorithm optimization purposes.Structural similarity provides an alternative and complemen-tary approach to the problem of image quality assessment[3]–[6].It is based on a top-down assumption that the HVS is highly adapted for extracting structural information from the scene,and therefore a measure of structural similarity should be a good ap-proximation of perceived image quality.It has been shown that a simple implementation of this methodology,namely the struc-tural similarity(SSIM)index[5],can outperform state-of-the-art perceptual image quality metrics.However,the SSIM index al-gorithm introduced in[5]is a single-scale approach.We consider this a drawback of the method because the right scale depends on viewing conditions(e.g.,display resolution and viewing distance). In this paper,we propose a multi-scale structural similarity method and introduce a novel image synthesis-based approach to calibrate the parameters that weight the relative importance between differ-ent scales.2.SINGLE-SCALE STRUCTURAL SIMILARITYLet x={x i|i=1,2,···,N}and y={y i|i=1,2,···,N}be two discrete non-negative signals that have been aligned with each other(e.g.,two image patches extracted from the same spatial lo-cation from two images being compared,respectively),and letµx,σ2x andσxy be the mean of x,the variance of x,and the covariance of x and y,respectively.Approximately,µx andσx can be viewed as estimates of the luminance and contrast of x,andσxy measures the the tendency of x and y to vary together,thus an indication of structural similarity.In[5],the luminance,contrast and structure comparison measures were given as follows:l(x,y)=2µxµy+C1µ2x+µ2y+C1,(1)c(x,y)=2σxσy+C2σ2x+σ2y+C2,(2)s(x,y)=σxy+C3σxσy+C3,(3) where C1,C2and C3are small constants given byC1=(K1L)2,C2=(K2L)2and C3=C2/2,(4)Fig.1.Multi-scale structural similarity measurement system.L:low-passfiltering;2↓:downsampling by2. respectively.L is the dynamic range of the pixel values(L=255for8bits/pixel gray scale images),and K1 1and K2 1aretwo scalar constants.The general form of the Structural SIMilarity(SSIM)index between signal x and y is defined as:SSIM(x,y)=[l(x,y)]α·[c(x,y)]β·[s(x,y)]γ,(5)whereα,βandγare parameters to define the relative importanceof the three components.Specifically,we setα=β=γ=1,andthe resulting SSIM index is given bySSIM(x,y)=(2µxµy+C1)(2σxy+C2)(µ2x+µ2y+C1)(σ2x+σ2y+C2),(6)which satisfies the following conditions:1.symmetry:SSIM(x,y)=SSIM(y,x);2.boundedness:SSIM(x,y)≤1;3.unique maximum:SSIM(x,y)=1if and only if x=y.The universal image quality index proposed in[3]corresponds to the case of C1=C2=0,therefore is a special case of(6).The drawback of such a parameter setting is that when the denominator of Eq.(6)is close to0,the resulting measurement becomes unsta-ble.This problem has been solved successfully in[5]by adding the two small constants C1and C2(calculated by setting K1=0.01 and K2=0.03,respectively,in Eq.(4)).We apply the SSIM indexing algorithm for image quality as-sessment using a sliding window approach.The window moves pixel-by-pixel across the whole image space.At each step,the SSIM index is calculated within the local window.If one of the image being compared is considered to have perfect quality,then the resulting SSIM index map can be viewed as the quality map of the other(distorted)image.Instead of using an8×8square window as in[3],a smooth windowing approach is used for local statistics to avoid“blocking artifacts”in the quality map[5].Fi-nally,a mean SSIM index of the quality map is used to evaluate the overall image quality.3.MULTI-SCALE STRUCTURAL SIMILARITY3.1.Multi-scale SSIM indexThe perceivability of image details depends the sampling density of the image signal,the distance from the image plane to the ob-server,and the perceptual capability of the observer’s visual sys-tem.In practice,the subjective evaluation of a given image varies when these factors vary.A single-scale method as described in the previous section may be appropriate only for specific settings.Multi-scale method is a convenient way to incorporate image de-tails at different resolutions.We propose a multi-scale SSIM method for image quality as-sessment whose system diagram is illustrated in Fig. 1.Taking the reference and distorted image signals as the input,the system iteratively applies a low-passfilter and downsamples thefiltered image by a factor of2.We index the original image as Scale1, and the highest scale as Scale M,which is obtained after M−1 iterations.At the j-th scale,the contrast comparison(2)and the structure comparison(3)are calculated and denoted as c j(x,y) and s j(x,y),respectively.The luminance comparison(1)is com-puted only at Scale M and is denoted as l M(x,y).The overall SSIM evaluation is obtained by combining the measurement at dif-ferent scales usingSSIM(x,y)=[l M(x,y)]αM·Mj=1[c j(x,y)]βj[s j(x,y)]γj.(7)Similar to(5),the exponentsαM,βj andγj are used to ad-just the relative importance of different components.This multi-scale SSIM index definition satisfies the three conditions given in the last section.It also includes the single-scale method as a spe-cial case.In particular,a single-scale implementation for Scale M applies the iterativefiltering and downsampling procedure up to Scale M and only the exponentsαM,βM andγM are given non-zero values.To simplify parameter selection,we letαj=βj=γj forall j’s.In addition,we normalize the cross-scale settings such thatMj=1γj=1.This makes different parameter settings(including all single-scale and multi-scale settings)comparable.The remain-ing job is to determine the relative values across different scales. Conceptually,this should be related to the contrast sensitivity func-tion(CSF)of the HVS[7],which states that the human visual sen-sitivity peaks at middle frequencies(around4cycles per degree of visual angle)and decreases along both high-and low-frequency directions.However,CSF cannot be directly used to derive the parameters in our system because it is typically measured at the visibility threshold level using simplified stimuli(sinusoids),but our purpose is to compare the quality of complex structured im-ages at visible distortion levels.3.2.Cross-scale calibrationWe use an image synthesis approach to calibrate the relative impor-tance of different scales.In previous work,the idea of synthesizing images for subjective testing has been employed by the“synthesis-by-analysis”methods of assessing statistical texture models,inwhich the model is used to generate a texture with statistics match-ing an original texture,and a human subject then judges the sim-ilarity of the two textures [8]–[11].A similar approach has also been qualitatively used in demonstrating quality metrics in [5],[12],though quantitative subjective tests were not conducted.These synthesis methods provide a powerful and efficient means of test-ing a model,and have the added benefit that the resulting images suggest improvements that might be made to the model[11].M )distortion level (MSE)12345Fig.2.Demonstration of image synthesis approach for cross-scale calibration.Images in the same row have the same MSE.Images in the same column have distortions only in one specific scale.Each subject was asked to select a set of images (one from each scale),having equal quality.As an example,one subject chose the marked images.For a given original 8bits/pixel gray scale test image,we syn-thesize a table of distorted images (as exemplified by Fig.2),where each entry in the table is an image that is associated witha specific distortion level (defined by MSE)and a specific scale.Each of the distorted image is created using an iterative procedure,where the initial image is generated by randomly adding white Gaussian noise to the original image and the iterative process em-ploys a constrained gradient descent algorithm to search for the worst images in terms of SSIM measure while constraining MSE to be fixed and restricting the distortions to occur only in the spec-ified scale.We use 5scales and 12distortion levels (range from 23to 214)in our experiment,resulting in a total of 60images,as demonstrated in Fig.2.Although the images at each row has the same MSE with respect to the original image,their visual quality is significantly different.Thus the distortions at different scales are of very different importance in terms of perceived image quality.We employ 10original 64×64images with different types of con-tent (human faces,natural scenes,plants,man-made objects,etc.)in our experiment to create 10sets of distorted images (a total of 600distorted images).We gathered data for 8subjects,including one of the authors.The other subjects have general knowledge of human vision but did not know the detailed purpose of the study.Each subject was shown the 10sets of test images,one set at a time.The viewing dis-tance was fixed to 32pixels per degree of visual angle.The subject was asked to compare the quality of the images across scales and detect one image from each of the five scales (shown as columns in Fig.2)that the subject believes having the same quality.For example,one subject chose the images marked in Fig.2to have equal quality.The positions of the selected images in each scale were recorded and averaged over all test images and all subjects.In general,the subjects agreed with each other on each image more than they agreed with themselves across different images.These test results were normalized (sum to one)and used to calculate the exponents in Eq.(7).The resulting parameters we obtained are β1=γ1=0.0448,β2=γ2=0.2856,β3=γ3=0.3001,β4=γ4=0.2363,and α5=β5=γ5=0.1333,respectively.4.TEST RESULTSWe test a number of image quality assessment algorithms using the LIVE database (available at [13]),which includes 344JPEG and JPEG2000compressed images (typically 768×512or similar size).The bit rate ranges from 0.028to 3.150bits/pixel,which allows the test images to cover a wide quality range,from in-distinguishable from the original image to highly distorted.The mean opinion score (MOS)of each image is obtained by averag-ing 13∼25subjective scores given by a group of human observers.Eight image quality assessment models are being compared,in-cluding PSNR,the Sarnoff model (JNDmetrix 8.0[14]),single-scale SSIM index with M equals 1to 5,and the proposed multi-scale SSIM index approach.The scatter plots of MOS versus model predictions are shown in Fig.3,where each point represents one test image,with its vertical and horizontal axes representing its MOS and the given objective quality score,respectively.To provide quantitative per-formance evaluation,we use the logistic function adopted in the video quality experts group (VQEG)Phase I FR-TV test [15]to provide a non-linear mapping between the objective and subjective scores.After the non-linear mapping,the linear correlation coef-ficient (CC),the mean absolute error (MAE),and the root mean squared error (RMS)between the subjective and objective scores are calculated as measures of prediction accuracy .The prediction consistency is quantified using the outlier ratio (OR),which is de-Table1.Performance comparison of image quality assessment models on LIVE JPEG/JPEG2000database[13].SS-SSIM: single-scale SSIM;MS-SSIM:multi-scale SSIM;CC:non-linear regression correlation coefficient;ROCC:Spearman rank-order correlation coefficient;MAE:mean absolute error;RMS:root mean squared error;OR:outlier ratio.Model CC ROCC MAE RMS OR(%)PSNR0.9050.901 6.538.4515.7Sarnoff0.9560.947 4.66 5.81 3.20 SS-SSIM(M=1)0.9490.945 4.96 6.25 6.98 SS-SSIM(M=2)0.9630.959 4.21 5.38 2.62 SS-SSIM(M=3)0.9580.956 4.53 5.67 2.91 SS-SSIM(M=4)0.9480.946 4.99 6.31 5.81 SS-SSIM(M=5)0.9380.936 5.55 6.887.85 MS-SSIM0.9690.966 3.86 4.91 1.16fined as the percentage of the number of predictions outside the range of±2times of the standard deviations.Finally,the predic-tion monotonicity is measured using the Spearman rank-order cor-relation coefficient(ROCC).Readers can refer to[15]for a more detailed descriptions of these measures.The evaluation results for all the models being compared are given in Table1.From both the scatter plots and the quantitative evaluation re-sults,we see that the performance of single-scale SSIM model varies with scales and the best performance is given by the case of M=2.It can also be observed that the single-scale model tends to supply higher scores with the increase of scales.This is not surprising because image coding techniques such as JPEG and JPEG2000usually compressfine-scale details to a much higher degree than coarse-scale structures,and thus the distorted image “looks”more similar to the original image if evaluated at larger scales.Finally,for every one of the objective evaluation criteria, multi-scale SSIM model outperforms all the other models,includ-ing the best single-scale SSIM model,suggesting a meaningful balance between scales.5.DISCUSSIONSWe propose a multi-scale structural similarity approach for image quality assessment,which provides moreflexibility than single-scale approach in incorporating the variations of image resolution and viewing conditions.Experiments show that with an appropri-ate parameter settings,the multi-scale method outperforms the best single-scale SSIM model as well as state-of-the-art image quality metrics.In the development of top-down image quality models(such as structural similarity based algorithms),one of the most challeng-ing problems is to calibrate the model parameters,which are rather “abstract”and cannot be directly derived from simple-stimulus subjective experiments as in the bottom-up models.In this pa-per,we used an image synthesis approach to calibrate the param-eters that define the relative importance between scales.The im-provement from single-scale to multi-scale methods observed in our tests suggests the usefulness of this novel approach.However, this approach is still rather crude.We are working on developing it into a more systematic approach that can potentially be employed in a much broader range of applications.6.REFERENCES[1] A.M.Eskicioglu and P.S.Fisher,“Image quality mea-sures and their performance,”IEEE munications, vol.43,pp.2959–2965,Dec.1995.[2]T.N.Pappas and R.J.Safranek,“Perceptual criteria for im-age quality evaluation,”in Handbook of Image and Video Proc.(A.Bovik,ed.),Academic Press,2000.[3]Z.Wang and A.C.Bovik,“A universal image quality in-dex,”IEEE Signal Processing Letters,vol.9,pp.81–84,Mar.2002.[4]Z.Wang,H.R.Sheikh,and A.C.Bovik,“Objective videoquality assessment,”in The Handbook of Video Databases: Design and Applications(B.Furht and O.Marques,eds.), pp.1041–1078,CRC Press,Sept.2003.[5]Z.Wang,A.C.Bovik,H.R.Sheikh,and E.P.Simon-celli,“Image quality assessment:From error measurement to structural similarity,”IEEE Trans.Image Processing,vol.13, Jan.2004.[6]Z.Wang,L.Lu,and A.C.Bovik,“Video quality assessmentbased on structural distortion measurement,”Signal Process-ing:Image Communication,special issue on objective video quality metrics,vol.19,Jan.2004.[7] B.A.Wandell,Foundations of Vision.Sinauer Associates,Inc.,1995.[8]O.D.Faugeras and W.K.Pratt,“Decorrelation methods oftexture feature extraction,”IEEE Pat.Anal.Mach.Intell., vol.2,no.4,pp.323–332,1980.[9] A.Gagalowicz,“A new method for texturefields synthesis:Some applications to the study of human vision,”IEEE Pat.Anal.Mach.Intell.,vol.3,no.5,pp.520–533,1981. [10] D.Heeger and J.Bergen,“Pyramid-based texture analy-sis/synthesis,”in Proc.ACM SIGGRAPH,pp.229–238,As-sociation for Computing Machinery,August1995.[11]J.Portilla and E.P.Simoncelli,“A parametric texture modelbased on joint statistics of complex wavelet coefficients,”Int’l J Computer Vision,vol.40,pp.49–71,Dec2000. [12]P.C.Teo and D.J.Heeger,“Perceptual image distortion,”inProc.SPIE,vol.2179,pp.127–141,1994.[13]H.R.Sheikh,Z.Wang, A. C.Bovik,and L.K.Cormack,“Image and video quality assessment re-search at LIVE,”/ research/quality/.[14]Sarnoff Corporation,“JNDmetrix Technology,”http:///products_services/video_vision/jndmetrix/.[15]VQEG,“Final report from the video quality experts groupon the validation of objective models of video quality assess-ment,”Mar.2000./.PSNRM O SSarnoffM O S(a)(b)Single−scale SSIM (M=1)M O SSingle−scale SSIM (M=2)M O S(c)(d)Single−scale SSIM (M=3)M O SSingle−scale SSIM (M=4)M O S(e)(f)Single−scale SSIM (M=5)M O SMulti−scale SSIMM O S(g)(h)Fig.3.Scatter plots of MOS versus model predictions.Each sample point represents one test image in the LIVE JPEG/JPEG2000image database [13].(a)PSNR;(b)Sarnoff model;(c)-(g)single-scale SSIM method for M =1,2,3,4and 5,respectively;(h)multi-scale SSIM method.。

硕士学位论文论 文 题 目 美国与中国视频广告中多模态隐喻的认知语言学研究—以啤酒广告为例 研究生姓名 陈彬彬指导教师姓名 苏晓军专业名称 外国语言学及应用语言学研究方向 认知语言学论文提交日期 2015年5月A Cognitive Linguistic Study of Multimodal Metaphors in Americanand Chinese Advertising: Based on Beer Video AdvertisingbyChen BinbinUnder the Supervision ofProfessor Su XiaojunSubmitted in Partial Fulfillment of the RequirementsFor the Degree of Master of ArtsSchool of Foreign LanguagesSoochow UniversityMay 2015ACKNOWLEDGEMENTSI would like to extend my wholehearted gratitude to all those who have helped me with my postgraduate studies.First of all, my sincere thanks go to my supervisor, Prof. Su Xiaojun, who has granted me great help by carefully scrutinizing every word and every figure of my thesis and offering me invaluable suggestions in conducting my research. Without his insightful comments and knowledgeable instructions I could not have completed the thesis in a satisfactory way. His commitment to academic research and rigorous attitude towards life have exerted great influence on me in terms of both study and life.I also feel deeply grateful to Prof. Zhu Xinfu, who supervised my undergraduate thesis and has long been concerned with my performance. Without his recommendation I could not have been so fortunate as to be guided by Prof. Su Xiaojun. It is his encouragement and inspiration that have driven me to seek for a higher level.My indebtedness goes to Prof. Wang Jun, Prof. Fang Hongmei, Prof. Wang Labao, Prof. Jiang Jin, Prof. Gao Yongchen and all the teaching staff in the School of Foreign Languages, Soochow University. Owing to their enlightening lectures and innovative ideas I have developed great interest in language.In addition, I want to express my heartfelt gratefulness to all the relatives, friends and classmates who have been supporting me not only in thesis writing but also in daily life. Without their solid backup the completion of my thesis would not have been possible.ABSTRACTThanks to globalization, different cultures have been on the way to integration, and the same is true for their advertising. However, the public often feel confused when distinguishing one piece of advertising from another. In response to this call for systemic studies on them scholars from many academies exert their efforts on analyzing metaphors in commercials, in terms of pictures and spoken languages. However, these attempts prove to be one tip of the iceberg as there are too many elements worth noticing in video advertising. It was until recently that public attention has been paid to the multimodal metaphors in commercials, but these scanty researches disperse in their subjects and have not included all the modalities, not to mention that a commercial is rich in carriers of conveying messages.This thesis attempts to make a comparative analysis of American and Chinese beer video advertising from the perspective of multimodal conceptual metaphor with the help of Multimodal Metaphor theory and some concepts borrowed from Conceptual Metaphor Theory. A corpus of 50 video advertising pieces of 10 beer brands, 5 from China and 5 from U.S.A. respectively, is established. By exploring into the mappings and entailments of these metaphors this thesis intends to find out the similarities and differences in using multimodalities, and then the universality and cross-cultural variations between these two countries, which might shed light on the understanding of beer advertising from America and China for potential consumers who want to spot the deep-rooted implications in advertising and for the businessmen who plan to pioneer in another market.Through thorough analyses this thesis concludes that similar conceptual metaphors, i.e. HAPPINESS IS DRINKING BEER and BEER IS A LIVING ORGANISM, exist in advertising from both countries which is rendered a result caused by universal embodiment and cultural congruence. Besides, visual modality remains to be the primary one in elaborating beer qualities. Nonetheless, theirpreference for modalities and the mappings and entailments underlying the conceptual metaphors differ between these two countries, which is under the impact of different ideological assumptions and cultural traits.Key Words: beer video advertising, conceptual metaphor, multimodal, universality, cross-cultural variation摘 要伴随着全球化的进程,不同文化之间相互借鉴和学习,其中之一就是广告的发展。

The ITU-T published J.144, a measurement of quality of service, for the transmission of television and other multimedia digital signals over cable networks. This defines the relationship between subjective assessment of video by a person and objective measurements taken from the network.The correlation between the two are defined by two methods:y Full Reference (Active) – A method applicable when the full reference video signal is available, and compared with the degraded signal as it passes through the network.y No Reference (Passive) – A method applicable when no reference video signal or informationis available.VIAVI believes that a combination of both Active and Passive measurements gives the correct blendof analysis with a good trade off of accuracy and computational power. T eraVM provides both voice and video quality assessment metrics, active and passive, based on ITU-T’s J.144, but are extended to support IP networks.For active assessment of VoIP and video, both the source and degraded signals are reconstituted from ingress and egress IP streams that are transmitted across the Network Under T est (NUT).The VoIP and video signals are aligned and each source and degraded frame is compared to rate the video quality.For passive measurements, only the degraded signal is considered, and with specified parameters about the source (CODEC, bit-rate) a metric is produced in real-time to rate the video quality.This combination of metrics gives the possibility of a ‘passive’ but lightweight Mean Opinion Score (MOS) per-subscriber for voice and video traffic, that is correlated with CPU-expensive but highly-accurate ‘active’ MOS scores.Both methods provide different degrees of measurement accuracy, expressed in terms of correlation with subjective assessment results. However, the trade off is the considerable computation resources required for active assessment of video - the algorithm must decode the IP stream and reconstitute the video sequence frame by frame, and compare the input and outputnframesto determine its score. The passive method is less accurate, but requires less computing resources. Active Video AnalysisThe active video assessment metric is called PEVQ– Perceptual Evaluation of Video Quality. PEVQ provides MOS estimates of the video quality degradation occurring through a network byBrochureVIAVITeraVMVoice, Video and MPEG Transport Stream Quality Metricsanalysing the degraded video signal output from the network. This approach is based on modelling the behaviour of the human visual tract and detecting abnormalities in the video signal quantified by a variety of KPIs. The MOS value reported, lies within a range from 1 (bad) to 5 (excellent) and is based on a multitude of perceptually motivated parameters.T o get readings from the network under test, the user runs a test with an video server (T eraVM or other) and an IGMP client, that joins the stream for a long period of time. The user selects the option to analysis the video quality, which takes a capture from both ingress and egress test ports.Next, the user launches the T eraVM Video Analysis Server, which fetches the video files from the server, filters the traffic on the desired video channel and converts them into standard video files. The PEVQ algorithm is run and is divided up into four separate blocks.The first block – pre-processing stage – is responsible for the spatial and temporal alignment of the reference and the impaired signal. This process makes sure, that only those frames are compared to each other that also correspond to each other.The second block calculates the perceptual difference of the aligned signals. Perceptual means that only those differences are taken into account which are actually perceived by a human viewer. Furthermore the activity of the motion in the reference signal provides another indicator representing the temporal information. This indicator is important as it takes into account that in frame series with low activity the perception of details is much higher than in frame series with quick motion. The third block in the figure classifies the previously calculated indicators and detects certain types of distortions.Finally, in the fourth block all the appropriate indicators according to the detected distortions are aggregated, forming the final result ‒ the mean opinion score (MOS). T eraVM evaluates the quality of CIF and QCIF video formats based on perceptual measurement, reliably, objectively and fast.In addition to MOS, the algorithm reports:y D istortion indicators: For a more detailed analysis the perceptual level of distortion in the luminance, chrominance and temporal domain are provided.y D elay: The delay of each frame of the test signal related to the reference signal.y Brightness: The brightness of the reference and degraded signal.y Contrast: The contrast of the distorted and the reference sequence.y P SNR: T o allow for a coarse analysis of the distortions in different domains the PSNR is provided for theY (luminance), Cb and Cr (chrominance) components separately.y Other KPIs: KPIs like Blockiness (S), Jerkiness, Blurriness (S), and frame rate the complete picture of the quality estimate.Passive MOS and MPEG StatisticsThe VQM passive algorithm is integrated into T eraVM, and when required produces a VQM, an estimation of the subjective quality of the video, every second. VQM MOS scores are available as an additional statistic in the T eraVM GUI and available in real time. In additionto VQM MOS scores, MPEG streams are analysed to determine the quality of each “Packet Elementary Stream” and exports key metrics such as Packets received and Packets Lost for each distinct Video stream within the MPEG Transport Stream. All major VoIP and Video CODECs are support, including MPEG 2/4 and the H.261/3/3+/4.2 TeraVM Voice, Video and MPEG Transport Stream Quality Metrics© 2020 VIAVI Solutions Inc.Product specifications and descriptions in this document are subject to change without notice.tvm-vv-mpeg-br-wir-nse-ae 30191143 900 0620Contact Us +1 844 GO VIAVI (+1 844 468 4284)To reach the VIAVI office nearest you, visit /contacts.VIAVI SolutionsVoice over IP call quality can be affected by packet loss, discards due to jitter, delay , echo and other problems. Some of these problems, notably packet loss and jitter, are time varying in nature as they are usually caused by congestion on the IP path. This can result in situations where call quality varies during the call - when viewed from the perspective of “average” impairments then the call may appear fine although it may have sounded severely impaired to the listener. T eraVM inspects every RTP packet header, estimating delay variation and emulating the behavior of a fixed or adaptive jitter buffer to determine which packets are lost or discarded. A 4- state Markov Model measures the distribution of the lost and discarded packets. Packet metrics obtained from the Jitter Buffer together with video codec information obtained from the packet stream to calculate a rich set of metrics, performance and diagnostic information. Video quality scores provide a guide to the quality of the video delivered to the user. T eraVM V3.1 produces call quality metrics, includinglistening and conversational quality scores, and detailed information on the severity and distribution of packet loss and discards (due to jitter). This metric is based on the well established ITU G.107 E Model, with extensions to support time varying network impairments.For passive VoIP analysis, T eraVM v3.1 emulates a VoIP Jitter Buffer Emulator and with a statistical Markov Model accepts RTP header information from the VoIP stream, detects lost packets and predicts which packets would be discarded ‒ feeding this information to the Markov Model and hence to the T eraVM analysis engine.PESQ SupportFinally , PESQ is available for the analysis of VoIP RTP Streams. The process to generate PESQ is an identical process to that of Video Quality Analysis.。

Linear Algebra and its Applications432(2010)2089–2099Contents lists available at ScienceDirect Linear Algebra and its Applications j o u r n a l h o m e p a g e:w w w.e l s e v i e r.c o m/l o c a t e/l aaIntegrating learning theories and application-based modules in teaching linear algebraୋWilliam Martin a,∗,Sergio Loch b,Laurel Cooley c,Scott Dexter d,Draga Vidakovic ea Department of Mathematics and School of Education,210F Family Life Center,NDSU Department#2625,P.O.Box6050,Fargo ND 58105-6050,United Statesb Department of Mathematics,Grand View University,1200Grandview Avenue,Des Moines,IA50316,United Statesc Department of Mathematics,CUNY Graduate Center and Brooklyn College,2900Bedford Avenue,Brooklyn,New York11210, United Statesd Department of Computer and Information Science,CUNY Brooklyn College,2900Bedford Avenue Brooklyn,NY11210,United Statese Department of Mathematics and Statistics,Georgia State University,University Plaza,Atlanta,GA30303,United StatesA R T I C L E I N F O AB S T R AC TArticle history:Received2October2008Accepted29August2009Available online30September2009 Submitted by L.Verde-StarAMS classification:Primary:97H60Secondary:97C30Keywords:Linear algebraLearning theoryCurriculumPedagogyConstructivist theoriesAPOS–Action–Process–Object–Schema Theoretical frameworkEncapsulated process The research team of The Linear Algebra Project developed and implemented a curriculum and a pedagogy for parallel courses in (a)linear algebra and(b)learning theory as applied to the study of mathematics with an emphasis on linear algebra.The purpose of the ongoing research,partially funded by the National Science Foundation,is to investigate how the parallel study of learning theories and advanced mathematics influences the development of thinking of individuals in both domains.The researchers found that the particular synergy afforded by the parallel study of math and learning theory promoted,in some students,a rich understanding of both domains and that had a mutually reinforcing effect.Furthermore,there is evidence that the deeper insights will contribute to more effective instruction by those who become high school math teachers and,consequently,better learning by their students.The courses developed were appropriate for mathematics majors,pre-service secondary mathematics teachers, and practicing mathematics teachers.The learning seminar focused most heavily on constructivist theories,although it also examinedThe work reported in this paper was partially supported by funding from the National Science Foundation(DUE CCLI 0442574).∗Corresponding author.Address:NDSU School of Education,NDSU Department of Mathematics,210F Family Life Center, NDSU Department#2625,P.O.Box6050,Fargo ND58105-6050,United States.Tel.:+17012317104;fax:+17012317416.E-mail addresses:william.martin@(W.Martin),sloch@(S.Loch),LCooley@ (L.Cooley),SDexter@(S.Dexter),dvidakovic@(D.Vidakovic).0024-3795/$-see front matter©2009Elsevier Inc.All rights reserved.doi:10.1016/a.2009.08.0302090W.Martin et al./Linear Algebra and its Applications432(2010)2089–2099Thematicized schema Triad–intraInterTransGenetic decomposition Vector additionMatrixMatrix multiplication Matrix representation BasisColumn spaceRow spaceNull space Eigenspace Transformation socio-cultural and historical perspectives.A particular theory, Action–Process–Object–Schema(APOS)[10],was emphasized and examined through the lens of studying linear algebra.APOS has been used in a variety of studies focusing on student understanding of undergraduate mathematics.The linear algebra courses include the standard set of undergraduate topics.This paper reports the re-sults of the learning theory seminar and its effects on students who were simultaneously enrolled in linear algebra and students who had previously completed linear algebra and outlines how prior research has influenced the future direction of the project.©2009Elsevier Inc.All rights reserved.1.Research rationaleThe research team of the Linear Algebra Project(LAP)developed and implemented a curriculum and a pedagogy for parallel courses in linear algebra and learning theory as applied to the study of math-ematics with an emphasis on linear algebra.The purpose of the research,which was partially funded by the National Science Foundation(DUE CCLI0442574),was to investigate how the parallel study of learning theories and advanced mathematics influences the development of thinking of high school mathematics teachers,in both domains.The researchers found that the particular synergy afforded by the parallel study of math and learning theory promoted,in some teachers,a richer understanding of both domains that had a mutually reinforcing effect and affected their thinking about their identities and practices as teachers.It has been observed that linear algebra courses often are viewed by students as a collection of definitions and procedures to be learned by rote.Scanning the table of contents of many commonly used undergraduate textbooks will provide a common list of terms such as listed here(based on linear algebra texts by Strang[1]and Lang[2]).Vector space Kernel GaussianIndependence Image TriangularLinear combination Inverse Gram–SchmidtSpan Transpose EigenvectorBasis Orthogonal Singular valueSubspace Operator DecompositionProjection Diagonalization LU formMatrix Normal form NormDimension Eignvalue ConditionLinear transformation Similarity IsomorphismRank Diagonalize DeterminantThis is not something unique to linear algebra–a similar situation holds for many undergraduate mathematics courses.Certainly the authors of undergraduate texts do not share this student view of mathematics.In fact,the variety ways in which different authors organize their texts reflects the individual ways in which they have conceptualized introductory linear algebra courses.The wide vari-ability that can be seen in a perusal of the many linear algebra texts that are used is a reflection the many ways that mathematicians think about linear algebra and their beliefs about how students can come to make sense of the content.Instruction in a course is based on considerations of content,pedagogy, resources(texts and other materials),and beliefs about teaching and learning of mathematics.The interplay of these ideas shaped our research project.We deliberately mention two authors with clearly differing perspectives on an undergraduate linear algebra course:Strang’s organization of the material takes an applied or application perspective,while Lang views the material from more of a“pure mathematics”perspective.A review of the wide variety of textbooks to classify and categorize the different views of the subject would reveal a broad variety of perspectives on the teaching of the subject.We have taken a view that seeks to go beyond the mathe-matical content to integrate current theoretical perspectives on the teaching and learning of undergrad-uate mathematics.Our project used integration of mathematical content,applications,and learningW.Martin et al./Linear Algebra and its Applications432(2010)2089–20992091 theories to provide enhanced learning experiences using rich content,student meta cognition,and their own experience and intuition.The project also used co-teaching and collaboration among faculty with expertise in a variety of areas including mathematics,computer science and mathematics education.If one moves beyond the organization of the content of textbooks wefind that at their heart they do cover a common core of the key ideas of linear algebra–all including fundamental concepts such as vector space and linear transformation.These observations lead to our key question“How is one to think about this task of organizing instruction to optimize learning?”In our work we focus on the conception of linear algebra that is developed by the student and its relationship with what we reveal about our own understanding of the subject.It seems that even in cases where researchers consciously study the teaching and learning of linear algebra(or other mathematics topics)the questions are“What does it mean to understand linear algebra?”and“How do I organize instruction so that students develop that conception as fully as possible?”In broadest terms, our work involves(a)simultaneous study of linear algebra and learning theories,(b)having students connect learning theories to their study of linear algebra,and(c)the use of parallel mathematics and education courses and integrated workshops.As students simultaneously study mathematics and learning theory related to the study of mathe-matics,we expect that reflection or meta cognition on their own learning will enable them to construct deeper and more meaningful understanding in both domains.We chose linear algebra for several reasons:It has not been the focus of as much instructional research as calculus,it involves abstraction and proof,and it is taken by many students in different programs for a variety of reasons.It seems to us to involve important mathematical content along with rich applications,with abstraction that builds on experience and intuition.In our pilot study we taught parallel courses:The regular upper division undergraduate linear algebra course and a seminar in learning theories in mathematics education.Early in the project we also organized an intensive three-day workshop for teachers and prospective teachers that included topics in linear algebra and examination of learning theory.In each case(two sets of parallel courses and the workshop)we had students reflect on their learning of linear algebra content and asked them to use their own learning experiences to reflect on the ideas about teaching and learning of mathematics.Students read articles–in the case of the workshop,this reading was in advance of the long weekend session–drawn from mathematics education sources including[3–10].APOS(Action,Process,Object,Schema)is a theoretical framework that has been used by many researchers who study the learning of undergraduate and graduate mathematics[10,11].We include a sketch of the structure of this framework and refer the reader to the literature for more detailed descriptions.More detailed and specific illustrations of its use are widely available[12].The APOS Theoretical Framework involves four levels of understanding that can be described for a wide variety of mathematical concepts such as function,vector space,linear transformation:Action,Process,Object (either an encapsulated process or a thematicized schema),Schema(Intra,inter,trans–triad stages of schema formation).Genetic decomposition is the analysis of a particular concept in which developing understanding is described as a dynamic process of mental constructions that continually develop, abstract,and enrich the structural organization of an individual’s knowledge.We believe that students’simultaneous study of linear algebra along with theoretical examination of teaching and learning–particularly on what it means to develop conceptual understanding in a domain –will promote learning and understanding in both domains.Fundamentally,this reflects our view that conceptual understanding in any domain involves rich mental connections that link important ideas or facts,increasing the individual’s ability to relate new situations and problems to that existing cognitive framework.This view of conceptual understanding of mathematics has been described by various prominent math education researchers such as Hiebert and Carpenter[6]and Hiebert and Lefevre[7].2.Action–Process–Object–Schema theory(APOS)APOS theory is a theoretical perspective of learning based on an interpretation of Piaget’s construc-tivism and poses descriptions of mental constructions that may occur in understanding a mathematical concept.These constructions are called Actions,Processes,Objects,and Schema.2092W.Martin et al./Linear Algebra and its Applications432(2010)2089–2099 An action is a transformation of a mathematical object according to an explicit algorithm seen as externally driven.It may be a manipulation of objects or acting upon a memorized fact.When one reflects upon an action,constructing an internal operation for a transformation,the action begins to be interiorized.A process is this internal transformation of an object.Each step may be described or reflected upon without actually performing it.Processes may be transformed through reversal or coordination with other processes.There are two ways in which an individual may construct an object.A person may reflect on actions applied to a particular process and become aware of the process as a totality.One realizes that transformations(whether actions or processes)can act on the process,and is able to actually construct such transformations.At this point,the individual has reconstructed a process as a cognitive object. In this case we say that the process has been encapsulated into an object.One may also construct a cognitive object by reflecting on a schema,becoming aware of it as a totality.Thus,he or she is able to perform actions on it and we say the individual has thematized the schema into an object.With an object conception one is able to de-encapsulate that object back into the process from which it came, or,in the case of a thematized schema,unpack it into its various components.Piaget and Garcia[13] indicate that thematization has occurred when there is a change from usage or implicit application to consequent use and conceptualization.A schema is a collection of actions,processes,objects,and other previously constructed schemata which are coordinated and synthesized to form mathematical structures utilized in problem situations. Objects may be transformed by higher-level actions,leading to new processes,objects,and schemata. Hence,reconstruction continues in evolving schemata.To illustrate different conceptions of the APOS theory,imagine the following’teaching’scenario.We give students multi-part activities in a technology supported environment.In particular,we assume students are using Maple in the computer lab.The multi-part activities,focusing on vectors and operations,in Maple begin with a given Maple code and drawing.In case of scalar multiplication of the vector,students are asked to substitute one parameter in the Maple code,execute the code and observe what has happened.They are asked to repeat this activity with a different value of the parameter.Then students are asked to predict what will happen in a more general case and to explain their reasoning.Similarly,students may explore addition and subtraction of vectors.In the next part of activity students might be asked to investigate about the commutative property of vector addition.Based on APOS theory,in thefirst part of the activity–in which students are asked to perform certain operation and make observations–our intention is to induce each student’s action conception of that concept.By asking students to imagine what will happen if they make a certain change–but do not physically perform that change–we are hoping to induce a somewhat higher level of students’thinking, the process level.In order to predict what will happen students would have to imagine performing the action based on the actions they performed before(reflective abstraction).Activities designed to explore on vector addition properties require students to encapsulate the process of addition of two vectors into an object on which some other action could be performed.For example,in order for a student to conclude that u+v=v+u,he/she must encapsulate a process of adding two vectors u+v into an object(resulting vector)which can further be compared[action]with another vector representing the addition of v+u.As with all theories of learning,APOS has a limitation that researchers may only observe externally what one produces and discusses.While schemata are viewed as dynamic,the task is to attempt to take a snap shot of understanding at a point in time using a genetic decomposition.A genetic decomposition is a description by the researchers of specific mental constructions one may make in understanding a mathematical concept.As with most theories(economics,physics)that have restrictions,it can still be very useful in describing what is observed.3.Initial researchIn our preliminary study we investigated three research questions:•Do participants make connections between linear algebra content and learning theories?•Do participants reflect upon their own learning in terms of studied learning theories?W.Martin et al./Linear Algebra and its Applications432(2010)2089–20992093•Do participants connect their study of linear algebra and learning theories to the mathematics content or pedagogy for their mathematics teaching?In addition to linear algebra course activities designed to engage students in explorations of concepts and discussions about learning theories and connections between the two domains,we had students construct concept maps and describe how they viewed the connections between the two subjects. We found that some participants saw significant connections and were able to apply APOS theory appropriately to their learning of linear algebra.For example,here is a sketch outline of how one participant described the elements of the APOS framework late in the semester.The student showed a reasonable understanding of the theoretical framework and then was able to provide an example from linear algebra to illustrate the model.The student’s description of the elements of APOS:Action:“Students’approach is to apply‘external’rules tofind solutions.The rules are said to be external because students do not have an internalized understanding of the concept or the procedure tofind a solution.”Process:“At the process level,students are able to solve problems using an internalized understand-ing of the algorithm.They do not need to write out an equation or draw a graph of a function,for example.They can look at a problem and understand what is going on and what the solution might look like.”Object level as performing actions on a process:“At the object level,students have an integrated understanding of the processes used to solve problems relating to a particular concept.They un-derstand how a process can be transformed by different actions.They understand how different processes,with regard to a particular mathematical concept,are related.If a problem does not conform to their particular action-level understanding,they can modify the procedures necessary tofind a solution.”Schema as a‘set’of knowledge that may be modified:“Schema–At the schema level,students possess a set of knowledge related to a particular concept.They are able to modify this set of knowledge as they gain more experience working with the concept and solving different kinds of problems.They see how the concept is related to other concepts and how processes within the concept relate to each other.”She used the ideas of determinant and basis to illustrate her understanding of the framework. (Another student also described how student recognition of the recursive relationship of computations of determinants of different orders corresponded to differing levels of understanding in the APOS framework.)Action conception of determinant:“A student at the action level can use an algorithm to calculate the determinant of a matrix.At this level(at least for me),the formula was complicated enough that I would always check that the determinant was correct byfinding the inverse and multiplying by the original matrix to check the solution.”Process conception of determinant:“The student knows different methods to use to calculate a determinant and can,in some cases,look at a matrix and determine its value without calculations.”Object conception:“At the object level,students see the determinant as a tool for understanding and describing matrices.They understand the implications of the value of the determinant of a matrix as a way to describe a matrix.They can use the determinant of a matrix(equal to or not equal to zero)to describe properties of the elements of a matrix.”Triad development of a schema(intra,inter,trans):“A singular concept–basis.There is a basis for a space.The student can describe a basis without calculation.The student canfind different types of bases(column space,row space,null space,eigenspace)and use these values to describe matrices.”The descriptions of components of APOS along with examples illustrate that this student was able to make valid connections between the theoretical framework and the content of linear algebra.While the2094W.Martin et al./Linear Algebra and its Applications432(2010)2089–2099descriptions may not match those that would be given by scholars using APOS as a research framework, the student does demonstrate a recognition of and ability to provide examples of how understanding of linear algebra can be organized conceptually as more that a collection of facts.As would be expected,not all participants showed gains in either domain.We viewed the results of this study as a proof of concept,since there were some participants who clearly gained from the experience.We also recognized that there were problems associated with the implementation of our plan.To summarize ourfindings in relation to the research questions:•Do participants make connections between linear algebra content and learning theories?Yes,to widely varying degrees and levels of sophistication.•Do participants reflect upon their own learning in terms of studied learning theories?Yes,to the extent possible from their conception of the learning theories and understanding of linear algebra.•Do participants connect their study of linear algebra and learning theories to the mathematics content or pedagogy for their mathematics teaching?Participants describe how their experiences will shape their own teaching,but we did not visit their classes.Of the11students at one site who took the parallel courses,we identified three in our case studies (a detailed report of that study is presently under review)who demonstrated a significant ability to connect learning theories with their own learning of linear algebra.At another site,three teachers pursuing math education graduate studies were able to varying degrees to make these connections –two demonstrated strong ability to relate content to APOS and described important ways that the experience had affected their own thoughts about teaching mathematics.Participants in the workshop produced richer concept maps of linear algebra topics by the end of the weekend.Still,there were participants who showed little ability to connect material from linear algebra and APOS.A common misunderstanding of the APOS framework was that increasing levels cor-responded to increasing difficulty or complexity.For example,a student might suggest that computing the determinant of a2×2matrix was at the action level,while computation of a determinant in the 4×4case was at the object level because of the increased complexity of the computations.(Contrast this with the previously mentioned student who observed that the object conception was necessary to recognize that higher dimension determinants are computed recursively from lower dimension determinants.)We faced more significant problems than the extent to which students developed an understanding of the ideas that were presented.We found it very difficult to get students–especially undergraduates –to agree to take an additional course while studying linear algebra.Most of the participants in our pilot projects were either mathematics teachers or prospective mathematics teachers.Other students simply do not have the time in their schedules to pursue an elective seminar not directly related to their own area of interest.This problem led us to a new project in which we plan to integrate the material on learning theory–perhaps implicitly for the students–in the linear algebra course.Our focus will be on working with faculty teaching the course to ensure that they understand the theory and are able to help ensure that course activities reflect these ideas about learning.4.Continuing researchOur current Linear Algebra in New Environments(LINE)project focuses on having faculty work collaboratively to develop a series of modules that use applications to help students develop conceptual understanding of key linear algebra concepts.The project has three organizing concepts:•Promote enhanced learning of linear algebra through integrated study of mathematical content, applications,and the learning process.•Increase faculty understanding and application of mathematical learning theories in teaching linear algebra.•Promote and support improved instruction through co-teaching and collaboration among faculty with expertise in a variety of areas,such as education and STEM disciplines.W.Martin et al./Linear Algebra and its Applications432(2010)2089–20992095 For example,computer and video graphics involve linear transformations.Students will complete a series of activities that use manipulation of graphical images to illustrate and help them move from action and process conceptions of linear transformations to object conceptions and the development of a linear transformation schema.Some of these ideas were inspired by material in Judith Cederberg’s geometry text[14]and some software developed by David Meel,both using matrix representations of geometric linear transformations.The modules will have these characteristics:•Embed learning theory in linear algebra course for both the instructor and the students.•Use applied modules to illustrate the organization of linear algebra concepts.•Applications draw on student intuitions to aid their mental constructions and organization of knowledge.•Consciously include meta-cognition in the course.To illustrate,we sketch the outline of a possible series of activities in a module on geometric linear transformations.The faculty team–including individuals with expertise in mathematics,education, and computer science–will develop a series of modules to engage students in activities that include reflection and meta cognition about their learning of linear algebra.(The Appendix contains a more detailed description of a module that includes these activities.)Task1:Use Photoshop or GIMP to manipulate images(rotate,scale,flip,shear tools).Describe and reflect on processes.This activity uses an ACTION conception of transformation.Task2:Devise rules to map one vector to another.Describe and reflect on process.This activity involves both ACTION and PROCESS conceptions.Task3:Use a matrix representation to map vectors.This requires both PROCESS and OBJECT conceptions.Task4:Compare transform of sum with sum of transforms for matrices in Task3as compared to other non-linear functions.This involves ACTION,PROCESS,and OBJECT conceptions.Task5:Compare pre-image and transformed image of rectangles in the plane–identify software tool that was used(from Task1)and how it might be represented in matrix form.This requires OBJECT and SCHEMA conceptions.Education,mathematics and computer science faculty participating in this project will work prior to the semester to gain familiarity with the APOS framework and to identify and sketch potential modules for the linear algebra course.During the semester,collaborative teams of faculty continue to develop and refine modules that reflect important concepts,interesting applications,and learning theory:Modules will present activities that help students develop important concepts rather than simply presenting important concepts for students to absorb.The researchers will study the impact of project activities on student learning:We expect that students will be able to describe their knowledge of linear algebra in a more conceptual(structured) way during and after the course.We also will study the impact of the project on faculty thinking about teaching and learning:As a result of this work,we expect that faculty will be able to describe both the important concepts of linear algebra and how those concepts are mentally developed and organized by students.Finally,we will study the impact on instructional practice:Participating faculty should continue to use instructional practices that focus both on important content and how students develop their understanding of that content.5.SummaryOur preliminary study demonstrated that prospective and practicing mathematics teachers were able to make connections between their concurrent study of linear algebra and of learning theories relating to mathematics education,specifically the APOS theoretical framework.In cases where the participants developed understanding in both domains,it was apparent that this connected learning strengthened understanding in both areas.Unfortunately,we were unable to encourage undergraduate students to consider studying both linear algebra and learning theory in separate,parallel courses. Consequently,we developed a new strategy that embeds the learning theory in the linear algebra。
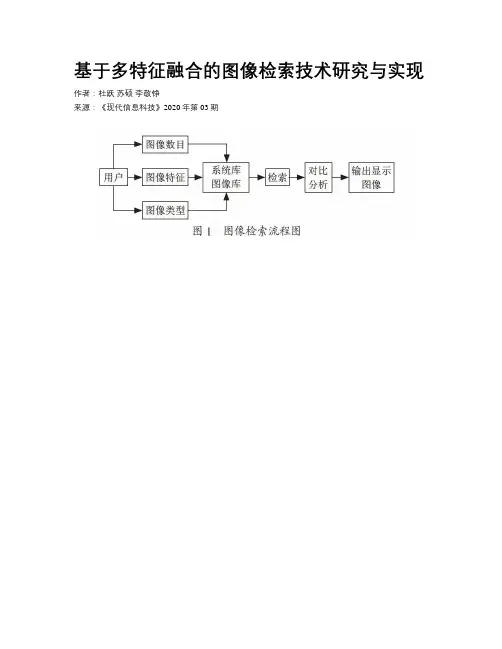
基于多特征融合的图像检索技术研究与实现作者:杜跃苏硕李敬铮来源:《现代信息科技》2020年第03期摘; 要:为了满足精准、智能、高效的图像检索方式,提出了一种基于多特征融合图像检索方法,多特征图像检索技术实现的图像检索使用了图像自身的多特征作为图像检索的依据,提高了图像搜索的精准性和高效性。
通过测试,实验结果证实了多特征融合图像检索技术利用了图像的颜色和纹理等作为检索的特征,多特征融合图像检索系统具有一定的学术意义和现实价值,能够大幅度提高图像检索的精确性,满足了用户的需求,具有良好的实用价值。
关键词:多特征融合;图像检索;纹理;图像特征中图分类号:TP391.41; ; ; ;文献标识码:A 文章编号:2096-4706(2020)03-0083-003Abstract:In order to meet the requirements of accurate,intelligent and efficient image retrieval,a method of image retrieval based on multi feature fusion is proposed. The image retrieval realized by multi feature image retrieval technology uses the multi feature of image itself as the basis of image retrieval,which improves the accuracy and efficiency of image retrieval. Through the test,the experimental results confirm that the multi feature fusion image retrieval technology uses the color and texture of the image as the retrieval features. The multi feature fusion image retrieval system has certain academic significance and practical value,can greatly improve the accuracy of image retrieval,meet the needs of users,and has good practical value.0; 引; 言当前,随着科学技术的发展,互联网技术不断发展,但是图像检索的效率仍然过于低下,互联网的高速发展给人们提供了大量的信息资源,但是不断增加的数据资源也给人们带来了一定的困难,即如何在海量数据资源中实现对信息的检索,提高用户的查询效率,因此目前急需一种更加精准、高效、智能的图像检索技术。
Two-tier image annotation model based on a multi-labelclassifier and fuzzy-knowledge representation schemeMarina Ivasic-Kos a,n,Miran Pobar a,Slobodan Ribaric ba Department of Informatics,University of Rijeka,Rijeka,Croatiab Faculty of Electrical Engineering and Computing,University of Zagreb,Zagreb,Croatiaa r t i c l e i n f oArticle history:Received31October2014Received in revised form31August2015Accepted22October2015Available online6November2015Keywords:Image annotationKnowledge representationInference algorithmsFuzzy Petri NetMulti-label image classificationa b s t r a c tAutomatic image annotation involves automatically assigning useful keywords to an unlabelled image.Themajor goal is to bridge the so-called semantic gap between the available image features and the keywordsthat people might use to annotate images.Although different people will most likely use different words toannotate the same image,most people can use object or scene labels when searching for images.We propose a two-tier annotation model where thefirst tier corresponds to object-level and thesecond tier to scene-level annotation.In thefirst tier,images are annotated with labels of objects present inthem,using multi-label classification methods on low-level features extracted from images.Scene-levelannotation is performed in the second tier,using the originally developed inference-based algorithms forannotation refinement and for scene recognition.These algorithms use a fuzzy knowledge representationscheme based on Fuzzy Petri Net,KRFPNs,that is defined to enable reasoning with concepts useful forimage annotation.To define the elements of the KRFPNs scheme,novel data-driven algorithms foracquisition of fuzzy knowledge are proposed.The proposed image annotation model is evaluated separately on thefirst and on the second tier usinga dataset of outdoor images.The results outperform the published results obtained on the same imagecollection,both on the object-level and on scene-level annotation.Different subsets of features composedof dominant colours,image moments,and GIST descriptors,as well as different classification methods(RAKEL,ML-kNN and Naïve Bayes),were tested in thefirst tier.The results of scene level annotation in thesecond tier are also compared with a common classification method(Naïve Bayes)and have shownsuperior performance.The proposed model enables the expanding of image annotation with new conceptsregardless of their level of abstraction.&2015Elsevier Ltd.All rights reserved.1.IntroductionImage retrieval,search and organisation have become a problem on account of the huge number of images produced daily.In order to simplify these tasks,different approaches for image retrieval have been proposed that can be roughly divided into those that compare visual content(content-based image retrieval)and those that use text descriptions of images(text-based image retrieval)[27,7].Image retrieval based on text has appeared to be easier,more natural and more suitable for people in most everyday cases.This is because it is much simpler to write a keyword-based query than to provide image examples,and it is likely that the user does not have an example image of the query.Besides,images corresponding to the same keywords can be very diverse.For example,if a person has an image of a town,but wants a different view,content-based retrieval would not be the best choice because most of the results would be too similar to the image he already has.On the other hand,very diverse images can be retrieved with a keyword query,e.g.for the keyword Dubrovnik,different views of the town can be retrieved(Fig.1.).To be able to retrieve images using text,they must be labelled or described in the surrounding text.However,most images are not. Since manually providing image annotation is a tedious and expensive task,especially when dealing with a large number of images, automatic image annotation has appeared as a solution.Contents lists available at ScienceDirectjournal homepage:/locate/prPattern Recognition/10.1016/j.patcog.2015.10.0170031-3203/&2015Elsevier Ltd.All rightsreserved.n Correspondence to:R.Matejčić2,51000Rijeka,Croatia.Tel.:þ38551584710.E-mail address:marinai@uniri.hr(M.Ivasic-Kos).Pattern Recognition52(2016)287–305Automatic annotation methods deal with visual features that can be extracted from the raw image data,such as colour,texture and structure,and can automatically assign metadata in the form of keywords from a controlled vocabulary to an unlabelled image.The major goal is to bridge the so-called semantic gap [12]between the available features and the keywords that could be useful to people.In the paper [15]an image representation model is given to re flect the semantic levels of words used in image annotation.This problem is challenging because different people will most likely annotate the same image with different words that re flect their knowledge of the context of the image,their experience and cultural background.However,most people when searching for images use two types of labels:object and scene labels.Object labels correspond to objects that can be recognised in an image,like sky,trees,tracks and train for the image in Fig.2a.Scene labels represent the context of the whole image,like SceneTrain or more general Transportation for Fig.2a.Scene labels can be either directly obtained as a result of the global classi fication of image features [23]or inferred from object labels,as proposed in our approach.Since object and scene labels are most commonly used,in this paper we focus on automatic image annotation at scene and object levels.We propose a two-tier annotation model for automatic image annotation,where the first tier corresponds to object annotation and the second tier to scene-level annotation.An overview of the proposed model is given after the sections with the related work,in Section 3.The first assumption is that there can be many objects in any image,but an image can be classi fied into one scene.The second assumption is that there are typical objects of which scenes are composed.Since many object labels can be assigned to an image,the object-level annotation was treated as a multi-label problem and appropriate multi-label classi fication methods RAKEL and ML-kNN were used.The details of object level annotation are given in Section 4.The scene-level annotation relies on originally developed inference based algorithm de fined for fuzzy knowledge representation scheme based on Fuzzy Petri Net,KRFPNs.The KRFPNs scheme and data-driven algorithms for knowledge acquisition about domain images are de fined in Section 5.The inference approach for annotation re finement at the object level is given in Section 6.The conclusions about scenes are drawn using inference-based algorithms on facts about image domain and object labels obtained in the first tier,as detailed in Section 7.The major contributions of this paper can be summarised as follows:1.The adaptive two-tier annotation model in which each tier can be independently used and modi fied.2.The first tier uses multi-label classi fication to suit the image annotation at object level.3.The second tier uses inference-based algorithms to handle the recognition of scenes and higher-level concepts that do not have speci fic low-level features.4.The de finition of the knowledge representation scheme based on Fuzzy Petri Nets,to represent knowledge about domain images that is often incomplete,uncertain and ambiguous.5.Novel data-driven algorithms for acquisition of fuzzy knowledge about relations between objects and about scenes.6.Novel inference based algorithm for annotation re finement to reduce the error propagation through the hierarchical structure of concepts during the inference of scenes.7.Novel inference based algorithm for automatic scene recognition.8.A comparison of inference based scene classi fication with an ordinary classi fication approach.The performance of the proposed two-tier automatic annotation system was evaluated on outdoor images with regard to different feature subsets (dominant colours,moments,GIST descriptors [23]and compared to the published results obtained on the same image database as detailed in Section 8.The inference based scene classi fication is also compared with an ordinary classi fication approach and has shown better performance.The paper ends with a conclusion and directions for future work,Section 8.Fig.1.Part of the image search results for the keyword"Dubrovnik".Object labelstracks, train, cloud, sky, trees,snow, polar bear Scene label SceneTrain, Transportation ScenePolarbear, WildLife, ArcticFig.2.Examples of images and their annotation at object and scene levels.M.Ivasic-Kos et al./Pattern Recognition 52(2016)287–3052882.Related workAutomatic image annotation (AIA)has been an active research topic in recent years due to its potential impact on image retrieval,search,image interpretation and description.The AIA approaches proposed so far can be divided in various ways,e.g.according to the theory they are most related to [9]or according to the semantic level of concepts that are used for annotation [30].AIA approaches are most closely related to statistical theory and machine learning or logical reasoning and arti ficial intelligence,while semantic levels can be organised into flat or structured vocabularies.Classical AIA approaches belonging to the field of machine learning look for mapping between image features and concepts at object or scene levels.Classi fication and probabilistic modelling have been extensively used for this purpose.Methods based on classi fication,such as the one described in [17],treat each of the semantic keywords or concepts as an independent class and assign each of them to one classi fier.Methods based on the translation model [10]and methods,which use latent semantic analysis [22]fall into the category of probabilistic methods that aim to learn a relevance model to represent correlations between images and keywords.A recent survey of research in this field can be found in [35,7].Lately,graph-based methods have been intensively investigated to apply logical reasoning to images,and many graph-based image analysis algorithms have proven to be successful.Conceptual graphs which encode the interpretation of the image are used for image annotation.Pan et al.[24]have proposed a graph-based method for image annotation in which images,annotations and regions are considered as three types of nodes of a mixed media graph.In [19],automatic image annotation is performed using two graph-based learning processes.In the first graph,the nodes are images and the edges are relations between the images,and in the second graph the nodes are words and the edges are relations between the words.In [8],the authors aim to illustrate each of the concepts from the WordNet ontology with 500-1000images in order to create public image ontology called ImageNet.Within the project aceMedia,in [21]ontology is combined with fuzzy logic to generate concepts from the beach domain.In [1],the same group of authors has used a combination of different classi fiers for learning concepts and fuzzy spatial relationships.In [13],a framework based on Fuzzy Petri Nets is proposed for image annotation at object level.In the fuzzy-knowledge base,nodes are features and objects.Co-occurrence relations are de fined between objects,and attribute relations are de fined between objects and features.The idea of introducing a fuzzy knowledge representation scheme into image annotation system proposed in our previous research[14,16],is further developed in this paper.New inference-based algorithms for scene classi fication and annotation re finement as well as algorithms for data-driven knowledge acquisition are formally de fined and enhanced.As opposed to the previous work where object level classi fication was performed using classi fication of segmented images,object level annotation is treated here as a multi-label classi fication problem on the whole image.Binder et al.[3]have proposed a method called Output Kernel Multi-Task Learning (MTL)to improve ranking performance.Zhang et al.[36]have de fined a graph-based representation for loosely annotated images where each node is de fined as a collection of discriminative image patches annotated with object category labels.The edge linking two nodes models the co-occurrence relationship among different objects in the same image.3.Overview of the two-tier image annotation modelImages of outdoor scenes commonly contain one or more objects of interest,for instance person,boat,dog,bridge and different kinds of background objects such as sky,grass,water ,etc.However,people often think about these images as a whole,interpreting them asscenes,Fig.3.Framework of a two-tier automatic image annotation system.M.Ivasic-Kos et al./Pattern Recognition 52(2016)287–305289for example tennis match instead of person,court,racket,net ,and ball .To make the image annotation more useful for organising and for the retrieval of images,it should contain both object and scene labels.Object labels correspond to classes whose instances can be recognised in an image.Scene labels are used to represent the context or semantics of the whole image,according to common sense and expert knowledge.To deal with different levels of annotation with object and scene labels,a two-tier automatic image annotation model using a multi-label classi fier and a fuzzy-knowledge representation scheme is proposed.In the first tier,multi-label classi fication is proposed since it can provide reliable recognition of speci fic objects without the need to include knowledge.However,higher-level concepts usually do not correspond to speci fic low-level features,and inference based on knowledge about the domain is therefore more appropriate.The relationships between objects in a scene can be easily identi fied and are generally unchanging,so they can be used to infer scenes and more abstract concepts.Still,knowledge about objects and scenes is usually imprecise,somewhat ambiguous and incomplete.Therefore,fuzzy-knowledge representation is used in the second tier.The architecture of the proposed system is depicted in Fig.3.The input to the system is an unlabelled image and the results of automatic annotation are object and scene labels.First,from each image,low-level features are extracted which represent the geometric and photometric properties of the image.Each image is then represented by the m -component feature vector x ¼ðx 1;x 2;…;x m ÞT .The obtained features are used for object classi fication.The assumption is that more than one object can be relevant for image annotation,so multi-label classi fication methods are used.The result of the image classi fication in the first tier is object labels from the set C of all object labels.In the second tier,the object labels are used for scene-level classi fication.Scene-level classi fication is supported by the image-domain knowledge base,where each scene is de fined as a composition of typical object classes.Other concepts at different levels of abstraction can be inferred using the de fined hierarchical relations among concepts.Relations among objects and scenes can also be used to check the consistency of object labels and to discard those that do not fit the likely context.In this way,the propagation of errors is reduced through the hierarchical structure of concepts during the inference of scenes or more abstract concepts.To represent fuzzy knowledge about the domain of interest,a knowledge-representation scheme based on the Fuzzy Petri Net formalism [26]is de fined.The proposed scheme has the ability to cope with uncertain,imprecise,and fuzzy knowledge about concepts and relations,and enables reasoning about them.The knowledge-representation scheme related to image domain and inference-based algorithms for annotation re finement and for scene recognition are implemented as Java classes.The elements of the scheme are gen-erated utilising the proposed data-driven algorithms for acquisition of fuzzy knowledge,which are implemented in Matlab.4.Multi-label classi fication in the first tierIn the general case,an image can contain multiple objects in both the foreground and the background.All objects appearing on the image,or many of them,can be useful or important for automatic image interpretation.All objects appearing on the image are potentially useful and hold important information for automatic image interpretation.To preserve as much information about the image as possible,many object labels are usually assigned to an image.Therefore,image annotation at the object level is an inherently multi-label classi fication problem.Here we have used different feature sets with appropriate multi-label classi fication methods.4.1.Feature setsThe variety of perceptual and semantic information about objects in an outdoor image could be contained in global low-level features such as dominant colour,spatial structure,colour histogram and texture.For classi fication in the first tier,we used a feature set made up of dominant colours of the whole image (global dominant colours)and of parts of the image (region based dominant colours),colour moments and the GIST descriptor.The used set of features is constructed to represent the varied aspects of image representation including colour and structure information.The dominant colours were selected from the colour histogram of the image.The colour histogram was calculated for each of the RGB colour channels of the whole image.Next,histogram bins with the highest values for each channel were selected as dominant colours.AfterOriginal image 3x1 grid Central andbackground regionFig.4.Original images and the arrangement of a 3x1image grid and central and background regions from which the dominant colours features were computed.M.Ivasic-Kos et al./Pattern Recognition 52(2016)287–305290experimenting with different number of different colours (3–36)per channel we chose to use 12of them in each image as features (referred to as DC)for our classi fication tasks.The information about the colour layout of an image was preserved using 5local RGB histograms,from which dominant colours were extracted in the same manner as for the whole image.The local dominant colours are referred to as DC1to DC5.To calculate the DC1,DC2and DC3local features,a histogram was computed for each cell of a 3x1grid applied to each image.The DC4feature was computed in the central part of the image,presumably containing the main image object,and the DC5feature in the surrounding part that would probably contain the background,as shown in Fig.4.The size of the central part was 1/4of the diagonal size of the whole image,and of the same proportions.There are 12dominant colours with 3channels giving a 36-dimensional feature vector of global DC.The size of local dominant colours vector (DC1to DC5)is 180(12dominant coloursx3channelsx5image parts).Additionally,we computed the colour moments (CM)for each RGB channel:mean,standard deviation,skewness and kurtosis.The size of the CM feature vector is 12(4colour moments for 3channels).The GIST image descriptor [23]that was proven to be ef ficient for scene recognition was also used as a region-based feature.It is a structure-based image descriptor that refers to the dominant spatial structure of the image characterized by the properties of its boundaries (e.g.,the size,degree of openness,perspective)and its content (e.g.,naturalness,roughness).The spatial properties are estimated using the global features computed as a weighted combination of Gabor-like multi scale-oriented filters.In our case,we used 8Â8encoding samples in the GIST descriptor within 8orientations per 8scales of image components,so the GIST feature vector has 512components.We performed the classi fication tasks using all the extracted features (DC,DC1..DC5,CM,GIST).The size of the feature vector used for classi fication was 740.Since the size of the feature vector is large in proportion to the number of images,we also tested the classi fication performance using five subsets.4.2.Image annotation at object levelWe attempt to label images with both foreground and background object labels,assuming that they are all useful for image annotation.Since an image may be associated with multiple object labels,the annotation at the object level in the first tier is treated as a multi-label classi fication problem.Multi-label image classi fication can be formally expressed as φ:E -P ðC Þ,where E is a set of image examples,P ðC Þis a power set of the set of class labels C and there is at least one example e j A E that is mapped into two or more classes,i.e.(e j A E:φe j ÀÁZ 2j .The methods most commonly used to tackle a multi-label classi fication problem can be divided into two different approaches [29].In the first,the multi-label classi fication problem is transformed into more single-label classi fication problems [20],known as the data transformation approach.The aim is to transform the data so that any classi fication method designed for single-label classi fication can be applied.However,data transformation approaches usually do not exploit the patterns of labels that naturally occur in multi-label setting.For example,dolphin usually appears together with sea ,while observing the labels cheetah and fish is much less common.On the other hand,algorithm adaptation methods extend speci fic learning algorithms in order to handle multi-label data directly and can sometimes utilise the inherent co-occurrence of labels.Another issue in multi-label classi fication is the fact that typically some labels occur more rarely in the data and it may be dif ficult to train individual classi fiers for those labels.For the multi-label classi fication task,we used the Multi-label k-Nearest Neighbour (ML-kNN)[34],a lazy learning algorithm derived from the traditional kNN algorithm,and RAKEL (RAndom k-labELsets)[28]which is an example of data adaptation methods.The kNN classi fier is a nonlinear and adaptive algorithm that is rather well suited for rarely occurring labels.The RAKEL algorithm considers a small random subset of labels and uses a single-label classi fier for the prediction of each element in the power set of this subset.In this way,the algorithm aims to take into account label correlations using single-label classi fiers.In our case,kNN classi fier and the C4.5classi fication tree are used as base single-label classi fiers for RAKEL.The base classi fiers are applied to subtasks with a manageable number of labels.It was experimentally shown that for our task the best results are obtained using RAKEL with the C4.5as base classi fier.We also used the Naïve Bayes (NB)classi fier along with data transformation.The data were transformed so that each instance with multiple labels was replaced with elements of the binary relation ρD E ÂC between a set of samples E and a set of class labels C .An ordered pair ðe ;c ÞA E ÂC can be interpreted as “e is classi fied into c ”and is often written as e ρc .For example,if an image example e 15A E was annotated with labels φe 15ðÞ¼lion ;sky ;grass ÈÉ;lion ;sky ;grass A E,it was transformed into three single-label instances e 15ρlion ;e 15ρsky ;e 15ρgrass .With NB,a model is learned for each label separately,and the result is the union of all labels that are obtained as a result of a binary classi fication in one-vs.-all fashion and with RAKEL for small subsets of labels.Unlike the NB,with RAKEL and ML-kNN a model is learned for small subsets of labels and therefore as a result of the classi fication only such subsets can be obtained.In both cases,incorrect labels can also be assigned to an image along with correct ones if they are in the assigned subset for RAKEL and kNN case,or if they are a result of binary misclassi fication for NB.For the one-vs.-all case,the inherent correlations among labels are not used,but an annotation re finement post-processing step is proposed here that incorporates label correlations and excludes from results labels that do not normally occur together with other labels in images.The object labels and the corresponding con fidence obtained as a result of the multi-label classi fication in the first tier of the image annotation system are used as features for the recognition of scenes in the second tier.In case when the Naïve Bayes classi fier is used,con fidence of each object is set according to the posterior probability of that object class.Otherwise,when classi fier used in the first tier cannot provide information on the con fidence of the classi fication,e.g.when the ML-kNN classi fier is used,the con fidence value is set to 1.Object labels from the annotation set φe ðÞD C and the corresponding con fidence values make the set Φe ðÞ&φe ðÞÂ0;1½ that is input to the inference based algorithm for scene recognition in the second tier.5.Knowledge representation in the second tierThe assumption is that there are typical objects of which scenes are composed,so each scene is treated as a composition of objects that are selected as typical,based on the used training dataset.To enable making inferences about scenes,relations between objects and scenes and relations between objects in an image are modelled and stored in a knowledge base.Facts about scenes and objects are collected M.Ivasic-Kos et al./Pattern Recognition 52(2016)287–305291automatically from the training dataset and organised in a knowledge representation scheme.It is a faster and more effective way of collecting speci fic knowledge then manually building the knowledge base,since it is a broad,uncertain domain of knowledge and expertise is not clearly de fined.An expert only de fines facts related to general knowledge like hierarchical relationships between concepts so the need for manual de finition of facts is reduced drastically.However,an expert can still review generated facts and modify them if necessary.Due to the inductive nature of generating facts,the acquired knowledge is often incomplete and unreliable,so the ability to draw conclusions about scenes from imprecise,vague knowledge becomes necessary.Additionally,the inference of an unknown scene relies on facts about objects that are obtained as classi fication results in the first tier and that are subject to errors.Apart from using a knowledge representation scheme that allows representation of fuzzy knowledge and can handle uncertain reasoning,the algorithm for object annotation re finement is proposed to detect and discard those objects that do not fit the context and so to prevent error propagation.For the purpose of knowledge representation,a scheme based on KRFPN formalism [26],which is in turn based on the Fuzzy Petri Net,is de fined to represent knowledge about outdoor images as well as to support subsequent reasoning about scenes in the second tier of the system.The de finition of a fuzzy knowledge representation scheme adapted for automatic image annotation,named KRFPNs and the novel data-driven algorithms for automatic acquisition of knowledge about object and scenes,and relations between them,are detailed below.5.1.De finition of the KRFPNs scheme adapted for image annotationThe elements of the knowledge base used for the annotation of outdoor images,particularly fuzzy knowledge about scenes and relationships among objects,are presented using the KRFPNs scheme.The KRFPNs scheme concatenates elements of the Fuzzy Petri Net (FPN )with a semantic interpretation and is de fined as:KRFPNs ¼FPN ;^α;^β;D ;Σ :ð1ÞFPN ¼ðP ;T ;I ;O ;M ;Ω;f ;c Þis a Fuzzy Petri Net where P ¼p 1;p 2;:::;p n ÈÉ;n A N is a finite set of places,T ¼t 1;t 2;:::;t m f g ;m A N is a finite set of transitions,I :T -P P ðÞ=∅is the input function and O :T -P P ðÞ=∅is the output function,where P P ðÞis the power set of places.The sets of places and transitions are disjunctive,P \T ¼∅,and the link between places and transitions is given with the input and output functions.Elements P ;T ;I ;O are parts of an ordinary Petri Net (PN).M ¼m 1;m 2;…;m r f g ;r Z 0is a set of tokens used to de fine the state of a PN in discrete steps.The state of the net in step w is de fined with distribution of tokens:Ωw :P -P M ðÞ,where P M ðÞis a power set of M .The initial distribution of tokens is denoted as Ω0and in our case,in the initial distribution a place can have no or at most one token,so j Ω0p ðÞj A 0;1f g .A place p is marked in step w if Ωw ðp Þa ∅.Marked places are important for the firing of transitions and the execution of the net.Firing of the transitions changes the distribution of tokens and causes the change of the net state.Fuzziness in the scheme is implemented with functions c :M -½0;1 and f :T -½0;1 that associate tokens and transitions with truth values in the range [0,1],where zero means “not true ”and one “always true ”.Semantic interpretation of places and transitions is implemented in the scheme with functions ^αand ^βin order to link elements of the scheme with concepts related to image annotation.The function ^α:P -D Â0;1½ ;maps a place p i A P to a concept and the corresponding con fidence value d j ;c d j ÀÁÀÁ:d j A D ;c d j ÀÁ¼max c m l ðÞ;m l A Ωp i ÀÁ.If there are no tokens in the place,the token value is zero.An alternative function thatdiffers in the codomain is de fined ;α:P -D .The function α,is a bijective function,so its inverse exists αÀ1:D -P .Those functions are useful for mapping a place p i A P in the scheme to a concept d j and vice versa,when no information about the con fidence of a concept is needed.The set of concepts D contains object and scene labels used for annotation of outdoor images,D ¼C [SC .A set C contains object labels such as,Airplane ;Train ;Shuttle ;Ground ;Cloud ;Sky ;Coral ;ÈDolphin ;Bird ;Lion ;Mountain g &C and set SC contains scene labels on different is SC ¼{SceneAirplane,SceneBear,..,Seaside,Space,Undersea}.The function ^β:T -ΣÂ0;1½ &D ÂD Â0;1½ ;maps a transition t j A T to a pair d pk σi d pl ;c j ÀÁ:σi A Σ;d pk ;d pl A D ;αÀ1ðd pk Þ¼p k ;αÀ1ðd pl Þ¼p l ;p k A I t j ÀÁ;p l A O t j ÀÁ;c j ¼f t j ÀÁwhere the first element is the relation between concepts linked with input and output places of the tran-sition t j and the second is its con fidence value.The function β:T -Σthat differs in the codomain is also de fined and is useful for checking whether there is an association between a transition and a relation.The set Σcontains relations and is de fined as Σ¼o ccurs _with ;is _part _of ;is _a .The relation σ1¼occurs _with is a pseudo-spatial relation that is de fined between objects and it models the joint occurrence of objects in images.The compositional relation σ2¼is _part _of is de fined between scenes and objects,re flecting the assumption that objects are parts of a scene.The hierarchical relation σ3¼is _a is de fined between scenes to model a taxonomic hierarchy between scenes.The con fidence values of σ1¼occurs _with and σ2¼is _part _of relations are de fined according to the used training dataset,and in case of σ3¼is _a it is de fined by an expert.5.2.Data-driven knowledge acquisition and automatic de finition of KRFPNs schemeThe process of knowledge acquisition related to annotation re finement and scene recognition is supported with algorithms that enable automatic extraction of knowledge from existing data in the training set and arrangement of acquired knowledge in the knowledge representation scheme.Automated knowledge acquisition is a fast and economic way of collecting knowledge about the domain and can be used to estimate the con fidence values of acquired facts especially when the domain knowledge is by nature broad as is the case with the image annotation.In that case experts are not able to provide a comprehensive overview of possible relationships between objects in different scenes or objectively evaluate their reliability.Automatically accumulated knowledge is very dependent on the examples in the data set,and to make it more general the estimated con fidences of facts are further adjusted.In addition,to improve the knowledge base consistency,completeness and accuracy,and to enhance the inference process,an expert can review or modify the existing facts and rules or add new ones.M.Ivasic-Kos et al./Pattern Recognition 52(2016)287–305292。

软件学报ISSN 1000-9825, CODEN RUXUEWE-mail:************.cn Journal of Software ,2020,31(4):1079-1089 [doi: 10.13328/ki.jos.005923] ©中国科学院软件研究所版权所有. Tel: +86-10-62562563基于标签语义注意力的多标签文本分类*肖 琳, 陈博理, 黄 鑫, 刘华锋, 景丽萍, 于 剑(交通数据分析与挖掘北京市重点实验室(北京交通大学),北京 100044)通信作者: 景丽萍,E-mail:***************.cn摘 要: 自大数据蓬勃发展以来,多标签分类一直是令人关注的重要问题,在现实生活中有许多实际应用,如文本分类、图像识别、视频注释、多媒体信息检索等.传统的多标签文本分类算法将标签视为没有语义信息的符号,然而,在许多情况下,文本的标签是具有特定语义的,标签的语义信息和文档的内容信息是有对应关系的,为了建立两者之间的联系并加以利用,提出了一种基于标签语义注意力的多标签文本分类(LAbel Semantic Attention Multi-label Classification,简称LASA)方法,依赖于文档的文本和对应的标签,在文档和标签之间共享单词表示.对于文档嵌入,使用双向长短时记忆(bi-directional long short-term memory,简称Bi-LSTM)获取每个单词的隐表示,通过使用标签语义注意力机制获得文档中每个单词的权重,从而考虑到每个单词对当前标签的重要性.另外,标签在语义空间里往往是相互关联的,使用标签的语义信息同时也考虑了标签的相关性.在标准多标签文本分类的数据集上得到的实验结果表明,所提出的方法能够有效地捕获重要的单词,并且其性能优于当前先进的多标签文本分类算法. 关键词: 多标签学习;文本分类;标签语义;注意力机制中图法分类号: TP311 中文引用格式: 肖琳,陈博理,黄鑫,刘华锋,景丽萍,于剑.基于标签语义注意力的多标签文本分类.软件学报,2020,31(4): 1079-1089. /1000-9825/5923.htm英文引用格式: Xiao L, Chen BL, Huang X, Liu HF, Jing LP, Yu J. Multi-label text classification method based on label semantic information. Ruan Jian Xue Bao/Journal of Software, 2020,31(4):1079-1089 (in Chinese). /1000-9825/5923. htmMulti-label Text Classification Method Based on Label Semantic InformationXIAO Lin, CHEN Bo-Li, HUANG Xin, LIU Hua-Feng, JING Li-Ping, YU Jian(Beijing Key Laboratory of Traffic Data Analysis and Mining (Beijing Jiaotong University), Beijing 100044, China)Abstract : Multi-label classification has been a practical and important problem since the boom of big data. There are many practical applications, such as text classification, image recognition, video annotation, multimedia information retrieval, etc. Traditional multi-label text classification algorithms regard labels as symbols without inherent semantics. However, in many scenarios these labels have specific semantics, and the semantic information of labels have corresponding relationship with the content information of the documents, in order to establish the connection between them and make use of them, a label semantic attention multi-label classification (LASA) method is proposed based on label semantic attention. The texts and labels of the document are relied on to share the word representation between the texts and labels. For documents embedding, bi-directional long short-term memory (Bi-LSTM) is used to obtain the hidden representation of each word. The weight of each word in the document is obtained by using the semantic representation of the label, thus* 基金项目: 国家自然科学基金(61822601, 61773050, 61632004); 北京市自然科学基金(Z180006); 北京市科委项目(Z18110000 8918012)Foundation item: National Natural Science Foundation of China (61822601, 61773050, 61632004); Beijing Natural Science Foundation of China (Z180006); Beijing Municipal Science & Technology Commission (Z181100008918012)本文由“非经典条件下的机器学习方法”专题特约编辑高新波教授、黎铭教授、李天瑞教授推荐.收稿时间: 2019-05-29; 修改时间: 2019-07-29; 采用时间: 2019-09-20; jos 在线出版时间: 2020-01-10CNKI 网络优先出版: 2020-01-14 09:53:23, /kcms/detail/11.2560.TP.20200114.0953.009.html1080 Journal of Software软件学报 V ol.31, No.4, April 2020taking into account the importance of each word to the current label. In addition, labels are often related to each other in the semantic space, by using the semantic information of the labels, the correlation of the labels is considered to improve the classification performance of the model. The experimental results on the standard multi-label classification datasets show that the proposed method can effectively capture important words, and its performance is better than the existing state-of-the-art multi-label classification algorithms.Key words: multi-label; text classification; label semantic; attention mechanism随着即时通信、网页等在线内容的快速增长,人们正处在一个海量数据触手可及的信息社会中,各种类型的数据不断产生,数据量大且又具有多样性,这意味着我们不能使用传统的技术进行处理,如何设计有效的分类系统来自动处理这些内容成为我们解决问题的关键.在传统的分类方法中,每个样本示例只属于一个类别标记,即单标记学习.但是现实生活中很多对象是同时属于多个类别,具有多个标签.为了直观反映多义性对象中的多种标记,人们自然而然地想到了为该对象明确地赋予标记子集.基于以上思想,Schapire[1]提出了多标记学习.多标签学习是指从标签集合中为每个实例分配最相关的类标签子集的过程.例如,一个体坛新闻报导很可能既属于“体育”类别,又属于“奥运会”类别,还可能属于“游泳”或者“跳水”类别.多标签分类在现实生活中有许多实际应用,例如,文本分类、多媒体信息检索、视频注释、基因功能预测等.多标签文本分类是多标签分类的重要分支之一,主要应用于主题识别[2]、情感分析[3]、问答系统[4]等.多标签文本数据具有以下特点:(1) 多标签分类允许一个文档属于多个标签,所以标签之间存在相关性;(2) 文档可能很长,复杂的语义信息可能隐藏在噪音或冗余的内容中;(3) 大多数文档只属于少数标签,大量的“尾标签”只有少数的训练文档.由于多标签文本数据的特点,研究人员重点关注以下3点内容:(1) 如何准确挖掘标签之间的相关性;(2) 如何从文档中充分捕捉有效信息;(3) 如何从每个文档中提取与对应标签相关的鉴别信息.随着注意力机制的出现,结合Bi-LSTM可有效解决单词远距离依赖的问题同时捕获文档中重要的单词,研究者基于注意力机制提出了各种多标签文本分类模型[3,5,6],但是传统的注意力机制仅仅是基于文档内容学习单词重要性权重,将标签看成没有语义信息的原子符号.在多标签文本分类的任务中,标签是文本且含有语义信息,我们有理由期望利用标签的语义信息指导模型提取文档中重要信息可以进一步提升模型的分类效果.通过上述分析,虽然多标签学习已经得到了广泛的关注并取得了一系列进步,但仍有若干问题和挑战有待于进一步地深入研究并解决.其中,如何学习和利用标签的语义信息指导多标签文本分类是关键问题.因此,本文提出了一种融合标签语义信息的标签注意力机制模型,通过使用标签的语义信息,在考虑标签相关性的同时,获取文档中每个词的重要性.本文使用双向长短时记忆网络(Bi-LSTM)获得每个单词的隐表示,再通过标签的语义表示结合注意力机制获得每个标签和文档中单词的匹配得分,得分与单词表示融合得到每个标签在当前文档下的文档表示,通过全连接层获得每个标签的概率,最后,利用交叉熵损失进行训练.本文的主要贡献如下.1) 本文提出基于标签语义信息的注意力机制,利用标签语义注意力机制捕获每个标签关注的单词,为当前文档中每个标签学习一个文档表示.2) 本文提出的模型通过使用标签的语义信息,考虑了标签的相关性,同时有效地缓解了多标签分类中的尾标签问题,从而大大提升了模型的预测效果.3) 本文与当前具有代表性的多标签文本分类方法进行了比较评估,通过使用3个基准数据集,对提出的算法性能进行了全面的评估,实验结果表明,我们提出的方法在很大程度上优于基线算法.1 相关工作许多分类方法已被提出来以解决多标签学习问题,前期工作主要集中在基于传统机器学习算法的研究,主要包括问题转换方法和算法适应方法两大类.第1类方法中的算法独立,它通过将多标记学习的任务转化为传统的一个或多个单标记学习任务来进行处理,而完成单标记分类任务已有很多成熟算法可供选择,Binary Relevance(BR)[7]是一种典型的问题转换型方法,将多标签学习问题分解为多个独立的二元分类问题,但是由于BR缺乏发现标签之间相互依赖性的能力,可肖琳 等:基于标签语义注意力的多标签文本分类 1081 能造成预测性能的降低.Label Powerset(LP)[8]算法为每个可能的标签组合生成一组新的标记,然后将问题解决为单标签多类,但在变换之后可能产生样本不平衡的问题.Classifier Chain(CC)[9]分类器链是针对BR 方法未考虑标签之间的相关性而导致信息损失的缺陷的一种改进,该算法的基本思想是将多标签学习问题转换为二元分类问题链,链上每个节点对应于一个标记,该方法随后依次对链上的标记构建分类器,链中的后续分类器建立在前一个标签的预测之上,所以当对前面的标签预测错误时,该错误会一直沿着链传递下去.同时,这些方法的计算效率和性能都面临标签和样本空间过大的挑战.第2类通常扩展传统的单标记分类算法对其进行相应的改进来处理多标签数据.利用传统监督模式下的单标记学习理论和实践经验为多标记学习方法的探索提供了重要的参考.Ranking Support Vector Machine (Rank-SVM)方法[10]是建立在统计学习理论基础上的机器学习算法,将经典的支持向量机(SVM)推广到多标记学习问题中.Multi-label Decision Tree(ML-DT)[11]的基本思想是采用决策树技术来处理多标签数据,利用熵的信息增益准则递归地构建决策树.Multi-label k -Nearest Neighbor(ML-k NN)[12]使用K 近邻算法得到近邻样本的类别标记情况,再通过最大化后验概率推理得到未知示例的标记集合.随着深度神经网络的发展,研究者提出了各种基于深度神经网络的多标签文本分类模型[3,5,6,13-19].XML- CNN [13]使用卷积神经网络设计了一个动态池处理文本分类,然而该方法侧重于文档表示,忽略了标签之间的相关性.Kurata [17]提出使用标签的共现矩阵作为模型隐藏层和输出层的初始化权重,从而考虑了标签的相关性; CNN-RNN [6]提出将卷积神经网络和递归神经网络进行集成,捕捉文本的语义信息同时考虑标签相关性. Zhang [19]使用了标签结构信息,构建标签结构空间以探索标签之间的相关性.然而,以上算法均存在两个问题:(1) 由于积神经网络窗口大小的限制,无法捕获文本之间的远距离依赖关系;(2) 当模型预测时同等对待文档中的单词,包括那些冗余和噪音部分,没有重点关注那些对分类贡献大的单词.随后,Yang [5]提出将seq2seq 模型应用到多标签学习中,利用注意力机制获得每个词的重要性权重,输出每个预测标签.HN-ATT [3]提出使用两层注意力网络,分别学习句子和文档级别的表示,但是以上方法对所有标签使用相同的文本表示,未能捕捉到每个标签最相关的文本部分,You [6]注意到这个问题,使用自注意力机制[20]为每个标签学习一个文本表示但忽略了标签的相关性.在实际应用中,多标签文本分类的标签是具有语义信息的,但在文献[5,6,8-17,19]中将标签仅仅看成是原子符号,忽略了标签文本内容的潜在知识.在多标签文本分类中,标签是文本形式,由几个单词组成.词嵌入作为自然语言处理最基本的模块,它能够捕获单词之间的相似性和规律性,所以有大量的工作对标签同样使用词嵌入表示[18,21,22],它们赋予标签特定的语义信息,从而对上下文语义和标签语义进行建模.其中, Du [18]提出了将单词表示和标签表示作一个交互,获得每一个词与标签的匹配得分,但却没有更深层次地考虑到为不同标签学习不同的文档表示.为了进一步提高多标签文本分类的性能,本文提出一种基于标签语义信息获得文本中单词重要性的多标签分类算法,通过聚合这些信息性词汇获得最终文档表示.2 基于标签语义信息的注意力文本分类方法2.1 问题描述数据集1{(,)}N i i i D x y ==由N 个文档x i 和对应的标签{{0,1}}l i i Y y =∈组成,l 为标签总数,对于文本分类,标签是具有语义信息的文本,将标签表示成C ={c 1,c 2,...,c l },标签的词向量c i ∈R k .每个文档x i ={w 1,w 2,…,w n }由一组词向量表示w i ∈R k ,n 是文本的长度,k 是单词嵌入的维度.标签和文档中的词向量可以通过预训练得到.多标签分类的目标是训练一个预测模型,能够将一个新的未标记的样本分类到l 个语义标签中.2.2 模型框架在本节中,将详细介绍本文提出的模型.受注意力机制的启发,由于注意力机制缺乏类的标签信息进行分类引导,我们提出了基于标签语义的注意力机制,利用标签语义学习文档中单词的重要性权重,获得每个标签在当前文档中对应的重要性词汇,最终为当前文档学习每个标签对应的文档表示,模型如图1所示.1082Journal of Software 软件学报 V ol.31, No.4, April 2020Fig.1 The overview of our model with text (length n ) for input and predicted scores for output图1 模型概述,输入文本(长度n )和输出预测得分2.3 单词隐表示学习本文的模型是基于文本数据建立的,在处理文本数据时,由于文档过长,使用传统的循环神经网络(RNN)或者N 元模型(N -gram)算法无法捕获相隔较远单词之间的依赖关系,LSTM [23]通过设计输入门、遗忘门、输出门解决了单词远距离依赖的问题,但是利用LSTM 对句子进行建模存在一个问题:无法编码从后到前的信息.Bi- LSTM [24]通过向前和向后分别训练一个LSTM,从前后两个方向提取句子的语义信息,更好地捕捉双向语义依赖关系,所以本文使用Bi-LSTM 学习每个单词的隐表示.给定文档中单词序列x i ={w 1,w 2,…,w n },LSTM 在t 时刻的更新状态如下:111111(),(),(),tanh(),tanh ,()t i t i t i t f t f t f t o t o t o t g t g t g t t t t t t t t i W w U h b f W w U h b o W w U h b g W w U h b c f c i g h o c σσσ------=++⎫⎪=++⎪⎪=++⎪⎬=++⎪⎪=⋅+⋅⎪⎪=⋅⎭(1) 其中,σ为sigmoid 激活函数,i t 、f t 、c t 、o t 分别为LSTM 的输入门、遗忘门、记忆门、输出门,W i 、W f 、W o 、W g 和U i 、U f 、U o 、U g 为模型参数,B i 、B f 、B o 、B g 为偏置项.使用Bi-LSTM 从两个方向读取文本中的每个词,并计算每个单词的隐状态: 11(,), (,)i i i i i i LSTM w LS h h h h TM w --== (2),,i i k h h ∈ 为了获得文档的整体表示,我们将文档中每个单词的隐状态串联,得到: 1212(,,...,), (,,...,)n n H h h h H h h h == (3) 这里的,n k H H ⨯∈ 为两个方向的文档表示. 2.4 标签隐表示学习对于标签文本集E ,其中任一标签的文本内容表示为e ={w 1,w 2,…,w p },,k j w ∈ p 是文本标签的长度,文本标 签长度一般在1~3之间.为了获得每个标签的隐表示c i ,我们使用标签的文本内容作为输入,使用词向量平均函数来计算标签的隐表示,描述如下: 11p i j j c w p ==∑ (4) ,k i c ∈ 表示标签嵌入维度,大小等于文档中单词的嵌入维度.词向量平均是一个简单并且不需要参数的计算过 程,通过词向量平均保持了文档中的单词和标签的表示是在同一空间下.另外,词向量的学习能够很好地表示单词的语义,通过将标签表示成词向量,语义相近的标签其词向量表示也是相近的,从而隐式地考虑到了标签之间肖琳 等:基于标签语义注意力的多标签文本分类1083的相关性.2.5 单词重要性学习 在预测不同的标签时,文档中每个单词起到的重要作用是不同的,为了捕获标签和文本中单词之间的潜在关系,本文设计基于标签语义信息的注意力机制获得每个单词的重要性,通过计算文档中单词和每个标签之间的匹配得分获得每个单词对当前标签的权重:T a cH = (5) 1,n a ⨯∈ 代表基于标签c 捕获的文档中每个单词的权重.数据集中全部的标签表示为矩阵,l k C ⨯∈ 其中,l 表示 数据集中标签的个数,则获得全部标签和单词的匹配得分为 , T T A CH A CH == (6) 得到所有标签针对当前文档中每个单词的匹配得分,,l n A A ⨯∈ 从匹配得分中可以获得文档中每个标签更 关注的部分,从而更好地学习文档表示.2.6 文档表示学习每个标签关注文档中的内容是不同的,所以本文提出为每个标签学习不同的文档表示,文档的表示是由每个单词的权重和单词的表示结合得到的,将上一层得到的单词和标签之间的匹配得分乘以每个单词的隐表示,得到每个标签对应的文档表示:,,[;]M AH M AH M M M ⎫=⎪⎪=⎬⎪=⎪⎭(7) 这里的,,l k M M ⨯∈ 最终得到2l k M ⨯∈ 为所有标签对应的文档表示,一个标签对应的文档表示为2.k i m ∈2.7 标签预测最后的标签预测,本文使用由两个全连接层和一个输出层组成的感知机实现.预测第i 个标签出现的概率通过下面的公式获得:21(()i i y W f W m σ= (8) 其中,21b k W ⨯∈ 为全连接层的参数,2b W ∈ 是输出层的参数,函数f 为非线性激活函数.算法1. LASA.输入:训练集1,{(,)}N i i i D x y ==测试集1{(),}Q i i S x ==对应的标签文本集E ; 输出:预测标签集ˆ.Y初始化:根据式(2)~式(4)学习单词和标签的嵌入表示;训练阶段:while not converge dofor x i in D1. 根据式(6)获得文档中单词重要性权重;2. 根据式(7)、式(8)获得文档表示;3. 基于文档表示,根据式(9)构造多标签文本分类器.更新网络参数W 1,W 2.endend测试阶段:for x i in S1084Journal of Software 软件学报 V ol.31, No.4, April 20201.根据式(6)获得文档中单词重要性权重;2.根据式(7)、式(8)获得文档表示;3.基于网络参数和文档表示,根据式(9)输出分类结果ˆ.YEnd2.8 损失函数LASA 使用二元交叉熵损失(binary cross entropy loss)[25]作为损失函数,它被广泛用于神经网络分类训练任务,损失函数定义如下:()()()11ˆˆloglog 1loglog 1N lloss ij ij ij ij i j L y yy y ===-+--∑∑ (9) 其中,N 为文档的数量,l 为标签的数量,ˆ[0,1],ij y∈y ij ∈{0,1}分别为第i 个实例的第j 个标签的预标签和真实标签. 使用基于标签语义的注意力机制来处理多标签文本分类的过程可以用算法1来表示.3 实 验本文在3个数据集(Kanshan-Cup,EUR-Lex,AAPD)上与算法XML-CNN 、SGM 、EXAM 、Attention-XML 使用评价指标P @k 、nDCG @k 对提出的算法进行评估对比.3.1 实验设置3.1.1 数据集本文使用如下3个多标签分类文本数据:Kanshan-Cup 、EUR-Lex 和AAPD.Kanshan-Cup(https:///competition/zhihu/data/):由中国最大的社区问答平台知乎发布.数据集包含300万个问题和1 999个主题.EUR-Lex(https:///drive/folders/1KQMBZgACUm-ZZcSrQpDPlB6CFKvf9Gfb):由一系列关于欧盟法律的文件组成,它包含许多不同类型的文档,包括条约、立法、判例法和立法提案.数据集一共包含 19 314个文档和3 956个标签.网上提供的数据集中训练集只包含11 585个文档,所以本文在EUR-Lex 上的实验结果是基于11 585个训练集训练得到的.AAPD(https:///file/d/18-JOCIj9v5bZCrn9CIsk23W4wyhroCp_/view?usp=sharing):从arXiv 上收集计算机科学领域的55 840篇论文摘要,对应54个标签.对于Kanshan-Cup 数据集中的每个问题,超过50个单词的问题,保留最后50个单词,长度不足50个单词的问题进行添0补充.对于其他两个数据集中的文档,超过500个词的文档保留最后500个单词,不足500个词的文档进行添0补充.表1给出了3个数据集的统计信息.Table 1 Datasets used in experiments表1 实验中使用的数据集DatasetTrain Test Features Labels Avg. label per point Avg. point per label Kanshan-Cup2 799 967 200 000 411 721 1 999 2.343 513.13 EUR-Lex11 585 3 865 171 120 3 956 5.32 15.59 AAPD54 840 1 000 69 399 54 2.41 2 444.043.1.2 评价指标我们选择精度(precision at k ,P @k )、归一化折损累计增益(normalized discounted cumulative gain at k ,简称nDCG @k )[26]作为性能比较的评价指标,y ∈{0,1}l 是文档中真实标签向量,ˆl y∈ 是同一文档的模型预测得分向 量,P @k 、nDCG @k 被广泛应用在多标签分类问题的评价中,定义如下: ()ˆ1@k k l l r y P k y k ∈=∑ (10)肖琳 等:基于标签语义注意力的多标签文本分类1085()()ˆ@loglog 1k l k l r y y DCG k l ∈=+∑ (11) 0min(,)1@@1log(1)k y l DCG knDCG k l ==+∑ (12)对于一个文档,ˆ()k r y是真实标签在预测标签前k 个的索引,||y ||0是在真实标签向量y 中相关标签的个数.我们计算每个文档的P @k 和nDCG @k ,然后对所有文档求平均值.3.1.3 对比算法为了充分验证提出算法的有效性,我们选择XML-CNN 、AttentionXML 、SGM 、EXAM 这4种先进的多标签文本分类算法作为对比算法.XML-CNN [13]:使用卷积神经网络设计了一个动态池处理文本分类问题,是使用卷积神经网络处理文本分类的代表性算法.AttentionXML [6]:基于自注意力机制设计实现,针对当前文档为每个标签学习特定的文档表示.SGM [5]:将多标签分类任务看作一个序列生成问题,输入文档内容,生成预测的标签序列.EXAM [18]:使用标签语义信息,通过设计一个交互层,获得每个类针对当前文本中每个单词的得分.3.1.4 参数设置对于Kanshan-Cup 数据集,我们使用官网上提供的单词和标签嵌入表示,其中嵌入维度k =256,对于W 1,W 2,设置b =256,对于其他两个数据集,使用Golve [27]预先训练文档中的单词和标签,嵌入维度k =300,对于W 1,W 2,设置b =300.整个模型使用Adam [28]进行训练,初始学习率为0.001.对比算法中的参数我们按照对应的原始论文进行设置.3.2 整体性能对比本文提出的LASA 和其他4种算法在3个数据集中评价指标得分情况见表2、表3,最优结果用粗体表示.Table 2 The results of evaluation metrics P @K on four algorithms表2 评价指标P @K 在4种算法上的结果数据集评价指标 XML-CNN (%)AttentionXML (%) SGM (%)EXAM (%) LASA (Ours) (%)Kanshan-Cup P@1 49.68 53.69 50.32 51.41 54.27 P@332.27 34.10 32.69 32.81 34.34 P@524.17 25.16 24.28 24.39 25.35 EUR-Lex P@170.40 67.34 70.45 74.40 77.52 P@354.98 52.52 60.39 61.93 63.72 P@544.86 42.72 44.87 50.98 52.32 AAPDP@174.37 83.02 75.6783.26 83.99 P@353.88 58.72 56.75 59.77 60.02 P@5 37.78 40.56 36.65 40.66 40.89 Table 3 The results of evaluation metrics nDC G@K on four algorithms表3 评价指标nDCG @K 在4种算法上的结果数据集评价指标 XML-CNN (%)AttentionXML (%)SGM (%) EXAM (%) LASA (Ours) (%)Kanshan-Cup nDCG@1 49.68 53.69 50.32 51.41 54.27 nDCG@346.65 51.03 46.90 49.32 51.36 nDCG@549.60 53.96 50.47 49.74 54.30 EUR-Lex nDCG@170.40 67.34 70.4574.40 77.52 nDCG@358.62 56.21 60.72 65.12 67.22 nDCG@553.10 50.78 55.24 59.43 61.24 AAPDnDCG@174.37 83.02 75.6783.26 83.99 nDCG@371.12 78.01 72.36 79.10 79.84 nDCG@5 75.93 82.31 76.21 82.79 83.78 从实验结果对比中可以看出,LASA 在P @k 和nDCG @k 上的结果都明显优于其他4种方法.在EUR-Lex 上,数据包含大量的尾标签,XML-CNN 和AttentionXML 方法取得的结果较差,其原因是,这两种方法主要集中1086 Journal of Software 软件学报 V ol.31, No.4, April 2020在文档内容上,这使得它们在没有足够训练集的尾标签上无法获得好的效果.相反地,探索标签语义信息和文档内容关联的EXAM 和LASA 取得较好的效果.在Kanshan-Cup 和AAPD 数据上,AttentionXML 为不同标签学习不同的文档表示但没有考虑到标签的相关性,SGM 学习一个文档表示来预测所有标签,没有考虑到不同标签关注的文档内容不同,EXAM 通过交互层获得单词与标签匹配得分,没有更深层次地学习针对每个标签的文档表示,所以它们的性能与LASA 相比较差.对比XML-CNN 方法,其既没有考虑不同单词的贡献度是不同的,也没有探索标签的相关性,所以在3个数据集上的整体性能低于其他算法.可见,在多标签学习中,基于标签语义的注意力机制能够学习每个标签对应的单词权重,从而有针对性地为每个标签学习特定的文档表示进一步提升分类性能. 为了进一步验证LASA 的显著性能,我们使用t -test 检验来进行显著性分析,表4列出了LASA 与4个基线在3个数据集上的p 值,从表4可以看出,在Kanshan-Cup 和Eurlex 两个数据集上,p 值均小于10–5,算法性能具有显著的差异.在AAPD 上,由于数据稠密的特性,所以与部分算法的差异较小.基于以上观察,我们可以得出LASA 始终优于先进的对比方法,并且在具有稀疏特性的数据集上显著提高了分类性能.Table 4 Statisticalsignificance (p -value) obtained by LASA vs. four baselines in terms of P @1 表4 LASA 与3种基线方法在P @1上的统计显著性分析(p 值)数据集vs. XML-CNN vs. AttentionXML vs. SGM vs. EXAM Kanshan-Cup 4.72E-09 3.24E-057.89E-07 1.59E-05 EUR-Lex 1.21E-08 2.83E-097.35E-09 4.60E-05 AAPD 8.86E-10 0.014 5.72E-08 0.0193.3 算法在不同频率标签下的性能对比为了进一步证明标签语义注意力机制对提升分类性能有着非常关键的影响,本文选取没有使用标签信息的XML-CNN 和AttentionXML 方法在EUR-Lex 数据集上与LASA 进行实验对比.首先,我们对EUR-Lex 数据集进行分析,图2展示了EUR-Lex 数据集的标签频率分布.从图2可以看出,出现频率在5次以下的标签占整体的55%左右,标签出现频率在37以内的占90%,剩下的10%为最频繁出现的标签.基于以上分析结果,可以得知EUR-Lex数据集中包含大量的尾标签.因此本文将EUR-Lex 数据集按照标签出现频率划分为3块,第1块数据的标签出现频率小于等于5,第2块数据的标签出现频率在5和37之间,第3块是标签出现频率超过37次的实例.为了验证不同标签频率下算法的分类性能,本文计算3种算法在每一块数据下的P @k 值.图3是XML-CNN 、 AttentionXML 和LASA 在不同标签频率上P @k 值的对比.Fig.2 Label frequency distribution diagram图2 标签频数分布图从图3可以看出,LASA 在3块数据上均能取得较好的效果:(1) 对于不频繁出现的标签(标签频率≤5),本文的算法在P @3、P @5上取得了巨大的提升,对比XML-CNN,LASA 在P @3、P @5上的精度提升分别是235.79%和257.14%;对比Attention-XML,LASA 在P @3、P @5上的精度提升分别为112.67%和245.30%,实验结果表明,本文提出的算法能够有效地缓解标签不均衡的问题,从而提升多标签分类中尾标签的预测精度.(2) 对于第2块。
第 54 卷第 8 期2023 年 8 月中南大学学报(自然科学版)Journal of Central South University (Science and Technology)V ol.54 No.8Aug. 2023基于知识图谱使用多特征语义融合的文档对匹配陈毅波1,张祖平2,黄鑫1,向行1,何智强1(1. 国网湖南省电力有限公司,湖南 长沙,410004;2. 中南大学 计算机学院,湖南 长沙,410083)摘要:为了区分文档间的同源性和异质性,首先,提出一种多特征语义融合模型(Multi-Feature Semantic Fusion Model ,MFSFM)来捕获文档关键字,它采用语义增强的多特征表示法来表示实体,并在多卷积混合残差CNN 模块中引入局部注意力机制以提高实体边界信息的敏感性;然后,通过对文档构建一个关键字共现图,并应用社区检测算法检测概念进而表示文档,从而匹配文档对;最后,建立两个多特征文档数据集,以验证所提出的基于MFSFM 的匹配方法的可行性,每一个数据集都包含约500份真实的科技项目可行性报告。
研究结果表明:本文所提出的模型在CNSR 和CNSI 数据集上的分类精度分别提高了13.67%和15.83%,同时可以实现快速收敛。
关键词:文档对匹配;多特征语义融合;知识图谱;概念图中图分类号:TP391 文献标志码:A 文章编号:1672-7207(2023)08-3122-10Matching document pairs using multi-feature semantic fusionbased on knowledge graphCHEN Yibo 1, ZHANG Zuping 2, HUANG Xin 1, XIANG Xing 1, HE Zhiqiang 1(1. State Grid Hunan Electric Power Company Limited, Changsha 410004, China;2. School of Computer Science and Engineering, Central South University, Changsha 410083, China)Abstract: To distinguish the homogeneity and heterogeneity among documents, a Multi-Feature Semantic Fusion Model(MFSFM) was firstly proposed to capture document keywords, which employed a semantically enhanced multi-feature representation to depict entities. A local attention mechanism in the multi-convolutional mixed residual CNN module was introduced to enhance sensitivity to entity boundary information. Secondly, a keyword co-occurrence graph for documents was constructed and a community detection algorithm was applied to represent收稿日期: 2022 −05 −15; 修回日期: 2022 −09 −09基金项目(Foundation item):湖南省电力物联网重点实验室项目(2019TP1016);电力知识图谱关键技术研究项目(5216A6200037);国家自然科学基金资助项目(72061147004);湖南省自然科学基金资助项目( 2021JJ30055) (Project (2019TP1016) supported by Hunan Key Laboratory for Internet of Things in Electricity; Project(5216A6200037) supported by key Technologies of Power Knowledge Graph; Project(72061147004) supported by the National Natural Science Foundation of China; Project(2021JJ30055) supported by the Natural Science Foundation of Hunan Province)通信作者:张祖平,博士,教授,从事大数据分析与处理研究;E-mail :***************.cnDOI: 10.11817/j.issn.1672-7207.2023.08.016引用格式: 陈毅波, 张祖平, 黄鑫, 等. 基于知识图谱使用多特征语义融合的文档对匹配[J]. 中南大学学报(自然科学版), 2023, 54(8): 3122−3131.Citation: CHEN Yibo, ZHANG Zuping, HUANG Xin, et al. Matching document pairs using multi-feature semantic fusion based on knowledge graph[J]. Journal of Central South University(Science and Technology), 2023, 54(8): 3122−3131.第 8 期陈毅波,等:基于知识图谱使用多特征语义融合的文档对匹配concepts, thus facilitating document was matching. Finally, two multi-feature document datasets were established to validate the feasibility of the proposed MFSFM-based matching approach, with each dataset comprising approximately 500 real feasibility reports of scientific and technological projects. The results indicate that the proposed model achieves an increase in classification accuracy of 13.67% and 15.83% on the CNSR and CNSI datasets, respectively, and demonstrates rapid convergence.Key words: document pairs matching; multi-feature semantic fusion; knowledge graph; concept graph识别文档对的关系是一项自然语言理解任务,也是文档查重和文档搜索工作必不可少的步骤。
第2期2021年2月Journal of CAEITVol. 16 No. 2 Feb. 2021doi : 10.3969/j. issn. 1673-5692.2021.02.009基于时序特性的视频目标检测研究周念h2(1.西安电子科技大学,陕西西安710071;2.中国电子科学研究院,北京100041)摘要:目标检测是计算机视觉领域的研究热点与难点,是图像理解与视频分析技术的基础,深度 学习具有良好的特征提取与泛化推理能力是当前主流研究方向。
文中介绍了目前典型的目标检测 模型,结合视频的时序特性提出了特征融合、结果反馈、双模型检测三种策略,利用前序帧信息修正 当前帧的检测结果,一定程度上解决了摄影失焦、运动模糊、遮挡、奇异角度等问题导致视频逐帧检 测结果不连续、质量低下的问题。
关键词:深度学习;视频检测;特征融合;结果反馈;双模型检测中图分类号:TP391 文献标志码:A 文章编号:1673-5692(2021 )02-157>08Research on Video Object Detection Based on Temporal CharacteristicsZHOU Nian1'2(1. Xidian University ,Xi’an 710071,China;2. China Academy of Electmnic and Infomlation Technology, Beijing 100041 , China)Abstract : Object detection is a research hotspot in the field of computer vision, and is the basis of image understanding and video analysis technology. Deep learning with favorable feature extraction and generalization reasoning ability is the cuirent popular research direction. This paper introduces the current typical object detection model, and then combined with the temporal characteristics of video, puts forward the strategies of feature fusion, result feedback and dual model detection. These strategies make the results of the current frame more accurate by using the information of previous frame and solve the problems of discontinuous and low quality using frame by frame detection resulted from defocus, motion blur, occlusion, queer angle, etc.Key words : deep learning ; video detection ; feature fusion ; result feedback ; double model detector〇引言随着我国智慧城市、监控安防建设的不断推进, 视频数据的爆炸性增长,视频智能分析技术:1:扮演 着越来越重要的角色。
1610IEEE TRANSACTIONS ON IMAGE PROCESSING, VOL. 19, NO. 6, JUNE 2010A Label Field Fusion Bayesian Model and Its Penalized Maximum Rand Estimator for Image SegmentationMax MignotteAbstract—This paper presents a novel segmentation approach based on a Markov random field (MRF) fusion model which aims at combining several segmentation results associated with simpler clustering models in order to achieve a more reliable and accurate segmentation result. The proposed fusion model is derived from the recently introduced probabilistic Rand measure for comparing one segmentation result to one or more manual segmentations of the same image. This non-parametric measure allows us to easily derive an appealing fusion model of label fields, easily expressed as a Gibbs distribution, or as a nonstationary MRF model defined on a complete graph. Concretely, this Gibbs energy model encodes the set of binary constraints, in terms of pairs of pixel labels, provided by each segmentation results to be fused. Combined with a prior distribution, this energy-based Gibbs model also allows for definition of an interesting penalized maximum probabilistic rand estimator with which the fusion of simple, quickly estimated, segmentation results appears as an interesting alternative to complex segmentation models existing in the literature. This fusion framework has been successfully applied on the Berkeley image database. The experiments reported in this paper demonstrate that the proposed method is efficient in terms of visual evaluation and quantitative performance measures and performs well compared to the best existing state-of-the-art segmentation methods recently proposed in the literature. Index Terms—Bayesian model, Berkeley image database, color textured image segmentation, energy-based model, label field fusion, Markovian (MRF) model, probabilistic Rand index.I. INTRODUCTIONIMAGE segmentation is a frequent preprocessing step which consists of achieving a compact region-based description of the image scene by decomposing it into spatially coherent regions with similar attributes. This low-level vision task is often the preliminary and also crucial step for many image understanding algorithms and computer vision applications. A number of methods have been proposed and studied in the last decades to solve the difficult problem of textured image segmentation. Among them, we can cite clustering algorithmsManuscript received February 20, 2009; revised February 06, 2010. First published March 11, 2010; current version published May 14, 2010. This work was supported by a NSERC individual research grant. The associate editor coordinating the review of this manuscript and approving it for publication was Prof. Peter C. Doerschuk. The author is with the Département d’Informatique et de Recherche Opérationnelle (DIRO), Université de Montréal, Faculté des Arts et des Sciences, Montréal H3C 3J7 QC, Canada (e-mail: mignotte@iro.umontreal.ca). Color versions of one or more of the figures in this paper are available online at . Digital Object Identifier 10.1109/TIP.2010.2044965[1], spatial-based segmentation methods which exploit the connectivity information between neighboring pixels and have led to Markov Random Field (MRF)-based statistical models [2], mean-shift-based techniques [3], [4], graph-based [5], [6], variational methods [7], [8], or by region-based split and merge procedures, sometimes directly expressed by a global energy function to be optimized [9]. Years of research in segmentation have demonstrated that significant improvements on the final segmentation results may be achieved either by using notably more sophisticated feature selection procedures, or more elaborate clustering techniques (sometimes involving a mixture of different or non-Gaussian distributions for the multidimensional texture features [10], [11]) or by taking into account prior distribution on the labels, region process, or the number of classes [9], [12], [13]. In all cases, these improvements lead to computationally expensive segmentation algorithms and, in the case of energy-based segmentation models, to costly optimization techniques. The segmentation approach, proposed in this paper, is conceptually different and explores another strategy initially introduced in [14]. Instead of considering an elaborate and better designed segmentation model of textured natural image, our technique explores the possible alternative of fusing (i.e., efficiently combining) several quickly estimated segmentation maps associated with simpler segmentation models for a final reliable and accurate segmentation result. These initial segmentations to be fused can be given either by different algorithms or by the same algorithm with different values of the internal parameters such as several -means clustering results with different values of , or by several -means results using different distance metrics, and applied on an input image possibly expressed in different color spaces or by other means. The fusion model, presented in this paper, is derived from the recently introduced probabilistic rand index (PRI) [15], [16] which measures the agreement of one segmentation result to multiple (manually generated) ground-truth segmentations. This measure efficiently takes into account the inherent variation existing across hand-labeled possible segmentations. We will show that this non-parametric measure allows us to derive an appealing fusion model of label fields, easily expressed as a Gibbs distribution, or as a nonstationary MRF model defined on a complete graph. Finally, this fusion model emerges as a classical optimization problem in which the Gibbs energy function related to this model has to be minimized. In other words, or analytically expressed in the regularization framework, each quickly estimated segmentation (to be fused) provides a set of constraints in terms of pairs of pixel labels (i.e., binary cliques) that should be equal or not. Finally, our fusion result is found1057-7149/$26.00 © 2010 IEEEMIGNOTTE: LABEL FIELD FUSION BAYESIAN MODEL AND ITS PENALIZED MAXIMUM RAND ESTIMATOR FOR IMAGE SEGMENTATION1611by searching for a segmentation map that minimizes an energy function encoding this precomputed set of binary constraints (thus optimizing the so-called PRI criterion). In our application, this final optimization task is performed by a robust multiresolution coarse-to-fine minimization strategy. This fusion of simple, quickly estimated segmentation results appears as an interesting alternative to complex, computationally demanding segmentation models existing in the literature. This new strategy of segmentation is validated in the Berkeley natural image database (also containing, for quantitative evaluations, ground truth segmentations obtained from human subjects). Conceptually, our fusion strategy is in the framework of the so-called decision fusion approaches recently proposed in clustering or imagery [17]–[21]. With these methods, a series of energy functions are first minimized before their outputs (i.e., their decisions) are merged. Following this strategy, Fred et al. [17] have explored the idea of evidence accumulation for combining the results of multiple clusterings. Reed et al. have proposed a Gibbs energy-based fusion model that differs from ours in the likelihood and prior energy design, as final merging procedure (for the fusion of large scale classified sonar image [21]). More precisely, Reed et al. employed a voting scheme-based likelihood regularized by an isotropic Markov random field priorly used to inpaint regions where the likelihood decision is not available. More generally, the concept of combining classifiers for the improvement of the performance of individual classifiers is known, in machine learning field, as a committee machine or mixture of experts [22], [23]. In this context, Dietterich [23] have provided an accessible and informal reasoning, from statistical, computational and representational viewpoints, of why ensembles can improve results. In this recent field of research, two major categories of committee machines are generally found in the literature. Our fusion decision approach is in the category of the committee machine model that utilizes an ensemble of classifiers with a static structure type. In this class of committee machines, the responses of several classifiers are combined by means of a mechanism that does not involve the input data (contrary to the dynamic structure type-based mixture of experts). In order to create an efficient ensemble of classifiers, three major categories of methods have been suggested whose goal is to promote diversity in order to increase efficiency of the final classification result. This can be done either by using different subsets of the input data, either by using a great diversity of the behavior between classifiers on the input data or finally by using the diversity of the behavior of the input data. Conceptually, our ensemble of classifiers is in this third category, since we intend to express the input data in different color spaces, thus encouraging diversity and different properties such as data decorrelation, decoupling effects, perceptually uniform metrics, compaction and invariance to various features, etc. In this framework, the combination itself can be performed according to several strategies or criteria (e.g., weighted majority vote, probability rules: sum, product, mean, median, classifier as combiner, etc.) but, none (to our knowledge) uses the PRI fusion (PRIF) criterion. Our segmentation strategy, based on the fusion of quickly estimated segmentation maps, is similar to the one proposed in [14] but the criterion which is now used in this new fusion model is different. In [14], the fusion strategy can be viewed as a two-stephierarchical segmentation procedure in which the first step remains identical and a set of initial input texton segmentation maps (in each color space) is estimated. Second, a final clustering, taking into account this mixture of textons (expressed in the set of different color space) is then used as a discriminant feature descriptor for a final -mean clustering whose output is the final fused segmentation map. Contrary to the fusion model presented in this paper, this second step (fusion of texton segmentation maps) is thus achieved in the intra-class inertia sense which is also the so-called squared-error criterion of the -mean algorithm. Let us add that a conceptually different label field fusion model has been also recently introduced in [24] with the goal of blending a spatial segmentation (region map) and a quickly estimated and to-be-refined application field (e.g., motion estimation/segmentation field, occlusion map, etc.). The goal of the fusion procedure explained in [24] is to locally fuse label fields involving labels of two different natures at different level of abstraction (i.e., pixel-wise and region-wise). More precisely, its goal is to iteratively modify the application field to make its regions fit the color regions of the spatial segmentation with the assumption that the color segmentation is more detailed than the regions of the application field. In this way, misclassified pixels in the application field (false positives and false negatives) are filtered out and blobby shapes are sharpened, resulting in a more accurate final application label field. The remainder of this paper is organized as follows. Section II describes the proposed Bayesian fusion model. Section III describes the optimization strategy used to minimize the Gibbs energy field related to this model and Section IV describes the segmentation model whose outputs will be fused by our model. Finally, Section V presents a set of experimental results and comparisons with existing segmentation techniques.II. PROPOSED FUSION MODEL A. Rand Index The Rand index [25] is a clustering quality metric that measures the agreement of the clustering result with a given ground truth. This non-parametric statistical measure was recently used in image segmentation [16] as a quantitative and perceptually interesting measure to compare automatic segmentation of an image to a ground truth segmentation (e.g., a manually hand-segmented image given by an expert) and/or to objectively evaluate the efficiency of several unsupervised segmentation methods. be the number of pixels assigned to the same region Let (i.e., matched pairs) in both the segmentation to be evaluated and the ground truth segmentation , and be the number of pairs of pixels assigned to different regions (i.e., misand . The Rand index is defined as matched pairs) in to the total number of pixel pairs, i.e., the ratio of for an image of size pixels. More formally [16], and designate the set of region labels respecif tively associated to the segmentation maps and at pixel location and where is an indicator function, the Rand index1612IEEE TRANSACTIONS ON IMAGE PROCESSING, VOL. 19, NO. 6, JUNE 2010is given by the following relation:given by the empirical proportion (3) where is the delta Kronecker function. In this way, the PRI measure is simply the mean of the Rand index computed between each [16]. As a consequence, the PRI pair measure will favor (i.e., give a high score to) a resulting acceptable segmentation map which is consistent with most of the segmentation results given by human experts. More precisely, the resulting segmentation could result in a compromise or a consensus, in terms of level of details and contour accuracy exhibited by each ground-truth segmentations. Fig. 8 gives a fusion map example, using a set of manually generated segmentations exhibiting a high variation, in terms of level of details. Let us add that this probabilistic metric is not degenerate; all the bad segmentations will give a low score without exception [16]. C. Generative Gibbs Distribution Model of Correct Segmentations (i.e., the pairwise empirical As indicated in [15], the set ) defines probabilities for each pixel pair computed over an appealing generative model of correct segmentation for the image, easily expressed as a Gibbs distribution. In this way, the Gibbs distribution, generative model of correct segmentation, which can also be considered as a likelihood of , in the PRI sense, may be expressed as(1) which simply computes the proportion (value ranging from 0 to 1) of pairs of pixels with compatible region label relationships between the two segmentations to be compared. A value of 1 indicates that the two segmentations are identical and a value of 0 indicates that the two segmentations do not agree on any pair of points (e.g., when all the pixels are gathered in a single region in one segmentation whereas the other segmentation assigns each pixel to an individual region). When the number of and are much smaller than the number of data labels in points , a computationally inexpensive estimator of the Rand index can be found in [16]. B. Probabilistic Rand Index (PRI) The PRI was recently introduced by Unnikrishnan [16] to take into accounttheinherentvariabilityofpossible interpretationsbetween human observers of an image, i.e., the multiple acceptable ground truth segmentations associated with each natural image. This variability between observers, recently highlighted by the Berkeley segmentation dataset [26] is due to the fact that each human chooses to segment an image at different levels of detail. This variability is also due image segmentation being an ill-posed problem, which exhibits multiple solutions for the different possible values of the number of classes not known a priori. Hence, in the absence of a unique ground-truth segmentation, the clustering quality measure has to quantify the agreement of an automatic segmentation (i.e., given by an algorithm) with the variation in a set of available manual segmentations representing, in fact, a very small sample of the set of all possible perceptually consistent interpretations of an image [15]. The authors [16] address this concern by soft nonuniform weighting of pixel pairs as a means of accounting for this variability in the ground truth set. More formally, let us consider a set of manually segmented (ground truth) images corresponding to an be the segmentation to be compared image of size . Let with the manually labeled set and designates the set of reat pixel gion labels associated with the segmentation maps location , the probabilistic RI is defined bywhere is the set of second order cliques or binary cliques of a Markov random field (MRF) model defined on a complete graph (each node or pixel is connected to all other pixels of is the temperature factor of the image) and this Boltzmann–Gibbs distribution which is twice less than the normalization factor of the Rand Index in (1) or (2) since there than pairs of pixels for which are twice more binary cliques . is the constant partition function. After simplification, this yields(2) where a good choice for the estimator of (the probability of the pixel and having the same label across ) is simply (4)MIGNOTTE: LABEL FIELD FUSION BAYESIAN MODEL AND ITS PENALIZED MAXIMUM RAND ESTIMATOR FOR IMAGE SEGMENTATION1613where is a constant partition function (with a factor which depends only on the data), namelywhere is the set of all possible (configurations for the) segof size pixels. Let us add mentations into regions that, since the number of classes (and thus the number of regions) of this final segmentation is not a priori known, there are possibly, between one and as much as regions that the number of pixels in this image (assigning each pixel to an individual can region is a possible configuration). In this setting, be viewed as the potential of spatially variant binary cliques (or pairwise interaction potentials) of an equivalent nonstationary MRF generative model of correct segmentations in the case is assumed to be a set of representative ground where truth segmentations. Besides, , the segmentation result (to be ), can be considered as a realization of this compared to generative model with PRand, a statistical measure proportional to its negative likelihood energy. In other words, an estimate of , in the maximum likelihood sense of this generative model, will give a resulting segmented map (i.e., a fusion result) with a to be fused. high fidelity to the set of segmentations D. Label Field Fusion Model for Image Segmentation Let us consider that we have at our disposal, a set of segmentations associated to an image of size to be fused (i.e., to efficiently combine) in order to obtain a final reliable and accurate segmentation result. The generative Gibbs distribution model of correct segmentations expressed in (4) gives us an interesting fusion model of segmentation maps, in the maximum PRI sense, or equivalently in the maximum likelihood (ML) sense for the underlying Gibbs model expressed in (4). In this framework, the set of is computed with the empirical proportion estimator [see (3)] on the data . Once has been estimated, the resulting ML fusion segmentation map is thus defined by maximizing the likelihood distributiontions for different possible values of the number of classes which is not a priori known. To render this problem well-posed with a unique solution, some constraints on the segmentation process are necessary, favoring over segmentation or, on the contrary, merging regions. From the probabilistic viewpoint, these regularization constraints can be expressed by a prior distribution of treated as a realization of the unknown segmentation a random field, for example, within a MRF framework [2], [27] or analytically, encoded via a local or global [13], [28] prior energy term added to the likelihood term. In this framework, we consider an energy function that sets a particular global constraint on the fusion process. This term restricts the number of regions (and indirectly, also penalizes small regions) in the resulting segmentation map. So we consider the energy function (6) where designates the number of regions (set of connected pixels belonging to the same class) in the segmented is the Heaviside (or unit step) function, and an image , internal parameter of our fusion model which physically represents the number of classes above which this prior constraint, limiting the number of regions, is taken into account. From the probabilistic viewpoint, this regularization constraint corresponds to a simple shifted (from ) exponential distribution decreasing with the number of regions displayed by the final segmentation. In this framework, a regularized solution corresponds to the maximum a posteriori (MAP) solution of our fusion model, i.e., that maximizes the posterior distribution the solution , and thus(7) with is the regularization parameter controlling the contribuexpressing fidelity to the set of segtion of the two terms; encoding our prior knowledge or mentations to be fused and beliefs concerning the types of acceptable final segmentations as estimates (segmentation with a number of limited regions). In this way, the resulting criteria used in this resulting fusion model can be viewed as a penalized maximum rand estimator. III. COARSE-TO-FINE OPTIMIZATION STRATEGY A. Multiresolution Minimization Strategy Our fusion procedure of several label fields emerges as an optimization problem of a complex non-convex cost function with several local extrema over the label parameter space. In order to find a particular configuration of , that efficiently minimizes this complex energy function, we can use a global optimization procedure such as a simulated annealing algorithm [27] whose advantages are twofold. First, it has the capability of avoiding local minima, and second, it does not require a good solution. initial guess in order to estimate the(5) where is the likelihood energy term of our generative fusion . model which has to be minimized in order to find Concretely, encodes the set of constraints, in terms of pairs of pixel labels (identical or not), provided by each of the segmentations to be fused. The minimization of finds the resulting segmentation which also optimizes the PRI criterion. E. Bayesian Fusion Model for Image Segmentation As previously described in Section II-B, the image segmentation problem is an ill-posed problem exhibiting multiple solu-1614IEEE TRANSACTIONS ON IMAGE PROCESSING, VOL. 19, NO. 6, JUNE 2010Fig. 1. Duplication and “coarse-to-fine” minimization strategy.An alternative approach to this stochastic and computationally expensive procedure is the iterative conditional modes (ICM) introduced by Besag [2]. This method is deterministic and simple, but has the disadvantage of requiring a proper initialization of the segmentation map close to the optimal solution. Otherwise it will converge towards a bad local minima . In order associated with our complex energy function to solve this problem, we could take, as initialization (first such as iteration), the segmentation map (8) i.e., in choosing for the first iteration of the ICM procedure amongst the segmentation to be fused, the one closest to the optimal solution of the Gibbs energy function of our fusion model [see (5)]. A more robust optimization method consists of a multiresolution approach combined with the classical ICM optimization procedure. In this strategy, rather than considering the minimization problem on the full and original configuration space, the original inverse problem is decomposed in a sequence of approximated optimization problems of reduced complexity. This drastically reduces computational effort and provides an accelerated convergence toward improved estimate. Experimentally, estimation results are nearly comparable to those obtained by stochastic optimization procedures as noticed, for example, in [10] and [29]. To this end, a multiresolution pyramid of segmentation maps is preliminarily derived, in order to for each at different resolution levels, and a set estimate a set of of similar spatial models is considered for each resolution level of the pyramidal data structure. At the upper level of the pyramidal structure (lower resolution level), the ICM optimization procedure is initialized with the segmentation map given by the procedure defined in (8). It may also be initialized by a random solution and, starting from this initial segmentation, it iterates until convergence. After convergence, the result obtained at this resolution level is interpolated (see Fig. 1) and then used as initialization for the next finer level and so on, until the full resolution level. B. Optimization of the Full Energy Function Experiments have shown that the full energy function of our model, (with the region based-global regularization constraint) is complex for some images. Consequently it is preferable toFig. 2. From top to bottom and left to right; A natural image from the Berkeley database (no. 134052) and the formation of its region process (algorithm PRIF ) at the (l = 3) upper level of the pyramidal structure at iteration [0–6], 8 (the last iteration) of the ICM optimization algorithm. Duplication and result of the ICM relaxation scheme at the finest level of the pyramid at iteration 0, 1, 18 (last iteration) and segmentation result (region level) after the merging of regions and the taking into account of the prior. Bottom: evolution of the Gibbs energy for the different steps of the multiresolution scheme.perform the minimization in two steps. In a first step, the minimization is performed without considering the global constraint (considering only ), with the previously mentioned multiresolution minimization strategy and the ICM optimization procedure until its convergence at full resolution level. At this finest resolution level, the minimization is then refined in a second step by identifying each region of the resulting segmentation map. This creates a region adjacency graph (a RAG is an undirected graph where the nodes represent connected regions of the image domain) and performs a region merging procedure by simply applying the ICM relaxation scheme on each region (i.e., by merging the couple of adjacent regions leading to a reduction of the cost function of the full model [see (7)] until convergence). In the second step, minimization can also be performed . according to the full modelMIGNOTTE: LABEL FIELD FUSION BAYESIAN MODEL AND ITS PENALIZED MAXIMUM RAND ESTIMATOR FOR IMAGE SEGMENTATION1615with its four nearest neighbors and a fixed number of connections (85 in our application), regularly spaced between all other pixels located within a square search window of fixed size 30 pixels centered around . Fig. 3 shows comparison of segmentation results with a fully connected graph computed on a search window two times larger. We decided to initialize the lower (or third upper) level of the pyramid with a sequence of 20 different random segmentations with classes. The full resolution level is then initialized with the duplication (see Fig. 1) of the best segmentation result (i.e., the one associated to the lowest Gibbs energy ) obtained after convergence of the ICM at this lower resolution level (see Fig. 2). We provide details of our optimization strategy in Algorithm 1. Algo I. Multiresolution minimization procedure (see also Fig. 2). Two-Step Multiresolution Minimization Set of segmentations to be fusedPairwise probabilities for each pixel pair computed over at resolution level 1. Initialization Step • Build multiresolution Pyramids from • Compute the pairwise probabilities from at resolution level 3 • Compute the pairwise probabilities from at full resolution PIXEL LEVEL Initialization: Random initialization of the upper level of the pyramidal structure with classes • ICM optimization on • Duplication (cf. Fig 1) to the full resolution • ICM optimization on REGION LEVEL for each region at the finest level do • ICM optimization onFig. 4. Segmentation (image no. 385028 from Berkeley database). From top to bottom and left to right; segmentation map respectively obtained by 1] our multiresolution optimization procedure: = 3402965 (algo), 2] SA : = 3206127, 3] rithm PRIF : = 3312794, 4] SA : = 3395572, 5] SA : = 3402162. SAFig. 3. Comparison of two segmentation results of our multiresolution fusion procedure (algorithm PRIF ) using respectively: left] a subsampled and fixed number of connections (85) regularly spaced and located within a square search window of size = 30 pixels. right] a fully connected graph computed on a search window two times larger (and requiring a computational load increased by 100).NUU 0 U 00 U 0 U 0D. Comparison With a Monoresolution Stochastic Relaxation In order to test the efficiency of our two-step multiresolution relaxation (MR) strategy, we have compared it to a standard monoresolution stochastic relaxation algorithm, i.e., a so-called simulated annealing (SA) algorithm based on the Gibbs sampler [27]. In order to restrict the number of iterations to be finite, we have implemented a geometric temperature cooling schedule , where is the [30] of the form starting temperature, is the final temperature, and is the maximal number of iterations. In this stochastic procedure, is crucial. The temperathe choice of the initial temperature ture must be sufficiently high in the first stages of simulatedC. Algorithm In order to decrease the computational load of our multiresolution fusion procedure, we only use two levels of resolution in our pyramidal structure (see Fig. 2): the full resolution and an image eight times smaller (i.e., at the third upper level of classical data pyramidal structure). We do not consider a complete graph: we consider that each node (or pixel) is connected。
第31卷第12期2012年12月实验室研究与探索RESEARCH AND EXPLORATION IN LABORATORYVol.31No.12Dec.2012基于视频七阶距特征的内容检索方法李炎1,杜秀华1,曹俊2(1.上海交通大学自动化系,系统控制与信息处理教育部重点实验室,上海200240;2.上海东方娱乐传媒集团广告经营中心,上海200041)摘要:为了能准确地在视频媒体中寻找到所需要的信息片段,提出了一种基于视频图像七阶矩特征的内容检索方法。
通过计算图像的七阶矩特征,并以此替代视频每帧图像的信息,对视频中每帧图像及其前一帧的七阶矩特征向量进行比对,计算两者距离,当两者欧氏距离超过某一给定阈值时记录下该帧在视频中的位置,且定义该帧为视频的一个关键帧,并以此为据建立视频文件的带时间标记的关键帧七阶矩向量序列。
继而通过对视频流和目标视频的七阶矩序列位置的比对和对应七阶矩距离的计算,确定在视频流中是否包含目标视频,以此实现在视频流中对于目标视频的检索。
使用实际视频为例对方法进行验证,效果良好,结果准确,方法还具有较快处理速度和较少的内存消耗,可用于实时处理领域。
关键词:视频处理;镜头检测;关键帧;七阶矩中图分类号:TP391.41文献标志码:A文章编号:1006-7167(2012)12-0039-04 Video Contents Retrieval Based on Seven-order MomentsLI Yan1,DU Xiu-hua1,CAO Jun2(1.Automation Department,Shanghai Jiaotong University,Key Laboratory of System Control andInformation Processing,Ministry of Education of China,Shanghai200240;2.Shanghai SMG Advertising Center,Shanghai200041,China)Abstract:To accurately find the needed information in the video,an approach based on the seven-order moments of video frame image was introduced in this paper.By computing the seven-order moments vector as the characteristic of an image,and replacing every frame of image with those moments vectors,every frame image of a video was compared with the previous frame,and the distance between the two was computed.The moments vector with the place was marked in the video when their distance exceeds a certain value,and such a frame was defined as a key frame of this video.Then a seven-order moments vector sequence with time marks that describes the key frames of the video was derived.By comparing the time marks and computing the distance between the corresponding moments vectors of the vector sequences of the video stream and the target video,it can be determined if the target video is in the video stream,and the target video can be detected successfully in the video stream.This approach proves to have good performance and accuracy after being tested with real examples.Meanwhile,it has very high processing speed and very little memory consumption.Key words:video processing;shot detecting;key frame;seven-order moments收稿日期:2012-03-21作者简介:李炎(1988-),男,浙江海宁人,硕士生,主要研究方向为控制科学与图像处理。
第 22卷第 8期2023年 8月Vol.22 No.8Aug.2023软件导刊Software Guide基于RA-UNet++的肝癌图像分割方法徐微1,2,汤俊伟1,2,张驰1,2(1.湖北省服装信息化工程技术研究中心; 2.武汉纺织大学计算机与人工智能学院,湖北武汉 430200)摘要:针对肝癌图像分割中上下文信息联系匮乏及肿瘤形态差异性导致模型特征提取困难、相似系数不高等问题,提出一种基于UNet++结合残差网络与注意力机制的肝癌图像分割方法(RA-UNet++)。
残差连接能为模型提供更多低层特征辅助模型精确定位肿瘤;通过注意力机制对特征图通道分配注意权重,使模型重点关注图像中的特殊区域,提取更具判别力的特征。
在LiTS-ISBI2017肝肿瘤数据集的实验表明,所提模型的体积重叠误差、体积差、相似系数分别达到3.01%、0.25%、98.65%,证实了方法的有效性,可为分割肝癌图像提供参考与借鉴。
关键词:UNet++;残差网络;注意力机制;图像分割DOI:10.11907/rjdk.221634开放科学(资源服务)标识码(OSID):中图分类号:TP391 文献标识码:A文章编号:1672-7800(2023)008-0203-06Image Segmentation Method of Liver Cancer Based on RA-UNet++ NetworkXU Wei1,2, TANG Junwei1,2, ZHANG Chi1,2(1.Engineering Research Center of Hubei Province for Clothing Information;2.School of Computer Science and Artificial Intelligence, Wuhan Textile University,Wuhan 430200, China)Abstract:A liver cancer image segmentation method based on UNet++combined with residual network and attention mechanism (RA-UN⁃et++) is proposed to address the issues of insufficient contextual information connections and tumor morphology differences in liver cancer im⁃age segmentation, resulting in difficulty in model feature extraction and low similarity coefficients. Residual connections can provide more low-level features for the model to assist in accurately locating tumors; By assigning attention weights to feature map channels through attention mechanisms, the model focuses on special areas in the image and extracts more discriminative features. The experiment on the LiTS-ISBI2017 liver tumor dataset showed that the proposed model achieved volume overlap error, volume difference, and similarity coefficient of 3.01%,0.25%, and 98.65%, respectively, confirming the effectiveness of the method and providing reference and reference for segmenting liver can⁃cer images.Key Words:UNet++; residual network; attention mechanism; image segmentation0 引言医学上,肝癌被认为是一种死亡率极高的严重疾病,如果在早期采取治疗措施,将极大程度提升患者的存活率。
基于H.264/A VC视频编码算法综述Abstract: H.264/AVC is the video coding standard jointly developed by ITU-T Video Coding Experts Group(VCEG) and ISO /IEC Moving Picture Experts Group(MPEG).This coding standard has high coding efficiency which is significantly increased in the low bit-rate compared with MPEG-4, and is available for the low-bandwidth,high-quality network video applications.In order to facilitate the realization of H.264 in the low bit rate and real-time application system the coding algorithm has to be optimized.After the analysis of H.264 encoder we can get that,motion estimation is one of the mainly technology for the video compression coding, and with the motion compensation technology they can eliminate time redundant of video signal to improve the coding efficiency.As a result,how to improve the efficiency of motion estimation to make the search process more robust,faster and more efficient becomes one of the hot spots of the current study.This paper first discusses the basic principles and key technologies of H.264 video coding standard;then introduces several existing classical Block-Matching Motion Estimation and analyses their strengths and weaknesses respectively;while,in depth analyses the H.264 recommended core algorithm of motion estimation UMHexagonS and Other fast optimization algorithm.Key words: H.264/A VC, motion estimation, motion vector, video compression摘要:H.264/AVC是由ITU-T视频编码专家组VCEG(Video Coding Experts Group)和ISO/IEC运动图象专家组MPEG(Moving Picture Experts Group)共同制定的视频编码标准,这一编码标准可获得很高的编码效率,尤其是在低码率方面比MPEG-4有明显提高,适合低宽带、高质量网络视频应用的需要。
专利名称:Real-time and label free analyzer for in-vitroand in-vivo detection of cancer发明人:Mohammad Abdolahad,Zohreh SadatMiripour,Sahar NajafiKhoshnoo申请号:US16857428申请日:20200424公开号:US10786188B1公开日:20200929专利内容由知识产权出版社提供专利附图:摘要:A method for in-vivo cancer diagnosis within a living tissue. The method includes preparing an electrochemical probe by fabricating three integrated electrodes viacoating a layer of vertically aligned multi-walled carbon nanotubes (VAMWCNTs) on tips of three electrically conductive biocompatible needles, putting the tips of the three integrated electrodes in contact with a portion of the living tissue by inserting the tips of the three integrated electrodes into the portion of the living tissue, recording an electrochemical response from the portion of the living tissue, where the electrochemical response may include a cyclic voltammetry (CV) diagram with an oxidation current peak corresponding to a hypoxic glycolysis chemical reaction in biological cells within the portion of the living tissue, and detecting a cancer-involving status of the portion of the living tissue based on the oxidation current peak.申请人:Mohammad Abdolahad,Zohreh Sadat Miripour,Sahar NajafiKhoshnoo地址:Tehran IR,Tehran IR,Tehran IR国籍:IR,IR,IR代理机构:Bajwa IP Law Firm代理人:Haris Zaheer Bajwa更多信息请下载全文后查看。
Correlative Multi-Label Video AnnotationGuo-Jun Qi∗Dept.of Automation Univ.of Sci.&T ech.of China Hefei,Anhui,230027China qgj@Xian-Sheng HuaMicrosoft Research Asia49Zhichun RoadBeijing,100080Chinaxshua@Y ong RuiMicrosoft China R&D Group49Zhichun RoadBeijing,100080Chinayongrui@Jinhui Tang∗Dept.of Elec.Eng.&Info.Sci. Univ.of Sci.&T ech.of China Hefei,Anhui,230027China jhtang@Tao MeiMicrosoft Research Asia49Zhichun RoadBeijing,100080Chinatmei@Hong-Jiang ZhangMicrosoft Adv.T ech.Center49Zhichun RoadBeijing,100080Chinahjzhang@ABSTRACTAutomatically annotating concepts for video is a key to semantic-level video browsing,search and navigation.The research on this topic evolved through two paradigms.The first paradigm used binary classification to detect each in-dividual concept in a concept set.It achieved only limited success,as it did not model the inherent correlation between concepts,e.g.,urban and building.The second paradigm added a second step on top of the individual-concept de-tectors to fuse multiple concepts.However,its performance varies because the errors incurred in thefirst detection step can propagate to the second fusion step and therefore de-grade the overall performance.To address the above issues, we propose a third paradigm which simultaneously classi-fies concepts and models correlations between them in a single step by using a novel Correlative Multi-Label(CML) framework.We compare the performance between our pro-posed approach and the state-of-the-art approaches in the first and second paradigms on the widely used TRECVID data set.We report superior performance from the proposed approach.Categories and Subject DescriptorsH.3.1[Information Storage and Retrieval]:Content Analysis and Indexing-indexing methods;I.2.10[Artificial Intelligence]:Vision and Scene Understanding—video analy-sisGeneral TermsAlgorithms,Theory,Experimentation∗This work was performed when G.-J.Qi and J.Tang were visiting Microsoft Research Asia as research interns. Permission to make digital or hard copies of all or part of this work for personal or classroom use is granted without fee provided that copies are not made or distributed for profit or commercial advantage and that copies bear this notice and the full citation on thefirst page.To copy otherwise,to republish,to post on servers or to redistribute to lists,requires prior specific permission and/or a fee.MM’07,September23–28,2007,Augsburg,Bavaria,Germany.Copyright2007ACM978-1-59593-701-8/07/0009...$5.00.KeywordsVideo Annotation,Multi-Labeling,Concept Correlation 1.INTRODUCTIONAutomatically annotating video at the semantic concept level has emerged as an important topic in the multimedia research community[11][16].The concepts of interest in-clude a wide range of categories such as scenes(e.g.,urban, sky,mountain,etc.),objects(e.g.,airplane,car,face,etc.), events(e.g.,explosion-fire,people-marching,etc.)and cer-tain named entities(e.g.person,place,etc.)[16][12].Before we discuss the details of this topic,we would like tofirst de-fine a few terminologies.The annotation problem of interest to this paper,as well as to other research efforts[16][12],is a multi-labeling process where a video clip can be annotated with multiple labels.For example,a video clip can be clas-sified as“urban”,“building”and“road”simultaneously.In contrast,multi-class annotation process labels only one con-cept to each video clip.Most of the real-world problems,e.g., the ones being addressed in TRECVID[17],are multi-label annotation,not multi-class annotation.In addition,multi-label is more complex and challenging than multi-class,as it involves non-exclusive detection and classification.This paper focuses on multi-label annotation.Research on multi-label video annotation evolved through two paradigms:individual concept detection and annota-tion,and Context Based Conceptual Fusion(CBCF)[8]an-notation.In this paper,we propose the third paradigm:in-tegrated multi-label annotation.We next review these three paradigms.1.1First Paradigm:Individual ConceptAnnotationIn this paradigm,multiple video concepts are detected individually and independently without considering correla-tions between them.That is,the multi-label video annota-tion is translated into a set of binary detectors with pres-ence/absence of the label for each concept.A typical ap-proach is to independently train a concept model using Sup-port Vector Machine(SVM)[4]or Maximum Entropy Model (MEM)[13]etc.The leftmostflowchart of Figure1illus-trates thefirst paradigm–a set of individual SVMs for video concept detection and annotations.A mathematical alter-native is to stack this set of detectors into a single discrimi-.Low-level Features Low-level FeaturesLow-level FeaturesFace -PersonPeople-MarchingRoadWalking_runningOutdoor Conceptual Fusion0/10/10/10/10/10/10/10/10/10/10/10/1Face -PersonPeople-MarchingRoadWalking_runningOutdoor 0/10/10/10/10/10/1Outdoor Walking _runningFacePersonRoadPeople-MarchingFigure 1:The multi-label video annotation methods in three paradigms.From leftmost to the rightmost,they are the individual SVM,CBCF and our proposed CML.native classifier [14].However,both the individual detectors and the stacked classifier at their core are independent bi-nary classification formulations.The first-paradigm approaches only achieved limited suc-cess.In real world,video concepts do not exist in isola-tion.Instead,they appear correlatively and naturally in-teract with each other at the semantic level.For example,the presence of “crowd”often occurs together with the pres-ence of “people”while “boat ship”and “truck”commonly do not co-occur.Furthermore,while simple concepts can be modeled directly from low level features,it is quite difficult to individually learn the models of complex concepts,e.g.,“people marching”,from the low-level features.Instead,the complex concepts can be better inferred based on the corre-lations with the other concepts.For instance,the presence of “people marching”can be boosted if both “crowd”and “walking running”occurs in a video clip.1.2Second Paradigm:Context BasedConceptual Fusion AnnotationOne of the most well-known approaches in this paradigm is to refine the detection results of the individual detectors with a Context Based Concept Fusion (CBCF)strategy.For in-stance,Naphade et al.[10]proposed a probabilistic Bayesian Multinet approach to explicitly model the relationship be-tween the multiple concepts through a factor graph which is built upon the underlying video ontology semantics.Wu et al.[20]used an ontology-based multi-classification learn-ing for video concept detection.Each concept is first in-dependently modeled by a classifier,and then a predefined ontology hierarchy is investigated to improve the detection accuracy of the individual classifiers.Smith et al.[15]pre-sented a two-step Discriminative Model Fusion (DMF)ap-proach to mine the unknown or indirect relationship to spe-cific concepts by constructing model vectors based on detec-tion scores of individual classifiers.A SVM is then trained to refine the detection results of the individual classifiers.The center flowchart of Figure 1shows such a second-paradigm approach.Alternative fusion strategy can also be used,e.g.Hauptmann et al.[6]proposed to use Logistic Regression (LR)to fuse the individual detections.Jiang et al.[8]used a CBCF-based active learning ers were involved in their approach to annotate a few concepts for extra video clips,and these manual annotations were then utilized to help infer and improve detections of other concepts.Although it is intuitively correct that contextual relation-ship can help improve detection accuracy of individual de-tectors,experiments of the above CBCF approaches have shown that such improvement is not always stable,and the overall performance can even be worse than individual de-tectors alone.For example,in [6]at least 3out of 8concepts do not gain better performance by using the conceptual fu-sion with a LR classifier atop the uni-concept detectors.The unstable performance gain is due to the following reasons:1.CBCF methods are built on top of the independent bi-nary detectors with a second step to fuse them.How-ever,the output of the individual independent detec-tors can be unreliable and therefore their detection er-rors can propagate to the second fusion step.As a result,the final annotations can be corrupted by these incorrect predictions.From a philosophical point of view,the CBCF approaches do not follow the princi-ple of Least-Commitment espoused by D.Marr [9],be-cause they are prematurely committed to irreversible individual predictions in the first step which can or cannot be corrected in the second fusion step.2.A secondary reason comes from the insufficient datafor the conceptual fusion.In CBCF methods,the sam-ples needs to be split into two parts for each step andthe samples for the conceptual fusion step is usuallyinsufficient compared to the samples used in thefirsttraining step.Unfortunately,the correlations betweenthe concepts are usually complex,and insufficient datacan lead to“overfitting”in the fusion step,thus theobtained prediction lacks the generalization ability. 1.3Third Paradigm:Integrated Multi-labelAnnotationTo address the difficulties faced in thefirst and second paradigms,in this paper,we will propose a third paradigm. The key of this paradigm is to simultaneously model both the individual concepts and their interactions in a single formulation.The rightmostflowchart of Figure1illustrates our proposed Correlative Multi-Label(CML)method.This approach has the following advantages compared with the second paradigm,e.g.,CBCF methods:1.The approach follows the Principle of Least-Commitment[9].Because the learning and optimization is done in asingle step for all the concepts simultaneously,it doesnot have the error propagation problem as in CBCF.2.The entire samples are efficiently used simultaneouslyin modeling the individual concepts as well as their cor-relations.The risk of overfitting due to the insufficientsamples used for modeling the conceptual correlationsis therefore significantly reduced.To summarize,thefirst paradigm does not address concept correlation.The second paradigm attempts to address it by introducing a separate second correlation step.The third paradigm,on the other hand,addresses the correlation issue at the root in a single step.The rest of the paper is orga-nized as follows.In Section2,we give a detailed description of the proposed Correlative Multi-Label(CML)approach, including the classification model,and the learning strat-egy.In Section3,we will explore the connection between the proposed approach and Gibbs Random Fields(GRFs) [19],based on which we can show an intuitive interpreta-tion on how the proposed approach captures the individual concepts as well as the conceptual correlations.Section4 details the implementation issues,including concept label vector prediction and concept scoring.Finally,in Section 5,we will report experiments on the benchmark TRECVID data and show that the proposed approach has superior per-formance over state-of-the-art algorithms in bothfirst and second paradigms.2.OUR APPROACH-CMLIn this section,we will introduce our proposed correlative multi-labeling(CML)model for video semantic annotation. In Section2.1,we will present the mathematical formula-tion of the multi-labeling classification function,and show that this function captures the correlations between the in-dividual concepts and low-level features,as well as the cor-relations between the different concepts.Then in Section 2.2,we will describe the learning procedure of the proposed CML model.2.1A Multi-Label Classification ModelLet x=(x1,x2,···,x D)T∈X denote the input pattern representing feature vectors extracted from video clips;Let y∈Y={+1,−1}K denote the K dimensional concept label vector of an example,where each entry y i∈{+1,−1}of y indicates the membership of this example in the ith concept. X and Y represent the input feature space and label space of the data set,respectively.The proposed algorithm aims at learning a linear discriminative functionF(x,y;w)= w,θ(x,y) (1) whereθ(x,y)is a vector function mapping from X×Y to a new feature vector which encodes the models of individual concepts as well as their correlations together(to be detailed later);w is the linear combination weight vector.With such a discriminative function,for an input pattern x,the label vector y∗can be predicted by maximizing over the argument y asy∗=maxy∈YF(x,y;w)(2)As to be presented in the next section,such a discrimina-tive function can be intuitively interpreted in the Gibbs ran-domfields(GRFs)[19]framework when considering the de-fined feature vectorθ(x,y).The constructed featureθ(x,y) is a high-dimensional feature vector,whose elements can be partitioned into two types as follows.And as to be shown later these two types of elements actually account for mod-eling of individual concepts and their interactions,respec-tively.Type I The elements for individual concept modeling:θl d,p(x,y)=x d·δ[[y p=l]],l∈{+1,−1},1≤d≤D,1≤p≤K(3)whereδ[[y p=l]]is an indicator function that takes on value1if the predict is true and0otherwise;D and K are the dimensions of low level feature vector space X and the number of the concepts respectively.These en-tries ofθ(x,y)serve to model the connection between the low level feature x and the labels y k(1≤k≤K) of the concepts.They have the similar functionality as in the traditional SVM which models the relations between the low-level features and high-level concepts.However,as we have discussed,it is not enough for a multi-labeling algorithm to only account for modeling the connections between the labels and low-level fea-tures without considering the semantic correlations of different concepts.Therefore,another element type of θ(x,y)is required to investigate the correlations be-tween the different concepts.Type II The elements for concept correlations:θm,np,q(x,y)=δ[[y p=m]]·δ[[y q=n]]m,n∈{+1,−1},1≤p<q≤K(4)where the superscripts m and n are the binary labels (positive and negative label),and subscripts p and q are the concept indices.These elements serve to cap-ture all the possible pairs of concepts and labels.Note that,both positive and negative relations are captured with these elements.For example,the concept“build-ing”and“urban”is a positive concept pair that often co-occurs while“explosionfire”and“waterscape water-front”is negative concept pair that usually does not occur at the same time.Note that we can model high-order correlations amongthese concepts as well,but it will require more trainingsamples.As to be shown in Section5,such an order-2model successfully trades offbetween the model com-plexity and concept correlation complexity,and achieves significant improvement in the concept detection per-formance.We concatenate the above two types of elements to form the feature vectorθ(x,y).It is not difficult to see that the dimension of vectorθ(x,y)is2KD+4C2K=2K(D+K−1). When K and D are large,the dimension ofθ(x,y)will be extraordinary high.For example,if K=39and D=200,θ(x,y)will have18,564dimensions.However,this vector is sparse thanks to the indicator functionδ[[·]]in Eqns.(3)and(4).This is a key step in the mathematical formulation.Asa result,the kernel function(i.e.the dot product)between the two vectors,θ(x,y)andθ(˜x,˜y),can be represented in a very compact form asθ(x,y),θ(˜x,˜y) = x,˜x 1≤k≤Kδ[[y k=˜y k]]+1≤p<q≤Kδ[[y p=˜y p]]δ[[y q=˜y q]](5)where x,˜x is the dot product over the low-level feature vector x and˜x.Of course,a Mercer kernel function K(x,˜x) (such as Gaussian Kernel,Polynomial Kernel)can be substi-tuted for x,˜x as in the conventional SVMs,and nonlinear discriminative functions can then be introduced with the use of these kernels.In the next subsection,we will present the learning procedure of this model.As to be described,the above compact kernel representation will be used explicitly in the learning procedure instead of the original feature vec-torθ(x,y).2.2Learning the ClassifierUsing the feature vector we constructed above and its kernel representation in(5),the learning procedure trains a classification model as delineated in(1).The procedure follows a similar derivation as in the conventional SVM(de-tails about SVM can be found in[4])and in particular one of its variants for the structural output spaces[18].Givenan example x i and its label vector yi from the training set{x i,y i}n i=1,according to Eqn.(1)and(2),a misclassification occurs when we haveΔF i(y)Δ=F(x i,yi )−F(x i,y)= w,Δθi(y) ≤0,∀y=yi ,y∈Y(6)whereΔθi(y)=θ(x i,yi )−θ(x i,y).Therefore,the empiricalprediction risk on training set wrt the parameter w can be expressed asˆR({xi,y i}n i=1;w)=1nni=1y=y i,y∈Y(x i,y;w)(7)where (x i,y;w)is a loss function counting the errors as(x i,y;w)={1if w,Δθi(y) ≤0,∀y=yi,y∈Y;0if w,Δθi(y) >0,∀y=yi,y∈Y.(8)Our goal is tofind a parameter w that minimizes the empir-ical errorˆR({x i,yi }n i=1;w).Considering the computationalefficiency,in practice,we use the following convex loss which upper bounds (x i,y;w)to avoid directly minimize the step-function loss:h(x i,y;w)=(1− w,Δθi(y) )+(9)where(·)+is a hinge loss in classification.Correspondingly, we can now define the following empirical hinge risk which upper boundsˆR({x i,yi}n i=1;w):ˆRh({x i,yi}n i=1;w)=1nni=1y=y i,y∈Yh(x i,y;w)(10)Accordingly,we can formulate a regularized version of ˆRh({x i,yi}n i=1;w)that minimizes an appropriate combina-tion of the empirical error and a regularization termΩ(||w||2) to avoid overfitting of the learned model.That isminwˆRh({x i,yi}n i=1;w)+λ·Ω||w||2(11) whereΩis a strictly monotonically increasing function,and λis a parameter trading offbetween the empirical risk and the regularizer.As indicated in[4],such a regularization term can give some smoothness to the obtained function so that the nearby mappedθ(x,y),θ(˜x,˜y)have the simi-lar function value F(θ(x,y);w),F(θ(˜x,˜y);w).Such a local smoothness assumption is intuitive and can relieve the neg-ative influence of the noise training data.In practice,the above optimization problem can be solved by reducing it to a convex quadratic problem.Similar to what is done in SVMs[4],by introducing a slack variable ξi(y)for each pair(x i,y),the optimization formulation in (11)can be rewritten asmin w12||w||2+λ·ni=1y=y i,y∈Yξi(y)s.t. w,Δθi(y) ≥1−ξi(y),ξi(y)≥0y=yi,y∈Y(12)On introducing Lagrange multipliersαi(y)into the above inequalities and formulating the Lagrangian dual according to Karush-Kuhn-Tucker(KKT)theorem[1],the above prob-lem further reduces to the following convex quadratic prob-lem(QP):maxαi,y=y iαi(y)−12i,y=y i j,˜y=y jαi(y)αj(˜y) Δθi(y),Δθj(˜y)s.t.0≤y=yi,y∈Yαi(y)≤λn,y=y i,y∈Y,1≤i≤n(13) and the equalityw=1≤i≤n,y∈Yαi(y)Δθi(y)(14) Different from those dual variables in the conventional SVMs which only depend on the training data of observation andthe associated label pairs(x i,yi),1≤i≤n,the Lagrangian duals in(13)depend on all assignment of labels y,whichare not limited to the true label of yi.We can iteratively find the active constraints and the associated label vari-able y∗which most violates the constraints in(9)as y∗= arg max y=yiF(x i,y;w)andΔF i(y∗)< 1.An active set is maintained for these corresponding active dual variables αi(y∗),and w is optimized over this set during each iteration using commonly available QP solvers(e.g.SMO[4]).3.CONNECTION WITH GIBBS RANDOMFIELDS FOR MULTI-LABELREPRESENTATIONIn this section we give an intuitive interpretation of our multi-labeling model through Gibbs Random Fields(GRFs). Detailed mathematical introduction about GRFs can be found in[19].We can rewrite Eqn.(1)asF(x,y;w)= w,θ(x,y)=p∈℘D p(y p;x)+(p,q)∈N V p,q(y p,y q;x)(15)OutdoorWalking_runningFacePersonRoady y 0/10/10/10/1People-Marching0/10/1Figure 2:Gibbs Random Fields for a correlative multi-label representation.The edges between con-cepts indicate the correlation factors P p,q (y p ,y q |x )be-tween concept pairs.andD p (y p ;x )=1≤d ≤D,l ∈{+1,−1}w l d,p θld,p (x ,y )V p,q (y p ,y q ;x )=m,n ∈{+1,−1}w m,n p,q θm,np,q (x ,y )(16)where ℘={i |1≤i ≤K }is a finite index set of the con-cepts with every p ∈℘representing a video concept,and N ={(p,q )|1≤p <q ≤K }is the set of interacting concept pairs.From the GRFs point of view,℘is the set of sites of a random field and N consists of adjacent sites of the concepts.For example,in Figure 2,the corresponding GRF has 6sites representing “outdoor”,“face”,“person”,“people marching”,“road”and “walking running”,and these sites are intercon-nected by the concept interactions,such as (outdoor,people marching),(face,person),(people marching,walking run-ning)etc,which are included in the neighborhood set N of GRF.In the CML framework,the corresponding N con-sists of all pairs of the concepts,i.e.,this GRF has a fully connected structure.Now we can define the energy function for GRF given an example x asH (y |x ,w )=−F (x ,y ;w )=−p ∈℘D p (y p ;x )+(p,q )∈NV p,q (y p ,y q ;x )(17)and thus we have the probability measure for a particularconcept label vector y given x in the formP (y |x,w )=1Z (x,w )exp {−H (y |x,w )}(18)where Z (x ,w )=y ∈Yexp {−H (y |x ,w )}is the partitionfunction.Such a probability function with an exponen-tial form can express a wide range of probabilities that are strictly positive over the set Y [19].It can be easily seen that when inferring the best label vector y ,maximizing P (y |x ,w )according to the Maximum A Posteriori Proba-bility (MAP)criterion is equal to minimizing the energy function H (y |x ,w )or equivalently maximizing F (x ,y ;w ),which accords with Eqn.(2).Therefore,our CML model is essentially equivalent to the above defined GRF.Based on this GRF representation for multi-labeling video concepts,the CML model now has a natural probability interpretation.Substitute Eqn.(17)into (18),we haveP (y |x ,w )=1Z (x ,w )p ∈℘P (y p |x )·(p,q )∈NP p,q (y p ,y q |x )(19)whereP (y p |x )=exp {D p (y p ;x )}P p,q (y p ,y q |x )=exp {V p,q (y p ,y q ;x )}Here P (y |x ,w )has been factored into two types of multi-pliers.The first type,i.e.,P (y p |x ),accounts for the proba-bility of a label y p for the concept p given x .These factors indeed model the relations between the concept label and the low-level feature x .Note that P (y p |x )only consists of the first type of our constructed features in Eqn.(3),and thus it confirms our claim that the first type of the elements in θ(x ,y )serves to capture the connections between x and the individual concept labels.The same discussion can be applied to the second type of the multipliers P p,q (y p ,y q |x ).These factors serve to model the correlations between the different concepts,and therefore our constructed features in Eqn.(4)account for the correlations of the concept labels.The above discussion justifies the proposed model and the corresponding constructed feature vector θ(x ,y )for the multi-labeling problem on video semantic annotation.In the next section,we will give further discussion based on this GRF representation.4.IMPLEMENTATION ISSUES In this section,we will discuss implementation considera-tions about CML.4.1Interacting conceptsIn Section 3,we have revealed the connection between theproposed algorithm and GRFs.As has been discussed,the neighborhood set N is a collection of the interacting concept pairs,and as for CML,this set contains all possible pairs.However,in practice,some concept pairs may have rather weak interactions,including both positive and negative ones.For example,the concept pairs (airplane,walking running),(people marching,corporate leader)indeed do not have too many correlations,that is to say,the presence/absence of one concept will not contribute to the presence/absence of an-other concept (i.e.,they occur nearly independently).Based on this observation,we can only involve the strongly inter-acted concept pairs into the set N ,and accordingly the ker-nel function (5)used in CML becomesθ(x ,y ),θ(˜x ,˜y) = x ,˜x 1≤k ≤K δ[[y k =˜y k ]]+(p,q )∈N δ[[y p =˜yp ]]δ[[y q =˜y q ]].(20)The selection of concept pairs can be manually determined by experts or automatically selected by data-driven approaches.In our algorithm,we adopt an automatic selection processAirplaneAirplane Animal Animal Bost_Ship Bost_Ship Building BuildingBus Bus Car Car Charts ChartsComputer_TV−screen Computer_TV−screenCorporate−Leader Corporate−LeaderCourt Court Crowd Crowd Desert DesertEntertainment Entertainment Explosion_Fire Explosion_FireFace Face Flag−US Flag−USGovernment−leader Government−leaderMaps Maps Meeting Meeting Military Military Mountain MountainNatural−Disaster Natural−DisasterOffice Office Outdoor OutdoorPeople−Marching People−MarchingPerson PersonPolice_Security Police_SecurityPrisoner Prisoner Road Road Sky Sky Snow Snow Sports Sports Studio Studio Truck Truck Urban Urban Vegetation VegetationWalking_Running Walking_Running Waterscape_Waterfront Waterscape_WaterfrontWeather Weathertween each pair of the 39concepts in the LSCOM-Lite annotations data set.These are computed based on the annotations of the development data set in the experiments (see Section 5).in which the expensive expert labors are not required.First,we use the normalized mutual information [21]to measure the correlations of each concept pair (p ,q )asNormMI (p,q )=MI (p,q )min {H (p ),H (q )}(21)where MI (p,q )is the mutual information of the concept p and q ,defined byMI (p,q )=y p ,y qP (y p ,y q )logP (y p ,y q )P (y p )P (y q )(22)and H (p )is the marginal entropy of concept p defined byH (p )=−y p ∈{+1,−1}P (y p )log P (y p )(23)Here the label prior probabilities P (y p )and P (y q )can be es-timated from the labeled ground-truth of the training dataset.According to the information theory [21],the larger the NormMI (p,q )is,the stronger the interaction between con-cept pair p and q is.Such a normalized measure of concept interrelation has the following advantages:•It is normalized into the interval [0,1]:0≤NormMI (p,q )≤1;•NormMI (p,q )=0when the concept p and q are sta-tistically independent;•NormMI (p,p )=1The above properties are accordant with our intuition about concept correlations,and can be easily proven based on the above definitions.From the above properties,we can findAirplaneAirplane Animal Animal Bost_Ship Bost_Ship Building BuildingBus Bus Car Car Charts ChartsComputer_TV-screen Computer_TV-screenCorporate-Leader Corporate-LeaderCourt Court Crowd Crowd Desert DesertEntertainment Entertainment Explosion_Fire Explosion_FireFace Face Flag-US Flag-USGovernment-leader Government-leaderMaps Maps Meeting Meeting Military Military Mountain MountainNatural-Disaster Natural-DisasterOffice Office Outdoor OutdoorPeople-Marching People-MarchingPerson PersonPolice_Security Police_SecurityPrisoner Prisoner Road Road Sky Sky Snow Snow Sports Sports Studio Studio Truck Truck Urban Urban Vegetation VegetationWalking_Running Walking_Running Waterscape_Waterfront Waterscape_WaterfrontWeather Weatherthe computed normalized mutual information.The white blocks indicate the selected concept pairs with significant correlations.that the normalized mutual information is scaled into the in-terval [0,1]by the minimum concept entropy.With such a scale,the normalized mutual information only considers the concept correlations,which is irrelevant to the distributions of positive and negative examples of the individual concepts.From the normalized mutual information,the concept pairs whose correlations are larger than a threshold are selected.Figure 3illustrates the normalized mutual information be-tween the 39concepts in LSCOM-Lite annotation data set.The brighter the grid is,the larger the corresponding nor-malized mutual information is,and hence the correlation of the concept pair.For example,(“boat ship”,“waterscape wa-terfront”),(“weather”,“maps”)etc.have larger normalized mutual information.The white dots in Figure 4represent the selected concept pairs.4.2Concept Label Vector PredictionOnce the classification function is obtained,the best pre-dicted concept vector y ∗can be obtained from Eqn.(2).The most direct approach is to enumerate all possible label vectors in Y to find the best one.However,the size of the set Y will become exponentially large with the increment of the concept number K ,and thus the enumeration of all pos-sible concept vectors is practically impossible.For example,when K =39,the size is 239≈5.5×10¹¹.Fortunately,from the revealed connection between CML and GRF in Section 4,the prediction of the best concept vector y ∗can be performed on the corresponding GRF form.Therefore,many popular approximate inference techniques on GRF can be adopted to predict y ∗,such as A nnealing Simulation ,G ibbs Sampling ,etc.Specifically,these approx-imation techniques will be based on the output optimal dual variables αi (y )in (14).Following the discussion in Section。