Diffusion tensor imaging in the cervical spinal cord[PMIDb20938788]
- 格式:pdf
- 大小:539.46 KB
- 文档页数:7
【基础理论】弥散张量成像(DiffusionTensorImage,DTI)展开全文弥散张量成像(Diffusion tensor image, DTI),是通过测量水分子的弥散过程来评价生物组织结构和生理状态,被公认为当前最有吸引力的无创性检查方法。
使用这种方法可获得检测脑白质组织的完整性的量化图,以及辨别脑纤维束三维宏观结构图(如,脑皮层下灰质核的投射区及皮层间的纤维连接)。
最近,有报道使用DTI 评价脑白质的解剖结构和病变进程,虽然这种方法在研究脑白质方面具有很大潜力,但要成为一种临床上常规使用方法仍有一些困难。
本部分将讲述如何计算有效弥散张量(D eff),并讨论数据采集、计算及图象产生的相关问题,同时也将展示一些经验,包括使用量化图和白质束图来评价脑白质和鼠大脑发育过程中的形态改变。
DTI测量中的基本概念矢量通常可以用箭头表示,如对于速度,箭头的方向描述运动的方向,而箭头的长度可以描述运动的速率(m/s)。
这种箭头在数学的描述就可以有3个独立的数字来代表:长度或两个角度,或是三维坐标 (x, y和z轴)。
流动的液体能够通过各个位置上速度矢量进行描述,每一点上的矢量在空间上分布将构成矢量场。
1各向异性和各向同性组织内水分子的随机位移通常受到介质组织结构和生理因素的影响,如果在介质组织中水分子的弥散在所有的方向都是相同的,经过一定时间的弥散后水分子的弥散轨迹将成一个球形,此种弥散过程称为各向同性;相反,如果各方向的弥散相互独立,则称为各向异性,这种情况下水分子经过一段时间的弥散会在空间分布上形成一个椭球(图1)。
扩散的特性能够通过三维椭球图来描述,这需要6个独立的数字来定义方向和椭球轴的长度。
水分子在脑白质中的弥散在三维空间上是各向异性的,主要是由于脑白质神经纤维束在宏观和微观上的结构特点,如髓鞘、轴突和纤维束等对水分子弥散的限制作用,使水分子的弥散过程在空间上表现为椭球形。
通过评估椭球的特点,即可获得有关脑白质的生理和结构(如解剖和组织病理学)信息。

高空间分辨视网膜成像技术研究屈军乐;Donald T Miller;牛憨笨;丁志华【期刊名称】《深圳大学学报(理工版)》【年(卷),期】2005(022)002【摘要】介绍一台基于37驱动单元Xinetics变形镜、17×17微透镜阵列Shack-Hartman波前像差传感器、Quantix12位高速帧传输科研级CCD相机以及超辐射二极管耦合多模光纤的自适应光学视网膜相机,得到了患者视网膜上不同位置清晰的单细胞图像和视网膜表面毛细血管图像,计算出不同区域锥状感光细胞的密度,测量了视网膜上毛细血管的血流速度,展示出这种基于自适应光学的高速高空间分辨视网膜成像技术在眼科临床上的广泛应用前景.【总页数】6页(P121-126)【作者】屈军乐;Donald T Miller;牛憨笨;丁志华【作者单位】深圳大学光电子学研究所,深圳,518060;Indiana University School of Optometry, Bloomington,IN 47405,USA;深圳大学光电子学研究所,深圳,518060;浙江大学信息科学与工程学院,杭州,310027【正文语种】中文【中图分类】Q434.19;R44.5【相关文献】1.液晶自适应光学视网膜校正成像技术研究 [J], 郑贤良;刘瑞雪;夏明亮;曹召良;宣丽2.广域视网膜成像技术研究 [J], 王业顺;沈建新3.脑干躯体感觉系统的扩散张量纤维束成像:3.0T各向同性高空间分辨力成像表现的初探 [J], T. de Baere; A. Denys; V. Paradis; 郑昊宇(译)4.主动脉弓上动脉成像:3.0T高空间分辨率MR血管成像对比剂用量减少的可行性研究 [J], 陈仁彪(译); 戴平丰(校); 章士正(校)5.美国光谱成像公司推出空间分辨率达2000像素革命性高光谱成像传感器 [J], 高国龙因版权原因,仅展示原文概要,查看原文内容请购买。
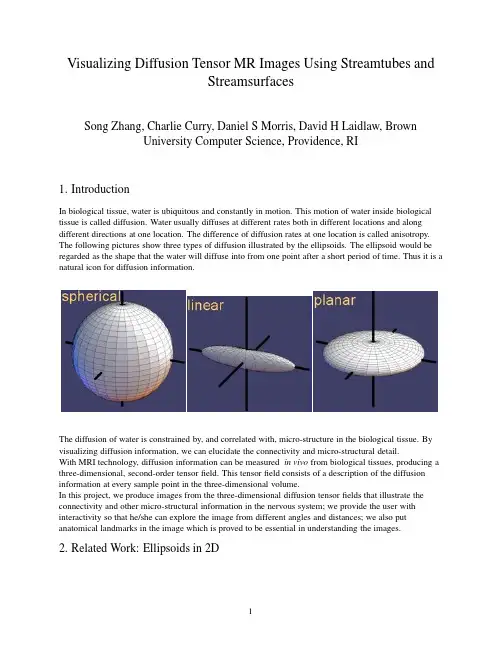
Visualizing Diffusion Tensor MR Images Using Streamtubes andStreamsurfacesSong Zhang,Charlie Curry,Daniel S Morris,David H Laidlaw,BrownUniversity Computer Science,Providence,RI1.IntroductionIn biological tissue,water is ubiquitous and constantly in motion.This motion of water inside biological tissue is called diffusion.Water usually diffuses at different rates both in different locations and along different directions at one location.The difference of diffusion rates at one location is called anisotropy. The following pictures show three types of diffusion illustrated by the ellipsoids.The ellipsoid would be regarded as the shape that the water will diffuse into from one point after a short period of time.Thus it is a natural icon for diffusion information.The diffusion of water is constrained by,and correlated with,micro-structure in the biological tissue.By visualizing diffusion information,we can elucidate the connectivity and micro-structural detail.With MRI technology,diffusion information can be measured in vivo from biological tissues,producing a three-dimensional,second-order tensorfield.This tensorfield consists of a description of the diffusion information at every sample point in the three-dimensional volume.In this project,we produce images from the three-dimensional diffusion tensorfields that illustrate the connectivity and other micro-structural information in the nervous system;we provide the user with interactivity so that he/she can explore the image from different angles and distances;we also put anatomical landmarks in the image which is proved to be essential in understanding the images.2.Related Work:Ellipsoids in2Da bPierpaoli et al use arrays of ellipsoids[Pierpaoli and Basser,1996]to represent a two-dimensional diffusion tensorfield(Figure a).A diffusion tensor matrix is symmetric and has positive eigenvalues.These special properties make an ellipsoid a natural geometric representation of the diffusion tensor.Each axis of the ellipsoid represents one eigenvector and its corresponding idlaw et al normalized the size of the ellipsoid to give a more continuous visual appearance[Laidlaw et al.,1998](Figure b).3.Related Work:Brushstrokes in2DLaidlaw et al[Laidlaw et al.,1998]borrow concepts from oil painting.Two-dimensional brush strokes are used to represent different aspects of the diffusion tensors.The information is also classified and visualized in different layers such as the underpainting,checkerboard layer,and stroke layer.4.Geometric representation in3DThere are two limitations of ellipsoids methods when applied to a three-dimensional dataset.First, visualizing every sample point in the three-dimensional dataset,only the outermost layer of the dataset can be displayed on the screen.The internal data points will be blocked.Second,continuity inherent in biological tissues will not be properly represented in thefinal image.For example,the neuralfibers in the brain that connect different anatomical regions would be difficult to locate within an array of ellipsoids.Similar problems arise when we try to apply the brushstrokes method to visualize a three-dimensional diffusion tensorfield.5.Related Work:3D V olume RenderingKindlmann et al[Kindlmann and Weinstein,1999]take a volume rendering approach to the problem.The philosophy behind this method is to display only some of the information,but display that information densely within a volume.The“hue-ball”and a“barycentric map”assign color and opacity to each location in the dataset based on the properties of the diffusion tensor information.Although low opacity is assigned to unimportant data to avoid visual cluttering,in many cases there are a number of important data points along the direction of one ray.The compression of all these points into a single pixel makes it difficult for a viewer to extract precise positional information from thefinal image.This makes it difficult to pick out the path of a certainfibrous structure from its neighborhood.Also,a lack of interactivity limits a user’s understanding of the image.6.Our method—Streamtubes and streamsurfacesOur solution is to distinguish between linear and planar anisotropy regions,and employ streamtubes and streamsurfaces to visualize these two types of regions,respectively.Streamtubes StreamsurfacesThe streamtubes represent linear anisotropy region.The trajectory sweeps along the major vector field,and the cross-section shape is an ellipse representing the other two eigenvectors.We normalize the length of the medium eigenvector to a constant value so that the size of the streamtube is predictable,while the ratio between medium and minor eigenvalues remains intact.The color of the streamtube is related to the linear anisotropy value.The streamsurfaces represent planar anisotropy region.It is an approximation of the integral surface in both the major eigenvector field and the medium eigenvector field.Colors are mapped to the surfaces to represent the planar anisotropy value.8.Anatomical LandmarksVentricle Inside Skull SurfaceBased on the feedback from preliminary results,we found that biologists tended to explore the image more efficiently if they can easily identify some obvious large structures that they are familiar with in the image. For example,if they are looking at an image of the human brain,knowing the position of the skull,eyes, and ventricles makes it easier tofind structures in the rich information provided by our diffusion tensor visualization method.For this reason,we provided anatomical landmarks in our image.These landmarks are created by generating isosurfaces from T2-weighted images using A VS[Upson et al.,1989].7.Geometry selectionInitially,we generate streamtubes and streamsurfaces so that every voxel that has linear anisotropy or planar anisotropy will be run through by a streamtube or a streamsurface.That will give us a dense set of geometries.Visualizing them all is not only expensive,but also undesirable,as the inclusion of too many streamtubes in the scene will generate visual cluttering.So we have to decide which ones should be selected and visualized.For streamtubes,we use three criteria to measure their importance:Length—Streamtubes shorter than a given threshold are removed.Short streamtubes could be the result of either noise or reflection of short linear structures.For our purpose,short structures are less significant than long ones.Average linear anisotropy—By averaging the linear anisotropies at each point on a streamtube,we can get an idea of whether the streamtube passes through a region of high anisotropy.If so,it isassumed to represent a preferred direction of diffusion,and it is kept for visualization.Similarity to previously selected streamtubes—We drop the streamtubes that are too“close”toselected ones,thus removing the“duplicates”.We define the distance between two curves to be:D=ifThese two pictures show us the original set of streamtube-trajectories,and a selected set ofstreamtube-trajectories.Similarly,for streamsurface,we use the size of the streamsurface,average planar anisotropy,and similarity to previously selected streamsurfaces as three criteria to measure their importance.9.ResultsThis annotated image shows the human brain from the eye to the top of the head.Through thesemi-transparent skull surface,we can see the ventricle(colored blue)in the middle,and the streamtubes and the streamsurfaces in the space.The parameters used to generate this image are listed in table below:Streamtube lengthAverage linear anisotropyused in for streamtubes Distance between lines Surface sizeAverage planar anisotropyused in for streamsurfaces Distance between surfaces11.Effects of parameters on thefinal imagesfrom toDistance between streamsurfaces reduced fromtoLessonsThe geometric models we create show connectivity in the brainAnatomical landmarks are essential for understanding these images Choosing which parts of the data to represent is a difficult problem12.AcknowledgmentThanks to Dr.Susumu at Johns Hopkins University who kindly sent us the human brain dataset and Eric Ahrens for the mouse embryo dataset.Thanks to Eric Ahrens,Russell Jacobs,Seth Ruffins,Rusty Lansford,and David Berson for providing feedback and evaluation on our results.Also thanks to our sponsor,the Human Brain Project.References[Cormans et al.,1994]Cormans,J.,Luypaert,R.,Verhelle,F.,Stadnik,T.,and Osteaux,M.(1994).A method for myelinfiber orientation mapping using diffusion-weighted mr-images.MAGNETICRESONANCE IMAGING,pages443–454.[Delmarcelle and Hesselink,1992]Delmarcelle,T.and Hesselink,L.(1992).Visualization of second order tensorfields and matrix data.IEEE Visualization92Proceedings,pages316–323.[Kindlmann and Weinstein,1999]Kindlmann,G.and Weinstein,D.(1999).Hue-balls and lit-tensors for direct volume rendering of diffusion tensorfields.IEEE Visualization99Proceedings.[Laidlaw et al.,1998]Laidlaw,D.H.,Ahrens,E.T.,Kremers,D.,Avalos,M.J.,Jacobs,R.E.,and Readhead,C.(1998).isualizing diffusion tensor images of the mouse spinal cord.IEEE Visualization 98Proceedings,pages127–134.[Pierpaoli and Basser,1996]Pierpaoli,C.and Basser,P.(1996).Toward a quantitative assessment of diffusion anisotropy.Magnetic Resonance Magazine,pages893–906.[Upson et al.,1989]Upson,C.,Faulhaber,T.,Jr.,D.K.,Laidlaw,D.,Schlegel,D.,Vroom,J.,Gurwitz,R., and van Dam,A.(1989).The application visualization system:A computational environment for scientific visualization.IEEE Computer Graphics and Applications,9:30–42.[Westin et al.,1997]Westin,C.F.,S.Peled,H.G.,Kikinis,R.,and Jolesz,F.(1997).Geometrical diffusion measures for mri from tensor basis analysis.Proceedings of ISMRM.[Xue et al.,1999]Xue,R.,van Zijl,P.C.,Crain,B.J.,Solaiyappan,M.,and Mori,S.(1999).In vivo three-dimensional reconstruction of rat brain axonal projections by diffusion tensor imaging.Magnetic Resonance in Medicine,42.[Zoeckeler et al.,1996]Zoeckeler,M.,Stalling,D.,and Hege,H.-C.(1996).Interactive visualization of 3d-vectorfields using illuminated streamlines.IEEE Visualization96Proceedings,pages107–113.。

一种自适应立体脑图像分割方法
史勇红;戚飞虎
【期刊名称】《中国医疗器械杂志》
【年(卷),期】2006(30)2
【摘要】提出一种自动分割单通道磁共振脑图像的新方法,这种方法建立在耦合的马尔科夫模型的基础上.耦合马尔科夫模型使用了两个空间上交织的马尔可夫随机场先验模型,其一对亮度测度建模以实现分段光滑性约束,另一个对非连续性建模以控制相邻体素间的交互作用.依据这一模型,该方法使用贝叶斯理论和领域约束获得了区域和边界的最大后验概率估计.这种方法具有如下属性:①大脑图像被准确地分割成白质、灰质和脑脊髓;②对噪声和亮度不一致性具有较强的鲁棒性.
【总页数】3页(P88-89,87)
【作者】史勇红;戚飞虎
【作者单位】上海交通大学计算机科学和工程系,上海,200030;上海交通大学计算机科学和工程系,上海,200030
【正文语种】中文
【中图分类】TP391.4
【相关文献】
1.一种边界和马尔可夫随机场相结合的脑MRI医学图像分割方法 [J], 林江;戴齐;欧阳婷雪;鞠斌;邹翎
2.一种基于图像分割及邻域限制与放松的立体匹配方法 [J], 伍春洪;付国亮
3.一种基于自适应超像素的改进谱聚类图像分割方法 [J], 覃正优;林一帆;陈瑜萍;林富强
4.一种改进的分水岭人脑MR图像分割方法 [J], 李荣艳;熊文生;曹佃国
5.基于弱膜模型的自适应立体脑图像分割方法 [J], 史勇红;戚飞虎
因版权原因,仅展示原文概要,查看原文内容请购买。


2021年第40卷第4期传感器与微系统(Transducer and Microsystem Technologies)63DOI:10.13873/J.1000-9787(2021)04-0063-03运动模糊图像的恢复技术研究**收稿日期:2019-09-27*基金项目:国家自然科学基金资助项目(61762067)陈英,洪晨丰(南昌航空大学软件学院,江西南昌330063)摘要:针对运动模糊图像的恢复,提出了基于生成式对抗神经网络(GAN)网络与FSRCNN网络的方案。
采用GoPr。
模糊图像数据集与DIV2K图像恢复数据集进行网络训练;通过图像处理对模糊图像进行规格化、归一化、色彩空间转换等预处理操作;利用GAN对模糊图像进行图像恢复,并结合FSRCNN针对模糊图像进行图像增强;针对GAN与FSRCNN的处理结果进行分析与对比,经由FSRCNN网络图像增强的恢复图像的峰值信噪比虽然有一定的下降,但结构相似度则得到了提升。
实验结果表明本文的算法方案具有较好的可行性。
关键词:生成式对抗神经网络;卷积神经网络;运动模糊;图像处理中图分类号:TP391.41文献标识码:A 文章编号:1000-9787(2021)04-0063-03Research on restoration technology of motion blur imageCHEN Ying,HONG Chenfeng(School of Software,Nanchang Hangkong University,Nanchang330063,China)Abstract:An image restoration scheme based on generative adversarial networks(GAN)network and FSRCNN network for motion blurred images is proposed.GoPro fuzzy image dataset and lhe DIV2K image restoration dataset are used for network training・Image processing operation is used to normalize the fuzzy image,convert color space・GAN is used to restore lhe image of lhe blurred image,and the FSRCNN is combined to enhance the image for the blurred image・Processing results of GAN and FSRCNN are analyzed and compared.The peak signal-noise ratio of the reconstructed image enhanced by the FSRCNN network image has a certain decline・However,the structural similarity is improved・Experimental results show that the proposed algorithm has good feasibility.Keywords:generative adversarial networks(GAN);convolutional neural network(CNN);motion blur;image processing0引言计算机领域在近年来的急速进步与图像存储在日常生活中逐渐普及,焦距、相机抖动和目标物体的运动等因素都是图像模糊的原因,同样因为这些因素,导致了图像信息发生小不服或与空间的大面积退化,从而使图像信息存储与使用发生错误E。

基于深度学习的人工智能在乳腺磁共振图像分析中的研究近年来,随着人工智能技术的飞速发展,深度学习作为其中的重要分支,已经在各个领域展现出了巨大的潜力。
在医疗领域中,乳腺磁共振图像分析是一项重要的任务,而基于深度学习的人工智能正逐渐成为这一领域的研究热点。
乳腺磁共振图像是一种非侵入性的检查方法,能够提供关于乳腺组织的详细信息。
然而,由于图像中存在大量的噪声和复杂的结构,传统的图像分析方法往往无法准确地提取出有用的信息。
而深度学习作为一种自动学习的方法,可以通过大量的训练数据,从中学习到图像的特征表示,进而实现对图像的分析和识别。
在乳腺磁共振图像分析中,深度学习可以应用于多个方面。
首先,它可以用于乳腺肿瘤的检测和诊断。
传统的方法通常需要人工提取特征,并且对图像进行复杂的预处理,而深度学习可以直接从原始图像中学习到特征表示,大大简化了分析过程。
研究人员可以通过构建深度卷积神经网络,将乳腺磁共振图像输入网络进行训练,网络可以学习到肿瘤的形态和纹理等特征,从而实现对肿瘤的准确识别。
其次,深度学习还可以用于乳腺磁共振图像的分割。
乳腺磁共振图像中包含多种组织结构,如乳腺腺体、脂肪组织和肿瘤等,而图像分割的目标就是将不同的组织结构从图像中分离出来。
传统的分割方法通常需要依赖人工标注的训练数据和手工设计的特征,而深度学习可以通过端到端的训练,直接从图像中学习到分割的准确结果。
研究人员可以通过构建全卷积神经网络,将乳腺磁共振图像输入网络进行训练,网络可以学习到图像中不同组织结构的空间分布和形态特征,从而实现对图像的自动分割。
此外,深度学习还可以应用于乳腺磁共振图像的分类和预测。
乳腺磁共振图像通常包含多个序列,如T1加权、T2加权和动态增强序列等,每个序列都提供了不同的信息。
研究人员可以通过构建多模态的深度神经网络,将不同序列的图像输入网络进行训练,网络可以学习到不同序列之间的关联性和互补性,从而实现对乳腺疾病的分类和预测。

医学图像了解医学图像医学图像是反映解剖区域内部结构或内部功能的图像,它是由⼀组图像元素——像素(2D)或⽴体像素(3D)组成的。
医学图像是由采样或重建产⽣的离散性图像表征,它能将数值映射到不同的空间位置上。
像素的数量是⽤来描述某⼀成像设备下的医学成像的,同时也是描述解剖及其功能细节的⼀种表达⽅式。
像素所表达的具体数值是由成像设备、成像协议、影像重建以及后期加⼯所决定的医学图像有四个关键成分——像素深度、光度表⽰、元数据和像素数据。
这些成分与图像⼤⼩和图像分辨率有关图像深度(⼜称⽐特深度或颜⾊深度)是⽤来编码每个像素信息的⽐特数。
⽐如说,⼀个8⽐特的光栅可以有256个从0到255数值不等的图图像深度像深度光度表⽰解释了像素数据如何以正确的图像格式(单⾊或彩⾊图⽚)显⽰。
为了说明像素数值中是否存在⾊彩信息,我们将引⼊“每像素采光度表⽰样数”的概念。
单⾊图像只有⼀个“每像素采样”,⽽且图像中没有⾊彩信息。
图像是依靠由⿊到⽩的灰阶来显⽰的,灰阶的数⽬很明显取决于⽤来储存样本的⽐特数。
在这⾥,灰阶数与像素深度是⼀致的。
医疗放射图像,⽐如CT图像和磁共振(MR)图像,是⼀个灰阶的“光度表⽰”。
⽽核医学图像,⽐如正电⼦发射断层图像(PET)和单光⼦发射断层图像(SPECT),通常都是以彩⾊映射或调⾊板来显⽰的元数据是⽤于描述图像的信息。
它可能看起来会⽐较奇怪,但是在任何⼀个⽂件格式中,除了像素数据之外,图像还有⼀些其他的相关信元数据息。
这样的图像信息被称为“元数据”,它通常以“数据头”的格式被储存在⽂件的开头,涵盖了图像矩阵维度、空间分辨率、像素深度和光度表⽰等信息像素数据是储存像素数值的位置。
根据数据类型的不同,像素数据使⽤数值显⽰所需的最⼩字节数,以整点或浮点数的格式储存像素数据图像⼤⼩ = 数据头⼤⼩(包括元数据) + ⾏数栏数像素深度(图像帧数)医学图像格式放射图像有6种主要的格式,分别为DICOM(医学数字成像和通讯)、NIFTI(神经影像信息技术)、PAR/REC(Philips磁共振扫描格式)、ANALYZE(Mayo医学成像)、NRRD(近原始栅格数据)和MNIC现代神经影像学技术脑电图(EEG),单光⼦发射体层成像(SPECT),正电⼦发射型计算机断层显像(PET),功能性磁共振成像(fMRI),侵⼊性光学成像(Invasive Optical Imaging),颅内电极记录(Intracranial Recording),脑⽪层电图(ECoG)。

·15CHINESE JOURNAL OF CT AND MRI,AUG.2019, Vol.17, No.8 Total No.118ZHANG Mi, YANG Yan, ZHENG Wei-hua. Department of Neurology, Wuhan Central Hospital Affiliated to Tongji Medical College, Huazhong University of Science and Technology, Wuhan 430000, Hubei Province, China[Abstract] Objective To investigate the application value of diffusion tensor imaging (DTI) combined with diffusion-weighted imaging (DWI) in the diagnosis of acute cerebral infarction (ACI) ischemic penumbra (IP). Methods Seventy patients with ACI who underwent magnetic resonance DWI and DTI scans were divided into hyperacute (6h) group and acute (6-24h) group according to the onset time. The apparent diffusion coefficient (ADC) values, anisotropic indexes (FA) and average diffusion coefficients (DCavg) of core infarction area and IP area, the rADC value, rFA value and rDCavg value of the contralateral side were statistically analyzed. Results ADC values, FA values and DCavg values of the core infarction area in patients with ACI were significantly lower than those in the contralateral area (P<0.05). The ADC values, FA values and DCavg values of the IP area were significantly higher than those in the core infarction area (P<0.05). The ADC value, FA value and DCavg value of the cerebral infarction IP area were lower than those of the contralateral side. The rADC value, rFA value and rDCavg value in acute stage were significantly lower than those in hyperacute stage (P<0.05). The rADC value was positively correlated with the rFA value and rDCavg value (r=0.589, 0.685, P<0.05), and the rFA value was positively correlated with the rDCavg value (r=0.612, P<0.05). Conclusion The ADC value obtained by MR-DWI and the FA value and DCavg value obtained by DTI may be an important means to determine IP.[Key words] Cerebral Infarction; Ischemic Penumbra; Diffusion Tensor Imaging; Diffusion-Weighted Imaging 急性脑梗死(acute cerebral infarction,ACI)是威胁人类健康的常见脑血管病,发病率、致残率、死亡率均较高,是我国国民常见死因,亦是导致中老年人永久性残疾的重要原因[1]。
断. 磁共振成像, 2017, 8(9): 711-715.[8] Wang FF, Bao HH, Li CW, et al. Diffusion tensor imaging in highaltitude adults and sea level normal adults: an analysis using tract-based spatial statistics. J Clin Radiol, 2016, 35(9): 1341-1346.王芳芳, 鲍海华, 李超伟, 等. 高原和平原地区健康成人脑白质扩散张量成像TBSS分析. 临床放射学杂志, 2016, 35(9): 1341-1346.[9] Brink HL, Dickerson JA, Stephens JA, et al. Comparison of the safetyof adenosine and regadenoson in patients undergoing outpatient cardiac stress testing. Pharmacotherapy, 2015, 35(12): 1117-1123.[10] Pan AX, Liu C, Hai Y, et al. A comparative study of cardio-pulmonaryfunction and blood gas analysis between early onset scoliosis from high attitude and flat areas .Chin J Bone Joints, 2018, 7(7): 552-556.潘爱星, 刘畅, 海涌, 等. 高海拔地区与平原地区早发性脊柱侧凸患者心肺功能和血气分析的对比研究. 中国骨与关节杂志, 2018, 7(7): 552-556.[11] Lyen S, Mathias H, McAlindon E, et al. Optimising the imaging planefor right ventricular magnetic resonance volume analysis in adult patients referred for assessment of right ventricular structure and function. J Med Imaging Radiat Oncol, 2015, 59(4): 421-430.[12] Hundley WG, Bluemke DA, Finn JP, et al. ACCF/ACR/AHA/NASCI/SCMR 2010 expert consensus document on cardiovascular magnetic resonance: a report of the American College of cardiology foundation task force on expert consensus documents. Circulation, 2010, 121(22): 2462-2508.[13] Ge RL, Ma RY, Bao HH, et al. Changes of cardiac structure and functionin pediatric patients with high altitude pulmonary hypertension in Tibet.High Altitude Med Biol, 2009, 10(3): 247-252.[14] Xie DM, Bao HH. The effects of chronic high altitude disease on cardiacstructure and function and the application prospect of MR in cardiac changes. Chin J Magn Reson Imaging, 2015, 6(12): 953-956.谢冬梅, 鲍海华. 慢性高原病对心脏的结构、功能影响及磁共振在心脏改变中的应用前景. 磁共振成像, 2015, 6(12): 953-956.编读往来《磁共振成像》杂志对参考文献有哪些要求问:什么样的参考文献可以引用?答:参考文献仅限作者亲自阅读过的与本文相关的主要文献,近3年的文献数量应占30%以上,近5年的文献数量应占50%以上,并应对照原文仔细核实。
基于分形维数的图像边缘提取
关卿;张卫
【期刊名称】《计算机科学》
【年(卷),期】2015(042)006
【摘要】针对医学领域中的红细胞图像要求测出细胞面积、圆度及个数等特征,提出一种基于分形维数的图像边缘提取方法.以分形布朗随机场模型为依据,计算每个像元的分形维数,将原来的灰度空间映射成分形维数空间,在该空间进行边缘检测.实验结果证明,在选择最佳窗口大小的情况下,该方法能突显医学细胞图像的检测特征,并且具有很强的抗噪声能力.
【总页数】3页(P296-298)
【作者】关卿;张卫
【作者单位】暨南大学信息科学技术学院广州510632;暨南大学信息科学技术学院广州510632
【正文语种】中文
【中图分类】TP391.9
【相关文献】
1.图像分形维数计算及其边缘提取 [J], 李鹏飞;邢立新;潘军;顾晓峰
2.基于Canny算法的图像边缘提取研究 [J], 高韩; 肖中俊; 严志国
3.基于改进全卷积神经网络的图像单像素边缘提取 [J], 刘畅; 张剑; 林建平
4.基于改进Canny算法与Hough变换的轨道图像边缘提取 [J], 汤旻安;王晨雨
5.基于相干特征的岩石薄片序列图像边缘提取及颗粒分割 [J], 周恒;张春雷;张欣;陈庆轩;张艳;仲诚诚
因版权原因,仅展示原文概要,查看原文内容请购买。
文章编号:1007-757X(2021)04-0061-05基于视觉传达效果的图像压缩感知重建算法研究沈凤仙(三江学院计算机科学与工程学院,江苏南京210000)摘要:针对传统的图像压缩感知重建算法的视觉传达效果不好、成像质量低0缺4,将图像分块理论D入压缩感知图像重建,结合曲波变换具有适合表达边缘细节信息和曲线信息的优4,利用曲波变换对MRI图像进行稀疏表示,形成一种基于视觉传达效果的MRI图像压缩感知图像重构算法#选择信噪比、相对"误差和匹配度为评价m标,通过无噪图像、加噪图像、不同采样频率对重构图像质量影响进行3组实验#实验结果表明,图像重构时,在信噪比、相对"误差和匹配度3个评价m 标上,提出的算法GPBDCT均优于SIDCT和PBDCT,同时GPBDCT具有很强的抵抗噪声的能力,在保持图像细节和边缘方面效果很好#关键词:小波变换;曲波变换;压缩感知;正则化参数;采样频率;信噪比中图分类号:TN911.73文献标志码:AStudy on Image Compression Perceptual ReconstructionAlgorithm Based on Visual Communication EffectSHEN Fengxian(School of Computer Science and Engineering,Sanjiang University,Nanjing210000,China)Abstract:Aiming at the shortcomings of traditional image compression perceptual reconstruction algorithm,such as bad visual communicatione f ectandlowimagequality,thetheoryofimageblockisappliedintothereconstructionofcompressedpercep-ualimagesTCombiningtheadvantagesofcurvelettransform,whichissuitableforexpressingedgedetailsandcurveinforma-ion,the MRIimagesarerepresentedsparinglybycurvelettransformTAn MRIimagereconstructionalgorithmbasedonvisual communication effect is proposed.The signal-to-noise ratio,relative—error and matching degree are selected as the evaluation indexes.The results of three groups of experiments show that the quality of reconstructed images is affected by noise-free images,noisy images and different sampling frequencies and PBDCT is superior to SIDCT and PBDCT in SNR,relative—error and matching degree.PBDCT has strong ability to resist noise and is good at preserving image details and edges.Key words:wavelet transform;curvelet transform;compression perception;regularization parameter;sampling frequency%SNR0引言磁共振成像(Magnetic Resonance Imaging,MRI)技术能够提供活体组织的细节图像,同时具有对人体无辐射性伤害等优点,因此被广泛地应用于人脑、胸部、心脏以及人体其他部位结构的成像。
专利名称:基于磁共振图像的骨骼分割的方法及其系统专利类型:发明专利
发明人:叶建平,王大平,张吉帅,尤微,田毅
申请号:CN201410087926.9
申请日:20140311
公开号:CN103871057A
公开日:
20140618
专利内容由知识产权出版社提供
摘要:本发明适用于医学图像技术领域,提供了一种基于磁共振图像的骨骼分割的方法及其系统,所述方法包括如下步骤:计算步骤:计算第一磁共振图像中的各个像素的Hessian矩阵及其特征值;提取步骤:提取所述第一磁共振图像中的片状结构,并对所述第一磁共振图像中的片状结构进行灰度增强,获得第二磁共振图像;优化步骤:对所述第二磁共振图像进行阈值连通计算,提取所述中的骨骼轮廓,并进行平滑优化,获得所述第二磁共振图像中的骨骼轮廓分割结果。
借此,本发明实现了在磁共振图像中完整且独立分割出需要分割的骨骼。
申请人:深圳市旭东数字医学影像技术有限公司,深圳市第二人民医院
地址:518000 广东省深圳市田区福华一路98号卓越大厦九楼907
国籍:CN
代理机构:北京律诚同业知识产权代理有限公司
更多信息请下载全文后查看。
ORIGINAL ARTICLEDiffusion tensor imaging in the cervical spinal cordTing Song •Wen-Jun Chen •Bo Yang •Hong-Pu Zhao •Jian-Wei Huang •Ming-Jin Cai •Tian-Fa Dong •Tang-Sheng LiReceived:12January 2009/Revised:2August 2010/Accepted:25September 2010/Published online:13October 2010ÓSpringer-Verlag 2010Abstract There are discrepancy between MR findings and clinical presentations.The compressed cervical cord in patients of the spondylotic myelopathy may be normal on conventional MRI when it is at the earlier stage or even if patients had severe symptoms.Therefore,it is necessary to take a developed MR technique—diffusion tensor imaging (DTI)—to detect the intramedullary lesions.Prospective MR and DTI were performed in 53patients with cervical compressive myelopathy and twenty healthy volunteers.DTI was performed along six non-collinear directions with single-shot spin echo echo-planar imaging (EPI)sequence.Intramedullary apparent diffusion coefficient (ADC)and fractional anisotropy (FA)values were measured in four segments (C2/3,C3/4,C4/5,C5/6)for volunteers,in lesions (or the compressed cord)and normal cord for patients.DTI original images were processed to produce color DTI maps.In the volunteers’group,cervical cord exhibited blue on the color DTI map.FA values between four segments had a significant difference (P \0.01),with the highest FA value (0.85±0.03)at C2/3level.However,ADC value between them had no significant difference (P [0.05).For patients,only 24cases showed hyperin-tense on T2-weighted image,while 39cases shown patchygreen signal on color DTI maps.ADC and FA values between lesions or the compressed cord and normal spinal cord of patients had a significant difference (both P \0.01).FA value at C2/3cord is the highest of other segments and it gradually decreases towards the caudal ing single-shot spin echo EPI sequence and six non-collinear diffusion directions with b value of 400s mm -2,DTI can clearly show the intramedullary microstructure and more lesions than conventional MRI.Keywords MR ÁDiffusion tensor imaging (DTI)ÁCervical myelopathy ÁApparent diffusion coefficient (ADC)ÁFractional anisotropy (FA)IntroductionCervical spondylosis is a very common degenerative dis-ease of the spine in the elderly [2,9].Conventional MR examination has played an important role in the diagnosis of cervical spondylosis,appearing intervertebral disk her-nia,osteophytosis,and cervical canal stenosis,etc.[12].All these conditions could result in cervical compressive myelopathy [3,13,17,21].Spondylotic compressive myelopathy developed progressively for years because of long-standing segmental compression of the spinal cord [8].Moreover,in some severe cases with obvious clinical symptoms such as extremity numbness and motion dys-function,there were no abnormal signal intensity on con-ventional MR imaging.How to explain the difference between the clinical manifestations and the MR findings became very difficult for radiologists and orthopedists due to the primary disadvantage of routine MR imaging is unable to display the microstructures of the lesion at the early stage.The earlier treatment yields to betterT.Song (&)ÁW.-J.Chen ÁJ.-W.Huang ÁM.-J.Cai ÁT.-F.Dong ÁT.-S.LiDepartment of Radiology,The Third Affiliated Hospital of Guangzhou Medical University,No.63Duobao Road,Guangdong 510150,Guangzhou,China e-mail:china_doctor@B.Yang ÁH.-P.ZhaoDepartment of Orthopedics,The Third Affiliated Hospital of Guangzhou Medical University,No.63Duobao Road,Guangdong 510150,Guangzhou,ChinaEur Spine J (2011)20:422–428DOI 10.1007/s00586-010-1587-3effectiveness.Therefore,it is very important to diagnose the lesion at the earlier stage.Diffusion tensor imaging(DTI),a magnetic resonance technique that is sensitive to the diffusion of water mole-cules,can diagnose the acute cerebral stroke which can not be demonstrated on conventional MR examinations[20]. Although DTI has been used widely in the brain[15,18],it was seldom used in the spinal cord because the quality of the images was degraded by artifacts of susceptibility, pulsation of cerebrospinalfluid(CSF),and heart motion or respiration motion[4,6].Additionally,the signal–noise ratio and resolution of images of DTI in human spinal cord was inferior to that of the brain because of the small size of the spinal cord.The purpose of this study was to elucidate the usage of DTI in analyzing the earlyfindings of the compressive cervical spinal cord and in depicting the dif-fusion characteristics of cervical cord in healthy volunteers of Chinese.We optimized the scanning parameters and sequences to study the clinical application value of DTI in the human cervical spinal cord by selecting the patients with spondylotic compressive myelopathy and healthy volunteers.Materials and methodsStudy subjectsFifty-three consecutive patients with cervical compressive myelopathy were prospectively studied from May2006to June2008.There were28males,25females,and the mean age56years(range47–71years).All patients were diagnosed to be the cervical compressive myelopathy based on the clinical manifestations(neck pain,extremity numbness,walking difficulty,etc.)and imaging modali-tiesfindings.All patients had the cervical spondylotic myelopathy,with calcification or thickening of the liga-mentumflavum in30patients,ossification or thickening of the posterior longitudinal ligament in16patients, cervical disc herniation in50patients,and cervical canal stenosis in42patients.The evaluation of myelopathy was performed according to the Japanese Orthopedic Associ-ation(JOA)score for cervical myelopathy[21].Patients with cerebral palsy,rheumatoid arthritis,or other spinal diseases,and those who needed spinal surgery due to kyphotic deformity or severity instability were excluded from this study.Twenty healthy volunteers(11males and9females, mean age55years,age range46–67years)without neu-rological deficits and any clinical symptoms were selected to be control group.The protocol followed ethical rules and was approved by our institutional review board,and all patients were informed and gave their consent before study initiation.Both patients and volunteers in control group were followed up for6months.MR protocolAll imaging was performed using a1.5T scanner(Gyro-scan NT Intera,Philips Medical Systems,the Netherlands) equipped with actively shielded magneticfield gradients of up to23mT/m,a slew rate of150mT/m/ms,and a multi-channel all-spine coil.For conventional sequences,scan-ning orientations were sagittal T1-weighted image,sagittal T2-weighted image and transverse T2-weighted image. The images were obtained with afield of view(FOV)of 250mm for sagittal scanning and230mm for transverse scanning,and an image matrix2569256.The conven-tional MRI sequences were spin-echo T1-weighted image (TR/TE=500ms/15ms)and fast spin-echo T2-weighted image(TR/TE=4,800ms/120ms).Slice thickness was 3mm,and slice gap0.3mm and numbers of acquisition3.Single-shot fast spin-echo echo-planar imaging(EPI) was used for DTI acquisition.Parameters for current dif-fusion tensor imaging were obtained as followed:using sagittal plane,slice thickness=3mm,slice gap=0mm, acquisition matrix=1289128,FOV=230mm,num-bers of acquisition=4.Diffusion was measured along six non-collinear directions with two b values(0, 400s mm-2).Data and images postprocessing and analysisThe diffusion tensor images were transferred to worksta-tion using a software written in interactive data language (IDL version 5.6)and were analyzed off-line by two experienced neuroradiologists(W.J.C,T.F.D)who were blinded to patients’clinical data.Disagreements were resolved via discussion until decisions were reached by consensus.The evaluation focused on the DTI and con-ventional MR images analysis,combined with the radio-graphicalfindings.The ADC and FA values were measured using regions of interest(ROIs,size50pixels)technique in cervical spinal cord at four different level segments,C2/3,C3/4, C4/5,C5/6for healthy volunteers,in lesions(or the com-pressive cord)and normal segments for patients,respec-tively.The intramedullary lesions were defined as the hyperintensity on T2-weighted image or the compressive cervical cord.The normal cord segment for patients was defined as the segments1.5cm distant from the lesion.DTI original images were automatically processed using IDL software to produce color DTI maps.The anisotropic dif-fusion in the craniocaudal direction was shown in blue.The diffusion in anterioposterior direction and right-left direc-tion was displayed in red and green,respectively.Statistics analysisA standard SPSS12.0for windows (SPSS Institute,Chi-cago,IL)software package was adopted for the statistical analysis.Data were expressed with mean ±stand devia-tion "xÆs .Paired t test,v 2test and one-way ANOVA (analysis of variance)analysis was used.P \0.05was considered statistically significant.ResultsDTI manifestations of cervical spinal cord in healthy volunteersCSF appeared hyperintense on the ADC map and hypointense on FA map (Fig.1).Cervical spinal cord showed intermedi-ated-intense on the ADC map and hyperintense on FA map.Cervical spinal cord showed a very uniform ADC value on ADC map.On the color DTI map (Fig.2),spinal cord showed blue.Four different level segments of cervical spinal cord,C2/3,C3/4,C4/5,C5/6,were analyzed and found that FA value between them had a significant difference using one-way ANOVA,F =159.24,P \0.01,with the highest FA value (0.85±0.03)of spinal cord segment at C2/3level.However,ADC values between four segments had no sig-nificant difference (F =2.08,P [0.05).(Table 1).MRI and DTI manifestations of cervical spinal cord in patientsConventional T 2-weighted images showed high signal intensity within the cervical cord only in 24cases,withoutabnormal signal in 26cases (Figs.3,7).1,2The remaining three cases were excluded from the further analysis because of the poor image quality produced by the motion artifacts.On DTI maps,39cases were found abnormal signal within the cervical spinal cord as follows:high signal intensity on ADC maps (Fig.4),low signal intensity on FA maps (Fig.5)and patchy yellow signal on color DTI maps (Figs.6,8)appearing on otherwise normal blue spinal cord.We found color diffusion tensor images can show more lesions than routine MR images (v 2=9.65,P \0.01).Also,ADC and FA values between lesions (or the compressive cord)and the non-compressive spinal cord had significant difference (Table 2,paired t test,for ADC,t =2.88,P \0.01,for FA,t =2.62,P \0.01).These volunteers and patients underwent follow-up MR and DTI examination within 6months after the first check-up.No abnormal changes were revealed on the imaging appearances and clinical presentations in volunteers.The patients with minor symptoms without obvious evidence of pathologic reflexes or gait disturbance warrant follow-up observation or non-operative treatment.Operative intervention was per-formed in the patients with severe symptoms,including anterior or posterior approach.These patients took the postoperative MR and DTI examination to evaluate the curative effect,such as decompression of cervical canal,decrease of lesion area.DiscussionMR imaging,owing to its high soft-tissue resolution,has played an important role in the analyzing the spinalcord’sFig.1Sagittal FA map of cervical spinal cord in a healthy volunteer demonstrating the homogeneous signal intensity of cervical spinalcordFig.2Sagittal color diffusion tensor imaging (DTI)map showing that cervical cord is blue (b =400s mm -2),the same volunteer as in the Fig.11Figures 3,4,5,6are from the same patients.2Figures 7,8are from 57-year-old patient with spondylotic compressive myelopathy.gross structure and in the diagnosing lesions of spinal cord. However,the conventional MR imaging could not disclose the microstructure of the spinal cord,such asfiber tract of the white matter.With the development of diffusion-weighted imaging,especially the diffusion tensor imaging,it becomes possible by analyzing the water molecule dif-fusion motion in pared with conventional MR imaging,DTI is a promising technique which was used gradually in clinical[6].Unlike free water,water molecule diffusion in human was hindered by cell alignment pattern,cell membranes, and other intracellular and extracellular structures,showing the anisotropy[6].Moseley et al.[15]reported that diffu-sion-weighted MR imaging can clearly show the ischemic lesions in the rat brain as early as the45min after the occlusion of middle cerebral artery.ADC maps were proved to be sensitive for detecting the early structural changes in the cervical compressive cord[1].We utilized the DTI technique to observe the compressed spinal cord in the cervical spondylosis and canal stenosis.The highly ordered arrangement of axons in the white matter of cer-vical spinal cord makes its diffusion highly anisotropic. Water molecules,due to the limitation of the myelin sheath,moved rapidly along the white matterfiber tract but slowly along other directions.Diffusion anisotropy in the white matter of spinal cord was also confirmed in vivo by animal experiments in many literatures[5,7,10,11].In human in vivo,DTI of spinal cord began in1999, Clark et al.[5]first reported that water diffusion in spinalTable1Comparisons of ADC and FA values of cervical cord in20 volunteersMean ADC value±SD (910-6mm2s-1)Mean FA value±SDC2/3level715.35±96.760.85±0.03 C3/4level713.27±86.380.81±0.02 C4/5level728.46±95.690.78±0.02 C5/6level734.42±64.590.66±0.04Fig.3Sagittal MR T2WI demonstrating C4/5intervertebral disc herniation and thickness of the ligamentumflavum but without abnormal signal intensity in the cervical spinalcord Fig.4ADC map of the same patient showing no abnormal signal intensity in the cervical spinalcordFig.5FA map of the same patient showing slight hyperintensity in the cervical spinal cordcord in human is anisotropic.In 2002,Ries reported the cervical spondylosis and found lesions on DTI map but not showed on conventional MRI [16].However,how to selectthe regions of interest became a dilemmatic challenge to radiologists as the cord diffusion anisotropy was measured in sagittal plane,although with a better coverage of lesions,probably including both white matter and gray matter.Notwithstanding it may be easy to discriminate the white matter from the gray matter in transverse plane,the less resolution and poor image quality made the cord anisotropy measured inaccurately.In current study,we still used the sagittal orientation to produce the DTI maps combined with the improved parameters,and the good quality image and cord anisotropy measurement can as well be obtained.Routine MR imaging could show the cervical canal stenosis,protrusion of intervertebral disk,thickening of the ligamentum flavum and the posterior longitudinal ligament,etc.In this study,abnormal signal intensity was shown only for 24patients in T 2-weighted imaging,but 39patients in DTI colored tensor images,on which green or red signals were seen on normal blue spinal cord.Demir et al.[8]reported the MR study of a group of cervical spondylosis in which 17cases showed injuries on MR ADC maps,while only 13cases in routine MR T2-weighted images.On the contrary,there were no abnormal findings on volunteers’DTI maps.For another 26patients without abnormal signal on all sequences of routine MR,however,the ADC and FA values in the segments of the compressive spinal cord differed obviously with the other segments of non-com-pressed spinal cord.There was no pathological confirma-tion of intramedullary lesions as it is impossible to get the specimens of human spinal cord in vivo.Nevertheless,those areas showed on DTI maps were correlated well with locations proved by clinicaldata.Fig.6The color DTI map of the same patient showing abnormal green signal intensity in the blue background of normal cervical spinalcordFig.7The routine MR T2WI image demonstrating C5/6interverte-bral disc herniation and thickness of the posterior longitudinal ligament but without abnormal signal intensity in the cervical spinalcordFig.8Sagittal color DTI map of the same patient showing intramedullary the pathy green signal at C5/6levelThe cause for the increased ADC values in the com-pressed cord is still uncertain.Tsuchiya et al.[19] explained it was possible that the elevated ADC values indicated the cystic necrosis,syrinx and atrophy were caused by myelomalacia.On our opinions,hyperostosis, intervertebral disk herniation and canal stenosis com-pressing the spinal cord could cause decreasing perfusion which might lead to ischemia and anoxemia and cellular membrane injury that could increase cellular membrane penetrability.And long-term compression to spinal cord may cause CSF toflow turbulently and to penetrate into spinal cord and to form intramedullary microcysts which cannot be displayed on conventional MR examination [8,14].The decreased FA values were attributed to the restric-ted diffusion of water molecule in the compressed cord. The intramedullary edema resulted in destroyed balance between intra-and extra-cellular spaces and the combina-tion of water molecule and protein could also cause the decreased diffusivity[14].The anatomical structure and lesion can be displayed clearly on DTI images with single-shot spin-echo EPI sequence which could reduce the motion artifacts,and six-noncollinear directions using b value of400s mm-2.FA value in spinal cord of Chinese is higher at C2/3level than other levels,the lower FA value at C5/6level.This phe-nomenon,as Wheeler-Kingshott et al.[20]described,may be correlated with the ratio of the white matter to the gray matter.More caudally,the gray matter and the brachial plexus nerve root which cause directional changes offibers gradually increased,resulting in FA value decreased. Colored-DTI maps can demonstrate lesions not seen on routine MR images.Although clinicians can thoroughly and neurologically check patients even if without abnormal conventional MR manifestations,they seldom accurately localized the lesion and quantitatively analyzed the lesion.Indeed,once the abnormal signal occurred on the DTI,prophylactic treatment may be taken for severe cases to prevent clinical symptoms deteriorated.There are many conser-vative treatments, e.g.,applying the cervical orthosis which is so feasible that patients can sit up and become ambulatory.Surgery is an alternative option for those patients who fail to achieve recovery after conservative treatment.In conclusion,DTI can display the earlier alterations of the water molecule within the lesions due to its sensitivity to the movement of water molecule and can explain the discrepancy between conventional MRIfindings and the clinical manifestations.However,resolution and image quality of DTI of spinal cord is also slightly inferior to that of brain.How to improve the image quality is the main problem in our further study.Acknowledgments The manuscript submitted was supported by the Medical Science Foundation of the Department of Health of Guangdong Province(No.A2006529),the Medical Science Founda-tion of the Bureau of Health of Guangzhou city(No.2005-YB-040), and Doctoral Scientific Research Start-up Foundation of Guangzhou Medical College(No.2006GD081).No benefits in any form have been or will be received from a commercial party related directly or indirectly to the subject of this manuscript.References1.Aota Y,Niwa T,Uesugi M,Yamashita T,Inoue T,Saito T(2008)The correlation of diffusion-weighted magnetic resonance imaging in cervical compression myelopathy with neurologic and radiologic severity.Spine33:814–8202.Baptiste DC,Fehlings MG(2006)Pathophysiology of cervicalmyelopathy.Spine J6(6Suppl):190S–197S3.Baron EM,Young WF(2007)Cervical spondylotic myelopathy:a brief review of its pathophysiology,clinical course,and diag-nosis.Neurosurgery60(1suppl1):35–414.Cercignani M,Horsefield MA,Agosta F,Filippi M(2003)Sen-sitivity-encoded diffusion tensor MR imaging of the cervical cord.AJNR24:1254–12565.Clark CA,Barker GJ,Tofts PS(1999)Magnetic resonance dif-fusion imaging of the human cervical spinal cord in vivo.Magn Reson Med41:1269–12736.Clark CA,Werring DJ(2002)Diffusion tensor imaging in spinalcord:methods and applications—a review.NMR Biomed 15:578–5867.Clark CA,Werring DJ,Miller DH(2000)Diffusion imaging ofthe spinal cord in vivo:estimation of the principal diffusivities and application to multiple sclerosis.Magn Reson Med 43:133–1388.Demir A,Ries M,Moonen CT,Vital JM,Dehais J,Arne P,Caille´JM,Dousset V(2003)Diffusion-weighted MR Imaging with apparent diffusion coefficient and apparent diffusion tensor maps in cervical spondylotic myelopathy.Radiology229:37–439.Fehlings MG,Skaf G(1998)A review of the pathophysiology ofcervical spondylotic myelopathy with insights for potential novel mechanisms drawn from traumatic spinal cord injury.Spine 23:2730–273710.Franconi F,Lemaire L,Marescaux L,Jallet P,Le Jeune JJ(2000)In vivo quantitative micro imaging of rat spinal cord at7T.Magn Reson Med44:893–898Table2Comparisons of ADC and FA values of the compressed or compromised cord and non-compressed cord in50patients with cervical spondylotic myelopathyLesions(or the compressive cord)Non-compressed cord t PMean ADC value836.57±161.65733.34±82.85t=2.88P\0.01 Mean FA value736.29±84.25775.95±67.31t=2.62P\0.0111.Gulani V,Webb AG,Duncan ID,Lauterbur PC(2001)Apparentdiffusion tensor measurements in myelin-deficient rat spinal cords.Magn Reson Med45:191–19512.Kaiser JA,Holland BA(1998)Imaging of the cervical spine.Spine23:2701–2712Rocca H(1988)Cervical spondylotic myelopathy:naturalhistory.Spine13:854–85514.Mamata H,Jolesz FA,Maier SE(2004)Characterization ofcentral nervous system structures by magnetic resonance diffu-sion anisotropy.Neurochem Int45:553–56015.Moseley ME,Kucharczyk J,Mintorovitch J,Cohen Y,Kurhanewicz J,Derugin N,Asgari H,Norman D(1990)Diffu-sion-weighted MR imaging of acute stroke:correlation with T2-weighted and magnetic susceptibility-enhanced MR imaging in cats.AJNR11:423–42916.Ries M,Jones RA,Dousset V,Moonen CT(2000)Diffusiontensor MRI of the spinal cord.Magn Reson Med44:884–99217.Sampath P,Bendebba M,Davis JD,Ducker TB(2000)Outcome ofpatients treated for cervical myelopathy:a prospective,multicenter study with independent clinical review.Spine25:670–67618.Sinha S,Bastin ME,Whittle IR,Wardlaw JM(2002)Diffusiontensor MR imaging of high-grade cerebral gliomas.AJNR 23:520–52719.Tsuchiya K,Katase S,Fujikawa A,Hachiya J,Kanazawa H,Yodo K(2003)Diffusion-weighted MRI of the cervical spinal cord using a single-shot fast spin-echo technique:findings in normal subjects and in myelomalacia.Neuroradiology45:90–94 20.Wheeler-Kingshott CA,Hickman SJ,Parker GJ,Ciccarelli O,Symms MR,Miller DH,Barker GJ(2002)Investigating cervical spinal cord structure using axial diffusion tensor imaging.Neu-roimage16:93–10221.Yukawa Y,Kato F,Yoshihara H,Yanase M,Ito K(2007)MR T2image classification in cervical compression myelopathy:pre-dictor of surgical outcomes.Spine32:1675–1678。