ATR棘轮止损指标ATR+Ratchet
- 格式:doc
- 大小:40.00 KB
- 文档页数:5
跟踪止损移动止盈神技ATR、SAR整理泥巴笔记:相信能点开这文章的朋友,已经对股市风险有了认识,对困于盈了坐了滑滑梯,亏了一拖再拖,泥足深陷的局面憎恨情绪已经爆棚。
恭喜你,也许读了这篇整理文章你有所获。
反正,基于这些技巧,我持股操盘已有了定数,脱离了股市涨跌的喜怒哀乐。
红了绿了,又什么关系,止盈点在那里、止损点在那里,入市就清清楚楚,明明白白。
亏了,走了,机会还在,盈了,抓住,有本事,砸破我的止盈,我认帐,锁定我该得的走人。
否则,对不起,我能把鱼身吃完。
鱼尾鱼头就算了吧!吃尽不放碗,不是我辈该想的,不仁义,是吧!•第一部分:ATR棘轮法一种新的止损策略——ATR棘轮法基础思想是非常简略的,我们先选定一个公平的起始价格,然后天天加某一倍数的ATR,得到一个跟踪止损点。
由该方法天生的止损点不仅能随着时间的增加不断上移而且同时也能适应市场波动性增减。
与我们以前采用的由抛物转向指标得到的止损点相比,其长处在于:应用ATR棘轮,我们能更自由的选择起始价格和增减速度。
此外我们还发明基于ATR的止损点能更快更准确的反应波动性变更,从而使我们能比传统的跟踪止损法锁定更多的利润。
源码,直接复制可用M:= 14;N:= 10;RATIO:= 0.03;TRA:=(MAX(MAX((HIGH-LOW),ABS(REF(CLOSE,1)-HIGH)),ABS(REF(CLOSE,1)-LOW)));ATR:=MA(TRA,M);多止: LLV(L,N)+RATIOATR;空止: HHV(H,N)-RATIOATR;结束----------------------------下面是一个利用该策略的例子:当我们1ATR以上的盈利目标实现时,我们选择一个近期低点(比如最近十天的最低价)作为起始价格,然后根据我们持仓天数天天将最低价增加零点几倍的ATR(比如0.05ATR)。
假如我们已经持有仓位15天了,那么我们把0.05ATR乘以15天,然后将其乘积0.75ATR加到起始价位上。
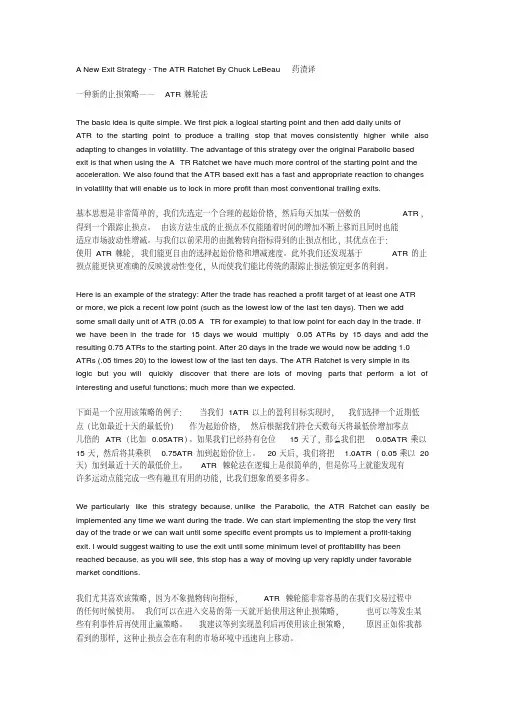
A New Exit Strategy - The ATR Ratchet By Chuck LeBeau 药渣译一种新的止损策略——ATR棘轮法The basic idea is quite simple. We first pick a logical starting point and then add daily units ofATR to the starting point to produce a trailing stop that moves consistently higher while also adapting to changes in volatility. The advantage of this strategy over the original Parabolic based exit is that when using the A TR Ratchet we have much more control of the starting point and the acceleration. We also found that the ATR based exit has a fast and appropriate reaction to changes in volatility that will enable us to lock in more profit than most conventional trailing exits.基本思想是非常简单的,我们先选定一个合理的起始价格,然后每天加某一倍数的ATR,得到一个跟踪止损点。
由该方法生成的止损点不仅能随着时间的增加不断上移而且同时也能适应市场波动性增减。
与我们以前采用的由抛物转向指标得到的止损点相比,其优点在于:使用ATR棘轮,我们能更自由的选择起始价格和增减速度。
此外我们还发现基于ATR的止损点能更快更准确的反映波动性变化,从而使我们能比传统的跟踪止损法锁定更多的利润。
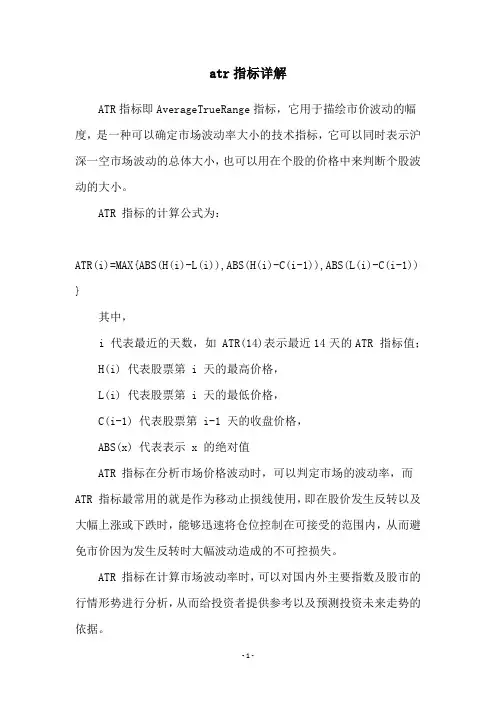
atr指标详解
ATR指标即AverageTrueRange指标,它用于描绘市价波动的幅度,是一种可以确定市场波动率大小的技术指标,它可以同时表示沪深一空市场波动的总体大小,也可以用在个股的价格中来判断个股波动的大小。
ATR 指标的计算公式为:
ATR(i)=MAX{ABS(H(i)-L(i)),ABS(H(i)-C(i-1)),ABS(L(i)-C(i-1)) }
其中,
i 代表最近的天数,如 ATR(14)表示最近14天的ATR 指标值; H(i) 代表股票第 i 天的最高价格,
L(i) 代表股票第 i 天的最低价格,
C(i-1) 代表股票第 i-1 天的收盘价格,
ABS(x) 代表表示 x 的绝对值
ATR 指标在分析市场价格波动时,可以判定市场的波动率,而ATR 指标最常用的就是作为移动止损线使用,即在股价发生反转以及大幅上涨或下跌时,能够迅速将仓位控制在可接受的范围内,从而避免市价因为发生反转时大幅波动造成的不可控损失。
ATR 指标在计算市场波动率时,可以对国内外主要指数及股市的行情形势进行分析,从而给投资者提供参考以及预测投资未来走势的依据。
atr指标使用技巧ATR指标是一种技术指标,用于衡量市场的波动性和价格的变动范围。
它是根据市场的真实波动范围来计算的,通常用于确定止损和获利水平,并辅助其他技术分析工具的使用。
下面是关于使用ATR指标的一些技巧。
首先,ATR指标可以用来确定止损水平。
止损水平是交易中最关键的因素之一,决定了风险控制和获利潜力。
使用ATR指标可以帮助我们根据市场的波动性来设置合理的止损水平。
在较为震荡的市场中,我们可以设置较小的止损水平,以容忍更大的价格波动。
而在较为趋势的市场中,我们可以设置较大的止损水平,以允许价格有更多的波动空间。
其次,ATR指标还可以用来确定获利水平。
获利水平是持有头寸时应该考虑的另一个重要因素。
通过观察ATR指标的数值,我们可以确定合适的获利目标。
在较为波动的市场中,我们可以设定较高的获利目标,以便能够捕捉到更大的价格波动。
而在较为稳定的市场中,我们可以设定较低的获利目标,以确保能够及时获利。
此外,ATR指标还可以用来确认市场趋势的强度。
当ATR指标的数值上升时,意味着市场的波动性正在增加,可能有新的趋势正在形成。
相反,当ATR指标的数值下降时,意味着市场的波动性正在减小,可能意味着市场即将进入震荡阶段。
通过观察ATR指标的数值,我们可以判断市场的趋势强度,并作出相应的交易决策。
最后,ATR指标还可以与其他技术分析工具结合使用。
例如,当价格突破之前的高点或低点时,我们可以使用ATR指标来确认突破的有效性。
如果突破的幅度超过了市场的平均波动范围,那么它很可能是一个真正的突破。
另外,ATR指标还可以与移动平均线等指标结合使用,帮助我们确认市场的趋势和价格的反弹点。
总之,ATR指标是一种有用的技术指标,可以帮助我们更好地控制风险、设定获利目标、判断市场的趋势和动能。
通过合理使用ATR指标,我们可以提高交易的成功率,并增加交易的盈利潜力。
然而,需要注意的是,ATR指标只是一个辅助工具,不能单独使用。
atr止损指标摘要:一、ATR止损指标的概念与原理1.ATR指标的定义2.ATR指标的计算方法3.ATR指标在止损策略中的应用二、ATR止损指标的优势与局限1.优势:适应市场波动,避免频繁止损2.优势:设定简单,易于操作3.局限:无法完全避免损失4.局限:在市场波动较大时,止损点可能过于远离价格三、如何利用ATR止损指标进行交易1.结合其他技术指标使用2.设定合适的ATR值3.注意市场动态,适时调整ATR值四、总结与展望1.ATR止损指标的适用场景2.与其他止损指标的比较3.未来发展趋势与前景正文:ATR止损指标是一种广泛应用于金融市场的技术分析工具,它可以帮助投资者在市场波动较大时,合理设定止损点,降低损失。
本文将详细介绍ATR止损指标的概念、原理、优势与局限,以及如何利用该指标进行交易。
首先,我们来了解ATR指标的概念与原理。
ATR,即平均真实波幅(Average True Range),是衡量市场波动性的一种指标。
其计算方法为:ATR = ∑(今日真实波幅- 前一日ATR值)/ n,其中n为交易天数。
在实际应用中,ATR值通常用来设置止损点,以避免因市场波动而造成的损失。
ATR止损指标的优势在于其能够适应市场波动,避免频繁止损。
由于ATR 值会随着市场波动而变化,因此在波动较大的情况下,止损点会相对远离价格,降低因短期波动而导致的止损。
同时,ATR指标设定简单,易于操作,投资者只需根据历史数据计算出ATR值,然后将其作为止损点即可。
然而,ATR止损指标也存在一定的局限性。
首先,该指标无法完全避免损失。
虽然ATR值会随着市场波动而变化,但在某些极端情况下,仍有可能出现较大的损失。
其次,在市场波动较大时,止损点可能过于远离价格,导致投资者承受较大的损失。
那么,如何利用ATR止损指标进行交易呢?首先,投资者可以结合其他技术指标使用,如趋势线、移动平均线等,以更全面地分析市场走势。
其次,要设定合适的ATR值,过大或过小都会影响止损效果。
atr指标详解atr指标是一种技术分析工具,用于衡量股票、期货或其他交易品种的波动性。
atr是Average True Range的缩写,意为平均真实波幅。
atr指标的计算方式是基于最高价、最低价和前一日收盘价之间的差值来确定交易品种的波动性。
atr指标的主要作用是帮助交易者判断价格的波动幅度,从而确定适当的买入和卖出时机。
atr指标的数值越高,说明交易品种的波动性越大,反之,数值越低则波动性越小。
atr指标的计算方法相对简单,通常采用一种移动平均的方式。
具体计算公式如下:atr = (前一日的atr * (n-1) + 当日的tr) / n其中,n代表计算atr指标的时间周期,tr代表当日的真实波幅。
atr指标的应用范围广泛,适用于各种交易市场和品种。
它可以用于短线交易,帮助交易者确定适当的止损和止盈水平。
同时,atr指标也可以用于长线投资,帮助投资者判断资产的长期波动性,从而制定合理的投资策略。
在实际操作中,atr指标可以与其他技术指标结合使用,以提高交易的准确性和可靠性。
例如,交易者可以将atr指标与移动平均线指标结合,通过判断atr指标与移动平均线的相对位置来确定买入和卖出信号。
atr指标还可以用于风险管理。
交易者可以根据atr指标的数值来确定适当的止损水平,从而控制风险。
较大的atr值意味着较高的波动性,交易者可以设置较宽的止损水平,以避免过早被止损出局。
相反,较小的atr值意味着较低的波动性,交易者可以设置较窄的止损水平,以保护已实现的利润。
atr指标是一种有效的技术分析工具,可以帮助交易者判断交易品种的波动性,并制定相应的交易策略。
它可以用于短线交易和长线投资,适用于各种交易市场和品种。
在实际应用中,交易者可以根据自己的交易风格和风险承受能力,合理运用atr指标,提高交易的成功率和盈利能力。
atr指标详解ATR指标是一种技术分析指标,全称为Average True Range,中文意为“真实波幅的平均值”。
它是由美国技术分析专家维尔德(J.H.Welles Wilder Jr.)于1978年提出的。
ATR指标主要用于衡量证券交易市场中的波动性和价格波幅的变化。
它不仅可以帮助投资者评估证券的风险水平,还可以作为交易的基础,帮助确定适当的止损和止盈水平。
ATR的计算方法如下:首先,计算每个交易日的真实波幅(True Range,TR)。
TR等于当日的最高价和最低价之间的差额,或当日最高价和前一交易日收盘价之间的差额,或当日最低价和前一交易日收盘价之间的差额中的最大值。
其次,计算n日的真实波幅之和的平均值,即ATR。
ATR的计算周期通常选取14个交易日。
然而,投资者也可以根据自己的需求,选择其他周期,如7日或21日。
一般而言,较短的周期能够更及时地反映市场的变化,而较长的周期则可以平滑市场噪声。
ATR指标的数值一般以股价的形式呈现,根据每个交易日的价格波幅而变化。
它具有无单位性,即不受价格水平的影响,只受价格变化的影响,便于不同证券的比较分析。
ATR指标主要用于两个方面的分析。
首先,它可以用来测量市场的波动性,帮助投资者判断市场的稳定程度和风险水平。
当ATR指标上升时,说明市场波动加剧,投资者应增加风险控制。
当ATR指标下降时,说明市场波动减弱,投资者可以适度扩大仓位。
其次,ATR指标可以用于设定交易的止损和止盈点位。
以ATR的倍数为基准,设定相应的价格区间,来决定止损和止盈的位置。
当股价超过止损或止盈点位时,投资者可以及时退出或调整仓位,控制风险和保护收益。
总的来说,ATR指标是一种重要的技术分析工具,通过测量市场波动性和价格波幅的变化,帮助投资者评估风险水平,制定交易策略。
然而,投资者在使用ATR指标时,还应结合其他技术指标和基本面分析,综合考量,做出更准确的判断和决策。
atr指标详解
ATR指标是一种技术指标,全称为Average True Range,平均真实波幅。
它是由J. Welles Wilder在1978年提出的,主要用于衡量股市或其他金融市场的价格波动性。
ATR指标的计算基于一个股票或其他金融资产的最高价和最低价之间的差异,并考虑到当天的收盘价。
在计算中,需要采用一定的计算周期,通常为14天。
计算的过程较为复杂,
这里不做详细介绍。
简单来说,ATR指标的计算步骤为:首先
计算每天的真实波幅(True Range),然后取这些真实波幅的平均值即可得到ATR指标。
ATR指标的数值可以用来描述市场的波动幅度。
一般来说,ATR值较大意味着市场波动较大,而ATR值较小意味着市场波
动较小。
因此,ATR指标常常被用于确定波动性的变化情况,
对于制定止损位和盈利目标非常有帮助。
在使用ATR指标时,可以根据具体的情况进行相应的调整。
例如,可以通过增加或减少计算周期来改变指标的敏感度,从而适应不同周期的交易策略。
此外,还可以将ATR指标与其他技术指标结合使用,以提高分析的准确性。
总的来说,ATR指标是一种评估市场波动性的技术指标,可以帮助交易者确定止损位和盈利目标。
它具有简单明了、易于计算和使用的特点,适用于不同的交易策略和市场情况。
但需要注意的是,ATR指标只是一个辅助工具,不能单独作为决
策的依据,交易者还需要考虑其他因素进行综合分析。
atr止损指标(最新版)目录1.ATR 止损指标的含义和作用2.ATR 止损指标的计算方法3.ATR 止损指标的运用策略4.ATR 止损指标的优缺点正文一、ATR 止损指标的含义和作用ATR(Average True Range,平均真实波幅)止损指标是一种基于市场波动性的技术指标,用于衡量股票、期货等金融产品价格波动的幅度。
ATR 止损指标的主要作用是帮助投资者在交易过程中设定合理的止损点,降低损失风险。
二、ATR 止损指标的计算方法ATR 止损指标的计算方法相对简单,主要涉及两个参数:周期数(Period)和多空分界点(Multiplier)。
1.周期数:周期数决定了 ATR 止损指标的时间跨度,一般取值为 14。
2.多空分界点:多空分界点是根据 ATR 值计算得出的一个参考数值,用于判断市场是多头市场还是空头市场。
多头市场的多空分界点为 ATR 值,空头市场的多空分界点为-ATR 值。
ATR 止损指标的计算公式如下:ATR = (最高价 - 最低价) / 2 + (前一日 ATR 值)三、ATR 止损指标的运用策略在实际操作中,投资者可以根据 ATR 止损指标来设定止损点。
一般来说,当市场处于多头市场时,投资者可以将止损点设在 ATR 值附近;当市场处于空头市场时,投资者可以将止损点设在-ATR 值附近。
四、ATR 止损指标的优缺点1.优点:ATR 止损指标具有较强的市场适应性,能够根据市场波动自动调整止损点,降低投资者的操作风险。
2.缺点:ATR 止损指标的计算方法较为简单,容易受到市场突发事件和数据失真的影响,可能导致投资者在极端情况下出现较大损失。
综上所述,ATR 止损指标作为一种基于市场波动性的技术指标,能够帮助投资者在交易过程中设定合理的止损点,降低损失风险。
第1页共1页。
ATR棘轮法atr指标扎根于市场的波动性,有着极强的自适应性。
只要大致了解某个市场的波动强度,就可以拿atr来设置入场、出场(止损或者止盈)和头寸管理(一套完整的系统的要素),因此算是我心目中的万能指标了。
只要基本符合市场的波动性,我们可以随手编出一大堆无需太多优化和指标而且收益不错的系统。
ATR棘轮法是国外的一个出场策略,10多年前就已经出现了,个人认为这个思路是相当棒的,就是不知道如何写成模型进行测试。
中文翻译及原文如下:/content/10/0124/13/690250_1428 1366.shtml根据这个策略,追踪止损的移动受到三个因素的影响:持仓时间的增加、原始止损点的正向(赢利方向)移动、市场正向(赢利方向)波动性的增加(即atr数值本身的波动),而且市场正向波动性增加对止损位的影响还和持仓时间成正比。
因此作者建议入场10根线以及浮盈达到1ATR后再设置这个方法,过早的启动会导致持仓时间因素给止损位的移动带来太大的乘数效应。
个人认为,可能并不是所有的周期和市场都适用这个方法,比如我主要操作国内期货日内5分钟周期,每天只有54根k线,持仓时间有限,这种方法可能不如传统的追踪止损来得简单方便。
但是对于15分钟线的日间操作或者1分钟线的日内操作来说可能就挺不错的,至于国外的24小时开盘的品种也许就更好用了。
这个策略将时间因素、市场波动和跟踪止损的思想很好的融合在一起,即便实战不管用,只要能编出这种系统,一可以启发大家的思路,二可以让我这样的编程菜鸟学到很多编程知识。
以前我老是想,国外那些互相分享策略的不是傻子吗?有钱自己不去赚,后来等我从市场的迷茫中走出来后发现,我才是真正的傻子。
一个优秀的相同的策略可以有成千上万种开仓点和平仓点,自己实际用的入场和出场点从来都不是最优的,但至少是当下适合自己的,而且是正期望值的。
分享策略只会让策略本身经受考验和修正,变得更加完善(不是完美),或者衍生出其他的好策略。
ATR指标的使用方法和原理
ATR=(前一日的ATR*(N−1)+当日的TR)/N
其中,N为计算ATR指标的周期,默认为14
真实波动范围(True Range)的计算公式为:
TR=MAX(H−L,ABS(H−昨收),ABS(L−昨收))
其中,H为当日的最高价,L为当日的最低价,昨收为前一日的收盘价。
1.确定止损点位:ATR指标可以帮助投资者确定合理的止损点位。
一般来说,投资者可以根据ATR指标将止损点位设置在前一日收盘价上下一个或两个ATR的位置。
2.确定入场点位:ATR指标可以帮助投资者确定适合的入场点位。
当价格波动性较大时,投资者可以将入场点位设置在当前价格上下一个或两个ATR的位置。
3.判断趋势启动:当ATR指标从低位上升到高位时,表明价格波动性增大,可能是趋势启动的信号。
投资者可以根据此信号进行适量的买入或卖出操作。
需要注意的是,ATR指标主要用于衡量价格的波动性,不能单独作为买卖信号来使用。
投资者在运用ATR指标时,还需要结合其他技术指标和基本面分析来进行判断。
此外,ATR指标还有一种变种指标称为ATR百分比指标。
它是以ATR 指标的数值除以收盘价得到的一个相对指标。
ATR百分比指标可以用来比较不同股票或期货的波动性,并作为筛选交易品种的依据。
综上所述,ATR指标是一种有效的用于衡量价格波动性的技术指标。
它的使用方法包括确定止损点位、入场点位和判断趋势启动。
投资者在使用时应注意结合其他指标和分析方法,并根据自己的交易策略进行判断和操作。
止盈止损提示指标
止盈止损提示指标是一种技术指标,用于帮助投资者设定止盈和止损的水平。
这些指标通常基于市场波动性和价格变动的历史数据进行计算,从而提供了一定的参考依据。
常见的止盈止损提示指标包括:
1. ATR(平均真实波动幅度):该指标衡量了标的资产在一定时间内的平均波动幅度,可以作为设定止盈止损水平的参考。
2. Bollinger Bands(布林带):该指标通过计算标的资产的移动平均线、标准差等参数,形成上下两条通道线,投资者可以根据价格触及通道线的情况来设定止盈止损水平。
3. MACD(移动平均线收敛/发散):该指标通过计算快线和慢线之间的差异,以及两条线的移动平均线,来判断市场的趋势方向。
投资者可以根据趋势的变化来设定止盈止损水平。
4. RSI(相对强弱指标):该指标通过计算标的资产在一定时间内的涨跌幅,来判断市场的超买超卖情况。
投资者可以根据超买超卖的情况来设定止盈止损水平。
这些指标只是一些常见的示例,投资者可以根据个人的交易策略和风险偏好选择适合自己的止盈止损提示指标。
同时,投资者也应该综合考虑其他因素,如资金管理、市场情绪等,进行综合分析和决策。
atr指标止损止盈技巧ATR指标是一种广泛使用的技术分析工具,可以帮助交易者确定交易的止损和止盈点位。
此指标可以在任何交易市场中使用,例如外汇、股票和期货市场。
ATR指标通过测量价格波动的强度和范围来确定止损和止盈点位。
在本文中,我们将探讨使用ATR指标的止损和止盈技巧。
1. 了解ATR指标在学习ATR指标的止损和止盈技巧之前,首先需要了解ATR指标的基本原理。
ATR指标是平均真实范围指标的简称,它是一种通常用于度量市场波动性的技术指标。
ATR指标测量价格波动的范围,这是价格震荡的度量单位。
ATR指标的值越大,价格的波动性就越大。
2. 确定止损点位止损点位是为了限制风险,当交易开始走向不利方向时,止损点位可以帮助我们限制损失并减少亏损。
使用ATR指标可以帮助我们更好地确定合适的止损点位。
要确定止损点位,我们首先需要计算平均真实范围的ATR值。
一般而言,交易者使用ATR的一定倍数作为止损点位。
例如,如果ATR指标值为1.5,交易者可以将止损点位设置在目前交易价格的1.5倍ATR范围之外。
另外,止损点位应该设置在重要支撑或阻力水平的下方或上方。
这样做的原因是,价格很有可能开始反弹向着既有的支撑或阻力水平,因此,止损点位在这些重要水平下方或上方有助于限制亏损并保护交易者的资金。
3. 确定止盈点位止盈点位是为了最大化利润,当价格走向有利方向时,止盈点位可以帮助我们实现这一目标。
使用ATR指标可以帮助我们更好地确定合适的止盈点位。
要确定止盈点位,我们需要计算ATR指标的值,然后将其乘以交易者想要的收益倍数。
如果ATR值为1.5,并且交易者想要以2倍ATR的收益为目标,那么止盈点位将是当前交易价格加上3个ATR值(1.5乘以2)。
同样地,止盈点位也应该设置在重要支撑或阻力水平的上方或下方。
这样做的原因是,价格很有可能开始反弹向既有的支撑或阻力水平,因此,止盈点位在这些重要水平上方或下方有助于实现最大利润。
一种新的止损策略——ATR棘轮法何时启动ATR棘轮:我们可以根据时间而不是根据价格来启动ATR棘轮策略,因为前者即其简单。
或者我们也可以综合考虑时间与价格来启动ATR棘轮策略。
例如,是否启动ATR棘轮取决于是否同时满足两个条件:1)至少已经持仓10天(基于时间因素);2)浮动盈利至少1ATR。
总体感觉,启动ATR棘轮的最佳时机是在实现巨大的盈利目标之后。
ATR棘轮似乎是一个非常好的保护盈利的止损策略。
但我怀疑如果你在交易实现浮动盈利前启动ATR棘轮,你会过早的被踢出市场。
(译者注:我不明白为什么在实现盈利前启动ATR棘轮策略就会被过早踢出市场,而当实现巨大盈利后启动该策略就不会被过早踢出市场?虽然原作者没有明说,但隐含着这种意思)As I mentioned, one of the things I like best about the ATR Ratchet is its flexibility and adaptability. Here is another idea on how to start it. We can start it after fifteen bars but we don't necessarily have to add fifteen ratchets. The logic for the coding would be to start the Ratchet after 15 bars in the trade but multiply the ATR units by the number of bars in the trade minus ten or divide the number of days in the trade by some constant before multiplying the ATR units. This procedure will reduce the number of ratchets, particularly at the beginning of the trade when the exit is first implemented. Play around with the ATR Ratchet and see what creative ideas you can come up with.如上所述,ATR棘轮策略最讨我喜欢的地方之一是该策略的灵活性和适应能力。
技术分析之ATR指标编者按:平均波幅通道技术指标(ATR)是显示市场变化率的指标。
这一指标是由WILDER开发的,并且在他的《新概念技术贸易体系》一书中详细的进行了论述。
这一指标是无数其他指标以及之后其它贸易体系的组成部分。
真实波动幅度均值(ATR)是优秀的交易系统设计者的一个不可缺少的工具,它称得上是技术指标中的一匹真正的劲马。
每一位系统交易者都应当熟悉ATR及其具有的许多有用功能。
其众多应用包括:参数设置,入市,止损,获利等,甚至是资金管理中的一个非常有价值的辅助工具。
下面我们会简单解释的;如何利用ART设计交易系统?我们随后也会用几个简单例子说明众多方法中的一些。
如何计算真实波动幅度均值(ATR)波动幅度:单根K线图最高点和最低点间的距离。
真实波动幅度:是以下三个波动幅度的最大值1. 当天最高点和最低点间的距离2. 前一天收盘价和当天最高价间的距离,或3. 前天收盘价和当天最低价间的距离当日K线图出现缺口时,真实波动幅度和单根K线的波动幅度是不同的。
真实波动幅度均值就是真实波动幅度的平均值。
为了让ATR反映近期波动性,可以使用短期ATR(2-10根K 线图);为了让ATR反映长期波动性,可以使用20至50根K线或更多。
ATR是一个评价市场价格运动的通用指标,而且是一个真正的自适应指标。
下面这个例子能帮助解释这些特征的重要性。
如果我们计算一下玉米在两天内的平均价格波动幅度,比如说是500美元;日元合约的平均价格波动幅度可能是2,000美元或更多。
如果我们要建立一个交易系统分别为玉米或日元设置合适的止损水平,那么我们会看到这两者的止损水平是不同的,因为两者的波动性不同。
我们可能在玉米上设定750美元的止损水平,而在日元合约上是3,000美元。
如果我们要建立一个能同时适用于这两个市场的交易系统,我们很难在这两个市场上让用美元数量表示的止损水平相等。
750美元的止损水平对玉米来说是合适的,但对日元来说可能太小了;3,000美元的止损水平对日元来说是合适的,但对玉米来说太大了。
atr指标止损止盈技巧1. 什么是ATR指标ATR指标是一种技术分析中常用的指标,全称为Average True Range,中文翻译为平均真实波动范围。
对于交易者而言,它的作用是测量市场波动的强度和方向,帮助他们更好地制定止损和止盈策略。
ATR指标通常用于波动性的交易市场,如外汇、期货等。
2. ATR指标的计算方法ATR指标的计算方法比较复杂,但对于交易者而言并不需要掌握其具体细节。
ATR指标的计算公式如下:TR = MAX(MAX(HIGH-LOW),ABS(HIGH-CLOSE_PREV),ABS(LOW-CLOSE_PREV)),ATR = SMA(TR,N)其中,TR是真实波动范围的计算公式,MAX代表取最大值,HIGH、LOW、CLOSE分别代表当日最高价、最低价和收盘价,CLOSE_PREV代表前一日的收盘价,ABS代表取绝对值。
SMA是简单移动平均线的计算公式。
ATR指标的计算周期一般是14日。
3. 如何利用ATR指标制定止损策略ATR指标可以帮助交易者更好地制定止损策略,以降低风险。
一种常见的策略是基于ATR指标的固定止损策略,具体操作方法如下:首先,计算当前市场的ATR值。
假设ATR值为100点。
然后,根据交易者的交易计划与风险承受能力,选择一个适当的止损比例,如2%。
则此时的固定止损点位应为:100点*2%=2点。
最后,根据当前交易的方向和进场点位,在该止损点位附近设置止损单。
如果市场价格触及止损点位,交易者将会自动被强制退出该交易,以限制亏损的幅度。
需要注意的是,随着市场波动性的变化,ATR指标的数值也会不断变化。
因此,交易者应该定期重新计算ATR值,并做出相应的调整。
4. 如何利用ATR指标制定止盈策略ATR指标还可以帮助交易者更好地制定止盈策略,以帮助他们保护利润。
下面是一种基于ATR指标的动态止盈策略:首先,计算当前市场的ATR值。
假设ATR值为100点。
然后,根据交易者的交易计划与风险承受能力,选择一个适当的止盈比例,如2%。
atr指标用法(二)ATR指标用法ATR指标全称为Average True Range,是一种常用的技术指标,用于衡量价格波动的幅度和趋势的强度。
下面列举了一些使用ATR指标的常见用法,并进行详细讲解。
1. 判断价格波动的幅度ATR指标可以衡量价格的波动性,根据ATR的数值可以判断价格的波动幅度。
通常情况下,ATR数值越大,价格波动的幅度越大;ATR数值越小,价格波动的幅度越小。
2. 确定止损位ATR指标可以作为确定止损位的依据。
通过将ATR乘以一个倍数,来确定止损位的位置。
一般而言,ATR的倍数越大,止损位越宽;ATR的倍数越小,止损位越窄。
这样可以根据价格波动的幅度来灵活调整止损位,防止损失过大。
3. 确定盈利目标ATR指标还可以用于确定盈利目标。
通过将ATR乘以一个倍数,来确定盈利目标的位置。
一般来说,ATR的倍数越大,盈利目标越高;ATR的倍数越小,盈利目标越低。
4. 判断趋势强度ATR指标可以用于判断价格的趋势强度。
当价格上涨时,若ATR指标数值也上涨,则说明趋势相对强势,交易者可以考虑持续跟随趋势进行交易;当价格上涨时,但ATR指标数值下跌,则说明趋势较弱,交易者需要小心可能的反转。
5. 寻找交易机会ATR指标还可以用于寻找交易机会。
当价格上涨且ATR指标上涨时,可能有上涨趋势的交易机会;当价格下跌且ATR指标上涨时,可能有下跌趋势的交易机会。
交易者可以根据这一信号来制定具体的交易策略。
这些是ATR指标的一些常见用法,通过灵活运用ATR指标,交易者可以更好地理解市场并做出相应的决策。
在实际应用中,还需要结合其他技术指标和自身的交易策略来进行分析和判断。
ATR棘轮止损指标A New Exit Strategy - The ATR Ratchet By Chuck LeBeauRecently I've been doing quite a bit of research on new systems for stock trading. The research is on behalf of a new hedge fund that will be starting later this year. The fund will be managed by Tan LeBeau LLC, the company that funded this research project. After some serious internal discussion about the advantages of keeping this new exit strategy a company secret, the LLC has graciously given me permission to share this discovery with our System Traders Club members. Here is a bit of background on how the new exit strategy came about.In the process of testing various exit strategies for our stock trading systems we found that we needed a profit-taking exit that performed somewhat along the lines of the Parabolic SAR but that could be made more flexible and easier to code and apply. We found that the Parabolic was hard to use because it was often on the opposite side of the market from our trades or it was starting from a point that was too low for what we wanted. After spending a great deal of time with the Parabolic we decided it was not helpful for the particular systems we were creating. As an alternative to the Parabolic exit we decided to test some new exit ideas based on my extensive work and experience with the Average True Range. After a great deal of tinkering and experimentation we were pleased to learn that the new exit strategy worked surprisingly well for profit taking and had many very useful features and applications. I decided to name this new exit strategy the "ATR Ratchet".The basic idea is quite simple. We first pick a logical starting point and then add daily units of ATR to the starting point to produce a trailing stop that moves consistently higher while also adapting to changes in volatility. The advantage of this strategy over the original Parabolic based exit is that when using the ATR Ratchet we have much more control of the starting point and the acceleration. We also found that the ATR based exit has a fast and appropriate reaction to changes in volatility that will enable us to lock in more profit than most conventional trailing exits.Here is an example of the strategy: After the trade has reached a profit target of at least one ATR or more, we pick a recent low point (such as the lowest low of the last ten days). Then we add some small daily unit of ATR (0.05 ATR for example) to that low point for each day in the trade. If we have been in the trade for 15 days we would multiply 0.05 ATRs by 15 days and add the resulting 0.75 ATRs to the starting point. After 20 days in the trade we would now be adding 1.0 ATRs (.05 times 20) to the lowest low of the last ten days. The ATR Ratchet is very simple in its logic but you will quickly discover that there are lots of moving parts that perform a lot of interesting and useful functions; much more than we expected.We particularly like this strategy because, unlike the Parabolic, the ATR Ratchet can easily be implemented any time we want during the trade. We can start implementing the stop the very first day of the trade or we can wait until some specific event prompts us to implement a profit-taking exit. I would suggest waiting to use the exit until someminimum level of profitability has been reached because, as you will see, this stop has a way of moving up very rapidly under favorable market conditions.The ATR Ratchet begins very quietly and moves up steadily each day because we are adding one small unit of ATR for each bar in the trade. However the starting point from which the stop is being calculated (the 10 day low in our example) also moves up on a regular basis as long as the market is headed in the right direction. So now we have a constantly increasing number of units of ATR being added to a constantly rising ten day low. Each time the 10-day low increases our ATR Ratchet moves higher so we typically have a small but steady increase in the daily stop followed by much larger jumps as the 10 day low moves higher. It is important to emphasize that we are constantly adding our daily acceleration to an upward moving starting point that produces a unique dual acceleration feature for this exit. We have a rising stop that is being accelerated by both time and price. In addition, the ATR Ratchet will often add substantial additional acceleration in response to increases in volatility during the trade.The acceleration due to range expansions is an important feature of the ATR Ratchet. Because markets often tend to show wider ranges as the trend accelerates the ATR will tend to expand very rapidly during our best profit runs. In a fast moving market you will typically find many gaps and large range bars. Because we are adding multiple units of ATR to our starting point, any increase in the size of the underlying ATR causes the stop to suddenly make a very large jump that brings it closer to the high point of the trade. If we have been in the trade for forty days any increase in the ATR will have a forty-fold impact on the cumulative daily acceleration. That is exactly what we want it to do. We found that when a market was making a good profit run the ATR Ratchet moved up surprisingly fast and did an excellent job of locking in open profits.Keep in mind that this exit strategy is a new one (even to us) so our experience and observations about it are still very limited. However I am going to discuss a few observations about the variables that might help you to understand and apply this exit successfully.Starting Price: One of the nice features about the ATR Ratchet is that we can start it any place we want. For example we can start it at some significant low point just as the Parabolic does. Or we can start it at a swing low, a support level, and a channel low or at our entry point minus some ATR unit. If we wait until the trade is fairly profitable we could start it at the entry point or even somewhere above our entry point. The possible starting points are unlimited; use your imagination and your logic to find a starting point that makes sense for your time frame and for what you want your system to accomplish. Our idea of starting the Ratchet from the x day low makes it move up faster than a fixed starting point (as in the Parabolic) because the starting point rises repeatedly in a strong market. If you prefer, you could just as easily start the Ratchet at something like 2 ATRs below the entry price and then the starting point would remain fixed. In this case the Ratchet would move up only as the result of accumulating additional time in the trade and as the result of possible expansions of the ATR itself.When to Start: We can very easily initiate the exit strategy based on time rather than price or combine the two ideas. For example, we can start the exit only after the trade has been open for at least 10 days and is profitable by more than one ATR. My general impression at this point is that it is best to implement the ATR Ratchet only after a fairly large profit objective has been reached. The ATR Ratchet looks like a very good profit taking exit but I suspect it will kick you out of a trade much too soon if you start it before the trade is profitable.As I mentioned, one of the things I like best about the ATR Ratchet is its flexibility and adaptability. Here is another idea on how to start it. We can start it after fifteen bars but we don't necessarily have to add fifteen ratchets. The logic for the coding would be to start the Ratchet after 15 bars in the trade but multiply the ATR units by the number of bars in the trade minus ten or divide the number of days in the trade by some constant before multiplying the ATR units. This procedure will reduce the number of ratchets, particularly at the beginning of the trade when the exit is first implemented. Play around with the ATR Ratchet and see what creative ideas you can come up with.Daily Ratchet Amount: After testing it the daily Ratchet amount we chose when we were first doing our research turned out to be much too large for our intended application. The large Ratchet amount (percentage of ATR) moved the stop up too fast for the time frame we wanted to trade. After some trial and error we found that a Ratchet amount in the neighborhood of 0.05 or 0.10 (5% or 10% of one 20-day average true range) multiplied by the number of bars the trade has been open will move the stop up much faster than you might expect.As a variation on this strategy the very small initial Ratchet can always be increased later in the trade once the profits are very high. We could start with a small Ratchet and then after a large amount of profit we could use a larger daily Ratchet increment. There are all sorts of interesting possibilities.ATR Length: As we have learned in our previous uses of ATR, the length that we use to average the ranges can be very important. If we want the ATR to be highly responsive to short term variations in the size of the range we should use a short length for the average (4 or 5 bars). If we want a smoother ATR with less reaction to one or two days of unusual volatility we should use a longer average (20 to 50 bars). For most of my work with the ATR I use 20 days for the average unless I have a good reason to make it more or less sensitive.Summary: We have just scratched the surface on our understanding of the possibilities and variations of the ATR Ratchet as a profit taking tool. We particularly like the flexibility it offers and we suspect that each trader will wind up using a slightly different variation. As you can see, there are many important variables to tinker with. Be sure to code the Ratchet so it gets plotted on a chart when your are first learning and experimenting with it. The ATR Ratchet is full of pleasant surprises and the plot on the chart will quickly teach you a great deal about its unusual characteristics.Be sure to let us know if you come up with any exciting ideas on how to apply it.Good luck and good trading.一种新的出口战略 - 通过查的ATR棘轮LeBeau先生最近我一直在做很对证券交易的新系统一些调查。