ACOUSTICS AND PERCEPTION OF SOUND IN EVERYDAY ENVIRONMENTS
- 格式:pdf
- 大小:1.51 MB
- 文档页数:9
The Mechanics of Acoustics and SoundRadiationAcoustics is a branch of physics that studies the properties and behavior of sound waves. It deals with the production, transmission, and reception of sound waves and their effects on physical objects and human perception. Sound radiation refers to the process by which sound waves are emitted from a sound source and propagate through a medium, such as air or water, to reach a listener or receiver.The mechanics of acoustics and sound radiation is a fascinating subject that has practical applications in many industries, including music, engineering, architecture, and telecommunications.1. Sound Waves and Their PropertiesSound waves are longitudinal waves that travel through a medium, such as air, at a speed determined by the medium's properties. Sound waves consist of compressions and rarefactions of the medium, which result in changes in pressure and density.The fundamental properties of sound waves include frequency, wavelength, amplitude, and phase. Frequency is the number of oscillations per second and determines the pitch of the sound. Wavelength is the distance between two adjacent points of the same phase, and determines the spatial extent of the sound wave. Amplitude measures the intensity or loudness of the sound, and is related to the amount of energy carried by the wave. Phase describes the relative position of two or more waves and determines the interference pattern of the sound.2. Sound Sources and RadiationSound sources can be natural or artificial and can produce sound waves over a range of frequencies and amplitudes. Examples of natural sound sources include the human voice, musical instruments, and animal calls. Examples of artificial sound sources include loudspeakers, sirens, and machinery.Sound radiation involves the transfer of energy from the sound source to the surrounding medium and the subsequent propagation of the sound wave through the medium. The properties of the medium, such as its density and elasticity, affect the speed and direction of the sound wave. Sound waves can be reflected, refracted, diffracted, and absorbed by obstacles in their path, which can affect the sound quality and directionality.3. Acoustic Measurements and AnalysisAcoustic measurements and analysis are essential tools for studying the properties and behavior of sound waves and for designing and optimizing sound systems. Some of the most common acoustic measurements include frequency response, sound pressure level, and reverberation time.Frequency response measures the range of frequencies that a sound system can reproduce and how accurately it reproduces them. Sound pressure level measures the intensity or loudness of the sound at a particular point in space and is measured in decibels (dB). Reverberation time measures the time it takes for a sound wave to decay by 60 dB after the sound source has stopped and reflects the acoustic properties of the space.4. Sound Control and DesignSound control and design are critical considerations in many industries, including architecture, engineering, and telecommunications. Acoustic design involves the careful design of a space or system to optimize its acoustic properties and minimize unwanted noise and interference.Sound control techniques include sound insulation, sound absorption, and sound reflection. Sound insulation involves the use of materials that prevent the transmission of sound waves through walls, floors, and ceilings. Sound absorption involves the use of materials that absorb sound waves and reduce their intensity and reflection. Sound reflection involves the strategic placement of reflective surfaces to optimize the directionality and quality of sound waves.ConclusionAcoustics and sound radiation are fascinating fields of study that have practical applications in many industries. Understanding the properties and behavior of sound waves, sound sources, and acoustic systems is essential for designing and optimizing sound systems and for creating optimal acoustic environments for listening, communication, and performance. Advances in acoustic technology have led to improvements in audio reproduction, noise reduction, and sound control, which have greatly enhanced the quality of life for people around the world.。
acoustics的形容词"Acoustics" 是声学的意思,指的是声音的产生、传播、控制和接收等方面的研究。
与"acoustics" 相关的形容词有:1.Acoustic(声学的):描述与声音有关的事物,例如acousticwaves(声波)、acoustic properties(声学特性)等。
2.Acoustic(音响的):与声音系统、音响设备或音响效果相关的,例如acoustic performance(音响性能)、acoustic environment(音响环境)等。
3.Acoustic(声音的):与声音特性、音色等相关的,例如acousticquality(声音质量)、acoustic characteristics(声音特性)等。
例句:1.Acoustic waves propagate through the air.•声波通过空气传播。
2.The concert hall was designed with excellent acousticproperties.•这个音乐厅的设计考虑到了优秀的声学特性。
3.The acoustic performance of the speaker system wasoutstanding.•这个音响系统的声音表现非常出色。
4.Scientists study the acoustic characteristics of differentmaterials.•科学家研究不同材料的声音特性。
5.In an acoustic environment, background noise canaffect concentration.•在一个音响环境中,背景噪音可能会影响集中注意力。
6.The acoustic quality of the recording was crystal clear.•录音的声音质量非常清晰。
fundamentals of acoustics中文版-回复点击[这里]( of acoustics中文版》原文。
引言:《fundamentals of acoustics中文版》是一本介绍声学基础知识的重要书籍。
本文将一步一步回答关于这本书的相关问题,帮助读者更好地了解声学的基础知识。
第一步:导论(Introduction)《fundamentals of acoustics中文版》的导论部分主要介绍了声学研究的背景和应用,以及声学的基本概念和研究方法。
声学是研究声音的传播、产生、接收和效果的学科,它涉及到物理学、工程学、心理学、计算机科学等多个学科的知识与方法。
第二步:声波的基本性质(Basic properties of sound waves)声波是一种机械波,通过物质传播的机械振动。
声波的主要性质包括频率、振幅、波长和速度。
频率是声波振动的频率,单位是赫兹;振幅是声波的强度,通常用分贝表示;波长是声波在介质中传播一个完整周期所需的距离,单位是米;速度是声波在介质中传播的速度,通常与介质的密度和刚度有关。
第三步:声学传感器(Acoustic sensors)声学传感器是一种用于测量和检测声波的设备。
常见的声学传感器包括麦克风、声纳和超声波传感器。
它们可以将声波转化为电信号或其他形式的信号,以便进一步处理和分析。
第四步:声音的感知和人类听觉(Perception of sound and human hearing)声音的感知是指人类对声波的接受和理解过程。
人类听觉是一种非常复杂的生理和心理过程,涉及到外耳、中耳、内耳和大脑的多个部分。
人类能够感知不同频率和振幅的声音,并且对声音的方向和位置有一定的判断能力。
第五步:声音的传播(Propagation of sound)声音通过振动的介质传播,主要通过压缩和稀疏的机制来传播。
声音传播的常见现象包括衍射、折射、干涉和多次反射。
声音的传播速度取决于介质的特性,例如空气中声速约为343米/秒。
关于听的英语单词Captivating the world through the art of listening, the English language offers a plethora of words that encapsulate the essence of what it means to truly 'hear'. From the moment we're born, we're surrounded by sounds that shape our experiences, and the English lexicon reflects this with words like 'echo', which reverberates the sounds we hear, and'whisper', a gentle sound that carries secrets. 'Acoustics'is the science behind the way sound travels and resonates, while 'auditory' pertains to anything related to the sense of hearing. 'Eavesdrop' is a verb that describes the act of secretly listening to others' conversations, a behavior that can be both intriguing and invasive. 'Resonate' is a powerful term that suggests a deep, emotional connection to the sounds we hear, while 'hearing' itself is the act of perceiving sound. 'Omnidirectional' describes a microphone that picks up sound from all directions, a testament to the comprehensive nature of listening. 'Aural' is another adjective thatrelates to the sense of hearing, often used in a more formal or technical context. The word 'sonorous' evokes the richness and fullness of sound, while 'deaf' is the state of not being able to hear. 'Cacophony' is a discordant mixture of sounds, the antithesis of the harmonious 'symphony', which is a melodious arrangement of musical sounds. 'Hearken' is an old-fashioned term that means to listen attentively, and'auditory canal' is the anatomical pathway for sound to reach the inner ear. 'Sonority' is the quality of a sound that is loud and clear, and 'soundproof' describes a space designedto prevent the passage of sound. 'Sibilant' refers to a hissing sound, as in the 's' in 'sibilant', and 'auditory hallucination' is a perception of sound without an external source. These words paint a vivid picture of the auditory world, inviting us to explore the depths and nuances of listening.。

acoustics翻译acoustics(音响学)是研究声音传播、声音产生和声音的物理特性的学科。
它涉及到声波在各种媒介中的传播、反射、折射、衍射和吸收等现象。
以下是一些关于acoustics的用法和中英文对照例句:1. The study of acoustics helps us understand how sound travels through different mediums. (音响学的研究帮助我们了解声音如何在不同的介质中传播。
)2. The acoustics of the concert hall were carefully designed to ensure optimal sound quality. (音乐厅的音响效果经过精心设计,以确保最佳的音质。
)3. The acoustics in this room are terrible. We need to add some sound-absorbing panels. (这个房间的音响效果很糟糕。
我们需要添加一些吸音板。
)4. Architectural acoustics focuses on designing spaces to enhance sound quality and reduce unwanted noise. (建筑音响学专注于设计空间,以提高声音质量并降低不必要的噪音。
)5. The acoustics of the cathedral are breathtaking. The sound echoes beautifully throughout the space. (大教堂的音响效果令人惊叹。
声音在整个空间中回荡得很美。
)6. The study of underwater acoustics is important for understanding marine life and monitoring oceanenvironments. (水下声学的研究对于了解海洋生物和监测海洋环境非常重要。
声学英文单词Acoustics, the science of sound, has always fascinated me. The way vibrations travel through the air, how our ears perceive them, and the impact they have on our emotions is nothing short of magical. As a music enthusiast, I've found that understanding the acoustics of a room can elevate the listening experience to an entirely new level.Take the word "echo," for instance. It's more than just a reflection of sound; it's a phenomenon that can make a space feel alive. In a grand hall or a canyon, an echo can stretch out a moment, giving it a sense of depth and space. It's the same principle that allows us to hear the grandeur in a cathedral or the haunting beauty in an empty room.Then there's "resonance," a term that describes how an object or space amplifies sound at certain frequencies. It's what gives a violin its rich, deep tones or a singer theability to fill a concert hall with just their voice. Resonance is the secret behind the power of music to stir our souls."Decibel" is a word that brings a sense of precision tothe world of sound. It measures the intensity of sound, allowing us to quantify the difference between a whisper anda roar. But it's not just about the numbers; decibels canalso tell us about the potential for damage. They remind usof the importance of protecting our hearing and the fragilityof our auditory world."Harmony" is a term that speaks to the beauty of sound. It's the blend of different notes working together to create a pleasing and coherent whole. In a piece of music, harmony can evoke a sense of peace or tension, joy or sorrow. It's the subtle interplay of sounds that can make a melody memorable and timeless.Lastly, "reverberation" is a word that captures the lingering quality of sound in a space. It's the way sound waves continue to bounce around even after the source has stopped. Reverberation can make a voice sound more powerful or a room feel more vast. It's the echo that outlasts the moment, the sound that stays with you long after the music has ended.These words, these concepts, they're more than just vocabulary. They're the language of an invisible world that shapes our reality. They're the tools we use to describe the indescribable, to quantify the immeasurable, and to understand the depths of our sensory experiences. Acoustics is a universe of sound, and each word is a star in its vast sky.。
Chapter 2 Phonetics1.The Phonic Medium of LanguageRelevant Language Use Observations and Questions to Ponder over1) List different media by which human beings use for dailycommunication.2) Based on your observations and experiences, of the two media,speech and writing, which one do you use more frequently in your daily communication and in what situations do you choose one medium over the other?1)Which of the media enjoys a longer history, speech or writing?2)Which of the media do you think is the major medium by which you acquireyour mother tongue, speech or writing?● Summaries to Make and Linguistic Viewpoints to LearnSpeech and writing are the two media used by natural languages as vehicles for communication. Linguists believe that of the two media of language, speech is more basic than writing mainly for the following three reasons:1) In linguistic evolution, speech is prior to writing. The writing system of anylanguage is the later invention of its users to record speech.2) In everyday communication, speech plays a greater role than writing in terms of theamount of information conveyed. It is only in the situation where speech is not possible for communication that we use the medium of writing as something supplementary in our daily communication.3) Speech is always the way in which every native speaker acquires his mothertongue.●Definitions to ClarifyPhonic medium: It is a term used to refer to the speech sounds in human languages.2. Phonetics2.1 What is Phonetics?Relevant Language Use Observations and Questions to Ponder over1) When you communicate with others orally, a message is producedby our speech organs in the form of sounds, transmitted through acertain physical means and perceived by the hearer. What do you thinkare the basic contents involved in the study of speech sounds?2) Why should we study how humans produce speech sounds, how speech soundstravel in the air and how they are perceived by hearers?● Summaries to Make and Linguistic Viewpoints to LearnPhonetics studies speech sounds according to their production in the vocal organs (articulatory phonetics) from the speaker’s point of view, their physical properties (acoustic phonetics) from the way sounds travel and the physical means by which sounds are transmitted, or their effect on the ear (auditory phonetics) from the hearer’s point of view.Articulatory phonetics is general, descriptive and classificatory. It is general, because it studies all the speech sounds in all human languages. It is descriptive because it describes how speech sounds are produced. It is classificatory, because it involves the classification of speech sounds into different categories, such as consonants and vowels.Auditory phonetics focuses on the perception of sounds or the way in which sounds are heard and interpreted. We are in fact dealing with two distinct operations which, however, are closely interrelated and influence each other: on the one hand we can talk about audition proper, that is the perception of sounds by our auditory apparatus and the transforming of the information into a neural sign and its sending to the brain and, on the other hand, we can talk about the analysis of this information by the brain which eventually leads to the decoding of the message, the understanding of the verbal message.When discussing the auditory system we can consequently talk about its peripheral and its central part, respectively.Acoustic phonetics is a subfield of phonetics which deals with acoustic aspects of speech sounds. Acoustic phonetics investigates properties like the amplitude of a waveform, its duration, its fundamental frequency, or other properties of its frequency spectrum, and the relationship of these properties to other branches of phonetics (e.g. articulatory or auditory phonetics), and to abstract linguistic concepts like phones, phrases, or utterances.The study of acoustic phonetics was greatly enhanced in the late 19th century by the invention of the Edison phonograph. The phonograph allowed the speech signal to be recorded and then later processed and analyzed. By replaying the same speech signal from the phonograph several times, filtering it each time with a different band-pass filter, a spectrogram of the speech utterance could be built up.A thorough knowledge of how vowels and consonants are generated remains essential for successful assessment and remediation of articulatory and phonological disorders. Although contemporary phonological theories have provided new ways of viewing assessment and treatment of these disorders, knowledge of the speech sounds’ production features secures a firm basis for utilizing such procedures. Without this knowledge, phonological process analysis, for example, is impossible. A thorough knowledge of phonetics can help us understand how we perceive sounds so that we can efficiently interpret messages sent by others. Finally, the findings in the study of phonetics are widely used in person-machine communication, speech synthesis, speaker identification, voice prints analysis, voice identification and voice lineups, voice imitation and impersonation, speech recognition, speech production and perception disorders, correction of speech disorders, second language acquisition, etc..● Definitions to ClarifyPhonetics: Phonetics is defined as the study of the phonic medium of language; it studies speech sounds: the way in which they are produced (uttered, articulated), the way in which they are perceived, and their physical characteristics.Articulatory phonetics:Articulatory phonetics studies how speech sounds are produced, how they are categorized or classified.Auditory phonetics:Auditory phonetics focuses on the perception of sounds or the way in which sounds are heard and interpreted.Acoustic phonetics:It studies physical properties of speech sounds from the way sounds travel and the physical means by which speech sounds are transmitted.2.2 Organs of SpeechRelevant Language Use Observations and Questions to Ponder over1) What are the major organs of speech in our mouth which areinvolved in the production of speech sounds? Can you name some ofthese speech organs?2) When we close our mouth, letting air-stream coming out of ournoses, what sounds can be produced? Give some examples.3) Put your finger on your larynx and feel the effect when you produce each pair of sounds t/d, p/b and s/z, what result have you found?● Summaries to Make and Linguistic Viewpoints to LearnOur speech organs (the articulatory apparatus) are contained in three important areas or cavities: the oral cavity (mouth), the nasal cavity (nose) and the pharyngeal cavity (throat).2.2.1 The Oral CavityThe oral cavity is the area from the back of the throat to the mouth. The major parts of the oral cavity that are used in speech production are the uvula, the velum, the tongue, the hard palate, the alveolar ridge, the teeth, and the lips. The uvula is that fleshy blob that hangs down in the back of the throat. The velum is the soft palate, and the alveolar ridge is a mass of hard cartilage behind the teeth.The picture on the left shows thepositions of these major parts of theoral cavity. The oral cavity is one ofthe most important parts of the vocaltract. Its size, shape and acoustics canbe varied by the movements of thepalate, the tongue, the lips, and theteeth. Especially the tongue is veryflexible, the tip and the edges can bemoved independently and the entiretongue can move forward, backward,up and down. The lips control thesize and shape of the mouth openingthrough which speech sound isradiated.2.2.2 The Nasal CavityThe nasal cavity and oral cavity are connected with each other. Nasalized sounds are produced when we close our mouths so that the air coming from our lungs can only exit through our noses. If we allow the air to exit only through our months by drawing back the soft part of the roof of the mouth, the velum, the sounds produced are not nasalized.2.2.3 Pharyngeal CavityPharyngeal cavity(throat) consists of the area above the larynx and below the uvula. In the pharyngeal cavity, there are such speech organs as vocal cords. When speaking, the air flow is forced through the glottis between the vocal cords and the larynx to the three main cavities. The V-shaped opening between the vocal cords, called the glottis, is the most important sound source in the vocal system. The vocal cords may act in several different ways during speech. The most important function is to modulate the air flow by rapidly opening and closing, causing vibration from which vowels and voiced consonants are produced. With stop consonants the vocal cords may act suddenly from a completely closed position in which they cut the air flow completely, to totally open position producing a light cough or a glottal stop. On theother hand, with unvoiced consonants, such as /s/ or /f/, they may be completely open. An intermediate position may also occur with for example phonemes like /h/.● Definitions to ClarifyVoicing: Vibration of the vocal cords results in a quality of speech sounds called voicing.Voiceless sounds: When the vocal cords are drawn wide apart, letting air go through without causing vibration, the sounds produced in such a condition are voiceless , such as [t], [s], and [f] in English.Voiced sounds: The speech sounds produced with the vibration of the vocal cords are voiced sounds. All vowels and some consonants such as [b], [z], and [m] are voiced. 2.3 Classification of English Speech Sounds2.3.1 Classification of English ConsonantsRelevant Language Use Observations and Questions to Ponder over1) Observe how the air-stream is obstructed when thefollowing sounds are pronounced: Put your choice in the formof a tick in the following column:2) Work with your desk-mate to observe where the air-stream is obstructed when the following sounds are pronounced. Write your answers in the following table:● Summaries to Make and Linguistic Viewpoints to LearnEnglish consonants are usually classified by the manner of articulation and by the place of articulation. When we approach the classification of English consonants from the manner of articulation, we mainly look at how the air-stream is obstructed when we produce a consonant. When we group the consonants according to the place of articulation, we mainly look at where the air-stream is obstructed in the production of a consonant.According to the manner of articulation, English consonants are classified into plosives or stops: [p] [b] [t] [d]; fricatives: [f] [v] [s] [z] [ ; affricates: [t ] [d ]; nasals: [m] [n] [ ; liquids (laterals): [l] [r]; and semivowels (glides): [w] [j].By the place of articulation, English consonants can be classified into bilabials: [p] [b] [m] [w]; labiodentals: [f] [v]; dental: ; alveolars: [t] [d] [s] [z] [n] [l] [r]; palatals: [ [t ] [d ] [j]; velars: [k] [g] [ and glottal: [h].With these principles, we can describe the phonetic features of a consonant and see how a consonant is produced. For example:[t]: voiceless, alveolar, plosive[d]: voiced, alveolar, plosive[t voiceless, palatal, affricate[d voiced, palatal, affricateSome of the other consonants are described as follows:● Definitions to ClarifyConsonants: The consonants are the speech sounds in the production of which the air coming from the lungs is obstructed in one way or another.Plosives (stops): They are the consonants in the production of which the obstruction to the air-stream is complete and the suddenly released with an audible sound.Fricatives: They are the consonants in the production of which the obstruction to the air-stream is incomplete and the air-stream is forced to come out of a narrow passage with friction.Affricates: They are the consonants in the production of which the obstruction to the air-stream is complete and then it is slowly released with friction.Nasals: Thy are the consonants in the production of which the soft palate is lowered, allowing the air-stream to pass through the nasal passage.Liquids (laterals): They are the consonants in the production of which the air-stream is obstructed, but allowed to pass between the tip or the sides of the tongue and the roof of the mouth.Semivowels (glides): They are the consonants in the production of which the obstruction is such that the air-stream comes out of a narrower passage between the lips or between the tongue and the hard palate.Bilabial: They are the consonants in the production of which the obstruction is formed by the upper and the lower lips.Labiodental: They are the consonants in the production of which the obstruction is created by the upper teeth and lower lip.Dental: the consonants in the production of which the obstruction is created by the tip of the tongue and the upper teeth.Alveolar: They are the consonants in the production of which the obstruction is made between the tip of the tongue and the upper teeth-ridge.Palatal: They are the consonants in the production of which the obstruction is formed between the back of the tongue and the hard palate.Velar: They are the consonants in the production of which the obstruction is created between the back of the tongue and the soft palate.Glottal: They are the consonant in the production of which the obstruction is momentarily made by the bringing together of the vocal cords.2.3.2 Classification of English VowelsRelevant Language Use Observations and Questions to Ponder over1)Compare the following vowels in Column A with Vowelsin Column B to find their differences:2)Work with your desk-mate to observe the shape of the lips when you pronounce the following sounds and note down in the diagram which vowels are rounded and which ones are unrounded:3) Observe the openness of the mouth when you pronounce the following vowels.● Summaries to Make and Linguistic Viewpoints to LearnVowel sounds are classified according to the length of the vowels, and the openness of the mouth, the shape of the lips, and the position of the tongue which is raised the highest.According to the length of the vowels, English vowels are of the two groups: long vowels such as [i:] [ :] [ : ] [u:] [ɑ:]and short vowels[i] [e] [ ] [ ] [ ] [u], etc. According to the openness of the mouth, English vowels are divided into four subcategories:(1) close vowels: [i:] [i] [u:] and [u](2) semi-close vowels: [e] and [ :](3) semi-open vowels: [ ] and [ : ](4) open vowels: [ ] [ ] [ ] [ ] and [ : ].According to the shape of the lips, English vowels are grouped into rounded vowels and unrounded vowels: All the back vowels in English are rounded except [ɑ:]. All the front vowels and central vowels in English are unrounded.According to the position of the tongue in the mouth that is raised the highest, English vowels are classified into front vowels, central vowels and back vowels: Front vowels are the ones in the production of which the front part of the tongue is raised the highest such as [i:] [i] [e] [ ] [ ]; When the central part of the tongue maintains its highest position, the vowels thus produced are central vowels suchas [ :] [ ] and [ ]; if the back of the tongue is held the highest, the vowels thus produced are back vowels such as [u:] [u] [[ :] [ ] and [ :].With these criteria, we can describe the phonetic features of English vowels, for example:[e]: short, front, semi-close, unrounded[i:]: long, front, close, unrounded[ ]: short, front, open, unrounded[● Definitions to ClarifyVowels: Vowels are the speech sounds in the pronunciation of which, the air that comes from the lungs meets with no obstruction of any kind in the throat, the nose, or the mouth.Exercises1.Define the following terms:Phonic medium; articulatory phonetics; phonetics; vowels; consonants; voicing 2.How is articulatory phonetics different from acoustic phonetics and auditoryphonetics?3.How do we classify vowels?4.How do we classify consonants?5.Write out the phonetic features of the following consonants and vowels:/t//p//m//z//u//i//æ/[ ]6.Give the phonetic symbol for each of the following sound descriptions:voiced bilabial stopvoiceless alveolar fricativevoiced velar stopvoiceless palatal affricateshort front open unroundedFurther ReadingsJackson, Howard. Analyzing English: an introduction to descriptive linguistics. New York: Pergamon Press Ltd. 1982.孟宪忠(编著).英语语音学(第三版).上海:华东师范大学出版社.2006.张凤桐.英国英语语音学和音系学(第3版).成都:四川大学出版社.2002.罗奇(英).英语语音学与音系学使用教程. 北京: 外语教学与研究出版社. 2000.。

简要英语知识框架English is a global language spoken by millions of people around the world. It is the primary language of communication in various fields, including business, education, science, and international relations. Understanding the fundamental aspects of the English language is crucial for individuals seeking to improve their language proficiency and effectively communicate in diverse settings. This essay presents a brief framework outlining the key components of English knowledge.Phonetics and PhonologyPhonetics and phonology are the study of the sounds of a language and how they are produced and organized. In English, phonetics involves the examination of the articulation, acoustics, and perception of speech sounds, known as phonemes. Phonology, on the other hand, focuses on the systematic patterns and rules governing the use of these sounds in a language. Mastering the pronunciation of English phonemes, such as vowels, consonants, and diphthongs, is essential for clear and effective communication.GrammarGrammar is the set of rules that govern the structure of a language. It encompasses the principles and patterns that determine how words are combined to form meaningful sentences. In English, grammar covers various aspects, including parts of speech (nouns, verbs, adjectives, adverbs, etc.), sentence structure (subject-verb-object, clauses, phrases), verb tenses and aspects, and the use of articles, prepositions, and conjunctions. Understanding and applying English grammar correctly is crucial for producing well-structured and comprehensible written and spoken communication.VocabularyVocabulary refers to the collection of words that make up a language. English has a vast and diverse vocabulary, with a significant number of words derived from various sources, such as Latin, Greek, and other languages. Mastering English vocabulary involves not only learning the meanings of individual words but also understanding their usage, connotations, and relationships to other words. Developing a strong vocabulary is essential for effective reading, writing, listening, and speaking in English.SemanticsSemantics is the study of the meaning of words, phrases, and sentences. It examines how language conveys meaning and how words and expressions are interpreted within a specific context. InEnglish, semantics involves understanding the denotative (literal) and connotative (implied) meanings of language, as well as the use of figurative language, such as metaphors, idioms, and colloquialisms. Proficiency in semantic understanding enables effective communication and interpretation of the intended meaning in various situations.PragmaticsPragmatics is the study of how language is used in context and the ways in which meaning is conveyed through the appropriate use of language. In English, pragmatics encompasses aspects such as speech acts (e.g., requests, promises, apologies), politeness conventions, and the influence of cultural and social factors on language use. Understanding pragmatic principles is crucial for engaging in appropriate and effective communication in various social and professional settings.Discourse AnalysisDiscourse analysis examines the structure and organization of language beyond the sentence level. It focuses on the ways in which language is used to create coherent and cohesive texts, both spoken and written. In English, discourse analysis involves studying the use of cohesive devices, such as pronouns, conjunctions, and transition words, as well as the overall structure and flow of a text or conversation. Developing discourse analysis skills enhances one'sability to comprehend and produce coherent and well-structured English texts.Language Variation and ChangeEnglish, like any other language, exhibits variations in terms of regional dialects, social registers, and historical development. Understanding language variation and change is essential for navigating the diverse landscape of English usage. This includes recognizing differences in pronunciation, vocabulary, and grammatical structures across various English-speaking regions, as well as the evolution of the language over time. Awareness of language variation and change allows for more effective communication and adaptability in different English-speaking contexts.ConclusionIn conclusion, this essay has presented a brief framework outlining the key components of English knowledge. From the foundational aspects of phonetics and phonology to the nuances of pragmatics and discourse analysis, mastering these various elements of the English language is crucial for achieving proficiency and effective communication. By understanding and applying this framework, individuals can enhance their language skills, engage in more meaningful interactions, and navigate the dynamic and diverse world of the English language.。
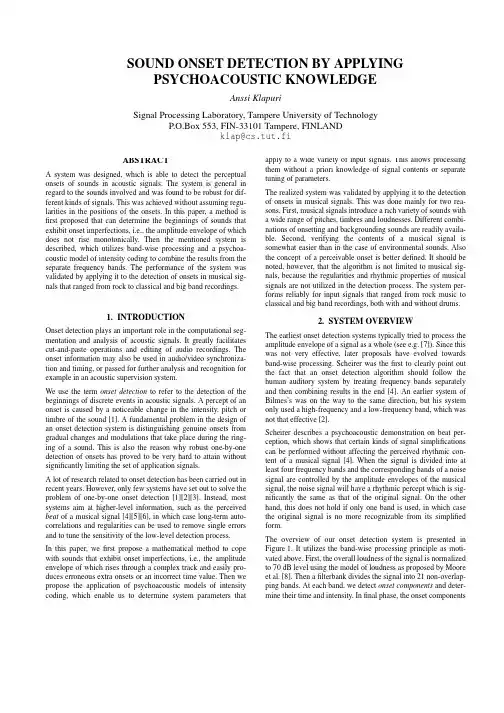
ABSTRACTA system was designed, which is able to detect the perceptual onsets of sounds in acoustic signals. The system is general in regard to the sounds involved and was found to be robust for dif-ferent kinds of signals. This was achieved without assuming regu-larities in the positions of the onsets. In this paper, a method is first proposed that can determine the beginnings of sounds that exhibit onset imperfections, i.e., the amplitude envelope of which does not rise monotonically. Then the mentioned system is described, which utilizes band-wise processing and a psychoa-coustic model of intensity coding to combine the results from the separate frequency bands. The performance of the system was validated by applying it to the detection of onsets in musical sig-nals that ranged from rock to classical and big band recordings.1. INTRODUCTIONOnset detection plays an important role in the computational seg-mentation and analysis of acoustic signals. It greatly facilitates cut-and-paste operations and editing of audio recordings. The onset information may also be used in audio/video synchroniza-tion and timing, or passed for further analysis and recognition for example in an acoustic supervision system.We use the term onset detection to refer to the detection of the beginnings of discrete events in acoustic signals. A percept of an onset is caused by a noticeable change in the intensity, pitch or timbre of the sound [1]. A fundamental problem in the design of an onset detection system is distinguishing genuine onsets from gradual changes and modulations that take place during the ring-ing of a sound. This is also the reason why robust one-by-one detection of onsets has proved to be very hard to attain without significantly limiting the set of application signals.A lot of research related to onset detection has been carried out in recent years. However, only few systems have set out to solve the problem of one-by-one onset detection [1][2][3]. Instead, most systems aim at higher-level information, such as the perceived beat of a musical signal [4][5][6], in which case long-term auto-correlations and regularities can be used to remove single errors and to tune the sensitivity of the low-level detection process.In this paper, we first propose a mathematical method to cope with sounds that exhibit onset imperfections, i.e., the amplitude envelope of which rises through a complex track and easily pro-duces erroneous extra onsets or an incorrect time value. Then we propose the application of psychoacoustic models of intensity coding, which enable us to determine system parameters that apply to a wide variety of input signals. This allows processing them without a priori knowledge of signal contents or separate tuning of parameters.The realized system was validated by applying it to the detection of onsets in musical signals. This was done mainly for two rea-sons. First, musical signals introduce a rich variety of sounds with a wide range of pitches, timbres and loudnesses. Different combi-nations of onsetting and backgrounding sounds are readily availa-ble. Second, verifying the contents of a musical signal is somewhat easier than in the case of environmental sounds. Also the concept of a perceivable onset is better defined. It should be noted, however, that the algorithm is not limited to musical sig-nals, because the regularities and rhythmic properties of musical signals are not utilized in the detection process. The system per-forms reliably for input signals that ranged from rock music to classical and big band recordings, both with and without drums.2. SYSTEM OVERVIEWThe earliest onset detection systems typically tried to process the amplitude envelope of a signal as a whole (see e.g. [7]). Since this was not very effective, later proposals have evolved towards band-wise processing. Scheirer was the first to clearly point out the fact that an onset detection algorithm should follow the human auditory system by treating frequency bands separately and then combining results in the end [4]. An earlier system of Bilmes’s was on the way to the same direction, but his system only used a high-frequency and a low-frequency band, which was not that effective[2].Scheirer describes a psychoacoustic demonstration on beat per-ception, which shows that certain kinds of signal simplifications can be performed without affecting the perceived rhythmic con-tent of a musical signal [4]. When the signal is divided into at least four frequency bands and the corresponding bands of a noise signal are controlled by the amplitude envelopes of the musical signal, the noise signal will have a rhythmic percept which is sig-nificantly the same as that of the original signal. On the other hand, this does not hold if only one band is used, in which case the original signal is no more recognizable from its simplified form.The overview of our onset detection system is presented in Figure1. It utilizes the band-wise processing principle as moti-vated above. First, the overall loudness of the signal is normalized to 70dB level using the model of loudness as proposed by Moore et al. [8]. Then a filterbank divides the signal into 21 non-overlap-ping bands. At each band, we detect onset components and deter-mine their time and intensity. In final phase, the onset componentsSOUND ONSET DETECTION BY APPLYING PSYCHOACOUSTIC KNOWLEDGEAnssi KlapuriSignal Processing Laboratory, Tampere University of Technology P.O.Box 553, FIN-33101 Tampere, FINLANDklap@cs.tut.fiare combined to yield onsets.Since we use psychoacoustic models both in onset component detection, in its time and intensity determination, and in combin-ing the results, it is important to use a filterbank which can pro-vide input to the models. Therefore, we choose a bank of nearly critical-band filters which covers the frequencies from 44Hz to 18kHz. The lowest three among the required 21 filters are one-octave band-pass filters. The remaining eighteen are third-octave band-pass filters. All subsequent calculations can be done one band at a time. This reduces the memory requirements of the algorithm in the case of long input signals, assumed that parallel processing is not desired.The output of each filter is full-wave rectified and then decimated by factor 180 to ease the following computations. Amplitude envelopes are calculated by convolving the band-limited signals with a 100ms half-Hanning (raised cosine) window. This window performs much the same energy integration as the human auditory system, preserving sudden changes, but masking rapid modula-tion [9][4].3. CALCULATION OF ONSET COMPONENTS 3.1 Onset Component DetectionSeveral algorithms for picking potential onset candidates from an amplitude envelope function have been presented in the literature [5][6][2][4]. Despite the number of variants, practically all of them are based on the calculation of a first order difference func-tion of the signal amplitude envelopes and taking the maximum rising slope as an onset or an onset component.In our simulations, it turned out that the first order difference function reflects well the loudness of an onsetting sound, but its maximum values fail to precisely mark the time of an onset. This is due to two reasons. First, especially low sounds may take some time to come to the point where their amplitude is maximally ris-ing, and thus that point is crucially late from the physical onset of a sound and leads to an incorrect cross-band association with the higher frequencies. Second, the onset track of a sound is most often not monotonically increasing, and thus we would have sev-onsetcompo-nentssource onsets1221Scale signallevel to70dBCombine results to yield onsetsBand-wise processing (see Fig. 1b)Figure 1a.System overview.Amplitudeenvelope extractionOnset component detectionDetermine component’s time and intensityFigure 1b.Processing at each frequency band.Filterbankeral local maxima in the first order difference function near the physical onset (see plots with a dashed line in Figure 2).We took an approach that effectively handles both of these prob-lems. We begin by calculating a first order difference function,where A (t ) denotes the amplitude envelope function.D (t ) is set to zero where signal is below minimum audible field. Then we divide the first order difference function by the amplitude enve-lope function to get a first order relative difference function W ,i.e., the amount of change in relation to the signal level. This is the same as differentiating the logarithm of the amplitude envelope.We use the relative difference function W (t ) both to detect onset components and to determine their time. This is psychoacousti-cally relevant, since perceived increase in signal amplitude is in relation to its level, the same amount of increase being more prominent in a quiet signal. According to Moore, the smallest detectable change in intensity is approximately proportional to the intensity of the signal [10]. That is,∆I /I , the Weber fraction, is a constant. This relationship holds for intensities from about 20dB to about 100dB above the absolute threshold. The function is equivalent to W (t ), since the frequency f in is reduced in the division. Thus we detect onset components by a simple peak picking operation, which looks for peaks above a global threshold T det in the relative difference func-tion W (t ).The relative difference function effectively solves the abovemen-tioned problems by detecting the onset times of low sounds ear-lier and, more importantly, by handling complicated onset tracks,since oscillations in the onset track of a sound do not matter in relative terms after its amplitude has started rising. To clarify this,we plotted the absolute and relative difference functions of the onset of a piano sound in Figure 2. Both of the benefits discussed can be seen clearly.3.2 Intensity of an Onset ComponentSimultaneously occurring sounds combine by a linear summation.In determining the intensity of an already detected onset compo-nent, we can assume the level of backgrounding sounds to be3303403503603703803904004104204300123456Dashed line:(A (t ))Solid line:(log(A (t )))where A (t ) denotes the amplitude enve-lope function.ddt ----ddt----654321Figure 2.Onset of a piano sound. First order absolute (dashed) and relative (solid) difference functions of the amplitude envelopes of six different frequency bands.D t ()ddt----A t ()()=W t ()ddt----A t ()()log ()=∆I t ()I t ()⁄I t ()A t ()f ⋅=momentarily steady and take the increase in level to be due to the onsetting sound(s). Thus the asked intensity can be picked from the first order difference function D(t), multiplied by the band center frequency f B.The intensity is needed later when onset components are combined to yield onsets of the overall signal. An appropriate point in time to pick the intensity from D(t) is not as early as where the onset was determined to occur. Instead, we scan forward up to the point where amplitude envelope starts decreasing and determine the intensity at the point of maximum slope, i.e., at the maximum value of D(t) between the onset and the point where amplitude stops increasing.After intensities has been determined for all onset components atthe band, we check them through and drop out components that are closer than 50ms to a more intense component. Remaining ones are accepted.4. COMBINING THE RESULTS FROM THE BANDS In the final phase we combine onset components from separate bands to yield onsets of the overall signal. For this purpose, we implemented the model of loudness as proposed by Moore, Glas-berg and Baer [8]. Input to our implementation is a vector of sound intensities at third-octave bands between 44Hz and 18kHz, from which the program calculates the loudness of the signal in phons. To optimize the computational efficiency of the procedure, we slightly simplified the model by making the shape of the excitation pattern, i.e., the intensity spread between adja-cent critical bands independent from sound pressure level. This accelerated the computations remarkably, but did not make a sig-nificant difference to the estimated loudness values for the sound intensity levels we are using.The onsets of the overall signal are calculated as follows. First the onset components from different bands are all sorted in time order, and are regarded as sound onset candidates hereafter. Then each onset candidate is assigned a loudness value, which is calcu-lated by collecting onset components in a 50ms time window around the candidate and feeding their intensities to the corre-sponding frequency bands of the loudness model of Moore et al. Since most candidates have only a couple of contributing onset components at different bands, we must use minimum level, or background noise level for the other bands in the input of the model. Repeating this procedure to each onset candidate yields a vector of candidate loudnesses as a function of their times, as illustrated in Figure3 for a popular music signal.Onset loudnesses that were estimated using the abovementined procedure corresponded very well to the perceived loudnesses of the onsets in verificative listening tests. It turned out that a robust detection of onsets in very diverse kinds of signals can now be achieved by a simple peak picking operation, which looks for onset candidates above a global threshold value Tfinal. We drop out onset candidates whose loudness falls below the threshold. Then we also drop out candidates that are too close (50ms) to a louder candidate. Among equally loud but too close candidates, the middle one (median) is chosen and the others are abandoned. The remaining onset candidates are accepted as true ones. A good value for Tfinal was found to be 25dB for signals, whose average loudnesses had been normalized to 70dB level.5. V ALIDATION EXPERIMENTSThe presented procedure was verified by testing its performancein detecting onsets in musical signals. The signals were selectedto comprise a large variation of musical instruments and a wide dynamic and pitch range. Signals both with and without drums were included. Another goal was to include representative excerpts from different musical genres, ranging from jazz and rock to classical and big band music.Approximately ten second excerpts were sampled from each per-formance. These periods were carefully inspected and their onset times were marked. The excerpts were then feeded to the onset detection system and its results were compared to the manual transcription. All simulation cases were computed using the very same set of parameter values and thresholds, without separate tai-loring for each simulation case. The algorithm itself was as explained above. Higher-level rhythmic properties and regulari-ties of musical signals were not utilized in the detection.It is interesting to note that the limitations of our detection system resemble those of human perception. We define a pseudo-onset tobe a sound beginning, which undisputably exists in a signal, but cannot be detected by a human listener if the signal is not pre-sented in short segments and several times. Since objective listen-ing test could not be arranged, we regard undetected pseudo-onsetas errors, too. It turned out that the detection of some pseudo-onsets could not be achieved without giving rise to several erro-neous extra onsets that are due to gradual changes and modula-tions during the ringing of sounds.Onset detection results for ten different musical signals are sum-marized in Table 1. The total number of onsets, number of unde-tected onsets and the number of erroneous extra onsets are given.A measure of correctness in the rightmost column is calculated as%.A more detailed discussion of each case follows.Chopin’s classical piano etude (op. 25, no. 4) was a trivial case.Still three onsets fell below threshold because the notes were low pitched, played softly and masked by other notes.Al Di Meola’s‘Orient Blue’ represents a much more difficult case. The piece is polyphonic and employs the whole dynamic and pitch range ofthe acoustic guitar. Shortest inter-note intervals are only a fif-teenth of a second. Good results were achieved partly because of00.51 1.52 2.5x 10⁵ 10152025303540455055/share/SpeechDat/klap/grusin01.wav : 1..220000loudness (dB)454035302520Figure 3.The loudness of onsets as a function of their time.The genuine onsets can now be quite easily discerned.correcttotal undetected–extra–total------------------------------------------------------------------100⋅=the absense of noise and other instruments.Police ’s ‘It’s Alright for You’ is from rock music genre, domi-nated in loudness by singing, electric guitars and drums. Onset detection is a success and resembles the results that were derived with other rock-pieces. At some moments singing produced dou-ble-onsets for phonem combinations like “-ps-”, where both p and s produce an onset. All of these occurred inside the 50ms time window, however, and were therefore fused.U2 is an electric gui-tar rif, taken from the band’s performance of ‘Last Night on Earth’. The excerpt is played with distorted sound, without accompanying instruments. This case illustrates that even ambig-uos situations, i.e., rough sounds, can be handled.Grusin ’s ‘Punta del Soul’ is classified to fusion jazz, but the selected excerpt resembles mostly popular music. Various percussions included were detected without trouble.Miles Davis ’s ‘So What’ introduces a selection of jazz band instruments: a trumpet, tenor and alto saxophones, piano, plucked double-bass and gentle drums. Both brass instrument onsets and soft pluckings of the double bass were consistently detected.Glen Miller ’s ‘In the Mood’ is dominated by big band’s brass instru-ments of the performing orchestra. All undetections occurred in a clarinet melody, which was partly masked by louder instruments.Bach ’s Brandenburg Concerto was sampled from the performance of Munich Chamber Ensemble, which comprises strings, wood-winds and brass instruments. It is worth notice that onsets were detected even at moments where strings alone were carrying the rhythm and played tying consecutive notes to each other.As a sharp contrast to the robust detections, all symphony orches-tra performances turned out to be resolved very poorly.Vivaldi ’s ‘The Four Seasons’ and Beethoven ’s Symphony No. 5 are given as examples in Table 1. The clear discrepancy with human per-ception is not due to the type of instruments involved, since they were detected well in smaller ensembles. Instead, two causes are supposed. Firstly, individual physical sound sources can no more be followed in a symphony orchestra, but resulting onsets derive from several sources and are smoothed. Secondly, it was revealed by a certain hammond organ solo that a strong amplitude modula-tion at the middle frequencies confuses the system. It seems that the human auditory system has a special ability to ignore even a very loud amplitude modulation if it is inconsistent, and to con-Table 1: Summary of onset detection results.signalworth notice in contentsonsets in total unde-tected extracorrect (%)Chopin acoustic piano 593–95AldiMeola acoustic guitar 625192Police singing, el.guitar, drums 494190U2el. guitar rif, distorted 191284Grusin piano, percussion, drums 513–94MDavis brasses, double-bass 342191Miller big band 465187Bach chamber ensemble 513192Vivaldi symphony orchestra 3371048Beethoven symphony orchestra30–287centrate on frequencies where structure is found.6. CONCLUSIONSWe first discussed problems that arise in the one-by-one detection of sound onsets. Then a system was described, which builds upon the use of relative difference function and application of the psy-choacoustic models of intensity coding. This was done in the framework of the band-wise processing idea. Experimental results show that the presented system exhibits a significant gen-erality in regard to the sounds and signal types involved. This was achieved without higher-level logic or a grouping of the onsets.The system introduces only two thresholds that need to be experi-mentally found, i.e., that are not deduced from psychoacoustic metrics. These thresholds are common to all input signals.One of the shortcomings of our method lies in its inability to deal with a strong amplitude modulation which is met in classical ensembles and in certain instrumental sounds. In general, the pro-posed system was well able to discern between genuine onsets and gradual changes and modulations in the sounds themselves.In the case of musical signals, an additional higher-level analysis would still significantly improve the accuracy of the system.7. REFERENCES[1] Moelants D., Rampazzo C. “A Computer System for theAutomatic Detection of Perceptual Onsets in a Musical Sig-nal”. In Camurri, Antonio (Ed.). “KANSEI, The Technology of Emotion ”, pp. 140–146. Genova, 1997.[2] Bilmes J. “Timing is of the Essence: Perceptual and Computa-tional Techniques for Representing, Learning, and Reproduc-ing Expressive Timing in Percussive Rhythm”. MSc thesis,Massachusetts Instute of Technology, 1993.[3] Schloss A. ”On the Automatic Transcription of PercussiveMusic — From Acoustic Signal to High-Level Analysis”.Ph.D. thesis, Stanford University, 1985. Report STAN-M-27.[4] Scheirer E. “Tempo and Beat Analysis of Acoustic MusicalSignals”. Machine Listening Group, MIT Media Laboratory,1996.[5] Goto M., Muraoka Y . “Beat Tracking based on Multiple-agentArchitecture - A Real-time Beat Tracking System for Audio Signals”.Proceedings of The Second International Confer-ence on Multiagent Systems , pp.103–110, 1996.[6] Goto M., Muraoka Y . “A Real-time Beat Tracking System forAudio Signals”.Proceedings of the 1995 International Com-puter Music Conference , pp.171–174, September 1995.[7] Chafe C., Jaffe D., Kashima K., Mont-Reunaud B., Smith J.“Source Separation and Note Identification in Polyphonic Music”. Stanford University, Department of Music, Report STAN-M-29. 1985[8] Moore B., Glasberg B., Baer T. “A Model for the Prediction ofThresholds, Loudness, and Partial Loudness”.J. Audio Eng.Soc ., V ol. 45, No. 4, pp. 224–240. April 1997[9] Todd, McAulay. “The Auditory Primal Sketch: a MultiscaleModel of Rhythmic Grouping”.Journal of New Music Research, 23, pp. 25–70, 1992.[10] Moore B. (ed). “Hearing”. Handbook of Perception and Cog-nition, 2nd Edition. Academic Press, 1995.。
中国海洋大学本科生课程大纲课程属性:公共基础/通识教育/学科基础/专业知识/工作技能,课程性质:必修、选修一、课程介绍1.课程描述(中英文):《语音学入门》是英语专业本科生开设的专业知识选修课程,在二年级第二学期开设。
该课程是一门入门课程,旨在为学习者提供语音学方面的基础知识和研究训练,使其在发音生理、声学分析和语音感知诸领域打下初步基础。
课程以教师讲授为主,利用多种语音材料,辅以课堂实践,力求使学习者在理论知识、研究方法和发音实践三方面同时得到提高。
An Introduction to Phonetics is a selective course set up for undergraduate students majored in English. This course offers an introductory and systematic introduction to basic definitions and theories in General Phonetics and English Phonetics, providing fundamental knowledge and academic training about phonetics and helping learners lay a solid foundation in areas such as speech articulation, acoustic analysis, speech perception and so on. This course also introduces the application of some speech sound analysis softwares and hot topics in this area.2.设计思路:本课程以《语音学教程》(Ladefoged和Johnson编著)为纲要,同时融合其他同类教材内容,博采众长,适当取舍。
六级作文题目sound英文回答:The concept of sound is a multifaceted one, encompassing a wide range of physical phenomena, sensory experiences, and cognitive processes. From the murmuring of a gentle breeze to the deafening roar of a jet engine,sound permeates our environment and plays a crucial role in our perception and understanding of the world around us.In physics, sound is characterized as the propagationof mechanical waves through a medium, typically air, liquid, or solid. These waves are generated by vibrations, which cause particles in the medium to oscillate back and forth, creating areas of compression and rarefaction. The speed, frequency, and amplitude of these waves determine various properties of sound, such as pitch, volume, and timbre.Acoustics, a branch of physics, explores the physical characteristics of sound and its propagation throughdifferent media. It involves studying phenomena such as reflection, refraction, diffraction, and interference, which govern the behavior of sound waves as they interact with objects and environments. This knowledge is applied in various fields, including architectural acoustics, noise control, and sonar.From a sensory perspective, sound is perceived through the auditory system, which consists primarily of the ears and auditory pathways in the brain. When sound waves enter the outer ear, they travel through the ear canal and cause the eardrum to vibrate. This vibration is transmitted through a series of small bones in the middle ear, which amplify the sound and direct it to the inner ear. Within the inner ear, the vibrations are converted into electrical signals by sensory cells in the cochlea, which are then transmitted to the brain via the auditory nerve.The brain interprets these electrical signals, providing us with a conscious perception of sound. We can distinguish between different sounds based on their pitch, which is determined by the frequency of the sound waves,and their volume, which is related to the amplitude of the waves. Timbre, another important attribute of sound, is a combination of overtones and harmonics that gives eachsound its unique character.Sound is not only a sensory input but also a powerful form of communication. Human speech, music, and non-verbal sounds such as laughter and crying convey information, express emotions, and connect individuals. In addition,non-human animals use sound for purposes such as attracting mates, establishing territories, and communicating witheach other.The study of sound extends beyond physics and sensory perception into the realm of cognitive psychology. Researchers explore how we perceive and process sound information, including how we localize and recognize sounds, extract meaningful patterns, and remember auditory stimuli. This understanding has implications for fields such asmusic cognition, language processing, and auditory rehabilitation.中文回答:声音的概念。
声音的由来英语作文Title: The Origin of Sound。
Sound, a fundamental aspect of human experience, permeates our lives in myriad ways. From the melodious chirping of birds to the rhythmic beats of music, sound shapes our emotions, communication, and understanding of the world around us. But what exactly is sound, and where does it come from?At its essence, sound is a form of energy produced by vibrations that travel through a medium, typically air, and are perceived by our ears. These vibrations can originate from various sources, each with its unique characteristics and properties.One of the most common sources of sound is the human voice. When we speak, air expelled from our lungs passes through the vocal cords in our larynx, causing them to vibrate. These vibrations produce sound waves that travelthrough the air and reach the ears of listeners. The pitch and tone of the sound depend on the frequency and amplitude of these vibrations, giving each voice its distinct qualities.In addition to the human voice, sound can also emanate from musical instruments. Whether it's the strumming of a guitar string, the pounding of a drum, or the blowing of a flute, musical instruments produce sound through the vibration of materials such as strings, membranes, or columns of air. These vibrations create complex patterns of sound waves that combine to form the rich tapestry of music that we enjoy.Nature itself is a prolific producer of sound. From the rustling of leaves in the wind to the crashing of waves on the shore, the natural world is alive with acoustic phenomena. Animals, too, contribute to this symphony of sound, with calls, cries, and songs that serve various purposes, from communication to mating rituals.But sound is not limited to the audible range.Infrasound, with frequencies below the threshold of human hearing, can be produced by natural phenomena such as earthquakes, thunderstorms, and volcanic eruptions. Ultrasonic sound, on the other hand, exists at frequencies higher than those audible to humans and finds applications in technologies such as medical imaging and pest control.Understanding the origin of sound is not merely an academic pursuit but has practical implications across various fields. In acoustics, the study of sound, scientists and engineers seek to unravel the mysteries of sound production, propagation, and perception. This knowledge underpins the design of concert halls, the development of audio technologies, and the improvement of communication systems.Moreover, the cultural significance of sound cannot be overstated. Music, language, and other forms of auditory expression are integral to human identity and social cohesion. They transcend barriers of language and culture, uniting people in shared experiences and emotions.In conclusion, sound is a complex phenomenon that originates from a diverse array of sources, including the human voice, musical instruments, nature, and technological devices. Its study encompasses physics, biology, psychology, and engineering, reflecting its multifaceted nature and significance in human life. As we continue to unravel the mysteries of sound, we deepen our understanding ofourselves and the world we inhabit.。
发qi音的英文单词Sound in Chinese is translated as "声音" (shēngyīn) and can refer to any audible vibrations that travel through the air or another medium. In English, the word "sound" is used to describe the auditory sensation produced by these vibrations. Sound can be produced by a wide variety of sources, including musical instruments, voices, and environmental noises. It is a crucial aspect of communication, allowing people to convey information, emotions, and ideas through speech, music, and other forms of audio expression.In the field of physics, sound is defined as a form of energy that is transmitted through waves in a medium such as air, water, or solids. These waves are created by the vibration of an object, which causes the surrounding particles to also vibrate and transmit the sound energy. The speed of sound varies depending on the medium through which it is traveling, with sound traveling faster insolids than in liquids and gases. Understanding theproperties of sound waves is essential for various applications, including music production, acoustics, and communication technology.Sound can be classified into different categories based on various characteristics, such as pitch, volume, and timbre. Pitch refers to the perceived frequency of a sound wave, with higher frequencies producing higher pitches and lower frequencies producing lower pitches. Volume, or loudness, is determined by the intensity of the sound wave, with greater intensity resulting in a louder sound. Timbre, on the other hand, is the quality that distinguishes one sound from another, even when they have the same pitch and volume. These characteristics play a significant role inhow sounds are perceived and interpreted by the human ear.The study of sound, known as acoustics, encompasses a wide range of topics, including the behavior of sound waves, the design of soundproofing materials, and the developmentof audio technology. Acousticians use various tools and techniques to analyze and manipulate sound waves, such as microphones, speakers, and software programs. Byunderstanding the principles of acoustics, researchers and engineers can improve the quality of audio recordings, design more efficient sound systems, and create innovative products that enhance the listening experience for consumers.Sound plays a crucial role in human perception and cognition, influencing our emotions, memories, and overall well-being. Music, for example, has been shown to have a profound impact on mood and can evoke powerful emotional responses in listeners. Sound therapy is a growing field that explores the therapeutic benefits of sound waves for treating various physical and mental health conditions. By harnessing the power of sound, therapists can help individuals relax, focus, and heal through techniques such as music therapy, sound baths, and binaural beats.In conclusion, sound is a fundamental aspect of human experience that shapes our communication, creativity, and understanding of the world around us. From the physics of sound waves to the psychology of auditory perception, the study of sound encompasses a diverse range of disciplinesand applications. By exploring the science and art of sound, we can unlock new possibilities for expression, innovation, and connection in our lives.。
声音原理英语作文题目:The Fundamentals of Sound: An Acoustic Exploration In the vast expanse of our sensory world, sound holds a unique and profound significance. It is an invisible yet powerful force that shapes our perceptions, influences our emotions, and facilitates communication. To understand the depth of its impact, we must delve into the fundamental principles that govern the creation, propagation, and reception of sound. This essay serves as an acoustic exploration, elucidating the scientific underpinnings that transform physical vibrations into the rich tapestry of auditory experiences we encounter daily.The Genesis of Sound: Vibrations and WavesSound begins its journey as mechanical vibrations –oscillatory motions that disturb the equilibrium of matter. When an object is set into motion, such as a vocal cord vibrating during speech or a drumhead being struck by a mallet, it imparts kinetic energy to the surrounding medium, typically air. These vibrations propagate through the medium in the form of longitudinal waves, characterized by alternating compressions and rarefactions of particles.At its core, a sound wave is a disturbance that carriesenergy without transferring any net mass. It possesses three fundamental properties: frequency, amplitude, and wavelength. Frequency refers to the number of oscillations per unit time, measured in Hertz (Hz), and determines the pitch of the sound. Amplitude represents the maximum displacement of particles from their resting position and is directly proportional to the loudness or intensity of the sound. Lastly, wavelength is the distance between two consecutive points of the same phase in the wave, influencing the perceived timbre and the way sound interacts with physical barriers.The Medium Matters: Propagation and AttenuationSound waves cannot travel in a vacuum, as they require a medium for transmission. Different media, such as air, water, or solids, have distinct densities and elastic properties that affect the speed at which sound travels. In general, sound moves faster through denser materials and those with higher elasticity. This explains why underwater sounds seem closer and louder than their equivalent on land, and why we can sometimes hear distant conversations through walls more clearly than when they occur outdoors.During propagation, sound waves encounter various forms of resistance, leading to attenuation –a reduction inamplitude over distance. Factors contributing to attenuation include absorption by the medium, scattering due to irregularities in the medium, and geometric spreading, where the energy of the wave is dispersed over an increasingly larger area as it moves away from the source. Attenuation plays a crucial role in shaping our auditory environment, determining the audibility range of sounds and the extent to which they can be localized.Perception and the Human Ear: Decoding SoundThe human ear is a marvel of biological engineering designed to capture, transduce, and interpret sound waves. Sound waves enter the outer ear, or pinna, which funnels and amplifies the sound, directing it into the ear canal. At the end of the canal lies the eardrum, a thin membrane that vibrates in response to the pressure variations of the incoming sound wave.These vibrations are transmitted through the middle ear's ossicles –the malleus, incus, and stapes –which act as a lever system, amplifying the vibrations and transmitting them to the inner ear. Within the cochlea, a spiral-shaped fluid-filled structure, these mechanical vibrations are converted into electrical signals by hair cells. The frequency-dependentactivation of hair cells along the basilar membrane creates a tonotopic map, which the brain decodes as different pitches.Moreover, the brain processes temporal and spatial cues embedded in the sound wave to localize the source, discern speech from background noise, and extract meaningful information from complex auditory scenes. Our ability to perceive and analyze sound is not only a testament to the intricate workings of the auditory system but also underscores the importance of understanding sound principles in fields such as acoustics, psychoacoustics, and audiology.Conclusion: Unraveling the Sonic TapestryThe principles governing sound –from the generation of vibrations to their propagation through various media, and ultimately their interpretation by the human ear –form the fabric of our auditory experience. Understanding these fundamentals not only enriches our appreciation of the intricate symphony of everyday sounds but also enables advancements in numerous applications, ranging from music and audio engineering to architectural acoustics, medical diagnostics, and even environmental monitoring.By unraveling the mysteries of sound, we gain deeper insight into the invisible yet potent force that shapes ourperceptions, communicates ideas, and connects us to the world around us. In essence, the study of sound principles is a journey into the very essence of auditory perception, revealing the remarkable interplay between physics, biology, and human cognition in our encounter with the vibrant realm of sound.。
声学英语作文模板英文回答:Acoustics。
Acoustics is the interdisciplinary science that deals with the study of all mechanical waves in gasses, liquids, and solids including topics such as vibration, sound, ultrasound, and infrasound. It is a branch of physics that also has applications in engineering, psychology, speech therapy, and many other disciplines.Acoustics is the study of sound and its propagation through different mediums. It is a complex and multifaceted field that encompasses a wide range of topics, including:The physics of sound waves。
The perception of sound by humans and animals。
The design of acoustic environments。
The use of sound in music, communication, and technology。
Acoustics is a fascinating and important field that has applications in a wide range of areas. From the design of concert halls to the development of medical imaging technologies, acoustics plays a vital role in our everyday lives.Acoustics and Human Hearing。
-年专八翻译真题与答案2000年英语专业八级考试--翻译部分参考译文C-E原文:中国科技馆的诞生来之不易。
与国际著名科技馆和其他博物馆相比,它先天有些不足,后天也常缺乏营养,但是它成长的步伐却是坚实而有力的。
它在国际上已被公认为后起之秀。
世界上第一代博物馆属于自然博物馆,它是通过化石、标本等向人们介绍地球和各种生物的演化历史。
第二代属于工业技术博物馆,它所展示的是工业文明带来的各种阶段性结果。
这两代博物馆虽然起到了传播科学知识的作用,但是,它们把参观者当成了被动的旁观者。
世界上第三代博物馆是充满全新理念的博物馆。
在这里,观众可以自己去动手操作,自己细心体察。
这样,他们可以更贴近先进的科学技术,去探索科学技术的奥妙。
中国科技馆正是这样的博物馆!它汲取了国际上一些著名博物馆的长处,设计制作了力学、光学、电学、热学、声学、生物学等展品,展示了科学的原理和先进的科技成果。
参考译文The first generation of museums are what might be called natural museums which, by means of fossils, specimens and other objects, introduced to people the evolutionary history of the Earth and various kinds of organisms. The second generation are those of industrial technologies which presented the fruits achieved by industrial civilization at different stages of industrialization. Despite the fact that those two generations of museums helped to disseminate / propagate / spread scientific knowledge, they nevertheless treated visitors merely as passive viewers.The third generation of museums in the world are those replete with / full of wholly novel concepts / notions / ideas. In those museums, visitors are allowed to operate the exhibits with their own hands, to observe and to experience carefully. By getting closer to the advanced science and technologies in this way, people can probe into their secret mysteries.The China Museum of Science and Technology is precisely one of such museums. It has incorporated some of the most fascinating features of those museums with international reputation. Having designed and created exhibits in mechanics, optics, electrical science, thermology, acoustics, and biology, those exhibits demonstrate scientific principles and present the most advanced scientific and technological achievements.E-C: If people mean anything at all by the expression “untimely death”, they must believe that some deaths must be on a better schedule than others. Death in old age is rarely called untimely—a long life is thought to be a full one. But with the passing of a young person, one assumes that the best years lay ahead and the measure of that life was still to be taken. History denies this, of course. Among prominent summer deaths, one recalls those of Marilyn Monroe and James Deans, whose lives seemed equally brief and complete. Writers cannot bear the fact that poet John Keats died at 26, and only half playfully judge their own lives as failures when they pass that year. The id ea that the life cut short is unfulfilled is illogical because lives are measure d by the impressions they leave on the world and by their intensity and virtue.参考译文如果人们藉"英年早逝"这一字眼真的意欲表达什么含义的话,他们必然相信某些人的辞世可以算是寿终正寝,而另一些人则"死不逢时" 。
ACOUSTICS AND PERCEPTION OF SOUND IN EVERYDAY ENVIRONMENTSBarbara Shinn-CunninghamBoston University677 Beacon St.Boston, MA 02215shinn@ABSTRACTOne aspect of hearing that has received relatively little attention by traditional psychophysicists is how echoes and reverberation in everyday spaces affect perception. In the ordinary world, echoes and reverberation are ubiquitous and influence the signals reaching the listener, the processing of these signals by the brain, and the resulting perception of both sound sources and the environment. Many aspects of the signals reaching the ear are altered or "distorted" by echoes and reverberation, including spectral content, interaural differences, and temporal structure. As a result, echoes and reverberation could influence many aspects of perception, including spatial hearing in direction and distance, speech intelligibility, and spatial unmasking. This paper reviews results from a number of studies examining how the acoustics of ordinary rooms affect various aspects of the signals reaching a listener's ears as well as resulting perception. While the acoustic effects of reverberant energy are often pronounced, performance on most behavioral tasks is relatively robust to these effects. These perceptual results suggest that listeners may not simply be adept at ignoring the signal distortion caused by ordinary room acoustics, but may be adapted to deal with its presence. These results are important for designing truly immersive spatial auditory displays, because they demonstrate the importance of reverberant energy for achieving a realistic, immersive experience.1.OUR COMPLEX ACOUSTIC WORLDMost psychology and neuroscience textbooks discuss auditory perception as if the only acoustic energy reaching a listener arrives directly from a source, ignoring the fact that much of the energy arrives indirectly, reflecting off the many objects in the environment. In fact, in decoding sound, the auditory system deals with a much more complex and interesting set of problems than the simplified textbook view suggests, and does so efficiently and elegantly.For instance, textbooks treat the computation of sound source location as a relatively straightforward problem, as if the auditory system simply extracts basic acoustic cues (such as interaural differences and spectral cues) and estimates the location of a source from these cues (e.g., see [1, 2]). This analysis assumes that acoustic cues that arise for a source from a particular location do not vary with the environment and virtually ignores the computation of source distance. However, in our everyday lives, the very cues used to compute source position depend not only on the sound that reaches the ears of the listener directly, but on sound that is reflected off of all of the objects in the environment, including walls, floor, furniture, etc. As a result, the acoustic cues used to determine source position depend not only on the location of the source relative to the listener, but also on the acoustic environment and the location and orientation of source and listener in the environment [3, 4]. It is well known that the presence of reverberant energy provides information about acoustic source distance [5-15], but little is known about listeners compute source distance based on the signals reaching their ears [15, 16].Similarly, most discussions of speech recognition focus on how to decode the signal emitted by a talker, not the actual signal reaching the receiver (e.g., see [17]). Most automatic speech recognition systems are designed to interpret clean speech (without any reverberation) and therefore tend to perform poorly in ordinary reverberant environments. In contrast, the ability of human listeners to understand speech is relatively robust in the presence of modest amounts of reverberant energy [18-20].This paper reviews a number of studies investigating how reverberation in a moderate-sized room influences acoustics and perception. Results suggest that the presence of echoes and reverberation (referred to jointly as “reverberation”throughout the remainder of this paper) significantly distorts many of the acoustic cues thought important for spatial hearing and other perceptual tasks. However, listeners are not only adept at making accurate judgments in ordinary reverberant environments, they are in fact adapted to the presence of reverberation and benefit from its presence in many ways. These results underscore the importance of simulating room acoustics in order to create realistic and natural three-dimensional spatial auditory displays.The initial studies reviewed in this paper focus on studying the acoustics of a moderate-sized classroom (dimensions of 5 m x 9 m x 3.5 m). Of course, the effects of reverberation vary dramatically with environment. However, studying in depth what happens due to the reverberation present in one particular environment provides general insights into both acoustic and perceptual effects of reverberation in other relatively small rooms.In order to understand how the effects of reverberation are influenced by listener location, these studies compare effects for four different locations of the listener in the room, depicted schematically in Figure 1. In the center location, there are no reflective surfaces near the listener. In the left location, the listener’s left side is very close to one wall. In the back location, the listener’s back is to the wall. Finally, in the corner location, both the listener’s left side and back are near a wall. For all of these listener locations, a sound sourceFigure 2: Cross-correlation analysis of left and right ear signals as a function of source location and listener location. Top row shows the normalized cross-correlation peak amplitude. Bottom row shows the interaural time delay of the peak.was presented from a range of sources in the front right quadrant of space (depicted in gray in Figure 1). In some cases, acoustic measurements were used to analyze how listener location influenced the signals reaching the ears. In other cases, perceptual studies were performed in the actual room. Finally, acoustic measurements were used to create realistic headphone-based simulations of the signals reaching the listener in order to study the perceptual effects of realistic reverberation with carefully-controlled stimuli.2. ACOUSTIC EFFECTS OF REVERBERATION Reverberation influences nearly all acoustical attributes of the signals reaching the ears of the listener, including temporal structure, spectral content, intensity, and interaural differences. Simple physics dictates that the magnitude of all of the acoustical effects of reverberation varies inversely with the direct-to-reverberant energy ratio (D/R). The direct sound level reaching the ear varies dramatically with the position of the sound source relative to the listener; as a result, D/R changes systematically with source position [21-23]. The direct sound level decreases with the square of the distance from source to head; thus, D/R decreases and the effects of reverberation increase with distance [22]. As the sound source is moved laterally off the median plane, the direct sound level decreases at the far ear and increases at the near ear, an effect that is more pronounced at high frequencies and increases as the source approaches the head. Thus, the effects of reverberation vary with source laterality (and do so most strongly for sources near the listener), increasing at the far ear and decreasing at the near ear [22].The location of the listener in the room also has a dramatic effect on the level and pattern of reverberation at the ears [4, 21-26]. For instance, when the listener is far from any walls, the steady-state effect of the reverberation is a distortion that is essentially independent from frequency to frequency; however, early, strong reflection (such as arise when a listener is seated close to a wall) lead to systematic distortions of acoustic spatial cues. When a listener is near a reflecting wall, the spectral content of the total signal reaching the listener is comb-filtered (due to frequency-dependent reinforcement and cancellation of the direct sound by the echo), producing notches in the spectra received at the ears that vary with listener position relative to the wall andsource position relative to the listener. Such comb-filtering also systematically distorts interaural differences.Whether or not there are early, intense reflections, the overall effect of reverberation is to introduce variations in the interaural and spectral localization cues that govern localization perception, even though these acoustic effects are more pronounced when a listener is near a wall and when the source is far from the listener.Figure 2 demonstrates how reverberation influences the interaural time difference (ITD) for different listener and source positions. Head-Related Transfer Functions (HRTFs)were measured for source locations in the horizontal plane in the front-right quadrant of space relative to KEMAR for the four listener locations shown in Figure 1. The center HRTF locations were time-windowed to generate pseudo-anechoic HRTFs. The left- and right-ear HRTFs for the resulting five sets of HRTFs (anechoic , center , back , left , and corner ) were bandpass filtered from 100 – 2000 Hz, cross-correlated, and then normalized by the energy in the bandpass-filtered left-and right-ear HRTFs. The main peak falling within the physiologically-plausible ITD range (-1 to +1 ms) was identified. The normalized peak magnitude (which has a maximum value of +1 by construct) is plotted in the top row of Figure 2; the corresponding ITD value is plotted in the bottom row of the figure.In anechoic space, the peak correlation value decreases,albeit slightly, with source azimuth due to frequency-dependent filtering of the head. When the source is in front of the listener, the left- and right-ear signals are nearly identical;however, the similarity decreases with source azimuth. The general effect of reverberation (regardless of listener location)is to decrease the peak correlation value, an effect that grows with both source laterality and distance. The peak value also depends on the listener location in the room, and generally is smallest when the listener is in the corner or left room locations (where the head-shadowed ear receives early, intensereflections).Figure 1. Sketch of the four listener locations in the room (gray area shows source locations re:listener).The effects of reverberation on binaural cues are dominated by the effect of reverberation on the ear with the smaller D/R. As a result, the D/R at the ear that is farther from the source determines how distorted ITD is by reverberation.This D/R decreases with source distance and azimuth and depends on listener position. In particular, when a listener has his shadowed ear facing a wall, peak correlation values are very low, especially for distant, lateral sources.Despite the fact that the peak correlation value is dramatically affected by distance and listener location in the room, the ITD at which the peak occurs is relatively insensitive to reverberation (see bottom panels of Figure 2).While the results in Figure 2 show the effects of reverberation on ITD only, similar effects arise for ILD and spectral shape cues; i.e., the primary effects of reverberation are to distort localization cues, and this distortion increases with source azimuth and distance as well as with the number of reflecting surfaces near the listener [23]. In addition, while the results reported in Figure 2 are from a manekin, similar measurements [23, 27] show that KEMAR results fall within the range of data taken with human subjects. Overall, these results suggest that listener location may not have a large impact on the average perceived location of a sound source,but that the reliability of judgments of location may degrade with reverberation.3. SPATIAL HEARINGBased on acoustical measurements (like those shown in Figure 2), we did not expect to see large effects of reverberation on the perceived source location for sources within a meter of the listener when the listener is in the center of the classroom. In these conditions, D/R is relatively large,and the distortion of the acoustic cues for localization relatively small and random.Our initial study of localization in a room [3, 28, 29]replicated an earlier study of three-dimensional sound localization of nearby sources in anechoic space [30] in a classroom. Subjects pointed to the perceived sound source location while in the center of the room, far from any reflective surfaces, and then repeated the experiment with alarge wallboard positioned to their side. We hypothesized that in the center condition localization performance would be nearly identical to that seen in the prior anechoic study;however, we expected performance to be worse when the wallboard was close to the listener. We found that distance localization was much better for both center and wallboard conditions than for the anechoic condition. For directional localization, response variability was slightly larger in both reverberant conditions than in anechoic conditions [3, 28, 29,31], but there was no systematic effect on signed localization error (which was near zero). Even more surprising, we found that response variability was generally smaller in the wallboard than the center condition. Further analysis suggested that this result was due to “room learning,” or an improvement in localization reliability with experience, that occurred during the center trials (which all subjects performed prior to the wallboard trials).These findings are illustrated in Figure 3 for localization in elevation (results are similar for the left-right and distance dimensions) [29, 31]. In the figure, the mean, unsigned error (which, for these experiments, primarily reflects response variability since mean signed error is near zero) is plotted for each listener for the first and last 200 trials in the center and wallboard conditions (right side of figure) as well as for the original anechoic study (left side of figure). In the anechoic condition [30], there is no statistically-significant change in localization performance with experience; however, mean unsigned error decreases significantly with practice in the center condition. Furthermore, there is no statistically-significant change in performance when the wallboard is first put in place and no improvement between the beginning and end of the wallboard trials. These results indicate that performance improves with experience in a reverberant, but not anechoic, room (even without explicit feedback). Further,learning generalizes to conditions that differ acoustically,like conditions (e.g., from center to wallboard conditions).Because this study confounds effects of “room learning”with acoustic effects due to the wallboard, we conducted a follow up study [27]. Using the same basic procedures,subjects performed four separate experimental sessions, each performed with the listener in a different location in the room (the locations shown in Figure 1:left , corner , wall , and back ).We hypothesized that both the acoustic differences across the conditions and the room learning effect would influence results. Acoustical measurements show that distortions of spatial cues are greatest in the corner and smallest in the center locations [23, 24, 27]. Two subject groups performed the experiment; Group A performed the four sessions in the order center , back , left , corner , and Group B performed the sessions in the reverse order (corner , left , back , center ). We expected subjects from Group B, who started in the most difficult and ended in the easiest acoustic condition, to show a large improvement in localization from sessions 1 to 4. We expected subjects from Group A to show smaller changes from session 1 to session 4 because acoustic and room-learning effects opposed one another.Figure 4 shows the variance in responses for individual subjects and the across-subject group average for both the left-right and distance dimensions. Subjects in Group B (who ended in the easiest acoustic condition) showed a large decrease in response variance from session 1 to session 4. In contrast, subjects in Group A, who heard the easiest acoustic condition first, showed no systematic change acrosssessions.Figure 3: Mean error in elevation (deg) for the first and final 200 trials in each condition of a localization pointing experiment. Each set of bars represents results from one subject. Error bars show standard error over the 200 trials.These results support the idea that the acoustics at different listening positions in a room influence performance, with performance generally worse for the corner location than for the center location. However, the fact that performance also improves from session to session supports the conclusions of the earlier experiment, i.e., that there is some room learning in occurs when listening in reverberant settings, an that whatever subjects learn in one room position at least partially transfers to other room positions.These experiments show that moderate amounts of reverberation have a relatively modest impact on sound localization, causing an increase in the variability of judgments of source direction and improving the ability to judge distance. Even more, listeners appear to adapt to the reverberation present in a particular room, becoming more and more accurate at localization with experience.4. SENSITIVITY TO REVERBERATION PATTERN In addition to providing distance information,reverberation provides listeners with a sense of the room itself. For instance, a listener can easily tell the difference between the acoustic effects of being in a small, tiled bathroom and being in a large, heavily-carpeted living room.In fact, much of the work in the field of architectural acoustics focuses on determining what kind of room reverberation is subjectively desirable in a concert-hall setting. Whereas the usual goal in architectural acoustics is to determine what constitutes a “good” acoustic space for the average listener in the environment, we decided ask a slightly different question and measure sensitivity to differences in reverberation with changes in listener location in one particular room.Listeners were asked to identify their room location from headphone simulations of sources at different azimuths and distances relative to the head. We hypothesized that the ability to judge room location would improve with source distance because the relative level of the reverberant energy in the signals reaching the listener increases with source distance. We expected source azimuth to have some impact because the levels and pattern of direct and reverberant energy also change with azimuth.For each listener location, HRTFs were measured for nine source positions (all combinations of azimuths 0, 45, and 90ºto the right and distances 0.15, 0.40, and 1 m). Noise samples were convolved with the set of 36 HRTFs (9 source locationsx 4 listener locations) to generate binaural stimuli. In order to remove gross intensity differences, these stimuli were normalized so that the right-ear signal in each binaural pair (i.e., the louder of the signals in the binaural pair for the tested source locations) had the same RMS value. On each trial, the listener identified the room location, after which they were provided with correct-answer feedback.Subjects performed 36 blocks of trials. In each block, all trials simulated the same source azimuth and distance;differences from trial to trial were due primarily to changes in the reverberation pattern. Each block consisted of 32 trials (8presentations from each of the 4 room locations, in random order). Prior to each block of 32 trials, subjects could listen to presentations from each of the room locations as many times as they wished; testing began only when subjects felt ready to proceed. Subjects performed 12 blocks per experimental session, during which the source distance was held constant.The three source azimuths were presented in random order within each session (different orders for each day and subject), so that each day, a subject heard four consecutive blocks from the same source location followed by two sets of four blocks, each simulating a different source azimuth. To reduce any artifacts due to training, the first block in each condition are not analyzed in the results reported here.Because we were primarily interested in how well subjects could tell listener locations apart, we analyzed T , the information transfer ratio, for each source location and subject (see [32]). In theory, T ranges between zero and one and is exactly equal to one if knowing the subject’s response perfectly predicts the stimulus presented. Low values of T arise when responses are independent of the stimulus. Figure 5 shows that in this experiment performance is relatively poor and individual differences large (e.g., T ranges from 0.1 – 0.7for 90˚ sources). There is a modest effect of azimuth:performance is slightly (but significantly) better for sources at 90˚; however, distance caused no statistically-significant main effect on T (multi-way ANOVA analysis, p < 0.05).In order to gain further insight into what the listeners could hear, T was analyzed for each pair of room locationstoFigure 5: Information transfer rate T as a function of source azimuth for three source distances (Experiment 1). Across-subject means shown by solid lines (with standard error bars);open symbols are individual subjectresults.Figure 4: Variance in localization judgments as a function of experimental session for left-right (left) and distance (right). Group A started in the easiest acoustic condition and progressed to the most difficult; Group B did the reverse.determine which pairs were relatively difficult to tell apart and relatively easy. T was computed for each room pair for each listener and source location. For each subject, these values were averaged across azimuth (which had little effect on the pairwise T ).Figure 6 shows the across-subject mean and standard error of T for all room pairings and for each of the source distances.These results show that for nearby sources, all room pairings were roughly equally discriminable; however, as distance increased, performance for four room pairs increased while for two pairs it decreased. More specifically, at the 1 m source distance, subjects could not distinguish between the two locations in which neither ear faced a wall (center and back )or between the two locations in which the left ear faced a wall (corner and left positions); however, they rarely made confusions across these categories (e.g., they rarely confused center and corner locations).A follow-up study comparing monaural and binaural performance suggests that listeners are actually better at judging the simulated listener location in the room when listening monaurally to the head-shadowed ear signal [33]. In other words, normal, binaurally listening actually decreases a listener’s ability to discriminate between different patterns of reverberation. This finding hints that monaural (possibly spectral) cues are the most salient acoustic cue that could be used in this task, but that binaural listening degrades the ability to use these cues, as if the system automatically combines the signals at the two ears in a way that factors out reverberation effects.These results suggest that under normal listening conditions listeners cannot easily discriminate where they are in an everyday room from the signals reaching their ears. For the most distant sources tested, listeners have a modest ability to discriminate between room locations in which one ear faces a wall and those in which neither ear is facing a wall,but cannot discriminate within these categories. For nearer sources, listener have some ability to discriminate across all combinations of room locations, but are not particularly goodat discriminating any room pairs. It appears that the presence of very early, strong echoes (as occur when one ear faces the wall and the source is relatively distant) are easy to hear, but that other differences are difficult to discriminate. More generally, this study suggests that listeners are insensitive to many of the fine details in the pattern of echoes reaching the ears, as previously hinted by previous studies [9, 34-37]. In practical terms, the fact that listeners cannot reliably identify differences between different listener locations in a room demonstrates that simplified reverberation models may be sufficient for many spatial auditory displays.5. SPEECH INTELLIGIBILITY AND SPATIALUNMASKING OF SPEECH Spatial hearing is not the only aspect of auditory perception influenced by reverberation; reverberation can have a dramatic impact on the temporal modulations in a signal. The signal reaching the ears is mathematically equivalent to the “clean” source signal convolved with the reverberant impulse response of the head and room. Because the room impulse often has a long temporal extent, there is a general tendency for reverberation to smear-out the energy in the original signal and reduce any envelope modulations present in the original signal [38, 39]. Unfortunately, the temporal modulations in speech are one of the primary sources of information about speech content; as a result, reverberation can degrade speech intelligibility [38, 40, 41].In many cases a source of interest (the target) is heard at the same time as a competing sound (the masker). It is well known that in anechoic conditions, spatial separation of target and masker improves speech intelligibility. This effect (known as “spatial unmasking”) arises both from changes in the target and masker energy levels at the ears with spatial separation and from neural processing effects. In particular,spatial separation of target and masker generally increases the target-to-masker ratio (TMR) at one ear (the “better ear”) and decreases it at the other ear, leading to simple improvements in speech intelligibility due to changes in the TMR. However,listeners often perform better when listening to binaural presentations of spatially-separated target and masker than when listening to monaural presentations of the better-ear signal (e.g., see [42-48]), suggesting that binaural processing leads to further improvements.Studies have shown that reverberation can decrease the contribution of binaural processing to spatial-unmasking [49-53]. However, in many of these studies, the reverberation presented was unnatural in its level and/or in its structure.Additionally, most of these studies were conducted using methods that make it difficult to tease apart what factors contributed to the observed results.We have performed some preliminary studies to determine how moderate levels of reverberation (found in everyday rooms) influence both speech intelligibility and spatial unmasking of speech. We have shown [54] that the modest levels of reverberation arising at the ears of the listener in the center room position do not significantly degrade sentence intelligibility; indeed, in some cases, sentences presented with reverberation are more audible (and hence more intelligibility) than sentences presented without reverberation. In addition, these levels of reverberation do not destroy spatial unmasking effects, at least for thespatialFigure 6: Pairwise information transfer rate for all combinations of room locations averaged across subjects (with across-subject standard error). Room locations: -: center ; C: corner ; B:back ; L: left .。