Effects of loading rate and temperature on J –R fracture resistance of an
SA516-Gr.70steel for nuclear piping
J.H.Yoon *,B.S.Lee,Y.J.Oh,J.H.Hong
Reactor Materials Department,Korea Atomic Energy Research Institute,150Dukjin-Dong,Yusong,Taejon 305-353,South Korea
Received 26December 1998;accepted 12February 1999
Abstract
The effects of loading rate and temperature on the fracture resistance of an ASME SA516-Gr.70steel for nuclear piping were investigated through J –R tests conducted in the wide ranges of temperatures,including reactor operating temperature,and loading rates,including quasi-dynamic rate.Tensile properties were also investigated in the temperature range of 100–316?C over a range of strain rates.The test results indicated that the SA516-Gr.70steel was very susceptible to dynamic strain aging (DSA).The fracture resistance showed a minimum in the temperature range between 200and 400?C,depending on loading rate.The temperature for minimum was moved to higher temperature as the loading rates were increased.The minimum was discussed in the viewpoints of DSA that is manifested by elevated temperature tensile tests.The crack tip strain rates of fracture specimens were also correlated with the strain rates of tensile tests to interpret the DSA effect.?1999Elsevier Science Ltd.All rights reserved.
Keywords:J–R fracture resistance;Loading rate;Dynamic strain aging (DSA);SA516-Gr.70steel
1.Introduction
SA516-Gr.70steel has been widely used in nuclear piping systems.Although this type of material is known to have relatively good fracture characteristics,the recent leak-before-break (LBB)design concept requires additional material parameters for detailed elastic–plastic fracture mechanics analysis.The J –R fracture resistance of the material under the reactor operating condition is one of the most important parameters in applying the LBB design concept to reactor coolant system piping [1,2].For the design of nuclear piping system,an adequate safety margin should be demonstrated through fast loading tests regarding seismic loading condition [2].However,the systematic evaluation for fracture resistance of SA516-Gr.70steel at various loading rates and temperatures are rare,while a large database has been built mainly by the International piping integrity research group (IPIRG)program for another piping material,i.e.SA106steel.In general,material prop-erties of ferritic steels like SA516-Gr.70change with the test temperature and loading rate.This is regarded as dynamic
strain aging (DSA)effect.It is well known that the DSA phenomenon occurs under certain test temperature and strain rate combined condition and is mostly revealed by serrated ?ows in uniaxial stress–strain curves [3–6].Under these speci?c conditions,the increase of strength and decrease of ductility are easily detected.The fracture resistance can also be signi?cantly deteriorated by DSA [7,8].The previous researches about DSA in SA516-Gr.70steel were concentrated in the serrated ?ow phenomenon in tensile test.Although some researchers like Miglin et al.[7]and Marengo et al.[9]reported the DSA effect on J –R fracture resistance,their investigations were limited to J –R tests under static loading condition.
The main purpose of the present study is to characterize the effect of the loading rate on J –R fracture resistance of SA516-Gr.70steel in the reactor operating temperature region.The other purpose is to identify the DSA effect as a cause of deterioration of J –R fracture resistance.The latter could be achieved by deriving an approximate equation for the effective strain rate at the crack tip area of the fracture mechanics specimen.To achieve these purposes,J –R frac-ture resistance tests were conducted at various temperatures and loading rates between quasi-static and seismic loading rates.Uniaxial tensile tests were also carried out under various temperature and strain rate conditions.
International Journal of Pressure Vessels and Piping 76(1999)663–670
0308-0161/99/$-see front matter ?1999Elsevier Science Ltd.All rights reserved.PII:S0308-0161(99)00033-2
*Corresponding author.Tel.:?82-42-868-8554;fax:?82-42-868-8346.
E-mail address:jhyoon4@nanum.kaeri.re.kr (J.H.Yoon)
2.Experimental
2.1.Material and specimens
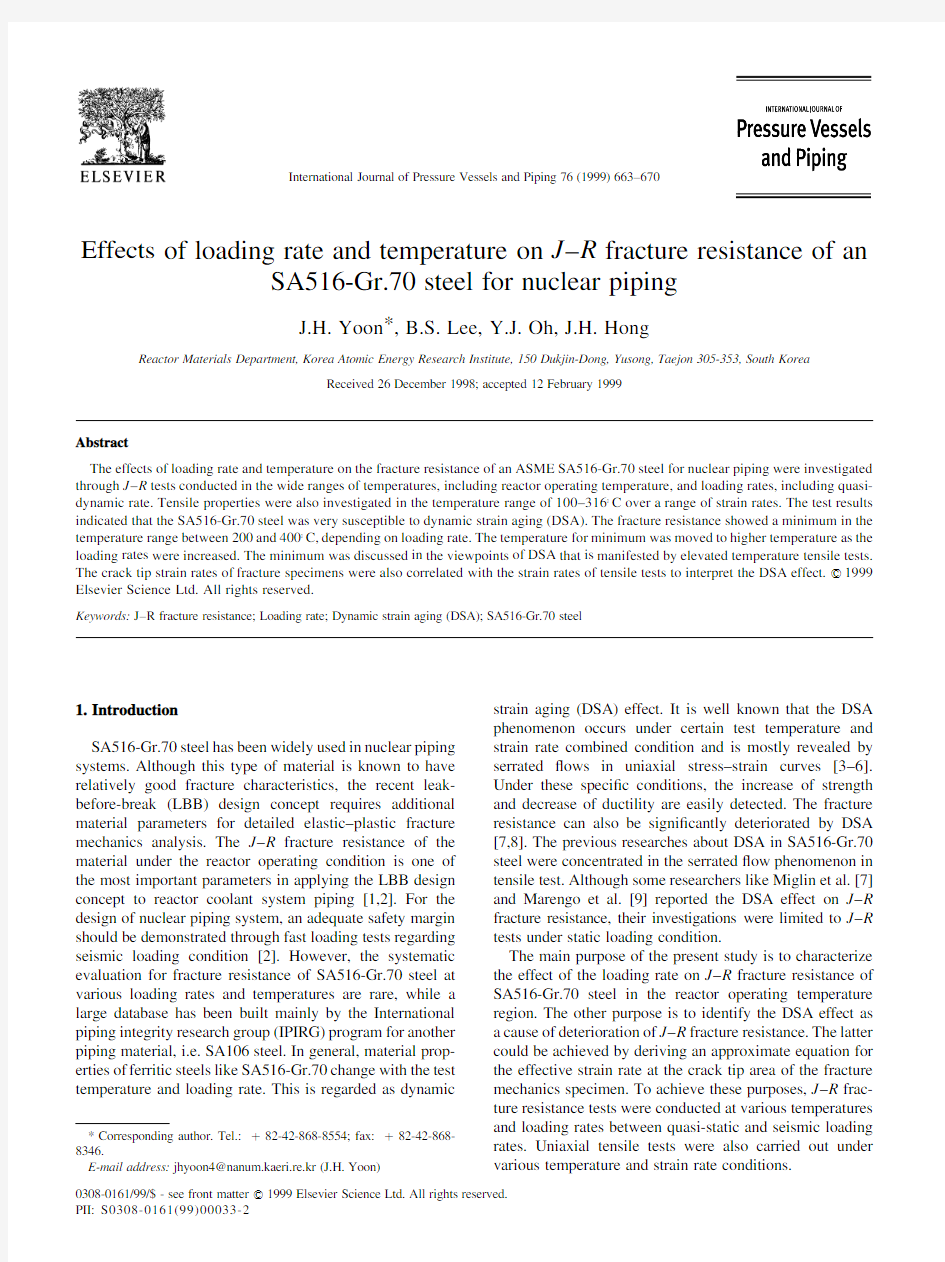
The material used in the present study is a commercial ASME SA516-Gr.70steel plate for the elbow of PWR reactor coolant system piping.The plate of 86mm thick-ness was normalized for 10h at 910–930?C and post weld heat treated for 30h at 607–635?C after hot-rolling.The material had a typical ferrite–pearlite microstructure after heat treatments as shown in Fig.1.The chemical composition and mechanical properties are summarized in Table 1.
The specimens for J –R fracture tests were machined as the standard 1T-C(T)(compact tension)specimens with L-T orientation that is of concern in the LBB analysis.The con?gurations of the specimen conformed to recom-mendations of ASTM E 1820-96[10].The specimens were side-grooved to a depth of 10%of the specimen thickness on both sides after fatigue pre-cracking.The uniaxial tensile specimens were machined to a reduced size.The gage length and diameter of the specimen were 16.5and 4mm,respectively.All the specimens were taken from the quarter thickness location of the plate in transverse direction to reduce the effect of the material inhomogeneity.2.2.Test methods
Direct current potential drop (DCPD)method,that is applicable to the fast loading test,was used for calculating crack length in the J –R fracture tests.The test temperatures varied in the range between room temperature and 500?C in the loading rate range of 0.3–1000mm min ?1.In J –R tests
J.H.Yoon et al./International Journal of Pressure Vessels and Piping 76(1999)663–670
664Fig.1.Microstructure of test material (SA516-Gr.70steel).
Table 1
Chemical composition of SA516-Gr.70steel studied
C
Si Mn P S Cu N Ni Cr Mo Al V Nb Wt.%0.2220.310 1.1400.005
0.0020.1020.0090.2070.1490.0430.020?0.005?0.05Spec.
0.28max
0.13–0.45
0.79–1.30
0.035max
0.04max
–
–
–
–
–
–
–
–
J -I n t e g r a l , (k J /m 2
)
C rack E xtension, ?a (m m )
J -I n t e g r a l , (k J /m 2
)
C rack E xtension, ?a (m m )
J -I n t e g r a l , (k J /m 2
)
C rack E xtension, ?a (m m )
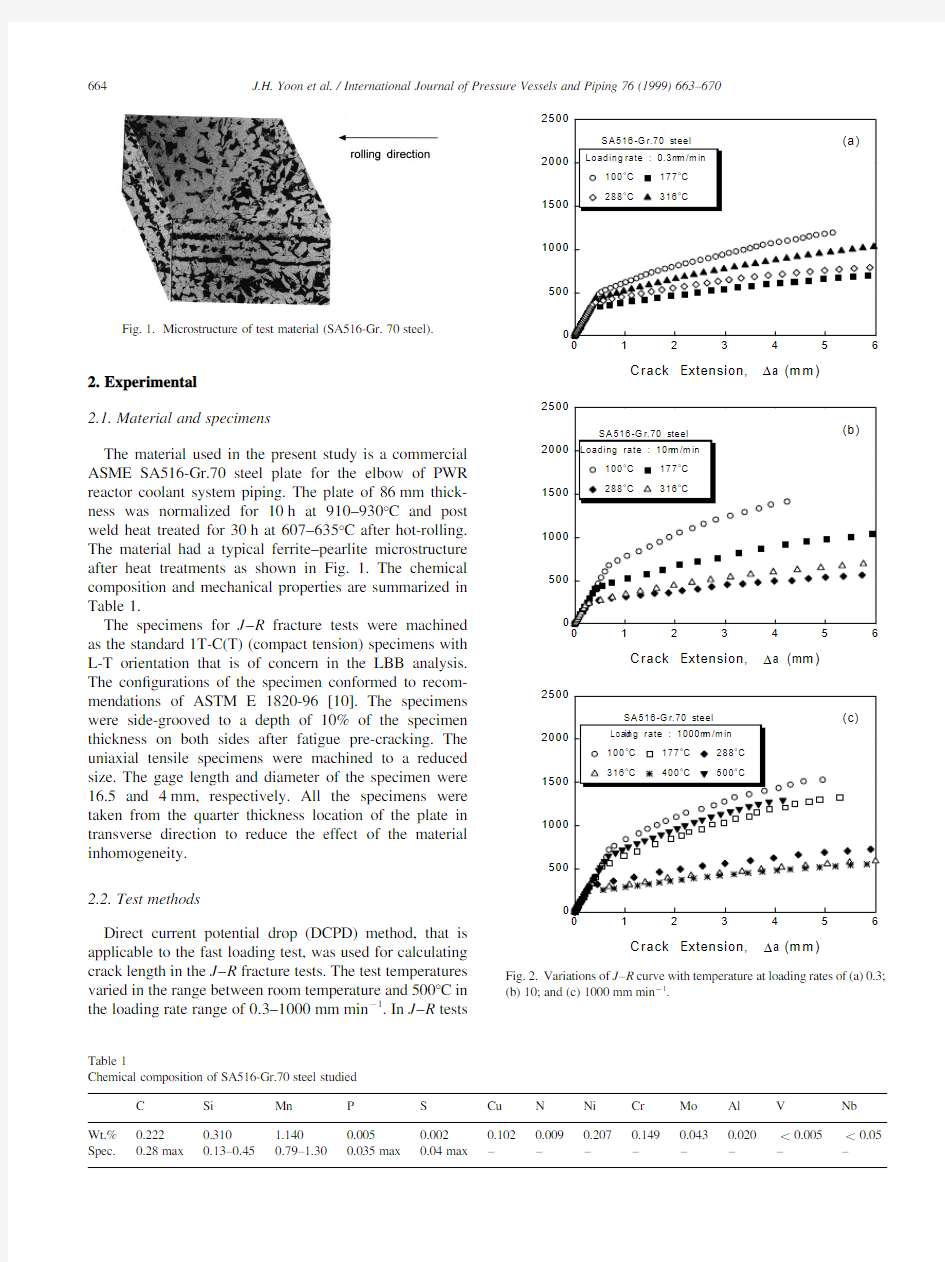
Fig.2.Variations of J –R curve with temperature at loading rates of (a)0.3;
(b)10;and (c)1000mm min ?1.
using the DCPD method,the magneto-elastic effect in ferro-magnetic materials can interfere in calculating the crack length from the DCPD signal in the case of dynamic loading [11–14].Therefore,the input current was increased up to 100A to minimize the magneto-elastic effect.The tests were conducted on a servo-hydraulic Material Test Systems (MTS)machine,and specimen temperature was controlled within ^1?C in environmental chamber.The test frame was electrically insulated from the external environment.The details were reported else-where [15].
Tensile tests were performed at various temperatures (100–316?C)and strain rates (2.5×10?5–1.33×100s ?1).An analog X–Y recorder was used to identify the serrated ?ows on the stress–strain curves in addition to a digital instrument.
3.Results and discussion 3.1.J–R fracture properties
Variations of the J –R curves with test temperatures for SA516-Gr.70carbon steel at various loading rates ranging from quasi-static (0.3mm min ?1)to quasi-dynamic (1000mm min ?1)are shown in Fig.2.The fracture resis-tance of the tested material depended strongly on the test temperature and loading rate.It could be deduced that there existed a critical temperature at which the J –R fracture resistance became a minimum at each loading rate.The negative temperature sensitivity of J –R fracture resistance changed into a positive one,centering about the critical temperature.The fracture toughness dependence on loading rates at 316?C,the normal operating temperature,
J.H.Yoon et al./International Journal of Pressure Vessels and Piping 76(1999)663–670665
J -I n t e g r a l , (k J /m 2
)
Crack Extension, ?a (m m)
Fig.3.Variations of J –R curve with loading rates at 316?C.
100
200
300
400500
200
4006008001000120014001600J 0.1 (k J /m 2
)
Tem perature (o
C)
Fig.4.Variations of J values,corresponding to crack growth of 2.54mm (0.1in)on J–D a plots,with temperature and loading rate.
is shown in Fig.3.The J –R fracture resistance was found to be a minimum near a loading rate of 100mm min ?1at 316?C.
J integral values named as J 0.1were obtained at D a 2.54mm (0.1inch)on the J –R curves to look through the dependence of the fracture resistance on the temperature and loading rate quantitatively as shown in Fig.4.J 0.1can
give more reliable information about the fracture resistance than J IC does in the analysis of a large component.As shown in Fig.4,minimum J 0.1values were 30–40%of those which represented high fracture resistance under different condi-tions.As the loading rate increased,the temperature at which the fracture resistance became a minimum for each loading rate shifted to the higher temperature region.Fig.5represents the variation of the tearing modulus (T R )as a function of temperature at various loading rates.The tearing modulus is a parameter,which shows the stability of crack growth in a cracked body.T R is de?ned as E =s 2Y d J =d a mat ,where E is the Young’s modulus,s Y is the yield strength,and (d J /d a )mat represents the average slope of a J –R curve between 0.2mm offset line and 1.5mm exclusion line [16].The trend in the variations of T R values with test conditions was very similar to that of J 0.1.On the basis of previous research,the occurrence of abrupt drops in the J –R fracture resistance and T R at a speci?c temperature and load-ing rate range is presumably due to DSA in SA516-Gr.70steel [7].3.2.Fractography
Scanning electron microscope (SEM)and optical micro-scope observations were carried out to examine macro frac-ture behavior dependence on J –R test conditions.Fig.6(a)and (b)shows SEM photographs of fracture surfaces of J –R tests at the loading rates of 0.3and 1000mm min ?1at 316?C.As mentioned previously,the fracture resistance at the loading rate of 0.3mm min ?1was much higher than that at the loading rate of 1000mm min ?1at 316?C.There were some differences in the fracture surfaces of the two speci-mens.A number of evenly distributed microvoids are observed in Fig.6(a),but they are hardly seen in Fig.6(b).The fracture surface of Fig.6(a)shows a mixed struc-ture of large and small dimples.On the contrary,Fig.6(b)
J.H.Yoon et al./International Journal of Pressure Vessels and Piping 76(1999)663–670
666100200300
400500
200
40060080010001200
T e a r i n g m o d u l u s , T R
Temperature (o
C)
Fig.5.Variations of tearing modulus with temperature and loading rate.
Fig.6.SEM fracture surfaces after J –R tests at 316?C at the loading rate of (a)0.3;and (b)1000mm min ?1.
shows the?atter fracture surface and larger dimples compared with Fig.6(a).Fig.7(a)and(b)are the optical microscope photographs of the normal planes to fracture surfaces of specimens tested at the above two loading rates at316?C.It is observed that grains under the fracture surface are elongated along a direction in Fig.7(a).Further, the fracture surface in Fig.7(a)is rougher than when compared with that of Fig.7(b).Conclusively,the large plastic deformation took place during the test at the loading rate of0.3mm min?1(high fracture resistance),but the deformation was ultimately limited in the case of the load-ing rate of1000mm min?1(low fracture resistance).Gener-ally,it is known that DSA accompanies an ultimate limitation of plastic deformation during crack propagation. Hence,it is deduced that the abrupt drop in fracture resis-tance in speci?c combinations of test temperature and load-ing rate is due to DSA.3.3.DSA in SA516-Gr.70steel veri?ed by tensile tests DSA phenomena are usually recognized by serrated?ows in the tensile stress–strain curve that is referred to as the Portevin–Le Chatelier effect[17].Figs.8and9show a series of the tensile test results for SA516-Gr.70steel. Serrated?ows were obviously observed in some test condi-tions.As shown in Figs.8and9,the maximum tensile strength was obtained near the disappearance of the serrated ?ow.This fact coincides with the test results of previous research for SA106steel by Kim and Kim[18].The condi-tions for the occurrence of serrated?ows were expressed as a serration map in Fig.10.As DSA is regarded as a ther-mally activated process[19,20],the activation energy of solute diffusion in SA516-Gr.70steel can be obtained from the Arrhenius-type plot.The activation energies were determined as65and111kJ/mol for the onset and disappearance of serration,respectively as represented in Fig.10.These values fall in the range of published data about the activation energies for the diffusion of carbon and nitrogen in steel[3].
From tensile test results,it can be deduced that the dete-rioration of J–R fracture resistance is due to DSA,but there has been no clear relationship between J–R test results and tensile test results.This fact is due to the dif?culty in describing the local plastic?ow in the crack tip process zone of J–R test specimens.As DSA depends on the strain rate,and also on the temperature,the local strain rate at the crack tip region should be de?ned to explain the fracture properties quantitatively.Unfortunately,there has been no eminent result that quanti?ed the local strain rate at the crack tip in the case of large plastic deformation.This must be due to the fact that there is no general rule to de?ne the crack tip process region.The limited numerical results also strongly depend on the choice of the reference distance from the crack tip.In this study,the effective strain rate at the crack tip region of J–R test specimen was approximately estimated by the following equation in the case of large deformation.Detailed derivation is summarized in the Appendix.
_1eff 1:455 n
_D
L
ah3 a=W;n
1
The loading rates of J–R tests were converted to the effective strain rate calculated by Eq.(1).The J–R test conditions at which J–R fracture toughness becomes a mini-mum are marked in Fig.10.It is noticeable that the mini-mum toughness line is located on the serration disappearing line.The fact is almost identical to that in which the tensile strength appeared as a maximum also at this location.This implies that Eq.(1)can represent the effective strain rate at the crack tip region where the local plastic deformation is de?ned.Conclusively,it could be possible to correlate J–R test results and tensile test results in observation of DSA phenomenon.
J.H.Yoon et al./International Journal of Pressure Vessels and Piping76(1999)663–670
667
Fig.7.Cross-sections of fracture surfaces after J–R test at the loading rate of(a)0.3;and(b)1000mm min?1at316?C.
4.Summary and conclusion
1.The J –R fracture toughness of SA516-Gr.70carbon steel is signi?cantly in?uenced by the loading rate in the operating temperature range of PWR.Par-ticularly,at the normal operating temperature (316?C),the fracture resistance is reduced dramatically at the quasi-dynamic loading rate that corresponds to the seis-mic effect.
2.For a given loading rate,the negative temperature sensi-tivity of J –R fracture resistance changes into a positive one,centered about the critical temperature.
3.Through the fractography of J –R test specimens and tensile tests,that showed the serrated ?ows at the speci?c combinations of test temperature and strain
rate conditions,it can be concluded that the deterioration of SA516-Gr.70is caused by DSA.
4.A simple approximate equation was derived for the effec-tive strain rate at the crack tip deformation region of CT type specimens.The derived equation was adequate in explaining the deformation behaviors at the crack tip region.Hence,it was possible to correlate the J –R test results and tensile test results in investigating the DSA phenomenon.
Acknowledgements
This work has been carried out as a part of Reactor Pres-sure Boundary Materials Project under the Nuclear R&D Program by MOST in Korea.
J.H.Yoon et al./International Journal of Pressure Vessels and Piping 76(1999)663–670
668Fig.8.Stress–strain curves at various strain rates at 177?C.
200
300
400
500
600
700
S t r e s s (M P a )
Strain
Fig.9.Stress–strain curves at various temperature at the strain rate of 8.3×10?2s ?1.
Appendix A.An approximate solution for the strain rate near the crack tip of CT specimens
Several attempts have been made to derive the relation-ship between the local strain rate at a crack tip and the crack tip opening displacement rate (or the applied loading rate).However,many dif?culties are faced in de?ning the local region for determining the effective strain value as the local strain rate very much depends on the position at the crack tip.Here,the authors derive a simple approximate value for the local effective strain rate at the crack tip region,which is based on the analysis method of a fracture mechanics hand-book.
For a Ramberg–Osgood hardening material,the fully plastic solutions for the CT specimen are given by Kumar,German and Shih as ?owing equation [21].J as 010bh 1 a =W ;n P =P 0 n ?1
A :1 D L a10ah 3 a =W ;n P =P 0 n ;
A :2
where P is the applied load per unit thickness,a ,the crack length,W ,the specimen width and b ,the uncracked liga-ment.a and n are the Rambergood–Osgood coef?cients,where the uniaxial stress–strain relationship is described
as the follows
110 s s 0?a s s 0
n
; A :3
where P 0is the limit load per unit thickness and is given by P 0 1:455b b s 0for plane strain A :4
where b is de?ned as in Ref.[22]as
b
2a =b 2?2 2a =b ?2q ? 2a =b ?1 :
A :5
Limit load analysis for CT specimens under gross yield-ing conditions were used in this study [22].If the original analysis by Merkle and Corten is extended to the isotropic strain hardening material,it becomes as shown in Fig.11.In Fig.11,the net tensile stress region exists for an equilibrium with the applied tensile load.The tensile stress in this region increases with the applied load,i.e.with the load-line displacement.If we assume the b -value to be the same as that of perfect plastic material,the strain rate near the crack tip can be calculated by the following equations:P sb b ;
110 a s s 0 n a P s 0b b
n _1 1:455 n
D L
ah 3 a =W ;n
for plane strain :
A :6
For typical values of this material,n 5,a =W 0:6,and h 3 1:852.This produces the effective strain rate at the crack tip to be about 2.0×10?3s ?1when the load-line displacement rate is 1mm min ?1.The estimated strain rates are only about a quarter to a half of the values given by Ku?maul et al.[23]from a detailed dynamic ?nite element method (FEM)analysis.However,the difference may be small compared with the uncertainty of estimation of the crack tip strain rate [24].Note that the estimated strain rate depends on the hardening exponent as well as the crack length.
References
[1]USNRC,Evaluation of Potential for Pipe Breaks,USNRC Report
NUREG-1061,3(1984).
[2]USNRC,Leak Before Break Evaluation Procedure,USNRC Report
NUREG-800,Standard Review Plan.3.6.3(1987).
[3]Keh AS.Dislocation Dynamics,New York:McGraw-Hill,1968.[4]Baird JD,Jamieson A.J Iron Steel Inst 1966;204:793–803.[5]Chakravartty JK et al.J Nucl Mater 1983;119:51–58.
[6]Li DM,Baker A.Metall Mater Trans.1995;26A:2873–2879.
[7]Miglin MT et al.Effects of strain aging in the unloading compliance J
test,ASTM STP 856,ASTM,Philadelphia,1985.
[8]Marchall CW et al.Effect of dynamic strain aging on the strength and
toughness of nuclear ferritic piping at LWR temperatures,USNRC Report NUREG/CR-6226(1994).
[9]Marengo AA,Perez JE.Pressure vessel steel fracture toughness in the
J.H.Yoon et al./International Journal of Pressure Vessels and Piping 76(1999)663–670
669
Fig.10.Serration map which shows serrated ?ow region and relationship between deterioration of J –R property and
DSA.
regime from room temperature to400?C,Nucl Engng Des 1996;167:215–222.
[10]ASTM,Annual Book of ASTM Standards,E1820-96Standard Test
Method for Measurement of Fracture Toughness,ASTM,Philadel-phia,1996.
[11]Wilkowski GM,Maxey WA.Application of the electrical potential
method for measuring crack growth in specimens,?awed pipes pres-sure vessel,ASTM STP791,ASTM,Philadelphia,1981.
[12]Schwalbe KH,Hellman D.JTEVA1981;9:218–221.
[13]Vassilaros MG,Hackett EM.J-integral R-curve testing of high
strength steels utilizing the direct current potential drop method.
ASTM STP833,ASTM,Philadelphia,1984.
[14]Hackett EM et al.,An Evaluation of J–R Curve Testing of Nuclear
Piping Materials using the Direct Current Potential Drop Technique, USNRC Report NUREG/CR-4540(1986).[15]Hong JH et al.,KAERI Report,KAERI/CR-35/97(1997).
[16]Paris PC et al.,The theory of instability of the tearing mode for
elastic–plastic crack growth in elastic–plastic fracture,ASTM STP 668,ASTM,Philadelphia,1979.
[17]Portein A,Le Chatelier https://www.doczj.com/doc/7318821385.html,pt Rend Acad Sci1923;176:507–512.
[18]Kim JW,Kim IS.Nucl Engng Des1997;172:49–59.
[19]Brindley BJ,Barnby JT.Acta Met.1966;14:1765.
[20]Blakemore JS.Hall.E.O.,J Iron Steel Inst1966;204:817.
[21]Kumar V,German MD,Shih CF.An Engineering Approach for Elas-
tic–Plastic Fracture Analysis,EPRI Report NP-1931(1981)., [22]Merkle JG,Corten HT.Transactions of the ASME.J Press Vessel
Technol1974;286–292.
[23]Ku?maul K et al.Nucl Engng Des1997;174:219–235.
[24]Toribio J.British Corrosion J1997;32:41–47.
J.H.Yoon et al./International Journal of Pressure Vessels and Piping76(1999)663–670 670