Postharvest Biology and Technology 58(2010)113–120
Contents lists available at ScienceDirect
Postharvest Biology and
Technology
j o u r n a l h o m e p a g e :w w w.e l s e v i e r.c o m /l o c a t e /p o s t h a r v b i
o
Intact orange quality prediction with two portable NIR spectrometers
JoséA.Cayuela a ,?,Carlos Weiland b
a Instituto de la Grasa,CSIC,Avda.Padre García Tejero 4,41012Sevilla,Spain
b
Departamento de Ciencias Agroforestales,Universidad de Huelva,21819La Rábida,Palos de la Frontera,Huelva,Spain
a r t i c l e i n f o Article history:
Received 10February 2010Accepted 6June 2010Keywords:Acidity
Fruit weight Firmness Juiciness
Maturity index NIR Orange
Soluble solid content
a b s t r a c t
Two commercial portable spectrometers were compared for orange quality non-destructive predictions by developing partial least squares calibration models,re?ectance mode spectra acquisition being used in both.One of them was a Vis/NIR spectrometer in which the radiation re?ected by the fruit is collected and conducted by optic ?ber to the three detectors (350–2500nm)of the instrument.The other is an AOTF-NIR with a re?ectance post-dispersive optical con?guration and InGaAs (1100–2300nm)detector.Four orange varieties were included in calibrations.The parameters studied were soluble solids content,acidity,titratable acidity,maturity index,?esh ?rmness,juice volume,fruit weight,rind weight,juice volume to fruit weight ratio,fruit colour index and juice colour index.The results indicate good perfor-mance of the predictive models,particularly for the direct NIR prediction of soluble solids content,and maturity index,the prediction of this last parameter being notable for its relevance and novelty.The RPD ratios for these parameters were in the range from 1.67to 2.21with the Labspec spectrometer,which showed better predictive performance,and from 1.03to 2.33with the Luminar instrument.
?2010Elsevier B.V.All rights reserved.
1.Introduction
Consumers purchase citrus fruit on the basis of quality,this being a combination of characteristics and attributes signi?cant for acceptability.Citrus are non-climateric fruit,hence the ripening process stops once separated from the tree and,consequently,fruit can only be harvested and marketed once adequate maturity has been reached (Watkins,2008).Moreover,the content of sugars and acids in citrus fruit is fairly stable before and after harvest,sugars-to-acid balance being the key to acceptability in these fruit.The content of sugars is generally measured by refractometry as solu-ble solids content (SSC),sugars representing the main component,and acids content is commonly measured as titratable acidity (TA).The ratio of soluble solids content to titratable acidity (SSC/TA)is widely used as a maturity criterion for non-climateric fruit (Fellars,1991),for the reasons indicated above,and particularly used as a maturity index in citrus.
The contribution of organic acids to the SSC in citrus fruit is in the 10%range.Total acidity prediction by near infrared spec-troscopy (NIR)has been considered dif?cult to achieve,due to the relatively low levels of organic acids in fruit (McGlone et al.,2003;Guthrie et al.,2005).Several authors have reported various levels of success in predicting titratable acidity (TA)of pineapple (Shiina et al.,1993),plum (Onda et al.,1994),apple (Sohn et al.,2000),mango
?Corresponding author.Tel.:+34954611550;fax:+34954616790.E-mail address:jacayuela@ig.csic.es (J.A.Cayuela).(Schmilovitch et al.,2000),Imperial mandarin (Guthrie et al.,2005)and Satsuma mandarin (Hernández et al.,2006).Citrus fruit are anisotropic objects,showing different physical and chemical prop-erties when measured in different directions.Hence,equatorial measurements are reasonable since at least in citrus,SSC is great-est in the distal apex of fruit decreasing towards the proximal,the opposite happening with acids and TA as reported by Peiris et al.(1999).
Colour is considered as one of the most important external fac-tors of fruit quality (Francis,1995),since the fruit’s appearance greatly in?uences the consumer.The change of colour in citrus is a consequence of the maturation process,although it is also highly dependent on cool temperatures at night,not always present under tropical and subtropical growth conditions,which is the reason why a green citrus fruit may or may not be physiologically mature (Olmo et al.,2000).
Fruit softening is often used as a criterion for selecting the most suitable harvest date for several commodities (Lehman-Salada,1996).The most common method to determine the ?rmness of a fruit is destructive and measures its resistance to penetration (Lehman-Salada,1996;Ahumada and Cantwell,1996;Mercado-Silva et al.,1998).Other methods based on fruit resistance to compression do not necessarily destroy the fruit,but they do require its harvest (Polderdijk et al.,1993;Brovelli et al.,1998).Other methods,in addition to being non-destructive,can be used directly on the tree,such as the use of the hand densitometer (García et al.,1998),or those based on the transmission of acoustic waves through the fruit (Muramatsu et al.,1996).In citrus fruit,the
0925-5214/$–see front matter ?2010Elsevier B.V.All rights reserved.doi:10.1016/j.postharvbio.2010.06.001
114J.A.Cayuela,C.Weiland/Postharvest Biology and Technology58(2010)113–120
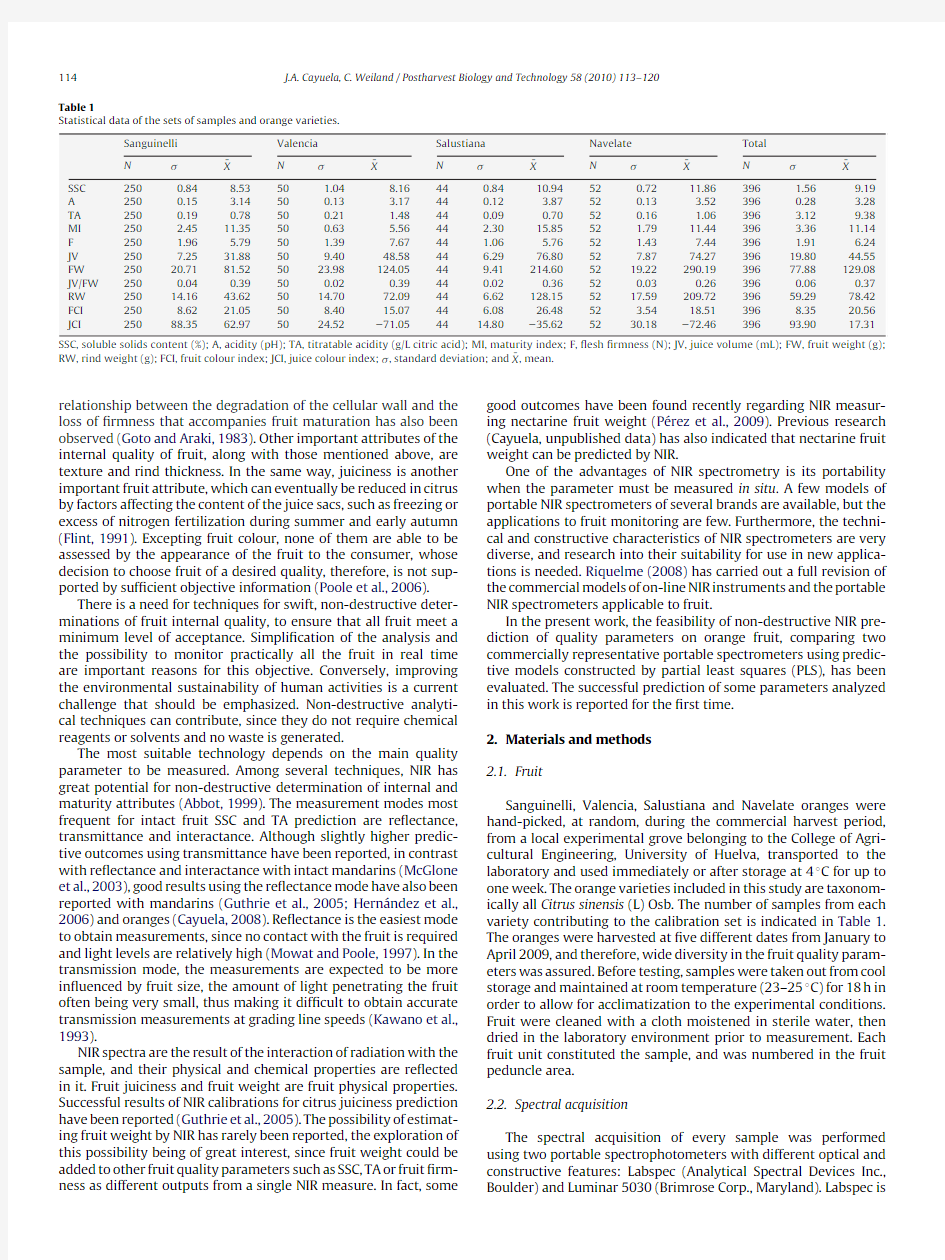
Table1
Statistical data of the sets of samples and orange varieties.
Sanguinelli Valencia Salustiana Navelate Total
N ˉX N ˉX N ˉX N ˉX N ˉX
SSC2500.848.5350 1.048.16440.8410.94520.7211.86396 1.569.19 A2500.15 3.14500.13 3.17440.12 3.87520.13 3.523960.28 3.28 TA2500.190.78500.21 1.48440.090.70520.16 1.06396 3.129.38 MI250 2.4511.35500.63 5.5644 2.3015.8552 1.7911.44396 3.3611.14 F250 1.96 5.7950 1.397.6744 1.06 5.7652 1.437.44396 1.91 6.24 JV2507.2531.88509.4048.5844 6.2976.80527.8774.2739619.8044.55 FW25020.7181.525023.98124.05449.41214.605219.22290.1939677.88129.08 JV/FW2500.040.39500.020.39440.020.36520.030.263960.060.37 RW25014.1643.625014.7072.0944 6.62128.155217.59209.7239659.2978.42 FCI2508.6221.05508.4015.0744 6.0826.4852 3.5418.513968.3520.56 JCI25088.3562.975024.52?71.054414.80?35.625230.18?72.4639693.9017.31
SSC,soluble solids content(%);A,acidity(pH);TA,titratable acidity(g/L citric acid);MI,maturity index;F,?esh?rmness(N);JV,juice volume(mL);FW,fruit weight(g); RW,rind weight(g);FCI,fruit colour index;JCI,juice colour index; ,standard deviation;andˉX,mean.
relationship between the degradation of the cellular wall and the loss of?rmness that accompanies fruit maturation has also been observed(Goto and Araki,1983).Other important attributes of the internal quality of fruit,along with those mentioned above,are texture and rind thickness.In the same way,juiciness is another important fruit attribute,which can eventually be reduced in citrus by factors affecting the content of the juice sacs,such as freezing or excess of nitrogen fertilization during summer and early autumn (Flint,1991).Excepting fruit colour,none of them are able to be assessed by the appearance of the fruit to the consumer,whose decision to choose fruit of a desired quality,therefore,is not sup-ported by suf?cient objective information(Poole et al.,2006).
There is a need for techniques for swift,non-destructive deter-minations of fruit internal quality,to ensure that all fruit meet a minimum level of acceptance.Simpli?cation of the analysis and the possibility to monitor practically all the fruit in real time are important reasons for this objective.Conversely,improving the environmental sustainability of human activities is a current challenge that should be emphasized.Non-destructive analyti-cal techniques can contribute,since they do not require chemical reagents or solvents and no waste is generated.
The most suitable technology depends on the main quality parameter to be measured.Among several techniques,NIR has great potential for non-destructive determination of internal and maturity attributes(Abbot,1999).The measurement modes most frequent for intact fruit SSC and TA prediction are re?ectance, transmittance and interactance.Although slightly higher predic-tive outcomes using transmittance have been reported,in contrast with re?ectance and interactance with intact mandarins(McGlone et al.,2003),good results using the re?ectance mode have also been reported with mandarins(Guthrie et al.,2005;Hernández et al., 2006)and oranges(Cayuela,2008).Re?ectance is the easiest mode to obtain measurements,since no contact with the fruit is required and light levels are relatively high(Mowat and Poole,1997).In the transmission mode,the measurements are expected to be more in?uenced by fruit size,the amount of light penetrating the fruit often being very small,thus making it dif?cult to obtain accurate transmission measurements at grading line speeds(Kawano et al., 1993).
NIR spectra are the result of the interaction of radiation with the sample,and their physical and chemical properties are re?ected in it.Fruit juiciness and fruit weight are fruit physical properties. Successful results of NIR calibrations for citrus juiciness prediction have been reported(Guthrie et al.,2005).The possibility of estimat-ing fruit weight by NIR has rarely been reported,the exploration of this possibility being of great interest,since fruit weight could be added to other fruit quality parameters such as SSC,TA or fruit?rm-ness as different outputs from a single NIR measure.In fact,some good outcomes have been found recently regarding NIR measur-ing nectarine fruit weight(Pérez et al.,2009).Previous research (Cayuela,unpublished data)has also indicated that nectarine fruit weight can be predicted by NIR.
One of the advantages of NIR spectrometry is its portability when the parameter must be measured in situ.A few models of portable NIR spectrometers of several brands are available,but the applications to fruit monitoring are few.Furthermore,the techni-cal and constructive characteristics of NIR spectrometers are very diverse,and research into their suitability for use in new applica-tions is needed.Riquelme(2008)has carried out a full revision of the commercial models of on-line NIR instruments and the portable NIR spectrometers applicable to fruit.
In the present work,the feasibility of non-destructive NIR pre-diction of quality parameters on orange fruit,comparing two commercially representative portable spectrometers using predic-tive models constructed by partial least squares(PLS),has been evaluated.The successful prediction of some parameters analyzed in this work is reported for the?rst time.
2.Materials and methods
2.1.Fruit
Sanguinelli,Valencia,Salustiana and Navelate oranges were hand-picked,at random,during the commercial harvest period, from a local experimental grove belonging to the College of Agri-cultural Engineering,University of Huelva,transported to the laboratory and used immediately or after storage at4?C for up to one week.The orange varieties included in this study are taxonom-ically all Citrus sinensis(L)Osb.The number of samples from each variety contributing to the calibration set is indicated in Table1. The oranges were harvested at?ve different dates from January to April2009,and therefore,wide diversity in the fruit quality param-eters was assured.Before testing,samples were taken out from cool storage and maintained at room temperature(23–25?C)for18h in order to allow for acclimatization to the experimental conditions. Fruit were cleaned with a cloth moistened in sterile water,then dried in the laboratory environment prior to measurement.Each fruit unit constituted the sample,and was numbered in the fruit peduncle area.
2.2.Spectral acquisition
The spectral acquisition of every sample was performed using two portable spectrophotometers with different optical and constructive features:Labspec(Analytical Spectral Devices Inc., Boulder)and Luminar5030(Brimrose Corp.,Maryland).Labspec is
J.A.Cayuela,C.Weiland/Postharvest Biology and Technology58(2010)113–120115 a Vis/NIR spectrometer equipped with three detectors.The detector
for the visible range(350–1000nm)is a?xed re?ective holographic
diode array with a sensitivity of512pixels.Wavelengths in the vis-
ible spectrum can carry information relating to some of the quality
parameters analyzed,such as fruit colour and colour of the juice,
and perhaps additional ones such as fruit size.The wavelength
range of1000–1800nm is covered by a holographic fast scan-
ner InGaAs detector cooled at?25?C.The same aforementioned
device coupled with a high order blocking?lter operates for the
1800–2500nm interval.The instrument is equipped with internal
shutters and automatic offset correction,the scanning speed being
100ms.The acquisition of spectra was performed using the high
intensity contact probe accessory of the spectrometer,with light
source diameter20mm,and standard SMA905?ber optic con-
nectors.The whole spectrum was acquired,each spectral variable
corresponding to2nm interval.The repeatability of the instru-
ment,expressed as standard deviation on the average absorbance
of350–2500nm of?ve measures of a white tile,is6.00×10?4.The
orange spectra acquisition was carried out using Indico Pro soft-
ware(Analytical Spectral Devices Inc.,Boulder).The portability of
the equipment is assured by the weight of the spectrometer8.5kg.
Luminar5030is an AOTF(acousto-optic tunable?lter)NIR spec-
trophotometer,equipped with a re?ectance post-dispersive optical
con?guration and InGaAs(1100–2300nm)detector.The reference
spectrum is automatically taken by the instrument,just as an
UV–Vis spectrophotometer dual beam;the beam is divided before
leaving and a small portion is sent to a second detector that makes
the reference.The scanning speed in Luminar5030is60ms.The
spectrometer is formed by the hand-held unit,shaped and used
similarly to a‘gun’,the diameter of the exit cone of the light source
being8mm,and the computer unit;the spectrometer set,with a
total weight of5.26kg,offers good portability,with4h of autonomy
using a set of batteries that allows in situ measuring on a crop;this
is an important advantage to note.The hand-held unit is equipped
with a base for facultative use in the laboratory.The whole spec-
trum was acquired,each spectral variable corresponding to a2nm
interval.The repeatability of the instrument,expressed as standard
deviation on the average absorbance of1100–2300nm of?ve mea-
sures of a white tile,is6.76×10?4.The signals were acquired with
software Acquire(Brimrose Corp.,MD).
The sample unit was the fruit,an averaged spectrum being
obtained for each sample,resulting from a total100spectra
corresponding to two measures of50spectra each,it,for both
spectrometers,was taken at opposite equatorial locations.
2.3.Reference analysis
The quality attributes of each fruit were evaluated by analysis of
their physical and chemical parameters.Additionally,parameters
calculated arithmetically were assessed.
2.3.1.Physical parameters
Fruit weight(FW,g)and rind weight(RW,g)were measured
using an electronic precision balance(0.001g).RW was deter-
mined once the fruit was peeled by separating the rind from the
?esh.For the measurement of intact fruit colour a spectral colour
analyser(colorimeter PCE-RGB1002)was used,with triplicate
measurements for each fruit.This instrument has a RGB(red,green,
blue)colour scale0-1023.The Easy-RGB software(Logicol Colour
Technology Co.)was used for the conversion into the L,a and b
parameters of the Hunter scale.The results expressed by the colour
index(FCI)were obtained from the mathematical formula(1).
CI=1000a
(1)
Flesh?rmness(F,N)was quanti?ed using a hand penetrom-
eter(TR FT-327Turoni S.r.l.,Forcy,Italy)with a7mm diameter
cylindrical plunger,twice on the peeled fruit at the equatorial cir-
cumference.The fruit were halved through the equatorial plane
and juice extracted with a commercial juice extractor.Juice vol-
ume(JV,mL)was measured with a test tube.Juice volume to fruit
weight ratio was calculated and expressed as a percentage(JV/FW,
%).Juice colour was determined with the same colorimeter and
units indicated above for fruit colour and expressed as juice colour
index(JCI).The measurement was performed on a juice sample of
each individual orange fruit in a Petri dish,this measurement being
made through the glass at the bottom of the dish.This procedure
was used to avoid the risk of any introduction in the juice of the
colorimeter light source.
2.3.2.Chemical parameters
SSC was measured on juice of each fruit by a hand-held digital
refractometer(Atago Co,PAC-1Brix-Meter,Tokyo)and obtained
from two replicates,expressed as percentage.
Acidity(A,pH)was measured on the juice of individual fruit from
two replicates,using a digital pH-meter.The titratable acidity(TA)
was analogously measured from two replicates by direct titration of
a10mL juice sample added with10mL distilled water,neutralized
with NaOH0.1N until pH8.2and expressed as citric acid(g/L).
2.3.3.Arithmetically calculated parameters
The maturity index reference(MI)was arithmetically obtained
from the ratio between SSC and TA reference analysis values.The
arithmetical computation from SSC and TA obtained using the NIR
predictive models developed in this work for both parameters
(SSC P/TA P)was compared with the prediction outcomes from the
model developed for directly predicting MI.
2.4.Chemometrics and calibration procedures
Partial least squares models were obtained with Unscrum-
bler9.7(CAMO Software AS,Norway).For the Labspec spectra,
noise intervals350–499nm and2301–2500nm were removed.In
turn,tests were carried out for the same spectrometer excluding
600–750nm,a range strongly affected by the skin pigment chloro-
phyll that absorbs red light,whose absorbance band corresponds
to680nm.This band is not included in the Luminar’s wavelength
range.Exclusion of the initial and?nal areas of spectrum to elimi-
nate noise,in the case of Luminar was also considered unnecessary.
Before calibrations,the re?ectance data were transformed to
absorbance,mean normalized,and optionally treated by mul-
tiplicative scatter correction(MSC)using Unscrumbler9.7.The
in?uence of the pre-processing on the prediction of the calibration
models was tested by different gap and smooth combinations for
?rst and second gap-segment derivatives.Standard normal variate
transformation(SNV)was also tested.Full-cross internal validation
(FCV)was used for building the models.Calibration tests were also
conducted with different numbers of principal components in order
to determine the number of PCs optimum and the results assessed
in terms of standard error of cross validation(SECV).Exception-
ally,where indicated in the tables,points clearly separated from
the calibration sets in the scatter plots were identi?ed as outliers
and removed with Unscrumbler9.7using its speci?c application
for this purpose.
2.4.1.Validation procedure
Two external validation exercises were carried out using the cor-
responding models for predicting the parameters.One validation
exercise was conducted using1/5of the total number of samples
for each parameter,the set for validation being formed by Unscrum-
bler’s speci?c application,the?rst from every5samples taken
116J.A.Cayuela,C.Weiland /Postharvest Biology and Technology 58(2010)
113–120
Fig.1.(A)Labspec and (B)Luminar 5030.Examples of absorbance spectra from the same ?ve oranges.
for this purpose (V1).Another exercise was conducted for the set of samples 51–100,corresponding to Sanguinelli (V2),which was excluded from the corresponding calibrations that were developed previously for this purpose.
In assessing the soundness of the calibrations performance,the main considerations were the root mean square error of prediction (RMSEP)and the residual predictive deviation (RPD),described by Williams and Sobering (1996)as the ratio of the standard deviation of the reference data for the validation set to the SEP.
Paired samples T -tests for dependent samples were also con-ducted to verify the results from RPD and RMSEP analysis.Not established as a statistic speci?cally for assessing PLS model per-formance,the T -test was applied here exclusively referred to the data pairs included in the external validation exercise.For this pur-pose,data pairs of the reference value and the resulting prediction corresponding to the external validation sets were compared.The paired T -test is a parametric procedure,useful for testing whether the means of two groups are different,where the samples are drawn in pairs.The T -test was carried out using SPSS Statistics software (SPSS Inc.,Chicago).The compliance with the null hypothesis in this test (P >0.05)indicates that the measure NIR provides at least the same accuracy as the reference method.
The prediction output from the calibration model for direct NIR MI measuring was compared both with the reference values and with SSC P /TA P above described,also using the paired samples T -test.3.Results
3.1.Fruit NIR spectra
Typical diffuse absorbance spectra for intact oranges acquired by both instruments (Labspec and Luminar 5030)are shown in Fig.1.The spectra from the two instruments showed characteristics simi-lar to those also previously described in oranges (Cayuela,2008)or in Satsuma mandarin (Hernández et al.,2006)beyond differences regarding the wavelengths acquired.
High intensity peaks are noted,related to the strong water absorbance bands present from their ?rst overtone at 1400–1500nm and combination band at 1880–2100nm with an interval of relative intensities of high absorption,approximately between 1400and 2200nm.Absorbance falls around the 1500nm and rises again from approximately 1850nm where oscillation exists probably due to carbohydrates.Overall,the pattern of the absorption curves is similar to that for other fruit such as peach (Peiris et al.,1997),kiwifruit (McGlone and Kawano,1998),mango (Budiastra et al.,1998),apple (Lu et al.,2000)and cherry (Lu,2001).3.2.Population characterization
The mean and standard deviation values of the populations of orange varieties used in the calibrations and the external valida-tions for the parameters analyzed are shown in Table 1.The MI in the different varieties shows that Valencia oranges corresponded to a less advanced stage of maturation,Sanguinelli and Navelate being at approximately the same maturity stage and Salustiana show-ing,according to its MI ratio,the most advanced maturity of the four varieties.As can be seen,wide ranges of variation of all the parameters analyzed were included in the populations.
The characteristics of the sample sets used for the validation exercises,conducted using models obtained for predicting each parameter in samples independent from the calibrations sets,are shown in Table 2.The contribution of each variety to the validation sets were 50Sanguinelli,10Valencia,9Salustiana and 10Nave-late samples,according to the proportion 1/5regarding calibration sets.
3.3.Calibration development
The statistical coef?cients of best calibration models with Lab-spec and Luminar 5030for predicting orange quality parameters according to the treatment used for the two instruments tested,are given in Tables 3and 4,respectively.
Table 2
Statistical data of the sets of samples used in V1.Parameter Samples Range
ˉX SSC 76 5.5–12.4 1.599.08A 76 1.1–3.90.28 3.27TA 750.6–2.60.290.91MI 75 4.0–16.7 3.2210.85F 76 1.5–11.7 1.93 5.96JV 7418.0–88.020.5845.00FW 7547.4–311.479.19127.08JV/FW 760.2–0.50.060.37RW 7618.5–228.560.076.5FCI 728.7–31.0 4.6420.54JCI
76
?141.9–223.487.40
16.40
SSC,soluble solids content (%);A,acidity (pH);TA,titratable acidity (g/L citric acid);MI,maturity index;F,?esh ?rmness (N);JV,juice volume (mL);FW,fruit weight (g);
RW,rind weight (g);FCI,fruit colour index;JCI,juice colour index; ,standard Deviation;and ˉX
,mean.
J.A.Cayuela,C.Weiland/Postharvest Biology and Technology58(2010)113–120117
Table3
Labspec:statistics of calibrations and validations(wavelength500–2300nm).
Parameter Treatment Calibration Validation
PCs Outl.RMSECV R R CV RMSEP RPD T
SSC MN1000.600.920.910.74 2.130.719
A MN,MSC1040.120.900.880.15 1.850.714 TA MN1000.160.860.830.17 1.690.978 MI MN80 1.810.850.81 1.92 1.670.765 FW MN,MSC10219.890.970.9616.52 4.760.716
F MN73 1.180.760.72 1.05 1.850.356 JV MN937.390.920.917.05 2.940.511 JV/FW MN,MSC930.030.890.870.04 1.610.327 RW MN10214.610.970.9612.98 4.540.349 FCI MN,MSC80 3.450.900.87 2.65 1.750.055 JCI MN,MSC100 1.590.860.8366.78 1.310.286
SSC,soluble solids content(%);A,acidity(pH);TA,titratable acidity(g/L citric acid);MI,maturity index;F,?esh?rmness(N);JV,juice volume(mL);FW,fruit weight(g);RW, rind weight(g);MN,mean normalization;MSC,multiplicative scatter correction;Outl.,outliers;RMSEC,root mean square error of calibration;R,coef?cient of calibration; R CV,coef?cient of cross validation;RMSEP,root mean square error of prediction;RPD,residual predictive deviation;and T,P-value from paired samples test.
Table4
Luminar5030:statistics of calibrations and validations(wavelengths1100–2300nm).
Parameter Treatment Calibration Validation
PCs Outl.RMSECV R R CV RMSEP RPD T
SSC MN,MSC1000.670.910.890.68 2.330.273
A MN,MSC1010.150.840.810.16 1.750.931 TA MN1020.180.800.770.19 1.540.321 MI MN,MSC91 2.060.790.74 1.96 1.640.313 FW None9322.690.960.9526.26 3.030.414
F MSC100 1.270.710.66 1.39 1.390.280 JV MN,MSC927.970.910.918.00 2.560.977 JV/FW MSC910.030.830.800.04 1.670.148 RW None9217.070.960.9518.86 3.230.249
SSC,soluble solids content(%);A,acidity(pH);TA,titratable acidity(g/L citric acid);MI,maturity index;F,?esh?rmness(N);JV,juice volume(mL);FW,fruit weight(g);RW, rind weight(g);MN,mean normalization;MSC,multiplicative scatter correction;Outl.,outliers;RMSEC,root mean square error of calibration;R,coef?cient of calibration; R CV,coef?cient of cross validation;RMSEP,root mean square error of prediction;RPD,residual predictive deviation;and T,P-value from paired samples test.
The range from600to750nm could be affected by the skin pigment chlorophyll,as has been previously indicated.Calibra-tion tests were conducted with the Labspec excluding this range, without any improvement when including it.This result probably re?ects the fact that no green areas were present in the skin of any of the orange samples used in the calibrations.This test was unnec-essary with the Luminar,since its spectral range does not include 600–750nm.
The calibration statistics for V1were relatively close with both instruments for SSC,A,MI,JV and JV/FW.Hence,with the Lab-spec the RMSECV were0.60,0.12,1.81,7.39and0.03,whereas for the Luminar they were0.67,0.15,2.06,7.97and0.03,respec-tively for these parameters(Tables3and4).Some differences were found between both spectrometers for FW,RW and F,the Labspec showing RMSECV19.89,14.61and1.18,whereas for the Luminar it was22.69,17.07and1.27.In all the cases,the lower RMSECV values from the Labspec imply a better predictive per-formance for these parameters.Calibration for FCI and JCI was attempted only with the Labspec,since it integrates visible and NIR.
Generally,mean normalized data provided the best?ts for most parameters analyzed.In some cases,shown in Tables3and4,in both or either spectrometers,MSC treatment alone or after mean normalization facilitated the best calibration coef?cients.
3.4.Model external validation
The outcomes from the external validation exercises V1for each orange quality parameter with both spectrometers are shown in Tables3and4.The predictions versus the analyzed value of each parameter in this external validation exercise are shown in Fig.2.
As can be seen from the validation plots,and according to the validation coef?cients RMSEP and RPD shown in Tables3and4, prediction accuracy was similar for most fruit quality parameters with both spectrometers and slightly better with the Labspec for FW,RW and F.
The validation exercise V2,corresponding to Sanguinelli,pro-vided better performance for all the parameters analyzed with the Labspec.The statistical values are shown in Table5.The best RPD with the same spectrometer in this exercise were reached for SSC and MI predictions.
Table5
Validation V2(N=50;wavelength500–2300nm).
Labspec Luminar5030 Parameter RMSEP RPD RMSEP RPD SSC0.87 2.21 1.12 1.03 A0.13 1.050.400.80 TA 2.47 1.26 2.07 1.07 MI 1.54 1.75 2.57 1.26 FW43.51 1.1132.630.75 F 1.82 1.20 1.53 1.03 JV8.38 1.1012.130.84 JV/FW0.04 1.180.05 1.10 RW16.07 1.1114.710.73 FCI 6.48 1.64
JCI55.690.67
SSC,soluble solids content(%);A,acidity(pH);TA,titratable acidity(g/L citric acid); MI,maturity index;F,?esh?rmness(N);JV,juice volume(mL);FW,fruit weight (g);RW,rind weight(g);RMSEP,root mean square error of prediction;RPD,residual predictive deviation;and N,number of samples of the validation set.
118J.A.Cayuela,C.Weiland /Postharvest Biology and Technology 58(2010)
113–120
Fig.2.External validation plots V1:(A)Labspec and (B)Luminar 5030.RPD values at the lower right corner.
4.Discussion
The external validation exercise V1carried out for SSC showed analogous accuracy with both spectrometers,as can be deduced from the RPD ratios.
The values RMSEP in the validations V1and V2for SSC 0.74and 0.87(Labspec)or 0.68and 1.12(Luminar)were higher than those previously reported by Cayuela (2008)for Valencia Late orange and using re?ectance (570–1850nm)with a non-portable Vis-NIR spec-trometer InfraXact (Foss),where RMSEP 0.55is reported.In that work the direct NIR prediction of MI was not addressed.
For A,TA and MI the accuracy were similar in the V1validation exercise for the Labspec (Table 3)and the Luminar (Table 4)spec-trometers.The validation V2conducted with a Sanguinelli fruit set (Table 5)showed lower RPD values for all these parameters and both spectrometers,excepting for MI with the Labspec.The RPD values were higher for the Labspec in this exercise,hence showing better performance.For a Fantec-FQA,from the SEP and for pH and TA reported by Riquelme (2008)RPD values 0.68and 0.56can be deducted using internal software for mandarins and oranges,as well 0.79and 0.37for the same fruit using calibration developed by the author,these values being lower than those reported in this work.
Several other results have been reported with Satsuma man-darin (Hernández et al.,2006)also using re?ectance and with Imperial mandarin using other optical modes (McGlone et al.,2003;
J.A.Cayuela,C.Weiland/Postharvest Biology and Technology58(2010)113–120119
Guthrie et al.,2005).However,a comparison is not recommended because oranges are larger in size,having a different structure to mandarin fruit.Moreover,literature about using NIR spectroscopy for SSC and pH measurement in several fruit is extensive,as men-tioned in Section1,thus the aim here was not to demonstrate this possibility or the industrial application.
The RPD coef?cients from the external validations for SSC,A and TA were between0.80and2.33with both spectrometers.For reference,RPD ranging from0.12to0.56were reported using a Fantec-FQA for the same parameters(Riquelme,2008).Models con-structed with both spectrometers were able to determine SSC and A in V1with an accuracy approaching95%,according to an arith-metic calculation of the difference between the values estimated by NIR and reference values(data not shown).The external validation V1with the calibration for the ratio MI showed very similar val-ues RPD in both spectrometers,these being1.67with the Labspec and1.64with the Luminar.The exercise V2showed for the same coef?cient an RPD of1.75with the Labspec,higher than1.26with the Luminar.Riquelme(2008)reported an RPD of0.25for the same parameter and also in oranges using a Fantec-FQA,but not much information has been reported regarding direct NIR prediction of MI in citrus.
The predictions obtained in the exercises V1and V2with the models for NIR measuring MI directly were compared using a paired sample test T both with reference analysis values and with the arith-metical computation from SSC and TA independent NIR obtained (SSC P/TA P).No signi?cant differences were found in V1between MI predictions and references(sig.0.629)while on the contrary, there were signi?cant differences between SSC P/TA P and references (P=0.039).A similar result was found with the V2exercise(data not shown).Therefore,MI is easily and accurately obtained from the reference analysis values,but the arithmetical computation of MI would give worse results if these values are to be obtained by NIR(SSC P/TA P),which will be the case when using a NIR spectrom-eter in routine analysis.Therefore,the use of models for direct NIR MI prediction is advantageous.As the SSC/TA ratio constitutes the most widely used MI,the possibility of its NIR prediction in real time is of great interest,regardless of the SSC and TA values,which are also NIR measured at the same time.
On the other hand,this study revealed that NIR prediction of MI, more interesting than titratable acidity by itself,was more accurate than NIR prediction of TA,as revealed in the V1exercise by the RPD for both parameters MI and TA,included in Table3(Labspec)and Table4(Luminar),and in the V2exercise(Table5)for both spec-trometers.From these results it appears that it is a methodology suitable for avoiding the dif?culty of accurately predicting TA by NIR,as described by various authors(McGlone et al.,2003;Guthrie et al.,2005),since it is possible to predict the MI ratio directly by NIR.
The high accuracy of the predictive calibrations for fruit weight and rind weight in the V1exercise must be highlighted since it allows measurement of these parameters by NIR spectroscopy in citrus.Fruit weight NIR measurements are scarcely mentioned in the literature,even for other fruit.This accuracy is referred to each weight measurement on a single fruit,it being essential for the industry to ensure that all the fruit included in each bag or box has a minimum suitable size or weight.The RPD from the external val-idation reached with the Labspec for fruit weight and rind weight in the V1exercise were4.76and4.54,and with the Luminar,3.03 and3.23,the values in all cases being higher than three,the value that ideally should be reached to ensure the goodness of a model (Williams and Sobering,1996).
Regarding juice volume models in V1validation,they were fairly accurate,coef?cients being very close in both spectrometers,as shown in Tables3and4.Both spectrometers showed RPD near to three in this exercise,revealing good performance.Although the volume of orange juice is not generally included in trade rules for citrus fruit,and the accuracy level needed has not even been de?ned,nevertheless it is a very interesting quality parameter to be monitored in each single fruit,as Riquelme(2008)reported,since citrus can eventually suffer from juiciness defects.
The external validation V1for the ratio JV/FW with both the Labspec(Table3)and the Luminar(Table4)showed RPD values higher to1.5and lower to2,which are not optimal but reveal a good predictive potential of these models.
Fruit?esh?rmness showed an RPD of1.85in the V1external val-idation with the Labspec.The ability for NIR to estimate orange?esh ?rmness with suf?cient accuracy is also of great interest,since it could be used as a maturity index(Olmo et al.,2000),although more research is needed about the relationship between orange?rmness and maturity stage to establish maturity indices based upon this parameter on speci?c varieties.The accuracy level reached in V1 with the Labspec for?esh?rmness was83.9%,and79.0%with the Luminar,according to an arithmetic calculation of the difference between the values NIR estimated and reference values(data not shown).
The external validation V1for FCI corresponding to the Labspec provided low and relatively good accuracy RMSEP values,with an RPD of1.75.This last value indicates differences between model prediction and reference analysis of approximately10%,on average.
The statistical coef?cients of the external validation V1for pre-dicting JCI(RPD1.31)revealed that model performance was far from good.However,the paired T-test determined no signi?cant differences between predictions and reference values.This fact could be related with some possible inconsistent reference values that may be attributed to the methodology used for measuring juice colour,and particularly the inclusion of the Petri dish bottom in the juice colour measurement needing to be improved.
However,considerable disagreement was found in the statistics between both validation exercises V1and V2conducted with both spectrometers for FW,F and JV.The RPD values were clearly lower for these parameters in the exercise V2.The RPD reached for the JV/FW,FCI and JCI in the V2exercise were also lower than in V1. This shows that the predictive potential of the technique for these parameters,when measuring a set of samples not considered in the calibrations,can be lower than expected.
Most quality orange fruit parameters showed an RPD ratio lower than three,the value considered as the threshold for an optimal validation(Williams and Sobering,1996).However,consideration of other criteria in the external validation exercises,such as a paired test T for all parameters studied,indicated no signi?cant differences between the laboratory reference and the NIR determined values, which means that NIR was at least as accurate as the reference methodologies.This was particularly the case with the colour index, with a value of P=0.055,which is the limit of signi?cance,therefore reference and NIR measure were very near to being different in this parameter.
The better statistical coef?cients from calibration and exter-nal validation using the Labspec can be due to the contact probe used in spectra acquisition with this spectrometer,presenting a light source diameter(20mm)larger than that of the Luminar 5030(8mm),and therefore the area of the fruit surface illuminated being different in both cases.This factor contributes to our ability to explore a larger portion of the fruit in the case of the Labspec spectrometer.
Acknowledgements
This work includes results of a research contract funded by Bonsai Advanced Technologies,S.L.(Madrid,Spain).Research par-tially?nanced by the‘Citrisaude’INTERREG III-A European research project.
120J.A.Cayuela,C.Weiland/Postharvest Biology and Technology58(2010)113–120
References
Abbot,J.A.,1999.Quality assurement of fruits and vegetables.Postharvest Biol.Tech-nol.15,207–225.
Ahumada,M.,Cantwell,M.,1996.Postharvest studies on pepino dulce(Solanum muricatum Ait.):maturity at harvest and storage behaviour.Postharvest Biol.
Technol.7,129–136.
Brovelli,E.A.,Brecht,J.K.,Sherman,W.B.,Sims,C.A.,1998.Potential maturity indices and developmental aspects of melting-?esh peach genotypes for fresh market.
J.Am.Soc.Hort.Sci.123,438–444.
Budiastra,W.,Ikeda,Y.,Nishizu,T.,1998.Prediction of individual sugars and malic acid concentrations of apple and mangoes by NIR re?ectance system.J.JSAM60, 117–212.
Cayuela,J.A.,2008.Vis/NIR soluble solids prediction in intact oranges(Citrus sinensis L.)cv.Valencia Late by re?ectance.Postharvest Biol.Technol.47, 75–80.
Fellars,P.J.,1991.The relationship between the ratio of degrees Brix to percent acid and sensory?avor in grapefruit juice.Food Technol.45,68–75.
Flint M.L.,1991.Frost damage.In:University of California(Ed.),Integrated Pest Management for Citrus.Oakland,p.122.
Francis,F.J.,1995.Quality as in?uenced by colour.Food Qual.Prefer.6,149–155. García,J.M.,Medina,R.J.,Olías,J.M.,1998.Quality of strawberries automatically packed in different plastic?lms.J.Food Sci.63,1037–1041.
Goto, A.,Araki, C.,1983.Chemical composition and internal anatomy of the gelated and granulated juice sacs of Sanbokan fruit.J.Jpn.Soc.Hort.Sci.52, 316–324.
Guthrie,J.A.,Walsh,K.B.,Reid,D.J.,Liebensberg,C.J.,2005.Assessment of internal quality attributes of mandarin fruit:1.NIR calibration model development.Aust.
J.Agric.Res.56,405–416.
Hernández,A.,He,Y.,García,A.,2006.Non-destructive measurement of acidity, soluble solids and?rmness of Satsuma mandarin using vis/NIR-spectroscopy techniques.J.Food Eng.77,313–319.
Kawano,S.,Fujiwara,T.,Iwamoto,M.J.,1993.Nondestructive determination of sugar content in Satsuma mandarin using near infrared(NIR)transmittance.J.Jpn.Soc.
Hort.Sci.62,465–470.
Lehman-Salada,L.,1996.Instrument and operator effects on apple?rmness read-ings.HortScience31,994–997.
Lu,R.,Guyer,D.E.,Beaudry,R.M.,2000.Determination of?rmness and sugar content of apple using NIR diffuse re?ectance.J.Text.Stud.31,615–630.
Lu,R.,2001.Predicting?rmness and,sugar content of sweet cherries using near infrared diffuse re?ectance spectroscopy.Trans.ASAE44, 1265–1271.
McGlone,V.A.,Kawano,S.,1998.Firmness,dry-matter and soluble-solids assess-ment of post-harvest kiwifruit by NIR spectroscopy.Postharvest Biol.Technol.
13,131–134.
McGlone,V.A.,Fraser,D.G.,Jordan,R.B.,Künnemeyer,R.,2003.Internal quality assessment of mandarin fruit by vis/NIR spectroscopy.J.NIR Spectrosc.11, 323–332.Mercado-Silva,E.,Benito-Bautista,P.,García-Velasco,M.A.,1998.Fruit develop-ment,harvest index and ripening changes of guavas produced in Central Mexico.
Postharvest Biol.Technol.13,143–150.
Mowat, A.D.,Poole,P.R.,https://www.doczj.com/doc/7218273679.html,e of visible-near infrared diffuse re?ectance spectroscopy to discriminate between kiwifruit with properties altered by pre-harvest treatments.J.NIR Spectrosc.5,113–122.
Muramatsu,N.,Kiyohide,K.,Tatsushi,O.,1996.Relationship between texture and cell wall polysaccharides of fruit?esh in various species of citrus.HortScience 31,114–116.
Olmo,M.,Nadas,A.,García,J.M.,2000.Non-destructive methods to evaluate matu-rity level of oranges.J.Food Sci.65,365–369.
Onda,T.,Tsuji,M.,Komiyama,Y.,1994.Possibility of non-destructive determi-nation of sugar content,acidity and hardness of plum fruit by near-infrared spectroscopy.J.Jap.Soc.Food Sci.Technol.41,909–912.
Peiris,K.H.S.,Dull,G.G.,Lef?er,R.G.,Kays,S.J.,1997.Non-destructive determination of soluble solids content of peach by near infrared spectroscopy.In:NRAES(Ed.), Sensors for Non-destructive Testing International Conference and Tour.Orlando, Florida,pp.77–87.
Peiris,K.H.S.,Dull,G.G.,Lef?er,R.G.,Kays,S.J.,1999.Spatial variability of soluble solids or dry matter content within individual fruits,bulbs,or tubers:implica-tions for the development and use of NIR spectrometric techniques.HortScience 34,114–118.
Pérez,D.,Sánchez,M.T.,Paz,P.,Soriano,M.A.,Guerrero,J.E.,Garrido,A.,2009.Non-destructive determination of quality parameters in nectarines during on-tree ripening and postharvest storage.Postharvest Biol.Technol.52,180–188. Polderdijk,J.J.,Tijskens,L.M.M.,Robberts,J.E.,Van der Valk,H.C.P.,1993.Predictive models of keeping quality of tomatoes.Postharvest Biol.Technol.2,179–185. Poole,N.D.,Martínez-Carrasco,L.,Vidal,F.,2006.Quality perceptions under evolving information conditions:implications for diet,health and consumer satisfaction.
Food Policy32,175–188.
Riquelme,M.T.,2008.Transmisionóptica e imagen en visible e infrarrojo en frutas.
Ensayo de equipos comerciales.Tesis Doctoral.ETSIA,Universidad Politécnica de Madrid.
Schmilovitch,Z.,Mizrach,A.,Hoffman,A.,Egozi,H.,Fuchs,Y.,2000.Determination of mango physiological indices by near-infrared spectrometry.Postharvest Biol.
Technol.19,245–252.
Shiina,T.,Ijiri,T.,Matsuda,I.,Sato,T.,Kawano,S.,Ohoshiro,N.,1993.Determination of brix value and acidity in pineapple fruits by near infrared spectroscopy.Acta Hort.334,261–272.
Sohn,M.R.,Park,K.S.,Cho,S.I.,2000.Near infra-red re?ectance spectroscopy for non-invasive measuring internal quality of apple fruit.Near Infrared Anal.1, 27–30.
Watkins,C.B.,2008.Postharvest ripening regulation and innovation in storage tech-nology.Acta Hort.796,51–58.
Williams,P.,Sobering,D.,Davies,A.M.C.,Williams,P.,1996.How do we do it:a brief summary of the methods we use in developing near infrared calibrations.
In:Near Infrared Spectroscopy:The Future Waves.NIR Publications,Chichester, pp.185–188.
Eviews7中的图形操作 Wfcreate wfopen wfselect wfstats wfsave 一、图形的分类 1.线条图,如errbar、hile、line、spike 2.填充图,如area、bar、pie 3.XY图,如xy、xyline、xypair、scat 4.统计图,如boxplot、cdfplot、hist、distplot kernel、qqplot 5.其他对象的特有图形,如方程对象的置信椭圆cellipse 图形能方便地实现数据和计量分析结果的可视化。图形对象包含对象的图形视图和图形对象。可以把图象视图定格成图形对象再进行修改。二、创建图形对象 图形可以用graph命令创建,也可以从其他对象的图形视图定格而来。 如graph gf.line gdp(或graph gf gdp,默认为线条图) 用freeze命令把其他对象的图形视图定格成图形对象。 如freeze(gf) gdp.line merge命令是合并已有的图形对象 freeze(g1) gdp.line show g1 graph g2.bar m1 show g2 graph g3.merge gf gg show g3 多个子图,用align命令设置排列方式,例如
Graph gfan.line(m) log(gdp) log(m1) rs Gfan.align(2,1.5,1) 三、定制图形 图形对象可以通过程序修改的部分有:线型(pattern)和填充,图例(legend)和图框(frame),坐标轴,还可以在图形对象上增加文本、线和阴影等。 1.图框 使用options 命令,例如 graph gf1.line rs Copy gf1 gf2 Gf2.options indent (缩进) Copy gf1 gf3 Gf3.options –inbox (去掉边框) Copy gf1 gf4 Gf4.options size(8,3)(修改为8,3虚拟英寸) 4 5 6 7 8 LOG(GDP) LOG(M1) 4 8 12 16 RS
Orange PI GPIO控制详细教程 一、sysfs方式 通过sysfs方式控制GPIO,先访问/sys/class/gpio目录,向export文件写入GPIO编号,使得该GPIO的操作接口从内核空间暴露到用户空间,GPIO的操作接口包括direction和value 等,direction控制GPIO方向,而value可控制GPIO输出或获得GPIO输入。文件IO方式操作GPIO,使用到了4个函数open、close、read、write。 首先,看看系统中有没有“/sys/class/gpio”这个文件夹。如果没有请在编译内核的时候加入Device Drivers-> GPIO Support ->/sys/class/gpio/…(sysfs interface)。 /sys/class/gpio 的使用说明: gpio_operation 通过/sys/文件接口操作IO端口GPIO到文件系统的映射 ◇控制GPIO的目录位于/sys/class/gpio ◇/sys/class/gpio/export文件用于通知系统需要导出控制的GPIO引脚编号 ◇/sys/class/gpio/unexport 用于通知系统取消导出 ◇/sys/class/gpio/gpiochipX目录保存系统中GPIO寄存器的信息,包括每个寄存器控制引脚的起始编号base,寄存器名称,引脚总数导出一个引脚的操作步骤 ◇首先计算此引脚编号,引脚编号= 控制引脚的寄存器基数+ 控制引脚寄存器位数 ◇向/sys/class/gpio/export写入此编号,比如12号引脚,在shell中可以通过以下命令实现,命令成功后生成/sys/class/gpio/gpio12目录,如果没有出现相应的目录,说明此引脚不可导出 ◇direction文件,定义输入输入方向,可以通过下面命令定义为输出。direction接受的参数:in, out, high, low。high/low同时设置方向为输出,并将value设置为相应的1/0 ◇value文件是端口的数值,为1或0 几个例子: 1. 导出 /sys/class/gpio# echo 44 > export 2. 设置方向 /sys/class/gpio/gpio44# echo out > direction
教你怎样用SkinMagicBuilder制作皮肤 椐我所知,设计软件皮肤好像从来不是程序员擅长干的工作。不过我也调查过,很多程序员朋友对皮肤的制作还是满有兴趣的。在这个部分,我专门用我制作的一个软件皮肤为例,从头到尾的给你讲解一遍。其中包括皮肤的画法,皮肤的定制和皮肤的嵌入。如果你有兴 趣,那么就跟着我来做一个皮肤试试吧! 工预善其事,必先利其器。我们先谈谈制作皮肤需要的工具吧。首先我使用的编程语言是VC++,所以皮肤的嵌入软件,自然也选定是专门制作给VC++的了。我使用的这个软件叫做SkinMagic,有很多朋友通过各种途径得到过这个软件。不过这个软件是个共享软件,而且每一个注册码对应一个软件皮肤,收费高达89美元(我曾经买过几个,吐血!),但是确实非常好使。其实就我所知,很多共享软件的作者都使用这个软件(而且也曾经跟我一样吐过血~)。用它作为皮肤的嵌入软件的原因当然是非常地容易制作啦。(现在已经有破解版本了)有了这个工具之后我们还要面有PhotoShop(以下简称PS)来进行皮肤主体的勾画。 我还要说的是颜色搭配。在这个例子中,因为我很喜欢橙色,所以自然选择橙色作为主体颜色,那么什么颜色能和橙色放在一起比较漂亮?这是问题的关键,我很幸运,著名的NIKE公司的LOGO为我很好的解释了这个原理。 不难看出灰色,黑色,还有白色都是和橙色很好的搭配在一起,所以我们就选择这几个颜色作为皮肤的制作颜色! 好了,开始实战! 第一步,轮廓与着色 首先,打开你的PS,新建一个文件,宽度为495,高度为406,分辨率为72。然后点击图层菜单,新建图层背景。接着在工具栏里点击油漆桶工具,选择颜色为R=255,B=0,G=255。用油漆桶工具填充背景。我们这样做的目的是填充一个固定的背景色,你看过电影的特技拍摄吧,后面放了一幅大蓝布,然后演员在那里摆POSE,最后再用电脑合成。一个道理,我们也是这样,只不过我们放的是一块大粉布,哈哈。 下面,我们要绘制一个窗体。在工具栏里点住矩形工具,会看到出现一个下拉菜单,选择圆角矩形工具。在大粉布上画上这个圆角矩形。取名就叫默认的形状1。 再次使用圆角矩形工具,在刚才的矩形前画一个小一点的矩形,这次我们要拖动鼠标的同时按住减号,然后你会发现我们得到一个窗口外框子。
第五章绘图: 作图有两个软件包。(1)图形软件包,用with(plots)调入。(2)图形工具包with(plottools) 图形包)中有下列作图命令: animate, animate3d动画changecoords改变坐标系complexplot, complexplot3d复函数图conformal contourplot contourplot3d coordplot coordplot3d cylinderplot柱坐标函数图densityplot密度图display display3d图函数显示fieldplot fieldplot3d区域图gradplot gradplot3d梯度图implicitplot implicitplot3d 隐函数图inequal listcontplot listcontplot3d listdensityplot listplot listplot3d loglogplot logplot matrixplot odeplot微分方程数值解图pareto pointplot pointplot3d点图polarplot极坐标图polygonplot polygonplot3d多边形图polyhedraplot replot rootlocus semilogplot setoptions setoptions3d作图选项设置spacecurve空间曲线图sparsematrixplot sphereplot球坐标图surfdata textplot textplot3d tubeplot 工具包中有下列图形工具: arc弧arrow 箭头circle圆cone 圆锥cuboid长方体curve曲线cutin cutout cylinder柱disk 圆盘dodecahedron十二面ellipse椭圆ellipticArc椭圆弧hemisphere半球hexahedron 六面体hyperbola双曲线icosahedron二十面体line线段octahedron八面体pieslice point点polygon多边形rectangle矩形semitorus sphere球tetrahedron四面体torus轮 第一节二维曲线图: 一.基本命令(不需调图形包) plot({f1(x),f2(x),…},x=a..b,选项);一元函数曲线 plot(f,a..b,选项); 作过程函数图 x=a..b(中间两点)表示变量x在[a,b]区间。 后面可有如下选项: (1)scaling坐标尺度控制,两个值CONSTRAINED和UNCONSTRAINED(等长和不等长); (2)axes(坐标架)有四个选项frame(边上),boxed(箱),normal(正常),none(没有) (3)coords(选坐标系)常用有polar极坐标,cylindrical柱坐标,spherical球坐标; (4)numpoints(节点数); (5)resolution(水平密度); (6)color(颜色)有:黑black 白white 红red 黄yellow 兰blue 绿green 金gold 褐brown灰gray, grey 茶maroon 橙orange 碧绿aquamarine 海兰navy 桃红coral 兰绿cyan 土黄khaki 紫红magenta 粉红pink 深紫plum 黄褐tan 天兰turquoise 兰紫violet 麦黄wheat 红绿兰RGB 色彩HUE; (7)x(y)tickmarks(坐标刻度数) (8)style(风格):point点,line线,patch缺补 (9)discont(连续性控制) (10)title(标题) (11)thickness(线粗):0,1,2,3几个值 (12)linestyle(线型):后跟数字 (13)symbol(点形状):box框,cross叉,circle圈,point点,diamond菱型 (14)font(字体):[family,style,size]
五个免费开源的数据挖掘软件/什么是ODS? 信息处理的多层次要求导致了一种新的数据环境——DB-DW的中间层ODS(操作型数据存储)的出现。ODS是“面向主题的、集成的、当前或接近当前的、不断变化的”数据。通过统一规划,规范框架和数据,ODS可以实现操作型数据整合和各个系统之间的数据交换,能够提供实时的操作型报表,减轻数据仓库的负担。建设ODS还可以为后期数据仓库建设做好准备。 什么是ODS? ODS全称为Operational Data Store,即操作型数据存储,是“面向主题的、集成的、可变的、反映当前数据值的和详细的数据的集合,用来满足企业综合的、集成的以及操作型的处理需求”(Bill.Inmon)。ODS是数据仓库体系结构中的一个可选部分,ODS具备数据仓库的部分特征和OLTP系统的部分特征。 1.1 ODS的出现 系统应用集成中一般对各系统中数据分为两类:操作型数据,有细节化,分散化的特点;决策型数据,有综合化,集成化的特点。 数据仓库概念的提出也把数据处理划分为了操作型处理和分析型处理两种不同类型,从而建立起了DB-DW的两层体系结构。但是有很多情况,DB-DW 的两层体系结构并不能涵盖企业所有的数据处理要求,比如有些实时性决策问题,它要求获取数据周期不能太长,而且也需要一定程度的汇总。信息处理的多层次要求导致了一种新的数据环境——DB-DW的中间层ODS(操作型数据存储)的出现。它像DW一样是一种面向主题,集成的数据环境,又像操作型DB一样包含着全局一致的、细节的当前的数据。这样就构成了DB-ODS-DW的关于企业数据的三层体系结构。 1.2与应用系统、数据仓库的比较 根据数据仓库之父Bill. Inmon的定义,“数据仓库是面向主题的、集成的、稳定的、随时间变化的,主要用于决策支持的数据库系统”。下面对数据仓库、ODS和数据库进行多方面的比较: 比较项目数据仓库ODS应用系统 建设目的决策支持实时监控业务操作
C#图形图像编程 1、图片框(PictureBox)控件:显示图片。 常用属性有两个:Image和SizeMode。 ⑴、Image:设置在图片框中显示的图片。 Picturebox1. Image = System.Drawing.Image.FromFile(“c:\\windows\\winlog.gif”); Picturebox1. Image = null; //清除图片框中的图片 ⑵SizeMode:设置图片框显示图片的方式。 Picturebox1. SizeMode = System.Windows.Froms.PictureboxSizeMode.Zoom; 2、图像列表(ImageList)控件:保存图解供其他控件(列表视图、树视图、工具栏等)使用。 常用属性 ⑴、Images:图像列表控件所包含的图像,集合属性。 ⑵、ImageSize:设置图像大小 ⑶、ImageList1. ImageSize = new System.Drawing.Size(16, 16); ColorDepth:设置图像的颜色深度 ImageList1.ColorDepth = System.Windows.Froms.ColorDepth.Depth8Bit; ⑷、TransparentColor:设置图像列表中图像的透明色 ImageList1.TransparentColor = System.Drawing.Color.White; 3、Graphics对象 在.NET框架的Windows窗体中使用绘图表面进行绘图操作,System.Drawing命名空间中的Graphics类封装了GDI+的绘图表面,Windows窗体中的所有绘图操作都是通过Graphics 类进行的。Graphics Calss封装了一个GDI+ 绘图界面,有三种基本类型的绘图界面:
第17章Graphics模块中的基 因组可视化包—GenomeDiagram Bio.Graphics模块基于Python的第三方扩展库ReportLab,ReportLab主要生成PDF文件,同时也能生成EPS(Encapsulated Postscript)文件和SVG文件。ReportLa可以导出矢量图,如果安装依赖关系(Dependencies),比如PIL(Python Imaging Library),ReportLab也可以导出JPEG, PNG, GIF, BMP和PICT格式的位图(Bitmap image)。 17.1 基因组可视化包—GenomeDiagram 17.1.1 GenomeDiagram简介 Bio.Graphics.GenomeDiagram包被整合到Biopython 1.50版之前,就已经是Biopython 的独立模块。GenomeDiagram包首次出现在2006年Pritchard等人在Bioinformatics杂志的一篇文章[:ref:`2
Orange Pi 用户手册
目录 一.Orange Pi简介 (3) 1.我们可以用Orange Pi做什么 (3) 2.Orange Pi 是为谁设计的 (3) 3.硬件特性的介绍 (3) 4.外观规格的介绍 (4) 5.开发板使用方法 (6) 6.SD卡的制卡介绍 (8) 7.通用软件的配置 (18) 8. GPIO规格介绍 (25) 9.CSI摄像头接口规格 (26) 二. Linux内核源码编译 (28) 1.源码的获得方法 (28) 2.项目源码的编译 (29) 3.内核镜像和库的安装 (31) 三. Android源码编译介绍 (34) 1.JDK 的安装 (35) 2.安装平台支持软件 (35) 3.源码包的获得方法 (36) 4.编译工具链的安装 (36) 5.lichee 源码的编译 (37) 6.android源码的编译 (37) 四.工程化配置介绍 (41) 1.工程配置化文件的个性化配置 (41) 2. Uboot 和boot 更新方法 (42) 3.例子介绍 (42) 五.OrangePi驱动程序开发 (46) 1.设备驱动和应用程序的编写 (47) 2.设备驱动的编译方法 (49) 3.应用程序的编译方法 (52) 4.驱动和程序的运行方式 (53) 六.串口调试工具介绍 (55) Windows平台 (56) 1.Windows下USB 驱动安装 (56) 2.Windows下Putty 安装 (56) 3.调试的连接方式 (57) 4.设备信息的获取 (57) 5. Putty 的配置 (59) 6.开始调试串口 (59) Linux 平台 (60) 1.kermit的安装 (60) 2.调试的连接方式 (61) 3.设备信息的获取 (62) 4.开始调试串口 (68) 七.常见问题 (70)
实验二单元测试工具JUnit的使用 实验学时:4学时 实验类型:(设计) 实验要求:(必修) 一、实验目的 掌握在Eclipse环境下JUnit单元测试工具的安装和使用方法,针对一个实际问题,在JUnit环境下设计并执行测试用例。 二、实验内容 1. 提出问题 - 经典售货机程序: 若投入5角钱或1元钱的硬币,按下“橙汁”或“啤酒”按钮,则相应 的饮料就送出来; 若售货机没有零钱找,则显示“零钱找完”的红灯亮,这是再投入一元 硬币并按下按钮后,饮料不送出来而且1元硬币也退出来; 若有零钱找,则显示“零钱找完”的红灯灭,在送出饮料的同时退还5 角硬币。 2. 给出程序流程图和Java源代码(见附录) 3. 采用条件覆盖和分枝覆盖的单元测试方法设计测试用例,在JUnit中实现。 4. 总结本次实验过程,提交测试用例程序和该程序运行结果最终画面。 三、实验原理、方法和手段 利用条件覆盖和分枝覆盖方法设计测试用例 四、实验组织运行要求 以学生自主训练为主的开放模式组织教学 五、实验条件 提供学生一人一台电脑,C/C++或Java编程环境;提供MS Office文档编辑工具。 六、实验步骤 1. 下载并安装Eclipse; 2. 熟悉并掌握Eclipse环境下JUnit的使用方法 3. 通读自动售货机程序,并将其在Eclipse环境下运行
4. 编写并执行基于JUnit的测试用例 5. 总结本次试验,并撰写实验报告。 七、实验结果检查与评定 1、实验分组进行,每二人一组,贡献度A%+ B%=100% 2、提交时间:2011/03/05 24:00之前 3、提交地址:网络教学系统 4、文档名称:10专升本软工X班_软件测试实验X_N1&N2(X代表阿拉伯数 字) 附录 程序流程图如下: 程序源代码如下: public class SaleMachine { private int countOfBeer, countOfOrangeJuice, countOfFiveCents, countOfOneDollar; private String[] typeOfGoods = {"Beer", "OrangeJuice"}; private String resultOfDeal;
什么是 UBB 代码? UBB 代码是HTML的一个变种. 你也许对它还有些陌生。UBB代码对于网上公告板之类的信息交互的平台,是比HTML更加安全的代码。由于要求使用的编码很少,所以可以非常轻松的取得需要的效果. 当前 UBB 代码: 设置颜色的代码: 简单的添加颜色代码: [red]定义成红色[/red]==>定义成红色 [pink]粉色[/pink]==>粉色 [orange]橙色[/orange]==>橙色 [brown]褐色[/brown]==>褐色 [green]绿色[/green]==>绿色 [blue]蓝色[/blue]==>蓝色 [navy]深蓝[/navy]==>深蓝 [violet]紫色[/violet]==>紫色 [gray]灰色[/gray]==>灰色 [black]黑色[/black]==>黑色 更多的颜色可以使用更灵活的代码来写 (UBB 代码部分是红色): [color=######]https://www.doczj.com/doc/7218273679.html,[/color] 其中######是颜色,可以是上面的red,pink,orange等字符描述(所以用这个可以完全替代上面的代码),也可以用#FFFF00,#FF00FF,#339966这样类似的代码,其中的数字就是代表的颜色,具体的可以参照这里的颜色选择表,点这里打开颜色选择表 设置文字字体的代码: 只要知道字体的名称,使用简单的代码,就可以设置漂亮的字体,比如宋体,楷体,仿宋体或者其他英文的字体: 举例如下 (UBB 代码部分是红色) [font=楷体]酷辣辣,更精彩https://www.doczj.com/doc/7218273679.html,[/font] 其中楷体就是字体,这个可以用其他的字体来代替,比如宋体,黑体,隶书等... 具体的可以参照系统的字体. 设置对齐方式的代码: 可以把代码中间的内容按照字体需要的方式对齐,分左对齐(不加也缺省此方式),右对齐,居中三种(UBB 代码部分是红色)
制图软件orange怎么用 2011-8-1 08:55 提问者:_Majority|浏览次数:762次 其他回答共1条 2011-8-1 12:06豪情万丈之豪|三级 一、工作环境 1.1工作环境综述 类似Office的多文档界面,主要包括以下几个部分: 1、菜单栏顶部一般可以实现大部分功能 2、工具栏菜单栏下面一般最常用的功能都可以通过此实现 3、绘图区中部所有工作表、绘图子窗口等都在此 4、项目管理器下部类似资源管理器,可以方便切换各个窗口等 5、状态栏底部标出当前的工作内容以及鼠标指到某些菜单按钮时的说明 工作表矩阵绘图 1.2 菜单栏 菜单简要说明: File 文件功能操作打开文件、输入输出数据图形等 Edit 编辑功能操作包括数据和图像的编辑等,比如复制粘贴清除等,特别注意undo功能 View 视图功能操作控制屏幕显示, Plot 绘图功能操作主要提供5类功能: 1、几种样式的二维绘图功能,包括直线、描点、直线加符号、特殊线/符号、条形图、柱形图、特殊条形图/柱形图和饼图 2、三维绘图 3、气泡/彩色映射图、统计图和图形版面布局 4、特种绘图,包括面积图、极坐标图和向量
5、模板:把选中的工作表数据到如绘图模板 Column 列功能操作比如设置列的属性,增加删除列等 Graph 图形功能操作主要功能包括增加误差栏、函数图、缩放坐标轴、交换X、Y 轴等 Data 数据功能操作 Analysis 分析功能操作 对工作表窗口:提取工作表数据;行列统计;排序;数字信号处理(快速傅里叶变换FFT、相关Corelate、卷积Convolute、解卷Deconvolute);统计功能(T-检验)、方差分析(ANOAV)、多元回归(Multiple Regression);非线性曲线拟合等 对绘图窗口:数学运算;平滑滤波;图形变换;FFT;线性多项式、非线性曲线等各种拟合方法 Plot3D 三维绘图功能操作根据矩阵绘制各种三维条状图、表面图、等高线等 Matrix 矩阵功能操作对矩阵的操作,包括矩阵属性、维数和数值设置,矩阵转置和取反,矩阵扩展和收缩,矩阵平滑和积分等 Tools 工具功能操作 对工作表窗口:选项控制;工作表脚本;线性、多项式和S曲线拟合 对绘图窗口:选项控制;层控制;提取峰值;基线和平滑;线性、多项式和S曲线拟合 Format 格式功能操作 对工作表窗口:菜单格式控制、工作表显示控制,栅格捕捉、调色板等 对绘图窗口:菜单格式控制;图形页面、图层和线条样式控制,栅格捕捉,坐标轴样式控制和调色板等 Window 窗口功能操作控制窗口显示 Help 帮助 二、基本操作 作图的一般需要一个项目Project来完成,File→New 保存项目的缺省后缀为:OPJ
SAS编程PROC步——常用作图 SAS/Graph非常强大,本文主要讲一些常用且功能强大的Graph相关的过程步。 一.proc gplot命令 1. proc gplot的简单例子 proc gplot data=sashelp.shoes; plot Returns * Sales ; run; 2. 我们也可以只画出符合条件的数据的图形。 proc gplot data=sashelp.shoes; where Region in("United States", "EasternEurope"); plot Returns * Sales ; run; 3. 输出的图像都是默认的黑色的小十字,因此我们不能区分来自不同地区的数据,下面的程序就是为了解决这一问题 proc gplot data=sashelp.shoes; where Region in("United States", "EasternEurope"); plot Returns * Sales= Region; run; 这里红色的来自美国,黑色的来自东欧,当然我们也可以自己设定颜色(SAS基本颜色有:black, red, green, blue, cyan, magenta,grey, pink, orange, brown, and yellow)。
4. 设定坐标轴和所有文字和颜色 proc gplot data=sashelp.shoes; where Region in("United States", "EasternEurope"); plot Returns * Sales= Region/ caxis=blue ctext=red grid; run; 5. 如果要对网格进行更精细地设置,则要用到AUTOHREF和AUTOVREF选项。AUTOHREF 中,LHREF设置水平线的线类型,CHREF设置水平线的线颜色;AUTOVREF中,LVREF设置垂直线的线类型,CVREF设置垂直线的线颜色。 proc gplot data=sashelp.shoes; where Region in("United States", "EasternEurope"); plot Returns * Sales= Region/ autohref lhref=2 chref=lime autovref lvref=5 cvref=pink caxis=blue ctext=red ; run; 6. 还可以用VAXIS和HAXIS分别设置纵轴和横轴的刻度。注意:如果某个数据超过了你指定的这个刻度,那么这个数据将不会被输出,因此在用这两个选项时要非常小心。
orange制图软件 一、工作环境 1.1工作环境综述 类似Office的多文档界面,主要包括以下几个部分: 1、菜单栏顶部一般可以实现大部分功能 2、工具栏菜单栏下面一般最常用的功能都可以通过此实现 3、绘图区中部所有工作表、绘图子窗口等都在此 4、项目管理器下部类似资源管理器,可以方便切换各个窗口等 5、状态栏底部标出当前的工作内容以及鼠标指到某些菜单按钮时的说明 工作表矩阵绘图 1.2 菜单栏 菜单简要说明: File 文件功能操作打开文件、输入输出数据图形等 Edit 编辑功能操作包括数据和图像的编辑等,比如复制粘贴清除等,特别注意undo功能 View 视图功能操作控制屏幕显示, Plot 绘图功能操作主要提供5类功能: 1、几种样式的二维绘图功能,包括直线、描点、直线加符号、特殊线/符号、条形图、柱形图、特殊条形图/柱形图和饼图 2、三维绘图 3、气泡/彩色映射图、统计图和图形版面布局 4、特种绘图,包括面积图、极坐标图和向量 5、模板:把选中的工作表数据到如绘图模板 Column 列功能操作比如设置列的属性,增加删除列等
Graph 图形功能操作主要功能包括增加误差栏、函数图、缩放坐标轴、交换X、Y 轴等 Data 数据功能操作 Analysis 分析功能操作 对工作表窗口:提取工作表数据;行列统计;排序;数字信号处理(快速傅里叶变换FFT、相关Corelate、卷积Convolute、解卷Deconvolute);统计功能(T-检验)、方差分析(ANOAV)、多元回归(Multiple Regression);非线性曲线拟合等 对绘图窗口:数学运算;平滑滤波;图形变换;FFT;线性多项式、非线性曲线等各种拟合方法 Plot3D 三维绘图功能操作根据矩阵绘制各种三维条状图、表面图、等高线等 Matrix 矩阵功能操作对矩阵的操作,包括矩阵属性、维数和数值设置,矩阵转置和取反,矩阵扩展和收缩,矩阵平滑和积分等 Tools 工具功能操作 对工作表窗口:选项控制;工作表脚本;线性、多项式和S曲线拟合 对绘图窗口:选项控制;层控制;提取峰值;基线和平滑;线性、多项式和S曲线拟合 Format 格式功能操作 对工作表窗口:菜单格式控制、工作表显示控制,栅格捕捉、调色板等 对绘图窗口:菜单格式控制;图形页面、图层和线条样式控制,栅格捕捉,坐标轴样式控制和调色板等 Window 窗口功能操作控制窗口显示 Help 帮助 二、基本操作 作图的一般需要一个项目Project来完成,File→New 保存项目的缺省后缀为:OPJ 自动备份功能:Tools→Option→Open/Close选项卡→“Backup Project Before Saving”
几个T ik Z 入门级的例子 cjmuqiao@https://www.doczj.com/doc/7218273679.html,m 2017年8月3日 1 序 x L A T E X 或TikZ 的缺点: 1.学习曲线陡峭; 2.非所见即所得; 3.牵一发而动全身,一个微小的改动需要长时间的全文编译; 4.代码并不能真正显示事物本来的样子。 TikZ 的底层是PGF(portable graphics format),即它是PGF 的前端。 它并不是唯一可以在L A T E X 中画出漂亮图的宏包,比如,xfig 就可以代替 它。另外pstricks 和metapost 都可以完成TikZ 的工作,但pstricks 可移植性不好;而metapost 错误一堆,只在LuaT E X 里预装了它。 在PGF 中有很多优秀的并且可以独立于PGF 之外运行的包。比如pgfpages ,它功能强大,可以合并多页,可以制作水印,可以将多页缩放到 1
2什么是控制点2 一个页面里,等等。 行中画图。行中画图。元数据,0级数据,1级数据,2级数据。以上效果使用以下代码实现: 1\tikz\draw(0pt,0pt)--(20pt,6pt); 2\tikz\fill[orange](1ex,1ex)circle(0.5ex); 3\tikz\fill[cyan](1ex,1ex)circle(0.5ex); 4\tikz\fill[red](1ex,1ex)circle(0.5ex); 5\tikz\fill[green](1ex,1ex)circle(0.5ex); 2什么是控制点 起点x处的切线方向指向y点。如 (0,0)处的切线方向指向点(1,1)。点(2,0)点的切线方向指向点(2,1)。代码如下: 1\begin{tikzpicture} 2\filldraw[gray](0,0)circle[radius=2pt] 3(1,1)circle[radius=2pt] 4(2,1)circle[radius=2pt] 5(2,0)circle[radius=2pt]; 6\draw(0,0)..controls(1,1)and(2,1)..(2,0); 7\end{tikzpicture} 再来一个控制点的例子:用控制点画一个半圆。不过,用这种方式画半 代码如下:
实验3 实验报告写作指南 实验名称:Gcov覆盖测试工具的使用 班级:11计软学号:1110815026 姓名:陶元龙 实验日期:2014/6/4 实验3 Gcov覆盖测试工具的使用 饮料自动售货机程序的测试分析 Gcov工具简介:Gcov工具的基本功能是可以查看测试时代码执行的覆盖率,包括函数覆盖,语句覆盖,分支覆盖等覆盖内容。有助于分析被测程序的缺陷。使用该工具可以查看程序在某分支处的执行频率,从而分析程序的性能。 一、实验目的 1. 理解Gcov测试工具的测试功能及使用流程 2. 理解在Linux下对C源程序编译执行及测试方法 3. 学会查看测试分析结果 二、实验工具Gcov简介 Gcov工具是Linux系统自带的代码覆盖测试工具。Gcov工具的基本功能是可以查看测试时代码执行的覆盖率,包括函数覆盖,语句覆盖,分支覆盖等覆盖内容。有助于分析被测程序的缺陷。使用该工具可以查看程序在某分支处的执行频率,从而分析程序的性能。 三、实验内容 在Linux下对饮料自动售货机程序进行测试。 饮料自动售货机描述如下: 有一个处理单价为5角钱的饮料的自动售货机软件测试用例的设计。其规格说明如下:1.若投入5角钱或1元钱的硬币,押下〖橙汁〗或〖啤酒〗的按钮,则相应的饮料就送出 来。 2.若售货机没有零钱找,则一个显示〖零钱找完〗的红灯亮 3.投入1元硬币并押下按钮后,饮料不送出来而且1元硬币也退出来; 4.若有零钱找,则显示〖零钱找完〗的红灯灭,在送出饮料的同时退还5角硬币。” 四、实验过程 1. 编写测试用例 输入数据:5:投入5角
10:投入1元 执行操作:1:按下橙汁按钮 2:按下啤酒按钮 测试用例如下表格: 测试的源程序: //autosell.c #include