Meriaux-2004-Rapid slip along the central Altyn Tagh Fault
- 格式:pdf
- 大小:1.82 MB
- 文档页数:23

〖代词相关〗GRAMMAIREI主语人称代词如同英语中人称代词主格,用作主语。
1)1)1)tu 用作家人、好友间;vous(您)礼貌、尊重。
2)2)2)第三人称也可用作(它,它们)II主有形容词。
3.4.2.用法1)1)1)主有形容词的性、数与所限名词的性数一致,与所有者性别无关。
son livre2)2)2)所有者为复数,所有物是每人一件时,一般用单数主有形容词。
Ouvrez votre livre à la page 20. (Open your books at page 20.)III重读人称代词1)1)1)主语的同位语:A 单独用作同位语:Lui, il connaît le peintre de ce tableau.B 与另一人称代词或名词构成复合同位语Toi et moi , nous allons au cinéma à vélo.2) 用作介词的补语:Je travaille avec elle chez moi.3) 用于c’est后,或无谓语的省略句中Qui est Li Ming ? ——C’est lui.IV直接宾语人称代词me, m’ (me)nous(us)te, t’(you)vous(you)le, l’(him/it)les(them)la, l’(h er/it)相当于英语中的宾格,但放在有关动词前:Ce texte n’est pas facile, le comprenez-vous ? —— Non, je ne le comprends pas.肯定命令式中,放在动词后面,用连字号相连,有me的改为moi:Choisissez-les si vous voulez bien.Attendez-moi à la station, s’il vous plaît.V泛指代词on可代替口语中所有人称代词,相当于英语中的one , someone, they, people,动词谓语仅用第三人称单数Ecoute, on frappe à la porte. (Listen, someone is knocking at the door.)III国家、城市名词前介词的用法1.阴性国名或国名以元音开头用en。
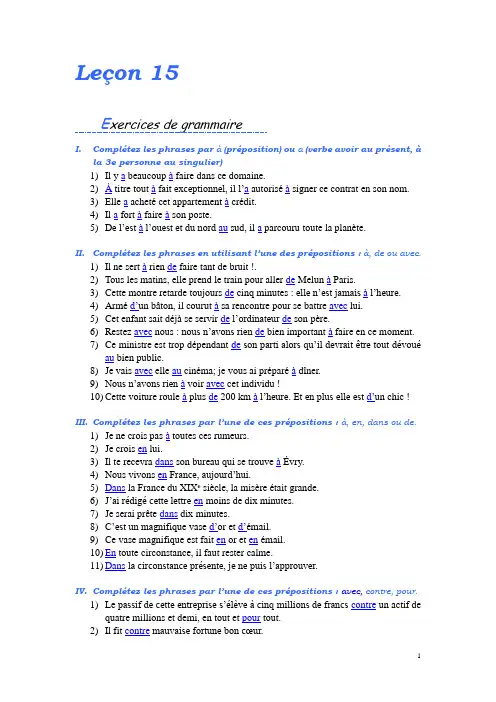
Leçon 15E xercices de grammaireI. Complétez les phrases par à (préposition) ou a (verbe avoir au présent, àla 3e personne au singulier)1)Il y a beaucoup à faire dans ce domaine.2)À titre tout àfait exceptionnel, il l’a autoriséà signer ce contrat en son nom.3)Elle a acheté cet appartement à crédit.4)Il a fort à faire à son poste.5)De l’est àl’ouest et du nord au sud, il a parcouru toute la planète.II. Complétez les phrases en utilisant l’une des prépositions : à, de ou avec.1)Il ne sert à rien de faire tant de bruit !.2)Tous les matins, elle prend le train pour aller de Melun à Paris.3)Cette montre retarde toujours de cinq minutes : elle n’est jamais àl’heure.4)Arméd’un bâton, il courut à sa rencontre pour se battre avec lui.5)Cet enfant sait déjà se servir de l’ordinateur de son père.6)Restez avec nous : nous n’avons rien de bien important à faire en ce moment.7)Ce ministre est trop dépendant de son parti alors qu’il devrait être tout dévouéau bien public.8)Je vais avec elle au cinéma; je vous ai préparéà dîner.9)Nous n’avons rien à voir avec cet individu !10)Cette voiture roule à plus de 200 km àl’heure. Et en plus elle est d’un chic !III. Complétez les phrases par l’une de ces prépositions : à, en, dans ou de.1)Je ne crois pas à toutes ces rumeurs.2)Je crois en lui.3)Il te recevra dans son bureau qui se trouve à Évry.4)Nous vivons en France, aujourd’hui.5)Dans la France du XIX e siècle, la misère était grande.6)J’ai rédigé cette lettre en moins de dix minutes.7)Je serai prête dans dix minutes.8)C’est un magnif ique vase d’or et d’émail.9)Ce vase magnifique est fait en or et en émail.10)En toute circonstance, il faut rester calme.11)Dans la circonstance présente, je ne puis l’approuver.IV. Complétez les phrases par l’une de ces prépositions : avec, contre, pour.1)Le passif de cette entreprise s’élève à cinq millions de francs contre un actif dequatre millions et demi, en tout et pour tout.2)Il fit contre mauvaise fortune bon cœur.3)Celui qui n’est pas avec moi est contre moi.4)Ils ont complotécontre l’État sous prétext e de lutter pour le bien des citoyens.5)La chance est contre lui, mais il s’en tirera.6)La chance est avec lui, il n’a pas cessé de gagner ce soir !7)Dans ce qu’il dit, il y a du pour et du contre.8)Pour se protéger contre ce risque, il n’y a presque rien à fa ire.V. Complétez les phrases avec l’une des prépositions : à, par, pour.1)Il est parti àl’aéroport en passant par le périphérique.2)Par contre, j’interviendrai pour vous à la première occasion.3)Il fait ce travail par passion et pour se rendre utile.4)Nous ne pouvons pas faire beaucoup pour vous par les temps qui courent.5)Par chance, il a trouvé un taxi par cette pluie !6)J’habite àToulouse et m’envole ce matin pour Paris par Air Inter.7)Il s’est prononcé pour ce projet qu’il a ainsi fait adopter tout à fait par hasard.8)Nous avons été sollicitépar le ministre pour remplir une mission à haut risque.9)Il ne juge que par vous : c’est flatteur pour vous.10)Je pars ce matin pour le Luxembourg : ce sera à vous de répondre pour moi àtoutes les demandes de la clientèle.VI. Complétez les phrases par l’une des prépositions : sur ou sous.1)Il jura sur une Bible et déposa sous serment.2)Nous vous invitons à revenir sous un mois.3)Trois jours sur cinq, il est sous antibiotiques.4)Mettez cela sur mon compte !5)Nous travaillons sous l’autorité de la municipalité, mais sur ordre de la région.6)Il règle sa démarche sur la mienne.7)Nous travaillons sous pression depuis le début de l’année.8)Elle va sur ses quarante ans et fêtera sous peu son anniversaire.9)Ils recrutent sur diplôme et sous certaines conditions d’âge.10)On l’a placé sous une tente à oxygène, mais on ne peut rien dire de plus surson état.E xercices de grammaire-RévisionI. Conjuguez les verbes au présent et au futur simple de l’indicatif.1)reléguer un tableau dans le coin d’une chambre2)jeter des pierres dans l’eau3)se remaquiller devant le miroir4)gémir de douleur5)saisir une occasion6)haïr l’ennemi7)assouplir ses articulations8)guérir très vite…II. Soulignez le temps correct dans les phrases suivantes.1)Depuis qu’il (tra vaillera / travaille / avait travaillé), il est de meilleure humeur.2)Je lui répondrai après qu’il m’(écrit / avait écrit / aura écrit).3)Tandis qu’il (rentrait/ rentrera / serait rentré), la pluie s’est mise à tomber.4)Depuis que l’autoroute (ouvrira / étai t ouverte / est ouverte), il met moins detemps pour se rendre à son travail.5)Il entrait dans la salle juste comme elle en (était sortie / sortait / sort).6)Une fois qu’il (partira / part / sera parti), je regarderai un film vidéo.7)Il coulera de l’eau sous les ponts avant qu’elle (ne prend / n’avait pris / neprenne) une décision.8)Dès qu’une place (se libère / se libérait / s’est libérée), tu t’y installes.9)Il viendra nous voir aussitôt qu’il le (pouvait / pourra / a pu).III. Mettez le verbe au temps conve nable de l’indicatif.1)Pendant que nous (être) serons en vacances, nous voisins arrosera nos plantes.2)Nous avons visité la ville à pied pendant que le g a ragiste (réparer) réparait lavoiture.3)Quand j’ (être) étaisétudiante, il m’arrivait de manquer des cou rs.4)Lorsque la guerre (éclater) éclata, il venait de commencer ses études.5)Tant qu’il y (avoir) a de la vie, il y a de l’espoir.6)Le temps froid et humide durera aussi longtemps que les basses pressions(rester) resteront sur le pays.7)Chaque fois qu’il me (voir) voyait, il me racontait sa vie.8)La voiture est tombée en panne alors que nous (être) étions à 10 k i lomètres dela maison.9)Au moment où j’ (aller) allais sortir, une de mes amies est arrivée.10)Son inquiétude grandissait à mesure que le temps (passer) passait.11)Depuis que Patrick ne (fumer) fume pas, il se porte beaucoup mieux.12)Maintenant que les enfants (être) sont grands, ils vont à l’école tout seuls.13)Dès que mon père (finir) avait fini de dîner, il se plongeait dans le journal.14)Aussitôt que les enfants (prendre) ont pris leur bain, ils vont se coucher.15)Il faudra tout ranger une fois que les invités (partir) seront partis.16)Les soirs d’hiver, après que nous (dîner) avions dîné, ma grand-mère nousracontait des histoires.17)Quand nous (corriger) aurons corrigé la dictée, nous ferons des exercices degrammaire.18)Depuis qu’il (s’arrêter) s’est arrêté de fumer, il tousse moins.19)On ne vous remboursera pas tant que vous n’ (envoyer) aurez pas envoyé lespapiers nécessaires.20)Dès que tu (lire) auras lu ce livre, rends-le moi !IV. Mettez le verbe au temps convenable du subjonctif.1)En attendant que sa voiture (être) fût réparée, il allait au bureau en métro.2)Répétez ce mot jusqu’à ce que vous le (prononcer) prononciez correctement !3)Dépêchez-vous de vous inscrire ava nt qu’il (ne) (être) soit trop tard !4)Je voudrais bien vous voir avant que vous (ne) (partir) partiez.5)Allons prendre un café en attendant que Paul (revenir) revienne !.6)Les syndicats ont décidé de poursuivre la grève jusqu’à ce que lesnégociations (reprendre) reprennent .V. Mettez les verbes aux mode et temps qui conviennent.1)Les embarras de M. Dupont et de Madame, (priver) privés hier d’électricité,furent innombrables.2)… se dit-il, (oublier) oubliant la grève, pourtant (annoncer) annoncée laveille.3)(Craquer) Craquant des allumettes, il fut voir son compteur.4)Il n’eut d’autre ressource que de chercher, (reléguer) reléguéau fond d’unplacard, l’antique instrument qu’on tourne à la main.5)(Maugréer) Maugréant, et en retard, M. Dupont dévala son escalier.6)Les automobilistes, ne (savoir) sachant oùdonner de la tête, donnaient duklaxon pour apaiser leurs nerfs.7)Ainsi put-il surprendre Mme Dupont, de retour de ses courses, qui, (dénicher)ayant déniché une boîte de bougies, en avait allumé une.8)Nous le (revoir) revîmes encore l’année dernière, quand il convoqua uneréunion pour donner des explications sur certaines questions.9)M. Dupont (prévenir) prévenu par son interprète qu’il était invité par le doyen,est venu à la réunion. (S’asseoir) S’étant assisàn otre table, il s’est mis à parler français.10)Une heure (consacrer) consacréeàun travail (soutenir) soutenu vaut mieuxqu’une journée (passer) passée dans l’oisiveté.11)(vouloir) Ne voulant pasêtre sortie inutilement, Mme Dupont décida d’acheterle chandail bleu, (exposer) exposé dans la vitrine et (remarquer) remarqué la veille par son époux. Mais la lumière (manquer) manquant le vendeur lui en vendit un vert, (placer) placé dans le tiroir des bleus.VI. Mettez les verbes aux temps qui conviennent.Les grandes grèves à FougèresJe m’en (souvenir) souviens encore comme d’hier, bien que je (être) sois assez jeune à ce moment-là; et je crois que je ne les (oublier) oublierai jamais. C’(être) était le début du siècle, la Belle Époque comme on l’(appeler) appellera plus tard et comme on la (désigner) désigne encore dans les livres d’histoire. Mais cette époque n’ (être) était pas belle pour tout le monde, surtout pas pour les ouvriers de la chaussure de Fougères.Vers 1900, tout Fougères (vivre) vivait de la chaussure : les travailleurs du cuir et ceux de la fabrication des souliers, mais aussi les petits commerçants des quartiers populaires qui (devoir) devaient attendre souvent le quinze ou le trente du mois pour se faire payer. Or tout à coup, ce (être) fut la crise.Mon voisin, le père de l’écrivain Jean Guéhenno (travailler) travaillait dur mais (gagner) gagnait peu. Son fils (avoir) avait 11 ans. Il (travailler) travaillait bien à l’école et (réussir) avait réussi à son certificat quelques mois auparavant. Il (aider) aidait son père à l’établi le soir en (rentrer) rentrant. Si ce dernier (être) était un ouvrier respecté c’est que jusqu’alors, il (participer) avait participéàtoutes les grèves et qu’il (jouer) avait joué un rôle dans la création des premiers syndicats. Mais par malheur cet hiver-là, la mère (tomber) était tombée malade et (arrêter) avait arrêtéde travailler. Comme le boulanger ne (donner) donnait du pain qu’à ceux qui (pouvoir) pouvaient payer, ils (se nourrir) se nourrissaient de châtaignes.Un soir, tard dans la nuit, j’(entendre) entendis du bruit dans l’appartement voisin. Je ne (savoir) savais quoi me (dire) dire que les coups (venir) venaient de l’établi. « Que (faire) font-ils donc? Est-ce que, par hasard, Jean nous (trahir) aurait trahis? » Je ne (pouvoir) pouvais le croire. J’en (parler) parlai le lendemain au père Portelette. «C’est impossible, (répondre)répondit-il, je (connaître) connais bien Jean. Même s’il (mourir) meurt de faim, il ne (faire) fera pas ça. J e (aller) vais le voir ce soir. »E xercices de vocabulaireI. Remplissez les tableaux ci-dessous.II. Exercice oral. Attention à l’intonation.Exemple A :Il n’y a pas d’électricité? / Les plombs sautent.Professeur : Il n’y a pas d’électricité?Réponse : Encore les plombs sautés !1)Il y a une drôle d’odeur dans la cuisine. / Le riz brûle.2)Je sens les cailloux quand je roule. / Une roue crève.3)Tiens, voilà l’ambulance. / un accident4)Tu entends les cloches? / un mariage5)Est-ce que tu vois la fumée là-bas? / un incendie6)On entend des cris dans la rue. / une manifestation7)Ah, zut, le métro ne marche pas. / une grève8)V ous n’entendez pas du bruit là-bas? / un chat9)Regardez, regardez la lumière dans le ciel. / un OVNIExemple B :V oilà le vitrier qui passe ! / Un carreau a été cassé.Professeur : Voilà le vitrier qui passe !Réponse : Encore un carreau de cassé.1)Nous n’avons pas fait grand-chose aujourd’hui. / une journée perdue.2)Le chien n’a pas son air habituel. / Une brebis s’est perd ue.3)Regarde le soldat qui revient en courant. / Un soldat est blessé.4)Le stock de riz baisse. / Un sac est fini.5)Maintenant, je peux aller jouer. / Mon devoir est fait.6)Hier soir, tu as regardé la télé? / Une soirée a été gâchée.7)Avez-vous bien joué, hier? / Un match a été gagné.…III. Complétez.à la machine à l’essence à la main au dieselau gaz à la rivièreà l’électricitéà pédaleà la manivelleà gazà la bougieà charbonà essenceau charbonau feuà feu1)Pendant la guerre, on s’éclairait à la bougie.2)En hiver, il faut démarrer la voiture à la manivelle.3)Ce tracteur marche au diesel.4)J’ai fait une tache d’huile sur mon pantalon, je le nettoie à l’essence.5)À la campagne, les femmes ne vont plus laver leur linge à la rivière.6)Je préfère les vêtements cousus àla main, c’est plus solide même si c’estmoins joli et plus cher.7)Ma mère m’a tricoté mon chandail à la machine.8)Ici, tout le village s’éclaire à l’électricité depuis dix ans.9)Dans cet immeuble, on fait la cuisine au gaz.10)Pour son anniversaire, j’ai acheté un briquet à gaz à mon père.11)Chez nous, la plupart des locomotives marchent au charbon.12)Les cuisinières àcharbon sont plus économiques que les cuisinièresélectriques, mais plus polluantes pour l’environnement.13)Nous avons achetéune machine àcoudre àpédale, c’est moins fragile ettellement moins cher.14)Les jours de grève, il y a la queue devant les pompes à essence.15)Au début, dans les régions libérées, les soldats de l’Armée rouge nepossédaient pas beaucoup d’armes à feu.16)Mais cependant, ils ne craignaient pas d’aller au feu.IV. Expliquez les expressions soulignées, en vous servant du dictionnaire.1)Monsieur Dupont n’eut d’autre ressource que de chercher, relégué au fondd’un placard, l’antique instrument qu’on tourne à la main.dans2)Françoise a fait le ménage à fond.complètement3)«Au fond, je sais que j’ai tort. » reconnaît mon frère.en fait4)Les gendarmes ont fouilléla maison de fond en comble pour retrouver ledocument.entièrement5)Les pompiers alertés arrivent à fond de train.à toute vitesse6)Le cycliste partit à fond, lâchait tout le monde.rapidement7)Il a trompé le douanier grâce à une boîte à double fond.qui a deux fonds8)Françoise connaît son métier à fond.parfaitement9)Cette couleur est très jolie sur un fond bleu.un arrière-plan bleu10)Ce journaliste écrit seulement des articles de fond.de grande importance11)Notre maître savait tout, c’était un puits sans fond.sans limite12)Le fond de l’air est frais aujourd’hui. Prenez un pull-over.La température réelle13)Je suis meilleur dans les courses de fond que dans celles de vitesse.les courses de longue distance14)Nous avons discutéà fond. Nous sommes d’accord.complètementV. Complétez les phrases suivantes par une des expressions suivantes.au même moment en même tempsdans les mêmes circonstances à la même époquependant cette même journée la même nuit1)La vie de médecin est difficile : la même nuit le docteur Soubiran fut appelésept fois chez des malades.2)Je tournai la tête vers l’homme, et presque au même moment, j’entendis lamot o pétarader et je reçus un coup violent sur l’oreille.3)L’automobiliste est sorti de sa voiture pour se battre avec le motocycliste.Qu’auriez-vous fait si vous vous étiez trouvédans les mêmes circonstances?4)Je marchais vers d’Artagnan quand, en même temps, un concert exaspéréd’avertisseurs s’éleva de la file des voitures.5)Qin Shi Huang unifia la Chine àla même époque que se formait l’empireromain.6)Mercredi dernier, j’avais trois heures de cours le matin, une conférencel’après-midi, un film après dîner et une réunion, en fin de soirée. Pendant cette même journée j’ai fait ma version et écrit à mes parents.7)Excusez-moi, mais vous poserez votre question ensuite. Je ne peux pasrepondre à tout le monde en même temps.8)La voiture de M. Robin roulait vers Bordeaux. Une voiture noire commença àdoubler, au même moment un camion citerne arrivait en sens inverse. Ce fut l’accident.VI. Que veulent dire les mots soulignés?1)V oulez-vous allumer l’électricité?mettre2)La salle de l’Opéra est éclairée par un lustre immense. allumée, appareild’éclairage comportant plusieurs lampes3)Je n’avais pour m’éclairer qu’un misérable lumignon, une vieille chandelle desuif. lampe qui éclaire faiblement4)Les plus beaux monuments de Paris sont illuminés la nuit. éclairés de vives etnombreuses lumières5)Il était fort embarrassé. Soudain une idée lumineuse lui vint à l’esprit.excellente6)V oltaire vivait au siècle des «lumières». le XVIII e siècle7)Une lueur d’intelligence éclaira enfin son regard.expression vive etmomentanée (du regard)8)Il a bu, il n’a pas l’esprit bien lucide. clair9)La luciditéest une des plus belles qualités de l’esprit.clairvoyance10)Ma voiture ne voulut point démarrer : panne d’allumage. de démarrage11)La flamme de la révolution ne s’éteint jamais.le feu12)Après le bal, le jeune homme lui a déclaré sa flamme. son amourVII. Cherchez un groupe de mots synonymes des mots soulignés.1)Le ciel dehors était sombre et bas. couvert2)Elle portait une robe légère. mince et fin3)Mon père me commanda de parler plus bas. à voix basse4)On entendit dans l’escalier un léger bruit de pas. faible5)Mon père avait la tête basse. la tête baissée6)De tout l’hiver, je n’ai eu qu’un léger rhume en janvier. petit7)Elle parlait à voix basse à cause des voisins. en parlant très doucement8)Je n’achèverai pas cet ouvrage. Je ne toucherai plus à ce travail bas.9)J’avais souvent, cet hiver-là, l’estomac léger. creux, vide10)Le prix des chaussures était bas. (Les chaussures) étaient bon marché.11)Donnez-moi un caféléger sinon je ne vais pas dormir. peu concentré12)Le fascisme ne passera pas. À bas Hitler ! Abattons Hitler!13)La vie des pauvres en ce bas monde est difficile, disait ma mère. Mais ceuxqui travaillent en paix peuvent garder le coeur léger. sur la terre, être insouciantE xercices omni-contrôlablesL e droit de grèveI. Écoutez et remplissez le blancappellent à la lutte, sondage, le courrier, un droit de l’homme, la crise, le désordre, paresseux, se faire entendre, Japon, l’Allemagne, un antique moyen, Les grévistes, délégués du personnel, Ne m’en parlez pas, les cheminotsII. Le savez-vous? Choisissez la bonne réponse :« Faire la grève », veut dire :a)Se réunir sur un rivage plat, au bord de la mer ou d’un fleuve.b)Un arrêt de travail décidé par des salariés pour obtenir des avantages oupour protester contre une injustice.Un syndicat, c’est :a)Une association de personnes ayant pour but la défense d’intérêtscommuns.b)Un organisme destiné à développer le tourisme dans une localité.La crise est :a)Un son perçant fait par la voix.b)Une période diffici le d’une situation.Pétain a été :a)Le chef du gouvernement français sous l’Occupation allemande (de 1940à 1944).b)Un chef des mouvements ouvriers sous l’Occupation allemande.III. Classez les personnes interrogées :a)Celles qui sont favorables au projet gouvernemental : 2,4,5,7b)Celles qui défendent le droit de grève : 1, 3, 6, 8, 9, 12c)Les personnes indifférentes : 10,11IV. Comment ils le disent? Relevez les expressions utilisées pour :a)Exprimer son accord : ………………………………………………….b)Contrdire : ………………………………………………………………c)Justifier son point de vue : ……………………………………………...E xercices de traductionI. Traduisez le texte en chinois :Le brigadier examinait Antonio. Trente ans environ, grand et brun : un homme comme tant d’autres.… Alors, qui vous a dit de faire grève?- Nous ne faisons pas grève !- Faire grève veut dire refuser de travailler quand on vous le demande. Ce que vous faites actuellement.- Seuls les ouvriers peuvent faire la grève? Est-ce que les patrons ne peuvent pas la faire eux aussi?Le brigadier le regarde avec curiosité.- Ce qu’on dit, nous, c’est que si ne pas travailler, c’est faire la grève, ne pas employer, c’est aussi faire la grève. Et les patrons, eux, nous font la grève tout l’hiver et a`eux on ne leur dit rien.Le brigadier sourit.- Celui qui ne vous fait pas travailler pendant l’hiver ne porte pas préjudice aux vignes; et le fait que vous refusiez de travailler peut faire perdre la récolte. Et là, il s’agit de l’économie nationale.- L’arrêt de travail tout l’hiver nous port e préjudice à nous, nous sommes aussi nationaux que les vignes?Le bigadier n’avait pas reçu d’instruction pour répondre à cette question. Il se trouva un peu gêné.- C’est différent. Les devises étrangères rapportent à tout le monde, à toute la nation…- Mais quand quelqu’un a faim; c’est nous et personne d’autre. Et toutes les devises du monde ne nous donnent pas à manger.- Peut-être, mais avec ces devises, on fait des travaux, on arrange les routes, on construit des barrages…- Moi, je n’ai pas de voiture… Et quand on a besoin d’eau, on descend à la fontaine. D’ailleurs cette fontaine, elle était déjà là du temps de mon grand-père.警察队长打量着安东尼奥:此人三十岁左右,高个,褐发,相当普通。

研究生法语考试题库及答案一、选择题(每题2分,共20分)1. Le mot "français" se réfère à:A. une langueB. un paysC. une couleurD. une plante答案:A2. Combien y a-t-il de voyelles dans le mot "éducation"?A. 3B. 4C. 5D. 6答案:B3. Laquelle de ces phrases est correcte en français?A. Je ai mangé.B. J'ai mangé.C. Je mange.D. J'ai mangé.答案:B4. Que signifie "au revoir" en français?A. HelloB. GoodbyeC. Good morningD. Good night答案:B5. Laquelle de ces expressions est utilisée pour exprimer l'impatience?A. Attends un peu !B. Ne t'inquiète pas !C. Ne fais pas l'idiot !D. Ne t'énerve pas !答案:D6. Comment dit-on "I love you" en français?A. Je t'aimeB. Je t'adoreC. Je t'apprécieD. Je t'aime bien答案:A7. Quelle est la capitale de la France?A. MarseilleB. LyonC. ParisD. Nice答案:C8. Laquelle de ces phrases est correcte pour demander la permission?A. Puis-je aller?B. Je peux aller?C. Tu peux aller?D. Est-ce que je peux aller?答案:D9. Comment dit-on "What time is it?" en français?A. Quelle heure est-il?B. Combien de temps?C. Comment vas-tu?D. Quand est-ce?答案:A10. Laquelle de ces expressions est utilisée pour exprimer l'approbation?A. D'accordB. C'est possibleC. Peut-êtreD. Non答案:A二、填空题(每题2分,共20分)11. Le mot "chat" en français signifie "____" en anglais.答案:cat12. La phrase "Je suis étudiant(e)" se traduit par "I am a student" en anglais, mais en français, on ne dit pas "a". La traduction correcte est "______".答案:Je suis étudiant(e)13. La phrase "Je ne comprends pas" signifie "I don't understand" en anglais, mais on peut aussi l'exprimer en français comme "______".答案:Je ne pige pas14. La phrase "C'est la vie" est souvent utilisée pour exprimerl'acceptation de la situation, et sa traduction en anglais est "______".答案:That's life15. La phrase "Je suis désolé(e)" est une expression polie pour exprimer des excuses, et sa traduction en anglais est "______".答案:I'm sorry16. La phrase "Au secours" signifie "______" en anglais.答案:Help!17. La phrase "Je ne sais pas" signifie "______" en anglais.答案:I don't know18. La phrase "C'est fantastique" peut être traduite en anglais par "______".答案:It's fantastic19. La phrase "Je t'aime" est une expression d'amour, et sa traduction en anglais est "______".答案:I love you20. La phrase "Bon appétit" est utilisée avant de manger, et sa traduction en anglais est "______".答案:Enjoy your meal三、阅读理解(每题2分,共20分)阅读以下短文,并回答问题。

郑州大学外语学院二外法语课程教案法语(修订本)第一册马晓宏外研社23-30/09/2009 材料馆101I.RévisionA Phonétique : 2 voyelles, 3 consonnesB Conjugason : présenter, s’appeler, faire, travaillerC Syntaxe: Je te présente mon ami.Je m’appelle Charles. Enchanté.Où vas-tu avec ta valise ?Je vais à la gare. Je vais à Paris. C’est la rentée. Je suis étudiant là-bas.II.Leçon 4A. Phonétique【œ】œ, œu,eu在词中heure,veuve,peur, leur, cœur, sœur, mœurscueil,gueil发[kœj],[gœj] accueillir [akœjir] orgueil [ɔrgœj]【ø】œu,eu在词末开音节中或在[z]音前nœud,queue,heureux,heureuse【œ】um,un,eun humble,parfum,chacun,commun,quelqu’un,jeunum在一些词词末或发[ɔm] maximum,minimum【b】b base,balai,boue,arabe,arbre,barbe【d】d date,code,salade,attidif,adhésif【注意】1.鼻化元音均为以m或n结尾的字母组合,其后不能有元音字母或m、n,否则鼻音会被破坏。
如un→une, brun→brune,lune,lunnite2.另附法语4个鼻化元音及其对应字母组合【œ】um,un,eun humble,parfum,jeun【ɛ】ain,ein,aim,eim,in,im,yn,ympain,plein,faim,Reims,Tintin,impossible,syndicat,symboleien,éen bien,lycéen【ɑ】am,an,em,en,aon ampère,ange,empêcher,dent,paon【ɔ】om,on tomber, son【语音知识】A.辅音字母h的发音小节H在法语中不发音,但有嘘音哑音之分。
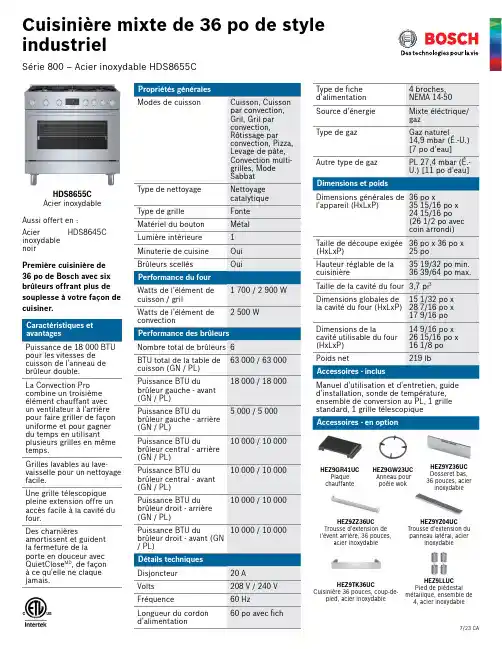
Cuisinière mixte de 36 po de style industrielSérie 800 – Acier inoxydable HDS8655CHDS8655C Acier inoxydable Aussi offert en :Acier inoxydable noirHDS8645C Première cuisinière de 36 po de Bosch avec six brûleurs offrant plus de souplesse à votre façon de cuisiner.Puissance de 18 000 BTU pour les vitesses de cuisson de l'anneau de brûleur double.La Convection Pro combine un troisième élément chauffant avec un ventilateur à l'arrière pour faire griller de façon uniforme et pour gagner du temps en utilisantplusieurs grilles en même temps.Grilles lavables au lave-vaisselle pour un nettoyage facile.Une grille télescopique pleine extension offre un accès facile à la cavité du four.Des charnièresamortissent et guident la fermeture de laporte en douceur avec QuietClose MD , de façon à ce qu'elle ne claque jamais.7/23 CAHEZ9GR41UCPlaque chauffante HEZ9GW23UC Anneau pour poêle wokHEZ9YZ36UC Dosseret bas, 36 pouces, acierinoxydableHEZ9ZZ36UC Trousse d'extension de l'évent arrière, 36 pouces,acier inoxydableHEZ9YZ04UC Trousse d'extension du panneau latéral, acierinoxydableHEZ9TK36UCCuisinière 36 pouces, coup-de-pied, acier inoxydableHEZ9LLUC Pied de piédestal métallique, ensemble de 4, acier inoxydableAccessoires : Pour acheter des accessoires, des nettoyants et des pièces Bosch, visitez le site /us/store ou composez le 1-800-944-2904 (du lundi au vendredi de 5 h à 18 h HNP, le samedi de 6 h à 15 h HNP).Notes : Toutes les dimensions (hauteur, largeur et profondeur) sont indiquées en pouces. BSH se réserve le droit absolu et illimité de changer les matériaux du produit et les spécifications en tout temps, sans préavis. Veuillez consulter les instructions d'installation du produit pour les dimensions finales et autres détails avant la découpe.Garanties : Veuillez consulter le manuel d'utilisation et d'entretien ou le site Web de Bosch pour la déclaration de garantie limitée.Pour de plus amples renseignements sur notre gamme complète de produits, veuillez visiter notre site Web au www.bosch-home.ca ou composer le 1 800-944-2904© BSH Home Appliances Corporation. Tous droits réservés. Bosch est une marque déposée de Robert Bosch GmbH.Détails d'installationSérie 800 – Acier inoxydable HDS8655C7/23 CA。

Shaver series 9000 Lames V-Track PrecisionTêtes ContourDetect8 directionsTondeuse de précision SmartClickS9051/13La perfection à chaque passage Coupe jusqu'à 20 % de poils en plus* en un seul passageLe rasoir Series 9000 offre notre meilleur rasage à ce jour. La technologie exclusive ContourDetect est d'une efficacité exceptionnelle sur tous les contours de votre visage, tandis que le système V-Track guide les poils afin de leur donner une position de coupe optimale, pour un rasage de près.Conçu pour la perfectionLes lames guident les poils afin de leur donner une position optimale pour un rasagede prèsLes têtes s'inclinent dans 8 directions, pour un résultat impeccableUn rasage confortableObtenez un rasage à sec confortable ou rafraîchissant sur peau humide grâce ausystème AquaTecFacile à utiliserIcônes intuitives facilitant l'utilisation des modes60 minutes d’autonomie pour 1 h de chargeLe rasoir peut être rincé sous l'eau du robinetavec 2 ans de garantieObtenez le meilleur de votre rasoirAccessoire tondeuse clipsable pour une moustache et des pattes impeccablesPoints fortsLames V-Track PrecisionObtenez un rasage parfait. Les lames V-Track Precision positionnent les poilsidéalement pour une coupe optimale, quelle que soit leur longueur, et même s'ils sont couchés. Elles coupent 30 % plus près enmoins de passages, pour une peau préservée.Têtes ContourDetect 8 directionsSuivez les contours de votre visage et de votre cou grâce aux têtes ContourDetect quis'inclinent dans 8 directions. Vous couperez 20 % de poils en plus à chaque passage, pour un rasage de près confortable.AquaTec Wet & DryRasez-vous comme bon vous semble. Avec le système AquaTec Wet & Dry, vous pouvez opter pour un rasage à sec rapide etconfortable, ou vous raser sur peau humide -avec du gel ou de la mousse - même sous la douche.Tondeuse de précision SmartClickClipsez notre tondeuse de précisionrespectueuse de la peau pour parfaire votre style. C'est la solution idéale pour entretenir la moustache et tailler les pattes.Écran LED à 3 niveauxL'écran intuitif affiche des informations pratiques pour obtenir des performances optimales de votre rasoir : - Indicateurs decharge 3 niveaux et de verrouillage - Indicateur de nettoyage - Indicateur de batterie faible -Indicateur de remplacement des têtes60 minutes d’autonomieDésormais, grâce à la meilleure autonomie des rasoirs Philips, le système de charge offre deux options pratiques : 1 h de charge pour60 minutes d'autonomie, ou une charge rapide pour un rasage. Tous les modèles de rasoirs Series 9000 sont conçus pourfonctionner uniquement en mode sans fil, pour une sécurité totale en milieu humide.Rasoir entièrement lavableIl vous suffit d'ouvrir la tête de rasage et de larincer soigneusement sous l'eau.iF DESIGN AWARD 2015Rasoir Series 9000Précision, maîtrise et maniabilité sont les caractéristiques clés du rasoir Series 9000. Le système V-Track guide les poils afin de leur donner une position de coupe optimale, pour un rasage de près, tandis que les têtes flottantes 8 directions coupent plus de poils à la fois, pour un résultat net en moins de passages. Le système AquaTecWet & Dry permet un rasage à sec agréable ou un rasage rafraîchissant à l'eau, avec un gel ou une mousse à raser, pour encore plus deconfort.Logo « Produit Vert » PhilipsLes produits verts de Philips permettent de réduire les coûts, la consommationénergétique et les émissions de ment ? Grâce à une améliorationenvironnementale significative dans un ou plusieurs de nos champs d'actionsécologiques clés (efficacité énergétique,conditionnement, substances dangereuses,poids, recyclage, recyclabilité et durabilité).CaractéristiquesPerformance de rasageSuivi des contours: Têtes ContourDetect8 directionsSkinComfort: AquaTec Wet & DrySystème de rasage: Lames V-Track Precision, Système Super Lift&CutAccessoiresSmartClick: Tondeuse de précision Trousse: Trousse de voyage Facile d'utilisationAfficheur: Indicateur d'autonomie à 3 niveaux,Voyant de charge faible, Voyant de nettoyage,Voyant de remplacement des têtes, Indicateurde verrouillage pour les transportsNettoyage: Entièrement lavableDesignCouleur: CeresManche: Design ergonomique pour une bonneprise en mainAlimentationType de batterie: Lithium-ionAutonomie: 60 min / 20 rasagesCharge: Charge complète en 1 heure, Chargerapide pour un rasageTension automatique: 100-240 VConsommation en veille: 0,1 WConsommation maximale: 9 WEntretienDeux ans de garantieTête de rechange: Remplacer tous lesdeux ans avec SH90* Coupe jusqu'à 20 % de poils en plus par rapport auxmodèles SensoTouch© 2019 Koninklijke Philips N.V. Tous droits réservés.Les caractéristiques sont sujettes àmodification sans préavis. Les marques commerciales sont la propriété de Koninklijke Philips N.V. ou de leurs détenteurs respectifs.Date de publication 2019‑08‑01Version: 2.0.1EAN: 08 71010 37822 23 。
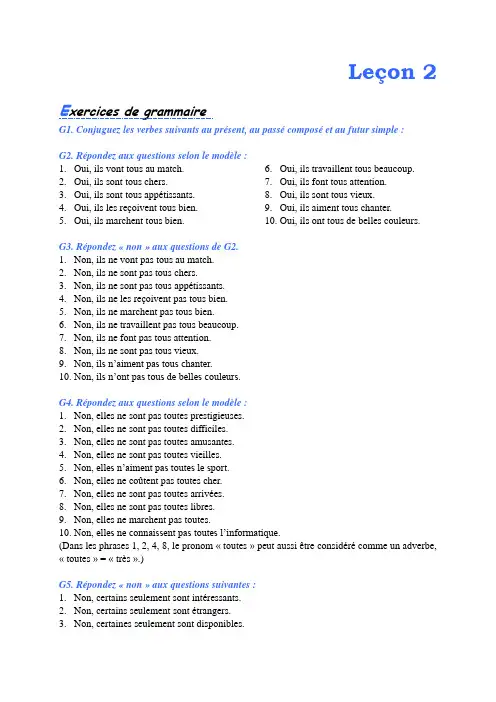
Leçon 2 E xercices de grammaireG1. Conjuguez les verbes suivants au présent, au passé composé et au futur simple :G2. Répondez aux questions selon le modèle :1.Oui, ils vont tous au match.2.Oui, ils sont tous chers.3.Oui, ils sont tous appétissants.4.Oui, ils les reçoivent tous bien.5.Oui, ils marchent tous bien.6.Oui, ils travaillent tous beaucoup.7.Oui, ils font tous attention.8.Oui, ils sont tous vieux.9.Oui, ils aiment tous chanter.10.Oui, ils ont tous de belles couleurs.G3.Répondez « non » aux questions de G2.1.Non, ils ne vont pas tous au match.2.Non, ils ne sont pas tous chers.3.Non, ils ne sont pas tous appétissants.4.Non, ils ne les reçoivent pas tous bien.5.Non, ils ne marchent pas tous bien.6.Non, ils ne travaillent pas tous beaucoup.7.Non, ils ne font pas tous attention.8.Non, ils ne sont pas tous vieux.9.Non, ils n’aiment pas tous chanter.10.Non, ils n’ont pas tous de belles couleurs.G4.Répondez aux questions selon le modèle :1.Non, elles ne sont pas toutes prestigieuses.2.Non, elles ne sont pas toutes difficiles.3.Non, elles ne sont pas toutes amusantes.4.Non, elles ne sont pas toutes vieilles.5.Non, elles n’aiment pas toutes le sport.6.Non, elles ne coûtent pas toutes cher.7.Non, elles ne sont pas toutes arrivées.8.Non, elles ne sont pas toutes libres.9.Non, elles ne marchent pas toutes.10.Non, elles ne connaissent pas toutes l’informatique.(Dans les phrases 1, 2, 4, 8, le pronom « toutes » peut aussi être considéré comme un adverbe, « toutes » = « très ».)G5.Répondez « non » aux questions suivantes :1.Non, certains seulement sont intéressants.2.Non, certains seulement sont étrangers.3.Non, certaines seulement sont disponibles.4.Non, certains seulement peuvent avoir des réductions.5.Non, certains seulement sont encore ouverts à 21 heures.6.Non, certaines seulement sont confortables.7.Non, certains seulement aiment parler du problème d’argent.8.Non, certaines seulement sont bavardes.9.Non, certaines seulement sont prestigieuses.10.Non, certains seulement travaillent beaucoup.G6. Choisissez la bonne réponse :1. b2. b3. b4. d5. d6. b7. c8. b9. d10. cG7. Même exercice :1. d2. b3. b4. a5. b6. d7. a8. c9. d10. cG8. Répondez négativement :1.Non, aucun élève n’a d’ami français.2.Non, personne ne t’a demandé au téléphone.3.Non, je n’ai rien v u.4.Non, elle n’écrira à aucune de ses amies.5.Non, je n’ai vu aucune de ses photos.6.Non, il n’a rien acheté en France.7.Non, il n’a rien vu d’extraordinaire.8.Non, personne ne m’attend.9.Je ne pense à rien.10.Non, je n’ai rencontré personne dans la rue.G9. Remplacez le blanc par « aucun, aucune, rien, personne » :1.aucune2.rien3.personne4.Personne5.aucune6.aucun7.rien8.aucun9.aucune10.rienG10.a) Complétez les phrases suivantes en introduisant « les uns...les autres, les unes...les autres » :1.les unes, les autres2.les uns, les autres3.les uns, les autres4.les uns, les autres5.les unes, les autresb) Complétez les phrases suivantes en introduisant «certains...d’autres, certaines…d’ autres » :1.Certains2.Certains, d’autres3.certains, d’autres4.certains5.CertainsG11. Mettez les phrases suivantes au passé composé :1.Mon frère a tout vu.2.Ils ont parlé de tout.3.Elle ne s’est occupée de personne.4.Je n’ai rien cru.5.Ils n’ont jamais invité personne.6.Elle n’a rien reçu du tout.7.Nous n’avons vu personne entrer.8.Elles les ont tous rencontrés.9.Ma mère ne m’a rien donné à laver.10.Ces gens-là ont beaucoup voyagé mais ils n’ont rien vu.E xercices de vocabulaireV1. Complétez les phrases suivantes avec les mots suivants :1.obligé2.le premier3.(n’)y arrive4.Si5.de temps en temps6.soi7.Dans la plupart du temps8.joindre les deux bouts9.ont du mal10.se fermeV2. Choisissez la bonne réponse :1. c2. a3. d4. b5. d6. a7. b8. a9. d10. bV3. Choisissez le mot correct:1.ont2.prendre3.met4.faire5.ouvert6.difficultés7.en argent liquide8.gagner9.d’argent10.c’V4. Complétez avec les mots proposés :1.budget2.argent3.mal4.économies5.attention6.fortune7.plupart8.discussion9.consommation10.RéductionV5. Quels sont les antonymes des mots en italique ?1-f 2-e 3-j4-i 5-g 6-h 7-a 8-d 9-c 10-bE xercices de structureS1. Le coût de la vie :1.Un voyage Beijing-Nanjing coûte 1 000 yuans.2.Une guitare électronique coûte 1 200 yuans.3.Un téléphone mobile coûte 600 yuans.4.Une caméra coûte 4 500 yuans.5.Le dernier modèle de Peugeot coûte 140 000 yuans.6.Un MP4 coûte 1 200 yuans.7.Un ordinateur portable coûte 10 000 yuans.8.Une télévision coûte 1600 yuans.9.Une moto coûte 23 000 yuans.10.Un magnétophone coûte 550 yuans.S2. Répondez aux questions selon le modèle :Modèle : Lui faut-il suivre des cours pour être programmeur ?→Oui, il est obligé de suivre des cours pour être programmeur.1.Oui, je suis obligé(e) de faire mon budget tous les mois.2.Oui, il est obligé de payer la consommation pour son amie.3.Oui, nous sommes obligé(e)s de faire attention à nos dépenses.4.Oui, ils sont obligé de faire des économies pour acheter un ordinateur portable.5.Oui, je suis obligé(e) de prendre le métro pour aller à l’école.6.Oui, il est obligé de montrer son bulletin de salaire à sa femme.7.Oui, nous sommes obligé(e)s d'appre ndre tous les textes par cœur.8.Oui, ils sont obligé de travailler dur pour payer leur appartement.9.Oui, il est obligé de prendre des tas de médicaments chaque jour.10.Oui, je suis obligé(e) de passer un concours difficile pour être reçu à cette école.S3. Transformez les phrases suivantes selon le modèle :Exemple : Les femmes ne paient pas dans certains milieux selon la tradition.→Ce sont les femmes qui ne paient pas dans certains milieux selon la tradition.1.C'est la classe Marc qui reçoit un groupe de visiteurs français.2.Ce sont les jeunes qui représentent la grande majorité des consommateurs.3.Ce sont les étudiants qui ont des réductions dans beaucoup de cinémas, de théâtres et demusées.4.Ce sont les jeunes Français qui achètent des CD ou des albums de musique.5.Ce sont les Français qui parlent souvent de l’argent des autres.6.C'est elles qui travaillent pendant l’été pour gagner de l’argent de poche.7.C'est moi qui paie mes repas, mes livres, mes jeux vidéo, etc.8.C'est elle qui abandonnera ses études universitaires.9.C'est vous qui trouverez du travail dans une société internationale.10.C'est eux qui dépensent beaucoup d’argent ces jours-ci.E xercices audio-orauxA1. Écoutez et remplissez les blancs :écoute, banlieue, profession, finissez, d’heure, pratiq uez, ski, réponds A2. Choisissez la bonne réponse :1.en banlieue2.programmeur3.dans un bistro4.à neuf heures5.en train6.au cinéma7.le skiE xercices écritsE1. Comme vos ressources sont limitées, vous y faites bien attention. Décrivez votre budget.(réponse libre)E2. Traduisez en français :1.- En général, les étudiants paient-ils en (argent) liquide / en espèces ou par carte decrédit ?- Ils préfèrent / ont tendance à payer par carte de crédit.2.- Est-ce que tu paies ton loyer tous les mois ?- Non, je paie une fois par an.3.- Combien est-ce que tu paies ton loyer ?- Je paie 200 yuans par mois.4.- Je vous dois combien ? / Combien vous dois-je ?- 500 yuans, Mademoiselle.5.- Ces vêtements sont vraiment très jolis ! / Comme (ou : Que / Combien) cesvêtements sont jolis ! / Quels jolis vêtements !- Oui, ils sont jolis, mais regarde le prix !6.- Est-ce que c’est toi qui achètes / paies tes habits / vêtements ?- Oui, (dans) la plupart du temps.7.- Est-ce que tu vois souvent des films ? / Est-ce que tu vas souvent au cinéma ?- Non, pas souvent.- Les étudiants bénéficient-ils de réductions ?- Oui, ils bénéficient d’une réduction / Ils ont une réduction de trente pour cent.8.- Combien dépenses-tu chaque mois ?- Ça dépend, entre 500 et 600 yuans.9.- Comb ien d’argent est-ce que tes parents te donnent par mois ?- 700 yuans.10.- Est-ce que tu fais des économies ?- J’aimerais bien / J’espère / J’ai envie de faire des économies, mais je n’y arrive pas.参考译文课文A个人预算(马克和他的法国朋友洛朗的对话)-你做个人预算吗,马克?-是的,我每个月都做预算。
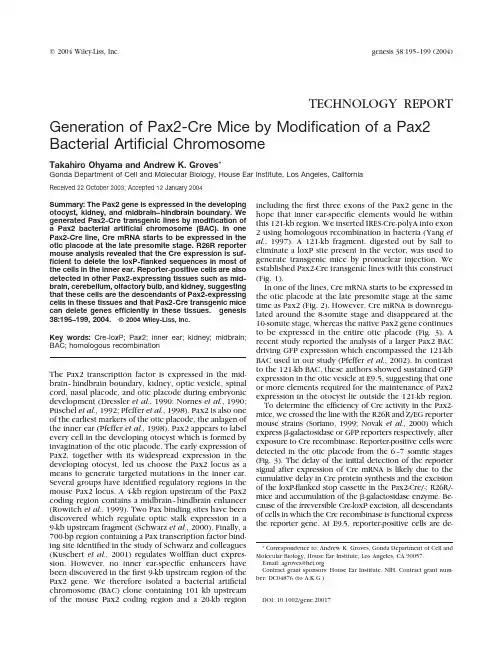
TECHNOLOGY REPORT Generation of Pax2-Cre Mice by Modification of a Pax2 Bacterial Artificial ChromosomeTakahiro Ohyama and Andrew K.Groves*Gonda Department of Cell and Molecular Biology,House Ear Institute,Los Angeles,CaliforniaReceived22October2003;Accepted12January2004Summary:The Pax2gene is expressed in the developing otocyst,kidney,and midbrain–hindbrain boundary.We generated Pax2-Cre transgenic lines by modification of a Pax2bacterial artificial chromosome(BAC).In one Pax2-Cre line,Cre mRNA starts to be expressed in the otic placode at the late presomite stage.R26R reporter mouse analysis revealed that the Cre expression is suf-ficient to delete the loxP-flanked sequences in most of the cells in the inner ear.Reporter-positive cells are also detected in other Pax2-expressing tissues such as mid-brain,cerebellum,olfactory bulb,and kidney,suggesting that these cells are the descendants of Pax2-expressing cells in these tissues and that Pax2-Cre transgenic mice can delete genes efficiently in these tissues.genesis 38:195–199,2004.©2004Wiley-Liss,Inc.Key words:Cre-loxP;Pax2;inner ear;kidney;midbrain; BAC;homologous recombinationThe Pax2transcription factor is expressed in the mid-brain–hindbrain boundary,kidney,optic vesicle,spinal cord,nasal placode,and otic placode during embryonic development(Dressler et al.,1990;Nornes et al.,1990; Pu¨schel et al.,1992;Pfeffer et al.,1998).Pax2is also one of the earliest markers of the otic placode,the anlagen of the inner ear(Pfeffer et al.,1998).Pax2appears to label every cell in the developing otocyst which is formed by invagination of the otic placode.The early expression of Pax2,together with its widespread expression in the developing otocyst,led us choose the Pax2locus as a means to generate targeted mutations in the inner ear. Several groups have identified regulatory regions in the mouse Pax2locus.A4-kb region upstream of the Pax2 coding region contains a midbrain–hindbrain enhancer (Rowitch et al.,1999).Two Pax binding sites have been discovered which regulate optic stalk expression in a 9-kb upstream fragment(Schwarz et al.,2000).Finally,a 700-bp region containing a Pax transcription factor bind-ing site identified in the study of Schwarz and colleagues (Kuschert et al.,2001)regulates Wolffian duct expres-sion.However,no inner ear-specific enhancers have been discovered in thefirst9-kb upstream region of the Pax2gene.We therefore isolated a bacterial artificial chromosome(BAC)clone containing101kb upstream of the mouse Pax2coding region and a20-kb region including thefirst three exons of the Pax2gene in the hope that inner ear-specific elements would lie within this121-kb region.We inserted IRES-Cre-polyA into exon 2using homologous recombination in bacteria(Yang et al.,1997).A121-kb fragment,digested out by SalI to eliminate a loxP site present in the vector,was used to generate transgenic mice by pronuclear injection.We established Pax2-Cre transgenic lines with this construct (Fig.1).In one of the lines,Cre mRNA starts to be expressed in the otic placode at the late presomite stage at the same time as Pax2(Fig.2).However,Cre mRNA is downregu-lated around the8-somite stage and disappeared at the 10-somite stage,whereas the native Pax2gene continues to be expressed in the entire otic placode(Fig.3).A recent study reported the analysis of a larger Pax2BAC driving GFP expression which encompassed the121-kb BAC used in our study(Pfeffer et al.,2002).In contrast to the121-kb BAC,these authors showed sustained GFP expression in the otic vesicle at E9.5,suggesting that one or more elements required for the maintenance of Pax2 expression in the otocyst lie outside the121-kb region. To determine the efficiency of Cre activity in the Pax2-mice,we crossed the line with the R26R and Z/EG reporter mouse strains(Soriano,1999;Novak et al.,2000)which express-galactosidase or GFP reporters respectively,after exposure to Cre recombinase.Reporter-positive cells were detected in the otic placode from the6–7somite stages (Fig.3).The delay of the initial detection of the reporter signal after expression of Cre mRNA is likely due to the cumulative delay in Cre protein synthesis and the excision of the loxP-flanked stop cassette in the Pax2-Cre/-;R26R/-mice and accumulation of the-galactosidase enzyme.Be-cause of the irreversible Cre-loxP excision,all descendants of cells in which the Cre recombinase is functional express the reporter gene.At E9.5,reporter-positive cells are de-*Correspondence to:Andrew K.Groves,Gonda Department of Cell and Molecular Biology,House Ear Institute,Los Angeles,CA90057.E-mail:agroves@Contract grant sponsors:House Ear Institute,NIH,Contract grant num-ber:DC04876(to A.K.G.).DOI:10.1002/gene.20017©2004Wiley-Liss,Inc.genesis38:195–199(2004)tected in the nephric duct,mesencephalon,metencepha-lon,and the otic vesicle (Fig.3).Although some cells in the dorsoposterior part of the otic vesicle are reporter-negative at E9.5,most cells in the cochlea duct and vestibular sen-sory epithelia derived from the otocyst are reporter-positive at postnatal day 0(Fig.4a).For instance,the organ of Corti,stria vascularis,inner layer of Reissner’s mem-brane,and the acoustic ganglion are all reporter-pos-itive,and the sensory epithelia of the utricle,saccule,and three semicircular canals are also reporter-posi-tive,although some cells in the posterior crista are reporter-negative (Fig.4b–e).We suspect the report-er-negative cells in the inner ear may correspond to the very last Pax2cells to be induced in the otic placode,and these cells are induced after Cre mRNA is downregulated in our mouseline.FIG.1.Schematic drawing of the Pax2-Cre construct used in this study.The BAC clone 242K18was isolated by library screening.The BamHI-XhoI fragment indi-cated as a green line was used for the probe.For the BAC recombi-nation cassette,the 1.2-kb frag-ment,and the 0.6-kb fragment were used as homology arms A and B,ing homol-ogous recombination in bacteria,IRES-Cre-polyA was inserted into the exon 2of the Pax2gene in the 242K18.The 121kb SalI fragment was used for transgenic mouseproduction.FIG.2.Initial expression of Cre mRNA in the otic placode.Wholemount in situ hybridization from 0–5somite stage (ss)is shown with Pax2in wildtype (left),Pax8in wildtype (middle),and Cre in the Pax2-Cre/-mouse (right).Cre mRNA starts to be expressed in the otic placode (arrowheads)at the late presomite stage at the same time as Pax2.mhb,midbrain–hindbrain boundary;op,optic placode.196OHYAMA AND GROVESIn addition to the otocyst,descendants of Cre-express-ing cells in the midbrain–hindbrain boundary give rise to the majority of the midbrain and cerebellum at late gestational ages (Fig.4f–i).Reporter-positive cells in the embryonic kidney are detected after the 12-somite stage and the glomerulus,collecting duct and the ureter are reporter-positive in this line at later ages (Fig.4j–l).The major difference between Cre expression in this line and the endogenous Pax2expression is that Cre is not ex-pressed in the optic vesicle.Therefore,no reporter-positive cell is detected in the optic vesicle at E9.5(Fig.3).This absence of optic vesicle staining has also been observed with another larger Pax2BAC (Pfeffer et al.,2002).The isolation of tissue-specific enhancer elements can be a time-consuming process.The use of homologous recombination to modify BAC DNA allows large genomic regions to be tested for tissue-specific expression.An-FIG.3.Downregulation of Cre mRNA and Cre activity shown by a R26R reporter mouse assay.Wholemount in situ hybridization from 6somite stage (ss to E9.5against Pax2in wildtype (left)and Cre in the Pax2-Cre/-mouse (middle).Cre mRNA disappears at 10ss,whereas the native Pax2gene continues to be expressed in the entire otic placode (arrowheads).Ectopic Cre expression is detected in the first branchial arch (ba).In the Pax2-Cre/-;R26R/-mouse (right),reporter-positive cells are detected in the nephric duct (nd),mesencephalon (mes),metencephalon (met),and the otic vesicle (ov).e.epibranchial placodes.197GENERATION OF PAX2-CRE MICEFIG.4.Reporter assay at postnatal day 0in the Pax2-Cre/-;R26R/-mouse (a–f,j )and at E15.5in the Pax2-Cre/-;Z/EG/-mouse (g–i,k,l ).a:Right inner ear,cleared with methyl salicylate.b–d:Paraffin sections of the posterior crista (b ),saccular macula (c )and the cochlea (d ).Approximate locations of each section are indicated in a .e:A high-power image of the cochlea duct indicated as a square in d .f:Hemisection of the brain.g–i:Gelatin sections of the brain stained with anti-GFP antibody (g ),DAPI (h )and a high-power image of the hindbrain indicated as a square in g .Arrowheads in g indicate the axonal projections from the midbrain.j:Postnatal mouse showing kidney and nephric duct expression.k,l:Gelatin sections of the kidney stained with anti-GFP antibody (k )and a high-power image indicated as a square in k .ag,acoustic ganglion;c,cerebellar primodium;ce,cerebellum;cm,condensing mesenchyme;cd,collecting duct;cp,choroid plexus;g,glomeruli;m,midbrain;oc,organ of Corti,ob,olfactory bulb;rm,Reissner’s membrane;rp,renal pelvis;sv,stria vascularis;u,ureter.198OHYAMA AND GROVESother advantage of the BAC modification strategy used here is its ability to successively modify BACs to create further insertions or deletions.The mice generated from the Pax2BAC in this study are suitable for gene deletion studies in the ear,midbrain,and kidney.Since some elements shown to drive midbrain and kidney expres-sion have already been identified in the Pax2promoter (Rowitch et al.,1999;Kuschert et al.,2001),it is possi-ble that deletion of these sequences in the Pax2BAC we have isolated may lead to a mouse line that drives Cre expression exclusively in the inner ear.It will also be of interest to use the Pax2-Cre mice described here as a lineage tracer of the Pax2descendants in the otic and epibranchial placodes,mid-hindbrain boundary,and kid-ney.These experiments are currently in progress. MATERIALS AND METHODSBAC Screening and ModificationFor BAC screening,we isolated anϳ3.3kb fragment containing part of the mouse Pax2exon1,the entirefirst intron,and part of exon2from mouse genomic DNA by PCR,using primers5Ј-CCCCGGGGCTGCGTTGCT-GACTGC-3Јand5Ј-GACCCGCAGCTGCCGGGAGAT-GTC-3Ј.This fragment was cloned into pGEM-T easy vector(Promega,Madison,WI).The BamHI-XhoI frag-ment was used as a probe to screen the BAC library (Research Genetics,Huntsville,AL;No.96022).One of thefive positive clones,242K18,contained the mouse Pax2locus and BAC end sequencing was performed to confirm that242K18contained about101kb upstream of the Pax2ATG and20kb downstream including the first three exons of the Pax2gene.For modification of the Pax2BAC,we performed Pfu PCR(PfuTurbo:Strat-agene,La Jolla,CA)from242K18BAC DNA using prim-ers described above,attaching a BamHI site to the sec-ond primer,then used the SacI(blunted)-BamHI fragment as the1.2kb homology arm A.We also per-formed another Pfu PCR using primers5Ј-GTGGTGAG-GCAGCGCATCGTGGAG-3Јand5Ј-CATGTCTAGAT-GGGCTTGGAGCCACCAATCACTC-3Јfor the0.6kb homology arm B,which contains a part of exon2, the entire second intron,and a part of exon3.We inserted arms A and B into the building vector pBV. Tags.IRES.EGFP(a gift of W.Yang and N.Heintz) and replaced IRES-GFP-polyA with IRES-Cre-polyA from pGEM7X(2X)IRESCre*RBGlpAc1.9(a gift of K.Jones). BAC modification was performed according to Yang et al.(1997).As a result,IRES-Cre-polyA was inserted into exon2of the Pax2gene in242K18(Fig.1).BAC Transgenic MiceThe Pax2-Cre BAC DNA fragment was purified by SalI digestion of the modified242K18BAC DNA,followed by pulsefield gel electrophoresis,and isolation of the121-kb insert.This fragment was eluted by electrophoresis in dial-ysis tubing(GIBCO,Gaithersburg,ME;No.15961-014,dis-continued)and the DNA solution was dialyzed with injec-tion buffer(10mM Tris(pH7.5),0.1mM EDTA(pH8.0), 100mM NaCl)followed by phenol-chloroform extraction.Purified DNA was then used for pronuclear injection.Two of four founders had germline transmission.All data in this study are from one of them in which Cre mRNA is ex-pressed stronger than the other.Pax2-Cre mice are main-tained on CD1background and genotyped by PCR of Cre cDNA with primers5Ј-GCCTGCATTACCGGTCG-ATGCAACGA-3Јand5Ј-GTGGCAGATGGCGCGGCAACAC-CATT-3Ј.R26R-reporters(Soriano,1999)and Z/EG report-ers(Novak et al.,2000)were obtained from Jackson Laboratory(Bar Harbor,ME),genotyped according to the protocols provided,and maintained as homozygotes.-Galactosidase Staining and Wholemount In Situ HybridizationX-gal staining and wholemount in situ hybridization were performed by standard protocols(Myat et al., 1996;Zinyk et al.,1998).Detailed protocols are available upon request.Probes used in this study were a C-termi-nal fragment(570bp)of mouse Pax2cDNA(provided by G.Dressler),a0.7-kb fragment of mouse Pax8cDNA(an XhoI-HindIII fragment from a clone provided by M.Bus-slinger),and a BamHI-PstI fragment of Cre cDNA(0.7kb) subcloned into pBluescript II. ACKNOWLEDGMENTSWe thank Nancy Wu and Youzhen Yan at the USC/Norris Cancer Center transgenic core facility for DNA injection. We thank Rebecca Ferreira,Vincent Flournoy,Cami Varela,Aldo Castillo,Roberta Arana,Juan Llamas,Welly Makmura,and Sheri Juntilla for animal maintenance and genotyping.We thank Xiomara Padilla for excellent tech-nical support.We thank all Groves lab members and CMB members for help.LITERATURE CITEDDressler GR,Deutsch U,Chowdhury K,Nornes HO,Gruss P.1990.Pax2,a new murine paired-box-containing gene and its expression in the developing excretory system.Development109:787–795. Kuschert S,Rowitch DH,Haenig B,McMahon AP,Kispert A.2001.Characterization of Pax-2regulatory sequences that direct trans-gene expression in the Wolffian duct and its derivatives.Dev Biol 229:128–140.Novak A,Guo C,Yang W,Nagy A,Lobe CG.2000.Z/EG,a double reporter mouse line that expresses enhanced greenfluorescent protein upon Cre-mediated excision.genesis28:147–155. Pfeffer PL,Payer B,Reim G,di Magliano MP,Busslinger M.2002.The activation and maintenance of Pax2expression at the mid-hind-brain boundary is controlled by separate enhancers.Development 129:307–318.Rowitch DH,Kispert A,McMahon AP.1999.Pax-2regulatory se-quences that direct transgene expression in the developing neural plate and external granule cell layer of the cerebellum.Brain Res Dev Brain Res117:99–108.Schwarz M,Cecconi F,Bernier G,Andrejewski N,Kammandel B, Wagner M,Gruss P.2000.Spatial specification of mammalian eye territories by reciprocal transcriptional repression of Pax2and Pax6.Development127:4325–4334.Soriano P.1999.Generalized lacZ expression with the ROSA26Cre reporter strain.Nat Genet21:70–71.Yang XW,Model P,Heintz N.1997.Homologous recombination based modification in Escherichia coli and germline transmission in transgenic mice of a bacterial artificial chromosome.Nat Biotech-nol15:859–865.199GENERATION OF PAX2-CRE MICE。

Réalise un panoramique de la vue autour del’écran.WinDVD mémorise automatiquement le dernier emplacement consulté sur le DVD.Etablit un lien vers le site Web Internet.Lance la famille d’applications de WinCinema.NOTIFICATIONLes informations contenues dans ce manuel peuvent être modifiées sans préavis.COMPAQ COMPUTER CORPORATION NE SAURAIT ÊTRE TENU RESPONSABLE DES ÉVENTUELLES ERREURS OU OMISSIONS TECHNIQUES OU RÉDACTIONNELLES DE CE DOCUMENT AINSI QUE DES DOMMAGES ACCIDENTELS OU INDIRECTS RELATIFS A L’ÉQUIPEMENT, AUX PERFORMANCES OU A L’UTILISATION DE CE MATÉRIEL.Ce manuel contient des informations protégées par les droits d’auteurs. Il est nécessaire d’obtenir l’accord écrit de Compaq Computer Corporation avant de reproduire ou de photocopier une partie de ce manuel. ©2001 Compaq Computer Corporation. Tous droits réservés.Compaq est une marque enregistrée auprès du Bureau américain des brevets et des marques déposées (U.S. Patent and Trademark Office).Imprimé au Royaume-Uni, États-Unis, Brésil et Canada.Les noms de produits mentionnés et/ou enregistrés dans la présente sont des marques de leurs sociétés respectives.Première édition, juin 2001INFORMATION IMPORTANTE : MODE D’EMPLOI DU LECTEUR DVDVotre PC Internet Compaq PresarioTM contient le logiciel DVD à jour. Les boutons de contrôle à l’écran, qui vous permettent d’accéder rapidement et facilement aux fonctions du lecteur DVD, diffèrent légèrement de ceux décrits dans le guide de l’utilisateur Compaq.Le tableau ci-dessous fournit des détails concernant des boutons particuliers du lecteur DVD. Les autres fonctions restent identiques à celles décrites dans le guide d’utilisation.BoutonDescriptionOuvre la fenêtre Liste de lecture, qui vous permetde choisir un ordre et un groupe de fichiersspécifiques. Vous avez le choix entre des fichiers .vob, .dat, .mpg et .ac3. Vous ne pouvez passélectionner un fichier tant que la lecture d’un filmest en cours.Ouvre la fenêtre Propriétés.Réorganise, réduit, agrandit et ferme la fenêtrevidéo WinDVD.Ejecte le disque.Arrête la lecture.Démarre la lecture.Marque une pause lors de la lecture.BoutonDescriptionFait avancer le film image par image en modePause.Revient au début du titre ou du chapitre en cours.Passe au chapitre précédent.Passe au chapitre suivant.Lit le disque en mode de retour arrière rapide.Lit le disque en mode d’avance rapide.Affiche d’autres boutons.Reprend la lecture d’une vidéo à partir d’un écranOuvre le système d’aide en ligne.Augmente ou diminue le niveau de la sortie audio.Permet un retour et une avance rapides fluides.BoutonDescriptionCoupe le son lorsque cette case est cochée.Vous permet d’utiliser les touches de direction comme vous le feriez avec la souris ou la touche Tab. Les flèches vous permettent (dans l’ordre des aiguilles d’une montre en partant du haut) : Déplacement vers la droite, Déplacement vers le bas, Déplacement vers la gauche. Centre : Sélection ou Entrée. Le clavier numérique est l’une des méthodes vous permettant de sélectionner des nombres. Vous les utiliserez plus lors de la lecture d’un CD vidéo que d’un disque DVD. Chaque fois que vous voulez entrer une valeur numérique, cliquez sur la touche correspondante sur le clavier numérique puis cliquez sur la coche pour accepter ce nombre.Affiche tous les menus disponibles (Principal, Langue audio, Sous-titres, etc.) sur le disque DVD en cours de lecture et vous permet dechoisir le menu dans lequel vous déplacer.Ouvre un sous-menu proposant tous les titres disponibles sur le disque DVD en cours de lectureet vous permet de choisir le titre à lire. Ouvre un sous-menu indiquant le chapitre en cours de lecture. Vous pouvez sélectionner un autre chapitre dans ce menu.Affiche le menu des sous-titres. Si des sous-titres en plusieurs langues sont disponibles, utilisez ce menu pour choisir votre langue.Si cela est possible, sélectionne l’angle de vue à partir d’une liste d’angles de vue en option.。

Nom1.La population de la France compte aujourd’hui plus de 60——habitants.(09) A.million d’ B.millions d’ C.million D.millions2.·Rhinocéros et La Cantatrice chauve sont les——d’Eugène Ionesco.(08) A.chef-d’œuvre B.chefs-d’œuvre C.chef-d’œu vres D.chefs-d’œuvre s3.La réunion va commencer dans——.(08)A.une demie-heure B.une heure et demiC.une demie heure D.une demi-heureArticle1.Je fais souvent des voyages dans le monde,mais je n’ai jamais été——Etats—Unis.(09)A.en B.àl’ C.au D.aux2.Une dé1égation française a rendu visite récemment à plusieurs provinces de Chine, dont ___________. (09)A.le Jiangsu B.la Jiangsu C.1es Jiangsu D.Jiangsu3.Ce matin,il a fait——vent terrible.(07)A.du B.le C.un D.de4.Les tomates sont à combien——kilo? (07)A.1e B.chaque C.un D.par5. J’ai acheté un kilo de pain et des saucisses. _____ pain est tout frais.A. UnB. DuC. DeD. Le6. Avec _____ bonne humeur et _____ grands efforts, on vient à bout des choses les plus difficiles.A. de la, deB. de la, desC. la, deD. la, desAdjectif1.Les faits sont——je vous les ai racontés.(09)A.telles que B.tel que C.tels que D·ce que2.Après une journée——,je me couche très tôt le soir.(08)A.épuiséB.épuisée C.épuisant D.épuisante3.La mère ne sait pas comment rendre sa fille——.(08)A。

フォーカスレンジ(AF駆動範囲)を切り替えるAFの駆動範囲を切り替えて、ピント合わせの時間を短縮できます。
撮影距離が一定の範囲内に限られている場合に便利です。
フォーカスレンジ切り替えスイッチで、撮影距離範囲を選択する。
••FULL•:••距離制限はありません。
全域でピント合わせが可能です。
••10m-2.4m:•10•mから2.4•mの範囲でピント合わせが可能です。
••∞-10m:••無限遠から10•mの範囲でピント合わせが可能です。
主な仕様商品名(型名)FE 200-600mm F5.6-6.3 G OSS(SEL200600G)焦点距離(mm)200-600焦点距離イメージ*1(mm)300-900レンズ群一枚17-24画角1*212°30'-4°10'画角2*28°-2°40'最短撮影距離*3(m)2.4最大撮影倍率(倍)0.2最小絞りF32-F36フィルター径(mm)95外形寸法(最大径×長さ)(約:mm)111.5×318質量(約:g)(三脚台座別)2,115手ブレ補正機能ありテレコンバーター(別売)との互換情報、装着時の主な仕様については専用サポートサイトでご確認ください。
http://support.d-imaging.sony.co.jp/www/cscs/lens_body/*1•撮像素子がAPS-Cサイズ相当のレンズ交換式デジタルカメラ装着時の35mm判換算値を表します。
*2•画角1は35mm判カメラ、画角2はAPS-Cサイズ相当の撮像素子を搭載したレンズ交換式デジタルカメラでの値を表します。
*3•最短撮影距離とは、撮像素子面から被写体までの距離を表します。
••レンズの機構によっては、撮影距離の変化に伴って焦点距離が変化する場合があります。
記載の焦点距離は撮影距離が無限遠での定義です。
同梱物(()内の数字は個数)レンズ(1)、レンズフロントキャップ(1)、レンズリヤキャップ(1)、三脚台座(1)、レンズフード(1)、レンズケース(1)、レンズストラップ(1)、印刷物一式仕様および外観は、改良のため予告なく変更することがありますが、ご了承ください。
WETLAND ANIMALSINVERTEBRATES –FRITZ REID 11/3/04But:Aquatic SnailsA)Lung-breathing; Pulmonatanon-operculated; terrestrial originBiomphalaria ,Bulinus(disease vectors)mutualistic relationships with submersed plantsPlanorbella campanula (Say, 1821)Freshwater snails genus Biomphalaria -most important & widely distributed intermediate hosts of the blood fluke Schistosoma mansoniSchistosomiasis -debilitating & eventually fatal disease§West to east dispersal of S. American g labrata -like taxon (e.g. eggs on legs of migrating birds; rafting onvegetation mats washed out of the Amazon), giving rise to all African taxa §African Plio-Pleistocene derivatives become hosts for schistosomes (*2-5Mya) coincident with arrival of S. mansoni )§B. glabrata evolved in situ in New World with other S. American taxa .* Snyder & Loker (2000) J. of Parasitology , 46, 629-641.Morgan et al.( 2001) Parasitology , 123, S211-S224.B. pfeifferi B. sudanica Plio-Pleistocene dispersalancestralBiomphalariaB. alexandrinaB. glabrataB) Gill-breathing;Prosobranchia –important pests Pomacea (apple snail) –the gill/lung combination asan adaptation to oxygen poor conditions operculumPomacea flagelataegg clutch-feed on aquatic vegetation-several reproductive cycles, egg clutches -periods of aestivation (anaerobic respiration)Predators: birds, turtles, fishes, insects and crocodiles Protection: closing the shell; camouflage; drop-off and burialEgg protection:Humans who tasted the eggs described them as "completely tasteless at first, but after chewing them for about half a minute, an overwhelming bitter-nauseating flavour assaulted the rear portion of the palate" (Snyder & Snyder, 1971)Marisa cornuarietis –a freshwater prosobranch from Venezuela used for biological control of Biomphalaria glabrata on the island ofGuadeloupe (Pointier and David, Biol. Contr. 29: 81, 2003)Pomacea canaliculata –golden apple snail Introduced to Asia in 1980 as a proteinsource, invaded rice fields, Philippines (the cost of control > US $ billion/year); health problems -lungworm (Guadeloupe and Suriname)Ambio 25:443, 1996Amphibians and Reptiles :Frogs -change from aquatic to terrestrial form -suited to seasonal wetland environmentsSalamanders Crocodilians-remnants of great age of reptiles, Mesozoic era, 200 mil.years of evolutionary history-extremely well adapted to their environment (poikilothermic)-energy efficient metabolism (60% stored as fat); buoyance effect-mostly freshwater but some saltwater –salt glands on the tongue -top predators-keep the waterways open, “gator holes”THREATS: hunting, pollution deforestation, habitat loss Captive breedingAlligatorsAmerican alligator,Alligator mississippiensis-elevated nest from aquatic plants (snakes and turtles use these nest, ex. egg clusters of red-bellied turtle, Pseudemys nelsoni , found in 30% alligator nestsCrocodiles -American crocodile, Crocodylus acutus-Morelet's crocodile, C. moreletii endangered -Nile crocodile, C. niloticus-Orinoco crocodile, C. intermedium endangered -Australian crocodile, C. johnstoniNile crocodile-> 5 m, one of the most aggressiveCaymans-Black caiman, Cayman yacare , Pananal-Baba caiman, Cayman crocodylus, the smallestWater snakesTurtles –omnivores; some endangeredFish-any wetland that has a connection to permanent source ofwater will have fishSeasonal wetlands (tropical floodplains, African papyrus swamps)-water level fluctuation -hypoxiaAdaptations -air breathing organs, airblader lung (some catfish, Clarias )-aquatic surface respiration (gupies, Poecilia and Rivulus spp.)-metabolic adaptations –short -term anaerobic respiration, heamoglobin adapted to function at very low oxygen concentrations-aestivation by encysting in a cocoon in drying mud -survival in an egg stage in mud (arrested development)Floating bubble nestCatfish –Hoplosternum littorale Most preferred fish in Suriname In danger of extinction Nest-guarding fishBubble nest-provides oxygen-rich environment for eggs development Water depth ~ 25 cm; December –JulyNest building –late evening/night; oviposition next day (nest shaking); about 20,000/nest; eggs hatch in ~ 3 daysMales protect the nestsRich fauna of aquatic invertebrates (~ 1000 ind./nest)Foam –protection from contact with low oxygen water; extremetemperatures; predationLoosely interwoven plant materialEgg mass FoamTightly interwoven plant materialElongated pectoral spinesHebivorous fish –biological control of aquatic weed-grass carp, Ctenopharyngodon idella , inefficient in digestion of celluloseMosquito fish , Gambusia spp. –mosquito controlFruit-eating fish , tambaqui, Colossoma spp., Amazon floodplainMud-skippers , Periophthalmus spp. amphibious fish, specialized group ofgobies; mangroves of the Old World; in Asia mudskippers are often a source of food;.au/~thebobo/mud.htmMammals Rodents:Beaver -Castor canadensislargest of North American rodents; range extends from centralAlaska across Canada and N.A. to north Florida; listed endangere d in Mexico;60-400 million individuals before the arrival of Europeans; fur trade, by 1900 almost extinct, today increasing rapidly (6-12 million individuals); ex.: Kabetogama Peninsula in Minnesota increased habitat use from 71 dams in 1940 to 835 in 1986(Naiman & Johnston:BioSci. 38:753)modification of stream morphology and hydrology:Stream=>open water =>marsh =>wet meadowchanges in nutrient cycling (redox)Beaver -invasive species in Tierra del Fuego20 pairs introduced to Argentina in 1940’by the Secretary of the Navy ~ 6 km/year; now >> 100,000Nothofagus forest damageBeaver lodgePNTF; beaver damMuskrat -Ondatra zibheticus-medium sized, native and widespread in North America, endangered in Mexico-introduced to Europe early in the 20. cent.; great ecological importance -introduced to Tierra del Fuego in 1940’s from Canada, tunneling activities and dam damageswetland herbivores that destroy much more than they consume role in succession: preference for Typha , destruction of Typha marshes followed by colonization by Phragmites, old houses in Phragmites with corridors to Typhagrass houses (lodges, mounds) to provide a dry nest; "eat-outs"; accelerated decomposition in mounds compost piles (fresh vegetation exposed to warm moist conditions) mounds usually last about 1 yearNutria -Myocastor coypus-large rodent, almost equal in size to beaver-native in South America, introduced to North America (early 1930’s) and Europe (England -marshes converted to open water)-Louisiana -1938 20 nutrias purchased from Argentina and arrived to Avery Island; in two years nutria became well established in marshes aroundrumor spread that it will eat aquatic weeds, valuable furs did not live to the expectationsdamage to agricultural crops (sugar cane, rice), damage to levees 1955-59 -20 millions nutrias in LA chewing away foundations of LA marshes, greatest damage in marshes on peat foundations cattails replaced by alligator weed, water hyacinth June 1957hurrican Audrey; 1962 great freezecompetition with muskrats; nutria at the more brackish endfactor in establishment of vegetation on the newly created islands in the Atchafalaya DeltaNutria -Myocastor coypus; damage in Louisiana, ~ 10,000 haCapybara ,carpincho -Hydrochoerus hydrochoeris -largest rodent; weights as much as 100 kg-South America;riverine swamps seasonally flooded Pantanal, Amazon Basin-hunted for meat and leather, economic benefits ofcommercial utilization most of growth andreproduction occurs in the rainy season; two breeding cycles a year, average number of litter is 4 1.6 animals/ha -steady state with respect tovegetation; 3 animals/ha -destructionmost effective herbivorous mammals in SA wetlandsPhoberomys –the largest extinct rodentskeleton found in the Miocene deposits in VenezuelaMice –30g; rats –300g; capybara –50,000g; Phoberomys –700,000g !!Lived in wetlands; grazed on aquatic vegetation; WHY EXTINCT??Moose ,European elk -Alces alces; northern temperate region peatlandsaquatic vegetation during the summer (particularly fond of water lilies and Menyanthes !), higher ground in winterReindeer –Rangifer tarundus ssp. playrhynchus –Svalbard reindeer;beg. 20. century almost extinct, now ~ 10,000Hippopotamus-Hippopotamus amphibius-tropical regions, "trail braker" , not much grazing because of low protein content and high fiber content of papyrus swamp vegetation-imput of nutrients to water as fecesSimilar role: Water buffalo; Elephants; India feed on cattailsTapir-Tapirus terrestris(South America), T.bairdii(C.Am.)-large mammal; 150-300 kg diet consists of buds, fruits and leaves-trails between resting sites and foraging places-rivers, swamps, lagoons, humid forests endangered Manatee,Sea cow-Trichechus inunguis-Amazon manatee; T.manatus-West Indies Manatee,Florida, once abundant along the Gulf and Caribbean coast, now only small populations in coastal lagoons and somewhat inland in the rivers; about 5,000 estimated in Mexico -endangeredT.senegalensis-African manateedistantly related to elephants-consumes about 45 kg plant material/day Eichhornia,aquatic grassesOtter-Lutra canadensis-Nearctic River Otter;Historically this otter would range from arctic Alaska to the southern United States of Florida and Texas, inhabiting lakes, streams, coastal saltmarshes and even rocky sea coasts in some areas. Today, their range and number are reduced because of environmental pressures particularly hunting and trapping for furL.longicaudis-South River Otter –on the verge of extinction; loss of nesting riparian habitatsL.lutra-European Otter, carnivore, rivers, lagoons, coastal marshes。
重庆市2023-2024学年高二上学期期中学业质量联合调研抽测英语试卷学校:___________姓名:___________班级:___________考号:___________ 一、阅读理解The Maldives guarantees the whitest sand beaches and an unforgettable underwater world. Here are places that you can visit here.Patina Maldives, Fari IslandsThe Fari Islands sit in the northeast of the North Male Atoll, a 45-minute speed boat ride or a 15-minute seaplane flight from Elana International Airport.Unlike most of the other places on this list, Patina recently opened so you can check in rig ht now if you’re in need of an urgent escape.Avani+ Fares Maldives ResortJust a 30-minute seaplane ride from Velana International Airport, the Avani+ Fares Maldives Resort sits on an island surrounded by a lagoon in the west of the resort.Unique and remarkable biodiversity can be found in its coral reefs, sea grass beds and mangroves. Watch out for hawksbill turtles, rays and friendly reef sharks.Villa HavenIf you’re a deep-sea diver, this place will provide a luxurious base as you explore the resort’s many experiences.Their botanical gardens produce coconuts, tropical fruits, vegetables and herbs that will all be served up in Villa Haven’s restaurants, while sustainable local materials are also being used in the construction of the resort.Conrad Maldives RangaliThe twin-island property boasts some firsts including the world’s first ever undersea restaurant and first underwater bedroom.To mark the resort’s anniversary, 50 over-water villas have been revitalized, as have three restaurants and bars. Brand new additions include an adults-only gym, Majaa Explorers Hub and restaurants and the Furaavaru Teens Club.1、If you are interested in sea animals like turtles, which place can you visit?A. Villa Haven.B. Conrad Maldives Rangali.C. Patina Maldives, Fari Islands.D. Avani+ Fares Maldives Resort.2、What can you do in Villa Haven?A. Have dinner in the undersea restaurant.B. Admire the botanical gardens.C. Go on a speed boat tour.D. Work out in the gym.3、What can we know from the passage?A. Both snorkeling and scuba diving are available in Villa Haven.B. The Fari Islands are a 15-minute seaplane flight from the mainland.C. Conrad Maldives Rangali is equipped with the undersea restaurant.D. Sustainable materials are used in the building of Avani+ Fares Maldives Resort.Last year, Abraham Olagbegi got the news that he got a disease and needed a bone marrow transplant (骨髓移植). About a year later, the 13-year-old boy got much better news: His transplant was successful, and he could join Make-A-Wish, an organization that helps fulfill (完成) wishes of children with serious illnesses.That was when Abraham shared an idea with his mom. “I remember when we were coming home after seeing his doctor, he said, ‘Mom, I thought about it, and I really want to feed the homeless,’ ” said Abraham’s mom, Miriam Olagbegi. “I said, ‘Are you sure, Abraham? You could do a lot... You’re sure you don’t want to play video games?’ ”However, Abraham was uninterested in the PlayStation. Instead, in September, Make-A-Wish helped Abraham organize a day to hand out free food in Jackson, Mississippi — the food and supplies were donated by local businesses. They were able to feed around 80 people that day.“When the homeless people get the plate, some of them would come back and sing to us and thank us,” he said. “And it just really feels good. It warms our hearts. My parents always taught us that it’s a blessing (好事) to be a blessing.”Abraham’s efforts are not over just yet —Make-A-Wish will help Abraham feed the homeless on the third Saturday of every month for a year. This will last through Aug. 2022, but Abraham already plans to keep it going much longer than that by starting the organization “Abraham’s Table”.“We’re just very excited to be able to continue on this attempt,” Abraham’s mom said. “If I was out there on the streets, I would want somebody to think of me and to do something special for me. So, that’s what I try to teach my kids and we just try to pay it forward, by doing what we were raised to do.”4、Why did Abraham’s mom ask him the questions in paragraph 2?A. She noticed his hesitation.B. She was worried about his illness.C. She doubted whether he was serious.D. She hoped he could give up his old habit.5、What do Abraham’s words in paragraph 4 show?A. He is happy to help others.B. He realized his mom was right.C. He is thankful for others’ support.D. He felt sure he had fully recovered.6、What is Abraham’s plan?A. To volunteer for charities as usual.B. To start a restaurant for the homeless.C. To continue giving the homeless food.D. To find public support for “Abraham’s Table”.7、Which of the following can best describe Abraham’s mom?A. Fearless and humorous.B. Strong-willed and calm.C. Hard-working and independent.D. Understanding and responsible.When I first heard about Summit Learning, I admitted I was not a bit happy and excited at all. I thought it would require interactions with others. But later, I was astonished when I got to experience it firsthand.Recently, we did a poetry project, and one of the activities was a peer (同龄人) review. I would never have taken part if it was up to me, as I preferred to work independently. But when I got involved, I found in the experience, I had done something that I thought was nearly impossible — it made my poetry better. My partner informed me of my mistakes and told me where I could give more detail.One of our final products of the project was to present our poetry to the class. I’ve always loved public speaking, but I thought with Summit Learning, I would have fewer chances to speak. I was wrong. The peer activities we did with a partner gave me more belief in my ability and inspired me to do more to make my presentation the best it could possibly be.Interactions like these are what Summit Learning is all about. This style of learning brings a positive and hard-working culture that allows us to push our boundaries and keep going. It creates a sense of community since we are all working towards a similar goal.As an active boy, I have always been ahead and advanced, but in a normal classroom, there are restrictions on what I can do. With Summit Learning, I can go beyond expectations in projects or move ahead in learning new content when I’m ready. I have ownership of my work and pursue my goals.Summit Learning has showed me how much people can grow and change. It has helped me see people and myself differently. It has been one of the greatest experiences of my life,and I cannot see myself going back to a normal classroom.8、What was the author’s initial response to Summit Learning?A. He was unwilling to attend it.B. He was excited to take part in it.C. He was astonished to hear about it.D. He was unhappy to withdraw from it.9、How did the poetry project benefit the author?A. It boosted his confidence.B. It developed his sense of humor.C. It reminded him to be independent.D. It taught him how to organize activities.10、What can be inferred about Summit Learning?A. It proves the limits of one’s abilities.B. It teaches poetry in a normal classroom.C. It transforms the traditional way of learning.D. It promotes diversity of classroom objectives.11、How does the author find Summit Learning now?A. Demanding.B. Admirable.C. Upsetting.D. Conventional.Mouse embryos (胚胎) have been cultured (培养) on the International Space Station (ISS), marking a significant step in understanding reproduction in space. Led by Teruhiko Wakayama from the University of Yamanashi in Japan, this experiment studied the possible safety of human pregnancy (怀孕) during long space journeys, such as a trip to Mars that lasts more than six months. Wakayama emphasized the importance of this research, saying, “We are conducting research to ensure we will be able to safely have children if that time comes.”The experiment began on Earth, where early two-cell stage embryos from pregnant mice were taken out, frozen, and sent to the ISS on a SpaceX rocket. Astronauts on the ISS then warmed up and cultured the embryos for four days using devices specially designed for this task. Afterward, the embryos were kept and returned to Earth. The four-day growth period was chosen as embryos can only survive for this length outside a uterus, according to Wakayama.Upon their return, the embryos were examined to check the impact of space’s unique conditions, such as higher radiation (辐射) levels and microgravity (微重力). The results were promising; the embryos showed no DNA damage from radiation and showed normal structural development, including the crucial change into two cell groups necessary for forming the fetus and placenta. Wakayama found these results significant, as it was previously believed that microgravity might prevent the embryo’s ability to separate intothese separate cell types.While these findings are promising, further research is needed to fully understand space reproduction. Wakayama referred to a previous study involving pregnant rats in space, which resulted in the birth of typical-weight rats, suggesting normal development. The team now aims to further study the health of embryos exposed to space conditions and plans to test whether mouse embryos sent to the ISS can develop into healthy young after returning to Earth.12、What was the main purpose of sending mouse embryos to the ISS?A. To test the possibility of embryos in space.B. To study the effects of radiation on DNA.C. To culture embryos using specific devices.D. To observe the growth of pregnant mice.13、The mouse embryos showed after being cultured on the ISS.A. DNA damage from radiationB. failed separation into cell groupsC. adjustment to microgravityD. normal growth14、Why does the passage mention a previous rat study in paragraph 4?A. To provide supporting evidence for the resultsB. To describe the conditions for raising ratsC. To recommend a new research methodD. To introduce an unsuccessful experiment15、What can be a suitable title for the text?A. Space Mice: A Genetic RevolutionB. Pregnancy in Space: A Mouse Embryo StudyC. Mars Trip: Embryo ChallengesD. Mouse Embryos: Freezing Techniques二、七选五16、For most people traveling abroad, their first choice is probably to make a beeline for (直奔) tourist sights. For me, I find lots of joy in grocery (食品杂货店) shopping on holiday.As a vegetarian (素食主义者) , finding restaurants that meet my needs is not always easy abroad. ① The first thing I do, after dropping my bags off, is to go to a grocery store. That enables me to cook breakfast in the morning without walking around for hours trying to find “vegan breakfast” near me.The variety of foods attracts me every time I travel somewhere new. In Malta, I found themost delicious chocolate-filled cakes, a product I would struggle to find even in the UK. ②I was so delighted that I could enjoy such an unexpected treat. Another surprise was their selection of ice cream available even in the smallest grocery stores.③ Looking for smoked tofu and corn pancakes turns into quite a mission wheneverI visit Cluj-Napoca in Romania. There is usually only one variety of smoked tofu, sold in a very small tub (食品盒) and only in the cafeteria section. ④ That is because they are never available at the smaller ones.Grocery shopping on holiday sounds unusual. But it means being involved in the day-to-day lives of a country’s citizens. I can pretend I am a local and put myself in their shoes. I can watch kids begging their parents for sweets, an international experience that needs no language, or watch couples pick up snacks and drinks for a party on a Friday night. ⑤A. I ended up eating these every day for breakfast.B. The challenge of finding food is interesting, too.C. So I always make sure to book a place with a kitchen.D. Grocery shopping was a vital part of the holiday experience.E. It’s an act of understanding people as much as of buying food.F. Com pancakes always require a trip to the bigger grocery store.G. By wandering around in a new country, I start to see what they value.三、完形填空(15空)celebrations that I didn’t mind. They are a bunch of young, single guys and I would have felt out of place.day to “warn” us of the upcoming event and said it would be over at about 11 p. m. That wasin all my years of being a neighbor!And it really worked in their favor. My husband and I were so friendly that even whenlife.17、A. located B. explored C. challenged D. invited18、A. trapped B. impressed C. annoyed D. embarrassed19、A. later B. closer C. earlier D. further20、A. shocking B. frightening C. puzzling D. amazing21、A. cell number B. room number C. account number D. car number22、A. anxiously B. politely C. regularly D. obviously23、A. imagination B. consideration C. recognition D. organization24、A. promised B. supplied C. designed D. compared25、A. stress B. anxiety C. worry D. anger26、A. respond B. adapt C. contribute D. apply27、A. figure B. succeed C. matter D. access28、A. sleep B. maintain C. travel D. relax29、A. noticed B. delivered C. explored D. proved30、A. surrounding B. respect C. curiosity D. distance31、A. strategy B. apology C. communication D. inspiration四、短文填空32、For thousands of years, people have told fables (寓言) in ① attempt to teach a lesson or to pass on wisdom. Fables were part of the oral tradition of many early cultures with the well-known Aesop’s fables ② (date) to the sixth century, B. C. Yet, the form of the fable still has values today, as Rachel Carson says in “A Fable for Tomorrow.”Carson uses a simple, direct style common to fable. In fact, her style, as well as tone (口吻), seemingly ③(satisfy) the children. “There was once a town in the heart of America, where all life seemed ④ (enjoy) peaceful co-existence with is surroundings.” Her fable begins, with some familiar words ⑤ (adapt) from many age-old fables. Behind the simple style, however, is a serious message intended for everyone.Different from traditional ⑥(approach), Carson’s story ends with an accusation instead of a moral. She reminds people ⑦ the environmental dangers facing society,and she delivers the lesson ⑧ people must take responsibility for saving their environment.The themes of traditional fables often deal with simple truths about everyday life. However, Cason’s theme is a more weighty warning about environmental destruction. ⑨is likely that a simple lyric form that has been passed down through the ages can still be ⑩(benefit) today to draw attention to important truths.五、书面表达33、假如你是李华,2024年哈尔滨国际冰雪节(Harbin International Ice and Snow Festival)组委会面向全国高中生招募志愿者,你希望成为志愿者,请向组委会写一封申请信,内容如下:1. 个人特长(英语能力,性格等);2. 对志愿者工作的理解;3. 希望获准。
LA REDACTION D’UN MEMOIRE Mai 2004 -Guide pratique pour l’étudiant-LA REDACTION D’UN MEMOIRE-Guide pratique pour l’étudiantE-Ce petit guide pratique n’a pas la prétention de présenter la recette parfaite assurant la réussite du travail de mémoire, mais a pour objectif de rassembler une succession de conseils qui devrait vous faciliter la rédaction et vous éviter certaines erreurs trop souvent commises.Ce guide a été inspiré par les documents suivants :1. Le petit guide àl’usage du rédacteur d’un mémoire ou d’un rapport de stage(1999),Université Charles de Gaulle, Lille III, UFR de Mathématiques,Sciences Economiques et Sociales.2.Guide de rédaction d’un mémoire de maîtrise (2000), Université de Tunis,Institut Supérieur de Gestion.Vous trouverez également les informations officielles concernant la procédure administrative(modalité d’inscription, qui peut diriger un mémoire, soutenance,…) sur le site internet de la faculté SSP :http://www-ssp.unil.ch/pdf/memoires.pdfLA REDACTION D’UN MEMOIRE-Guide pratique pour l’étudiant-Table des matièresMai 2004 I. Quelques conseils avant la rédaction1.2.3.4.5. Liste de petits conseils pratiques et erreurs à éviter« je », « nous », « on » ?Détermination du sujet de rechercheRelation avec le directeur/directrice de rechercheRecherche de la documentation34456II. Rédaction du mémoire0.1.2.3.4.5.6.7.8. Le planIntroductionMéthodeRésultatsDiscussionConclusionBibliographieAnnexesRésumé et mots clés677899101213III. Présentation du mémoire (modalité de rédaction)1.2.3. DactylographiePrésentationDépôt131315IV. La soutenance1.2.3. A quoi sert la soutenance ?Présenter son travailRépondre aux questions151617I.1) ---- --- - -Quelques conseils avant la rédactionListes de petits conseils pratiques et erreurs à éviterUn mémoire de fin d’études doit revêtir un caractère scientifique en ce sens qu’il doit reposer sur des fondements théoriques et une méthodologie rigoureuse.Une des premières choses à faire est de savoir à quel public vous allez vous adresser. Il est en effet tentant de n’écrire qu’en référence à un public de pairs. Mais les mémoires peuvent être d’excellents outils pédagogiques et de nombreux professeurs en conseillent la lecture à leurs étudiants. Pour cela, il est préférable d’éviter le jargon utilisé par une minorité de chercheurs (vous et vos collègues), de prendre le temps de bien expliquer les faits, les tableaux et les schémas – les données parlent rarement d’elles-mêmes. Votre but est de communiquer votre travail et ses implications à toute (ou presque) personne qui le désire. L’objectif est de rédiger de façon à ce que le message soit compris par un plus grand nombre. Il faut donc être clair, précis et concis. Eviter les longues phrases complexes, les formules creuses, les fioritures et les annexes inutiles. Ne pas surcharger le texte avec de longues citations. Pas d’état d’âme ou de jugements de valeur. L’information de type scientifique ne privilégie pas l’esthétisme mais la fonctionnalité ! Il est clair qu'il s'agît d'une tâche difficile à réaliser (différence entre "savoir scientifique" et "vulgarisation de ce savoir").Attention, tout ce qui a été écrit doit pouvoir être expliqué par l’auteur. Eviter donc de reprendre des formules toutes faites prises de la bibliographie sans en avoir cerner/compris tous les fondements.Tous les avis doivent être soigneusement justifiés.Le mémoire de fin d’études est un travail d’initiation à la recherche qui nécessite un apport personnel. Vous êtes donc amené à réaliser un travail de conception et non une simple compilation. Ce travail doit vous permettre d’acquérir un sens critique et un esprit de synthèse. Attention, un travail de réflexion bien fait (revue d'une question particulièrement bien référencée des connaissances et controverses dans un domaine d'intérêt majeur) peut avoir sa place. A voir et à justifierauprès de l'organe compétant de l'ISSEP.Attention à l’orthographe ! L’utilisation du dictionnaire n’est pas un luxe! Faites également relire votre document par une tierce personne, la correction serad’autant plus objective.Veiller à la concordance des temps au sein du mémoireMettre des transitions entre les différentes parties du document. Ces parties doivent s’enchaîner de manière naturelle pour le lecteur.Tout schéma/figure doit être accompagné d’une légende avec référence. Cettelégende doit être suffisamment claire pour que chaque tableau/figure puisse être compréhensible sans avoir recours au texte de l'article. Chaque colonne, lignepour les tableaux, ou axes pour les figures, doivent avoir un titre accompagné de l'unité utilisée. Chaque symbole doit être décrit.2) « je », « nous », « on » ?A quelle personne écrit-on son mémoire ? Il faut que le mémoire soit le plus impersonnel possible.- - - Le recours à la première personne du singulier (« je ») peut paraître prétentieux et égocentrique. Il est également dangereux car vous risquez de vous attribuez desidées qui ne sont pas les vôtres ou une démarche que d’autres ont développée avant vous.L’utilisation de la première personne du pluriel (« nous »), généralement attribuée aux rois et aristocrates, peut donner un caractère pompeux et ridicule.Le « on », impersonnel et vague, donne souvent une impression d’imprécision. De plus, utilisé avec fréquence, il peut lasser le lecteur.Il faut donc, dans la manière du possible, éviter le « je », le « nous » et le « on » ! Attention, acceptable si utilisés avec modération pour "alléger" un paragraphe.- 3) Que faire alors ? En fait, il est conseillé de chercher le véritable sujet du verbe et d’y recourir. Le travail ne peut que gagner en précision ! Cela permet de préciser la pensée.Exemple :« Nous avons fixé la vitesse de course à 12 km/h… »« La vitesse de course a été fixée à 12 km/h… »Détermination du sujet de rechercheLe choix du sujet est la première étape fondamentale du travail de mémoire. Sadétermination dépend de plusieurs choses :-centre d’intérêt de l’auteur-lectures antérieures-objectifs professionnels-discussion avec les enseignants-discussion avec des étudiants ayant déjà rédigé un mémoireUne fois le champ de recherche délimité, il faut encore se poser un certains nombre de questions avant de se lancer « tête baissée » dans ce travail.-Ce sujet correspond-il à un besoin ?-Existe-t-il une littérature suffisante ? (Les sources doivent être accessibles ettraitables)-Les méthodes de recherche requises sont-elles adaptées à mes capacités ? (La méthode utilisée doit être maîtrisable)-Peut-il être traité dans un délai raisonnable ?-Quels sont les résultats espérés ?-Avec qui le réaliser ?Il est donc essentiel de ne pas se précipiter sur un thème jugé intéressant avant d’en avoir évalué les possibilités de réalisation et avant de l’avoir localisé dans uneproblématique générale. Il convient pour cela de se documenter, de demander conseil à des personnes compétentes.Une fois le sujet choisi, il faut être capable de le préciser en formulant une QUESTION CENTRALE UNIQUE résumant toute la problématique dutravail ! Il faut être précis. Eviter les sujets vagues. La formulation de la question de recherche est une étape décisive.N’oubliez pas, lors de votre choix, que vous serez d’autant plus stimulé que vous serez passionné par le sujet et que le mémoire de fin d’études peut être une ported’accès au monde professionnel (= carte de visite).4) La relation avec le directeur/directrice de mémoireLe choix du directeur de mémoire est une étape importante pour la concrétisation de votre projet. Certaines questions peuvent vous aider lors de ce choix :-Travaille-t-il dans le domaine de recherche qui vous intéresse ? Et le maîtrise-t-il ? -Est-il habilité à diriger votre recherche ? (Enseignant universitaire ?)-Est-il intéressé par le sujet que vous voulez traiter ?-Vous a-t-il incité à faire une recherche avec lui ?-Est-il assez disponible pour bien vous encadrer ?-Est-il sérieux dans son travail de directeur ? (Donne-t-il suffisamment d’attention aux travaux qui lui sont remis ?)Le travail du directeur de mémoire consiste à vous diriger par la transmission de certains conseils (aider à établir la question centrale, fournir de la bibliographie,méthodologie, relecture du document,…). N’oubliez pas que ses remarques ont pour but de vous aider plutôt que de vous contrarier. Mais attention, il ne faut pas confondre enseignant et tuteur. Lorsque vous avez rendez-vous avec lui, il fautimpérativement préparer l’entretien en élaborant des questions précises à poser. Prenez l’habitude de communiquer régulièrement avec celui-ci (planifiez ensemble les différentes étapes du travail et les entretiens). Cela peut vous éviter de mauvaises surprises (ex: recommencer toute une partie déjà rédigée).5) Recherche de la documentationC’est une tâche importante mais assez difficile à réaliser car la tentation est grande de rassembler un trop grand nombre d’informations avec le risque de ne plus maîtriser cette masse documentaire. Il ne vous est pas demandé de compiler tous les articles existant sur le sujet, mais d’opérer des choix et de définir des domaines précis de recherche.Il faut tout d’abord rassembler une bibliographie préliminaire. L’objectif de cetteétape est la rédaction de fiches bibliographiques (auteurs, résumé de l’article, motsclés,…) et de faire des fichiers par thème avec les différentes références. Il estpréférable d’aller du général au particulier.-le plus général : ouvrages, traités, manuels, certains périodiques-le plus spécialisé : les revues, articles qui concernent votre sujet-Les banques de données-InternetN’hésitez pas de vous faire conseiller/orienter sur vos recherches par le directeur, celui-ci pouvant déjà posséder de nombreux articles utiles.II.0) Rédaction du mémoire Le planL’élaboration du plan (= squelette du mémoire) est une étape indispensable car elle facilite la rédaction du document. Elle permet de s’assurer que les principaux points àdévelopper ne seront pas oubliés et que l’enchaînement des idées suivra une logique claire et structurée.Un plan est amené à être souvent révisé ; il est un guide à la rédaction ; mais en aucun cas il ne doit être rigide. Il n’existe pas de plan type, mais un mémoire de recherche se compose généralement de 6-7 chapitres distincts :1)2)3)4)5)6)7)8) IntroductionMéthodeRésultats Discussion Conclusion Bibliographie AnnexesRésumé et mots clés1) IntroductionL’introduction doit pouvoir répondre à la question POURQUOI ?L’introduction est essentielle car elle représente le premier contact avec le lecteur. Elle doit donc l’accrocher et susciter son intérêt.L’introduction comporte une seule partie (pas de sous-chapitre) et se structure en entonnoir : elle doit guider progressivement le lecteur vers le fond du sujet (il faut débuter en des termes assez généraux pour petit à petit cerner le sujet de façon de plus en plus détaillée). Elle comprend en général les points suivants :- - - - - -2) un préambule qui amène le sujet et le replace dans son contexte général(s’appuyer sur quelques documents de référence et indiquer les principauxrésultats et modèles explicatifs déjà énoncés dans ce domaine, faire le point sur l’avancement des recherches dans le domaine)la définition des termes ambigus- la problématique de l’étude qui doit aboutir à la question centrale de la recherchel’originalité, l’intérêt de la recherche (expliquer le point précis auquel il vous semble que l’ensemble des études effectuées avant vous n’a pas répondu)les objectifs poursuivis par la recherchel’hypothèse centraleMéthodeCette partie doit pouvoir répondre à la question COMMENT ?Avec quels moyens vous comptez vérifier votre hypothèse ? Il faut expliquer en détail comment vous avez mené votre étude. Il faut respecter l’ordre chronologique del’expérience. Il est dès lors conseillé de rédiger cette section juste aprèsl’expérimentation.Cette partie comprend en général les 4 points suivants (certains thèmes de mémoiren'auront pas les 4 points à traiter):a) Les sujets (ou objets de mesure)Qui sont-ils ?Y avait-il une raison particulière pour se centrer sur cette population ?Combien sont-ils ?Comment ont-ils été sélectionnés ?Certains se sont-ils désistés ou ont-ils été écartés ? Pourquoi ?Ont-ils été payés ?Ces renseignements sont tout à fait indispensables pour évaluer jusqu’à quel point les résultats peuvent être généralisés. En plus de ces réponses, il faut ajouter quelques renseignements anthropométriques : âge, taille, poids, sexe,…b) Le matérielListe des outils de mesure utilisés, leurs caractéristiques techniques en détail ainsi que leur validation.c) Le protocole (expérimental)On décrit le déroulement de l’expérience étape par étape. Une bonne technique consiste à considérer le lecteur comme un sujet, à lui faire découvrir pas à pas ce àquoi les sujets ont été exposés, ce qu’ils ont ressenti. Décrire le déroulement (avec dates et lieux) le plus précisément possible.d) L’analyse des donnéesDécrire le matériel pour traiter les résultats : traitement mathématique,(développement des formules, calculs pour arriver au résultats présentés,…)e)3) Le traitement statistique RésultatsCette partie doit pouvoir répondre à la question QUOI ?On y présente un résumé des données collectées et les résultats statistiques qu’elles ont permis d’obtenir. On décrit les résultats, on ne les discute pas encore !!ATTENTION, les tableaux et figures ne parlent pas d’eux-mêmes, ils doivent être supportés par une légende simple et agréable à lire.Cette partie du mémoire étant la plus rébarbative, vous veillerez à ne pas l’encombrer de trop de résultats. Les résultats mineurs, non pertinents par rapport aux hypothèses seront placés dans les annexes.Avant de présenter les résultats, il est intéressant d’expliquer en quelques mots dans quel ordre vous allez les donner. De manière générale, on commence toujours par présenter les résultats les plus importants. On les explique et ensuite, on présente les tableaux et figures qui s’y rapportent. De cette façon, les lecteurs qui ne sont pas familiarisés avec les statistiques peuvent éviter les chiffres tout en comprenant lesrésultats.Quelques recommandations :- Ne pas commencer directement à parler de chiffres, introduire d’abord le(s) résultat(s).LA REDACTION D’UN MEMOIRE-Guide pratique pour l’étudiant-Mai 20044) ----Toujours fournir le seuil de signification de vos résultats (pour prouver la validité des résultats).Les tableaux ne doivent pas être utilisés à l’excès.Les tableaux doivent pouvoir être lus sans difficulté, ils doivent donc êtreintroduits par un titre clair et précis. Au sein du texte, vous pouvez prendre le lecteur par la main et le guider à travers vos tableaux et figures (« comme il est possible de constater dans la première colonne du tableau A, les … »).Chaque section dans la présentation des résultats doit être ponctuée d’unrésumé de ce qui a déjà été dit. Le lecteur n’a pas à revenir systématiquement en arrière pour poursuivre sa lecture sans difficulté.DiscussionCette section est destinée à discuter les implications des résultats que vous venez d’exposer. En QUOI les résultats répondent-ils à la question initiale ? Sont-ils en accord avec l’hypothèse ? Jusqu’ici, vous étiez limité aux faits. Il est temps de placer vos résultats dans une perspective plus large.La discussion doit constituer un miroir de l’introduction. Qu’est-ce qu’on a appris depuis ? L’hypothèse a-t-elle été infirmée ou confirmée ?C’est également le moment de comparer vos résultats avec les données obtenues par d’autres chercheurs (dans la littérature) avant vous, expliquer les différences (s’il y en a).S’il y a des résultats surprenants, vous pouvez vous pencher sur les élémentsméthodologiques susceptibles de les expliquer. Comment pourriez-vous améliorer votre protocole ? Mentionner les limites de l’étude, de la méthode.Si vos résultats donnent lieu à de nouvelles interrogations, essayez de suggérer des pistes de recherches susceptibles d’y apporter réponses.Proposition d'une structure de la Discussion :5) -----Rappel du (des) résultat(s) principal(aux) de l'étude (un paragraphe qui répond à votre question)Comparaison des résultats avec la littératureDiscussion des résultatsLimites méthodologiquesConclusionConclusionLa conclusion est aussi importante que l’introduction. Elle donne la dernière impression au lecteur du mémoire, l'image finale qui influencera "fortement" le jury dans son évaluation. En aucun cas, elle ne devra laisser le lecteur sur une impression d’inachevé !LA REDACTION D’UN MEMOIRE-Guide pratique pour l’étudiant-En règle générale, la conclusion comprend les éléments suivants :Mai 2004- - - - - un rappel de la problématique ou de la question centraleles principaux résultats de l’étudeles apports théoriques de l’étudeles limites de la recherche au niveau théorique, empirique et méthodologique les voies futures de recherche (ouvrir le débat sur une question plus large)Attention, la conclusion doit être très synthétique.6) BibliographieTout d’abord, lorsqu’il y a des références dans le texte, elles s’inscrivent entre parenthèses :- - - Si un seul auteur :(Nom de l’auteur, année de publication)Exemple :(Martinez, 1993)Si deux auteurs :(Nom du 1er auteur et Nom du 2ème auteur, année de publication) Exemple :(Belli et Borrani, 1999)Si plus de deux auteurs :(Nom du 1er auteur et al., année de publication)Exemple :(Schmidt et al., 2003)Ensuite, après la conclusion, toute une section (bibliographie) reprend tous les livres et articles qui ont été cités dans le corps du texte (liste des références complètes des travaux mentionnés dans le mémoire). Vous veillerez à chaque fois d’utiliser le même format.Les références peuvent être regroupées en trois parties distinctes :- - - les ouvrages les articlesles sites internetLes références sont alors présentées par ordre alphabétique en fonction du nom de famille du premier auteur (et, pour un auteur, par ordre chronologique des dates de parution).La qualité d’une bibliographie s’apprécie non tant à sa quantité qu’à sa diversité, sa présentation et à son utilité. Elle s’adresse autant au spécialiste qu’au non-initié. Elle permettra de compléter la connaissance de l’un, ou au contraire, d’initier l’autre. N’oubliez pas que pour construire votre mémoire vous avez utilisé les bibliographies des autres et pu apprécier celles qui étaient bien faites.a)b)c) pour un article, indiquer :Nom, initiale du prénom de l’auteur ou des auteurs (année de publication). Titre. Revue, n°, première page-dernière page de l’article.Exemples :Le Her, M. (1992). Imagerie mentale et apprentissage en golf. STAPS, 29, 7-17.Magill, R.A. et Hall, K.G. (1990). A review of the contextual interference effect in motor skil acquisition. Human Movement Science, 9, 241-289. pour un livre, indiquer :Nom de(s) l’auteur(s), Initiale du prénom (année de publication). Titre. Editeur, lieu de publication.Exemple :Defrance, J. (1987). L’excellence corporelle. AFRAPS, Paris.pour une contribution dans un ouvrage, indiquer :Nom de(s) auteur(s), Initiale du prénom (année de publication). Titre de l’article. In titre de l’ouvrage (coordonné par ou edited by Initiale duprénom Nom), pp première page-dernière page. Editeur, Lieu d’édition.Exemple :Schmidt, R.A. (1991). Frequence augmented feedback can degrade learning: Evidence and interpretations. In Tutorials in motor neurosciences (edited by J. Requin and G.E. Stelmach), pp 59-85. Kluwer, The Netherlands.7) d)e)pour un texte non publié, thèse, mémoire, rapport de recherche, indiquer :Nom de l’auteur, Initiale du prénom (année). Titre. Nature du document.Institution, Lieu. (indiquer la nature du document dans la langued’origine).Exemple :Martinez C. (1993). Microgenèse de la compétence enseignante. Thèse de doctorat non publiée, Université Montpelllier I, Montpellier.pour une référence prise sur un site internet (attention, source non-vérifiée)Adresse complète du site et « de quoi il s’agit »Exemple :http://www.entraineur.ch/entrainement/co/base.htm(notions physiologiques de base en rapport avec le football) AnnexesLes annexes doivent être précédées d’un plan des annexes. Elles font l’objet d’une pagination à part et doivent être numérotées en chiffres romains en majuscule (I, II, III, IV,…).On y place les copies du matériel utilisé dans l’expérience, trop volumineux pour être inclus dans le corps du texte : questionnaire, images, résultats périphériques ou trop détaillés. Mais il ne doit y avoir que les informations pertinentes, ciblées etnécessaires à la compréhension du travail.Il est très important d’inclure tous vos résultats. Cela permet à votre directeur, par exemple, de déterminer si vous avez utilisé les analyses statistiques qui s’imposaient.LA REDACTION D’UN MEMOIRE Mai 2004 -Guide pratique pour l’étudiant-Attention cependant, les annexes ne vous dispensent en rien d’être complet dans le corps du texte. En aucun cas, votre lecteur ne se sentira obligé de se reporter aux annexes pour comprendre votre raisonnement.8) Résumé et mots clés (français et anglais)Il s’agit d’un très bref résumé (entre 150 et 250 mots) de l’article permettant au lecteur de décider si son contenu l’intéresse. Il est assez difficile à écrire car il doit être très condensé, il est donc conseillé de l’écrire en tout dernier lieu quand vous avez une idée claire de ce que contient votre travail. Le résumé est placé en général dans le quatrième de couverture (sur la page de reliure au dos du mémoire).A la suite du résumé, faire une liste des différents mots-clés de l’étude.Le résumé et mots clés se font en français et anglais.III.1) Présentation du mémoire (modalité de rédaction) DactylographieLes normes de dactylographie suivantes doivent être respectées :2) -----------marge de droite : 5cm (d'après le règlement SSP)marge de gauche : 2,5 cmhaut et bas de page : 2,5 cmpolice de caractère : Times New Roman ou caractère de même tailletaille des caractères pour le corps du texte : 12 pointstaille de caractère pour les notes en bas de page : 10 pointsinterligne : 1,5 cmimpression : recto versopas de ligne seule (isolée du reste du paragraphe) en début ou en fin de page.Format du texte : Justifier (et non Aligné à gauche)PrésentationLes différentes parties du mémoire doivent respecter l’ordre suivant :-Page de couverture-Dédicaces, s’il y a lieu !-Remerciements, s’il y a lieu !-Table des matières-Listes des tableaux et des figures (avec indication des pages)-Abréviations, termes à définirLA REDACTION D’UN MEMOIRE Mai 2004 -Guide pratique pour l’étudiant--Introduction-Développement (méthode, résultats, discussion)-Conclusion-Bibliographie (ouvrages, articles, site internet (sources non-vérifiées))-Table des matières des annexes-Annexes-Résumé et mots clés (à placer sur la page de reliure au dos dumémoire)- Sur la première page du mémoire doivent figurer :-le titre du mémoire-le nom de l’étudiantE-le nom du directeur/rice-l'intitulé de la licence visée-la session de l’examen (mois, année)Page de titre (spécimen)UNIVERSITE DE LAUSANNEFACULTE DES SCIENCESSOCIALES ET POLITIQUES SESSION DE …….(mois et année)TITRE DU MEMOIREMémoire en Sciences du sportPrésenté par ………………………………………………………………Directeur/rice …………………………………………………………….- La pagination :La pagination commence à partir de la première page de l’introduction. Lespages de garde, de titre, les dédicaces, les remerciements, la table des matières, la liste des schémas et des tableaux doivent faire l’objet d’une pagination àpart en chiffres romains en minuscules (i, ii, iii ,iv, etc.). Les annexes peuvent。
Included:1 x Top components (Top, side windows, Rear window, window storage bag)2 x Aluminum polesRequired Tools:Phillips screw driver to remove original soft top. Torx sockets are required to completely remove the original soft top hardware.Step 1.Remove existing soft or hard top. For OEM (original/factory) soft tops: remove header bar, remove tube framehardware from roll bar, and remove the rear window/tailgate bar and set it aside for the new top. Keep the rearbar mounting hardware in place on the body as the rear bar will be re-used. Keep the door surrounds in placeas they will also be used.Step 2.Inspect the clearance between top of windshield frame and door surround, making sure that the factory foamseal is in place; door surrounds are properly placed and tightened per Jeep ® owners manual. Inspect rearTailgate Bar and Clips that they are securely mounted and they are in good working condition . NOTE. Thefactory door surrounds have an extrusion that was added for the 2010 model year or later. This addedextrusion must be removed to work with the Rampage Framless top. Please see Figure 1 below forfurther detail. You can also chose to use the Rampage door surrounds (available 2013) or a set ofsurrounds from a 2007-2009 JK. We recommend the use of the Rampage surround kit as it wasdesigned specifically for this top. Step 3.Unfold your new Soft Top, set the windows aside for later use, taking care not to scratch windows. Place the topon the center of the roll bar and unfold. Spread the top out and taking care that the metal flat hooks at the end ofthe rear adjustment straps do not damage paint, glass or cause injury. See Figure 2.P R O D U C T S Installation InstructionsPart number 1099XX, Frameless Soft Top for 2 door Jeep ®Wrangler JK 2007-For 2010 or later Door SurroundsThe 2010 model year or later has an added extrusion nailed into the original surround that needs to be removed to workproperly with the Rampage Frameless Top. It is easily removed,the surrounds will still work fine with the factory top, and the extrusion can be quickly re-installed as desired. Simply pull theextrusion out from the nails or remove the nails themselves. Figure 2Figure 1Step 4a. Install the top onto the header channel using the snaps as shown in the illustration. (fig. 3 )b. Place the header channel with the top installed above the windshield on the gasket and fold the combo top forward over the windshield.c. Insert the tab of the header channel into the footman loop on the vehicles windshield frame as shown. (fig.4) e. Insert the threaded knob into the metal bracket and tighten. (fig. 6) Repeat for other side.Step 6.Wrap the two straps at the center of the top main section around the rear of the main roll bar and hook theplastic hooks into the holes on the under side of the roll bar. Push the hooks into the hole and then pullback to hook the clip on the inside sheet metal. Tighten snugly so there is some tension on this strap.NOTE: So as not to over tighten, do not use any tools to tighten this strap. See fig. 7 & 8.Step 5.Once the header channel and top have been installed on the windshield frame, fold the top back over theroll cage of the vehicle and spread it out. Insert plastic into the top of the door surround channels above either door opening. This will center the top at the front.Fig 4Fig 5Fig 6Fig 3Center adjustmentstraps with hooks Holes under roll barOver outside of rollbar, back under seat belt stud......now feed intobuckle and pull up tightStep 7.Locate the ceiling adjustment straps (at rear corners on ceiling panel). Gently pull the strap over the rollbar, and around the seatbelt stud (toward the inside) and back up to the strap adjustment buckle.Tighten snug, and perform same procedure on the other side. Check top for evenness from side to side.See Figures 9, 10, 11, & 12.Step 8.Install the side windows by mating the zippers to the main skin and zip the sliders all the way along bothsides. Loosely attach the rear window to the three straps on top rear. Mate the rear window zippers to thetop on both sides. NOTE: See figure 13 for detailed order instructions for installation of the zippersand channel inserts.Step 9.Continue attaching the Belt Rail plastic of the side windows from front to back, starting on the back top ofthe door surrounds. Hook the Belt Rail plastic to the back section of the door surround. Figure11Figure 12Step 10.Prior to continuing; make sure rear panel zippers have been started on both sides. Set the Belt Rail plasticeven with the factory weather strip at the body gutter – directly behind the door. Continue fastening theplastic under the Belt Rail lip of the body until the top is fully attached around the back corners of the body.Step 11.Slide rear bar into the tube plastic on the bottom of the rear window. Insert the Tailgate Bar into the sideclips, check for evenness from side to side. Rotate the bar towards the inside to lock it in place same asthe factory installation. Zip the rear window and pull the Hook and Loop a.k.a. “Velcro” closed.Step 12.On top of the rear part of the roll bar pull the side to side adjustment straps snug, do not over tighten. Pullthe three rear window straps snug.Step 13.Pull the roof top down. Handle the metal hooks on the end of the straps with care to avoid damage orinjury. Attach the flat hooks under the Belt Rail at the reinforced patches on each side of tailgate, and pullthe straps down snug (WITH ONE HAND). While holding the straps in-line and secured to the hook andloop, close the cam buckle into the locked position.The Front Bow insertsThe aluminum bows in the front section of the top are intended primarily to keep water from pooling on the front section of the top in heavy rains. Without the bows it is possible for water to pool in the front section of the top and cause issues with the seams because of the weight. They will also keep the top from fluttering if it is installed properly. The bows are easily removed by flexing the inner rod and removing from the pockets. The top will function normally without them, however It is recommended they be used in heavy rains when parked.Storing WindowsTo store your windows, begin by removing the hooks from the rear Belt Rail and flipping the top to expose the storage bag. Again, take care not to fling the top to avoid metal hooks causing damage or injury. Remove the windows and store them in the bag utilizing the window separation panels to protect the window.Panel/Zipper installation order:1, 2 - Zippers to main skin 3 - Rear panel straps (x3) loose 4, 5 - Side panels to rear window 6, 7 - Plastic strip into body channel 8 - Tailgate bar 9 - Rear strapsFigure 13Important Care Instructions:Convertible tops and accessories require special care if you want to get the maximum usage and enjoyment from them. The following recommendations, if followed carefully, can extend the life of your top or accessory.Hand wash using a mild non-detergent soap such as ivory. Use a non-abrasive cloth or sponge. Rinse thoroughly.Do not wash in direct sunlight and avoid automatic car washesWhen your top is clean, we recommend using “Ragg Topp” or “303 Protectant” on both the vinyl top and windows. This product contains a sunscreen that helps protect from the sun’s damaging rays. Stay away from products containing alcohol, as it will cause the fabric and windows to lose their elasticity, thus reducing the life of your top or accessory. If you are unable to locate “RaggTopp” Please call 1-800-377-4700 for a distributor near you. For “303 Protectant”, please call 1-800-223-4303 for a distributor near you.Direct sunlight and heat are the biggest enemies of the windows. Park in the shade whenever possible. If you must park in the sunlight, rotate the direction that you park every few days so all windows get even exposure.Our tops are designed so that you may roll up and/or store the rear curtain and side curtains. To prevent scratching of the windows, be sure that windows are completely clean and free of dust particles. Even a little dirt will badly scratch the windows. You may want to use a soft cloth when rolling up or storing your windows. Heat may build up on rolled up windows, so be sure to unroll them frequently. If you roll up the windows at the beginning of summer and leave them, they may be ruined by fall.Do not open or roll up windows at temperatures below 45 degrees F this could cause them to crack or break.Zipper Care.DO NOT use pliers or other tools to pull on zippers. If the zipper requires more force than pulling with your fingers something is most likely out of alignment or improperly installed. Be sure the top is up to a temperature of 70 deg., and that the components are installed correctly and in the correct sequence to ensure protection of the zipper.Zippers require periodic cleaning and lubrication to ensure longevity and ease of use. Clean by wiping with a towel soaked in soap and water, DO NOT USE HARSH CHEMICALS. Zipper lubricants are available at sporting goods stores and online for wetsuits. An occasional use will keep the zipper slides operating as new.Warranty InformationRampage products, Inc. warrants to the original purchaser of any top it manufactures, that the top will be free of defects in material or workmanship for a period of 2 year from date of purchase. Such obligations under this warranty shall be limited to the repair or replacement, at Rampage products discretion, of any assembly or parts which, upon examination by Rampage products, Inc. proves to be defective. All defective items must be returned with proof of purchase to Rampage products, Inc., freight prepaid. This warranty does not cover damage resulting from abuse, misuse, alteration, accident or damage in transit. Rampage products obligations under this warranty are limited to the aforementioned repair or replacement of warranty defects for which the return authorization has been received during the warranty period, and Rampage products, Inc. shall not be liable for any incidental or consequential damages arising from breech of this or any implied warranty.Rampage Products 9225 Stellar Ct. Ste “C”, Corona, CA 92883Phone: (951) 277-4949 Fax: (951) 277-2295Made in China。
Rapid slip along the central Altyn Tagh Fault:Morphochronologic evidence from Cherchen Heand Sulamu TaghA.-S.Me´riaux,1,2F.J.Ryerson,2P.Tapponnier,1J.Van der Woerd,2,3R.C.Finkel,2Xiwei Xu,4Zhiqin Xu,5and M.W.Caffee2,6Received28April2003;revised27January2004;accepted23March2004;published8June2004.[1]To better constrain the ongoing rates of deformation in northern Tibet,the ages offluvial and glacial geomorphic markers left-laterally displaced by the Altyn Tagh Faulthave been determined by radiocarbon and10Be-26Al cosmic ray exposure dating.Twosites were investigated:Cherchen He and Sulamu Tagh,both near Tura($37.6°N,86.6°E).The sites are geomorphologically distinct with Cherchen He dominated by fluvialprocesses and the Sulamu Tagh by glacial action.Nine offsets ranging from166to3660mwith ages between6and113ka yield an average slip rate of26.9±6.9mm/ndscapeevolution appears to have been modulated by climate change and is temporallyconsistent with the d18O record from the Guliya ice cap in the West Kunlun;the features ofinterest were all formed by glacial and fluvial processes subsequent to marine isotopestage5e,with the youngest features having formed during the early Holocene Optimum.This‘‘near-field,’’morphochronological slip rate is averaged over many earthquake cyclesand is hence little affected by interseismic strain.It is kinematically consistent with other,somewhat lower,geomorphic slip rate measurements to the east.The average rate,andlower bounds obtained from alternate interpretational models,18.4mm/yr,cannot bereconciled with the most rece geodetic measurements($7mm/yr),suggesting thatinterseismic strain and interactions with adjacent faults may lead to disparate geologic andgeodetic rate estimates.This late Pleistocene-Holocene,morphochronologic rate wouldimply that,at this longitude,the Altyn Tagh Fault,on the north edge of Tibet,mightabsorb almost as much of India’s convergence relative to Siberia as the Himalayan MainFrontal Thrust does on the southern edge of the plateau.I NDEX T ERMS:1035Geochemistry:Geochronology;1208Geodesy and Gravity:Crustal movements—intraplate(8110);8102Tectonophysics:Continental contractional orogenic belts;8107Tectonophysics:Continental neotectonics;K EYWORDS:sliprates,cosmogenic dating,Indo-Asian collisionCitation:Me´riaux,A.-S.,F.J.Ryerson,P.Tapponnier,J.Van der Woerd,R.C.Finkel,X.Xu,Z.Xu,and M.W.Caffee(2004), Rapid slip along the central Altyn Tagh Fault:Morphochronologic evidence from Cherchen He and Sulamu Tagh,J.Geophys.Res., 109,B06401,doi:10.1029/2003JB002558.1.Introduction[2]The Tibetan Plateau is surrounded by large strike-slip faults,such as the Altyn Tagh Fault(ATF),whose role in accommodating Indo-Asian convergence is hotly debated [Avouac and Tapponnier,1993;England and Houseman,1986;England and Molnar,1997a,1997b;Peltzer and Saucier,1996;Peltzer and Tapponnier,1988].At one extreme,they are viewed as a by-product of distributed deformation in the lower crust and mantle[England and Molnar,1997a,1997b].At the other,they are interpreted as localized lithospheric shear-zones,equivalent to intraconti-nental plate boundaries[Avouac and Tapponnier,1993; Peltzer and Saucier,1996].The resolution of this issue, which has implications beyond the tectonics of Tibet, requires quantitative information,not only on the deep structure[Herquel et al.,1999;Wittlinger et al.,1998]but also on the slip rates of these faults.Estimates of the Holocene sinistral slip rate of the central Altyn Tagh Fault vary from2to40mm/yr[Ge et al.,1992;Peltzer et al., 1989]and cannot be explained by the along strike variations in slip rate[Peltzer et al.,1989;Meyer et al.,1998].Low slip rates(mm/yr)have been taken to suggest widely distributed,homogeneous deformation[Bendick et al.,JOURNAL OF GEOPHYSICAL RESEARCH,VOL.109,B06401,doi:10.1029/2003JB002558,2004 1Institut de Physique du Globe de Paris,CNRS UMR7578,Paris,France.2Lawrence Livermore National Laboratory,Livermore,California,USA.3Now at Institut de Physique du Globe de Strasbourg,Ecole etObservatoire des Sciences de la Terre,Strasbourg,France.4Seismological Bureau,Beijing,China.5Institute of Geology,Ministry of Land and Resources,Beijing,China.6Now at Physics Department,Purdue University,West Lafayette,Indiana,USA.Copyright2004by the American Geophysical Union.0148-0227/04/2003JB002558$09.002000;Chen et al.,2000;Shen et al.,2001;Washburn et al.,2001],while fast rates (cm/yr)rule it out [Avouac and Tapponnier ,1992;Peltzer and Saucier ,1996;Tapponnier et al.,2001].[3]To quantify better the long-term slip rate on the central stretch of the Altyn Tagh Fault,we present new measurements of the late Pleistocene-Holocene slip rate at two sites near Tura:the Cherchen He and Sulamu Tagh (Figure 1).In this region,the fault closely follows the Sulamu Range front,and meter-sized pressure ridges attest to the occurrence of large earthquakes along its trace.At this longitude,little slip has yet been transferred to the thrusts that build the mountains of NE Tibet [Meyer et al.,1998].Hence it is reasonable to expect a maximum slip rate.The slip rate determinations are obtained by restora-tion of well-defined offsets of fluvial channels,terrace risers,morainic ridges and glacial valleys whose ages are constrained by 14C dating of charcoals [cf.Sieh and Jahns ,1984]and/or 10Be-26Al cosmic ray exposure dating of both surface and/or subsurface quartz samples [Anderson et al.,1996;Hancock et al.,1999;Van der Woerd et al.,1998,2000].This methodology provides a time-integrated slip rate that spans numerous earthquake cycles,and avoids the potential ambiguities encountered in associating paleoseismic events in vertical trench sections with hori-zontal surface offsets.2.Geologic and Geomorphic Setting2.1.Cherchen He Site[4]At this site,north of the Cherchen River ($37.6°N,86.6°E,3000–3100m above sea level (asl)),the N69°E striking ATF offsets terrace risers and surfaces emplaced by tributary streams of the Cherchen river (WS,ES,Figure 2).The key geomorphic features were mapped in the field using SPOT and Corona images (resolution of 10m and $3.5m,respectively)and 1:100,000-scale topographic maps.The offset measurements are based upon total station profiles and SPOT images.The highest terrace level,T3,$23m above the western streambed (WS)is preserved only north of the fault.The interme-diate level,T2,$10m below T3,covers the broadest area on the east bank of the river (Figures 3and 4),and the $30m cliff incised into it by the river exposes thick,fill conglomerates (Figure 4a).The lowest level,T1,is a thinner strath fanglomerate standing $5.5m above the present streambed (Figures 3and 4a).[5]Near the western stream (WS),both T1and T2are made of pebbles (typically 10cm in diameter)and cobbles (up to 50cm)of various lithologies including granitic gneisses and pure quartz,intercalated with gravel layers (Figures 4b and 4c).A silty sand matrix fills the interstices.Each surface has very sparse vegetation and is composed of pebbles with a poorly developed soil of coarse sand and silt (Figures 4a and 4b).With few exceptions there is no accumulation of surface loess.The active riser incised in T1by the present stream (WS)shows no evidence for the formation of any ‘‘pavement’’of surface pebbles nor near-surface cryoturbation or bioturbation.Where exposed along the Cherchen river cliff,the base of T2has an irregular topography,indicative of the infilling of preexisting chan-nels incised into older conglomerates (Figure 4a).In con-trast,T1is a layer of uniform thickness ($2.5m)with a flat base that cuts the underlying conglomerates (Figure 4a),indicating that T1is a strath terrace responsible for cutting the T2/T1riser.The surfaces of both terraces are relatively flat,slope toward the river by $4°,and show no evidence of regressive rill incision along the Cherchen River cliff (Figure 3).On the eastern side of the site,a smaller,less powerful stream,ES,as shown by the finer,more distal nature of its deposits,has emplaced terrace T1and cut the T2/T1riser (Figure 2).In section,these deposits include layers of silt and clay intercalated with small gravel beds (Figure 5).Subsurface charcoal samples were collected in the silts and clays below the uppermost gravel bed of T1(Figure 5).Here,loess has accumulated on the leeward side of the T2/T1riser,and the surface is covered by soil and vegetation.[6]A large,abandoned paleochannel (PC)is incised into T2south of the fault (Figure 2).Between the fault and the Cherchen River,PC is as wide as the active channel of WS north of the fault.This suggests that the onlystreamFigure rge-scale tectonic map of northern Tibet with this and related studies:C,Cherchen He;S,Sulamu Tagh;M,Mangnai Zhen [Bendick et al.,2000];A,Aksay [Me ´riaux et al.,1997].Local paleoclimatic sites are also indicated:Gu,Guliya Ice cap [Thompson et al.,1997],and Su,Sumxi Co lake [Gasse et al.,1991].powerful enough to incise PC was WS.PC bends to the west along the fault trace and is visible to the T2/T1riser in spite of postabandonment infilling by colluvium from the fault scarp (Figures 2and 3).The bend in the channel is likely due its left-lateral displacement,placing its west side in front of the channel position north of the fault and allowing further fluvial erosion.The east bank on the other hand is protected from fluvial erosion by fault motion.A small regressive gully,RG,incises T2north of the fault.It is bypassed by,and perched above,the westward extension of PC along the fault trace.Moreover,it is too narrow to have fed the PC channel.The channels’relative widths and spatial relationships thus concur and demonstrate that PC represents an ancient course of WS,entrenched into T2.[7]The T2/T1fossil riser on the left bank of WS is sinistrally offset by 166±10m relative to the east edge of the WS channel north of the fault trace.As the eastern edge of the PC channel is protected from fluvial erosion by sinistral fault motion it best preserves the original morphology and position of the channel.Its offset relative to WS’s piercingpoint on the north side of the fault is 418±20m.The T2/T1riser cuts the westward extension of PC along the fault,and must therefore postdate the abandonment of PC.This sup-ports the inference that the T2/T1riser is much younger than the incision of PC,and hence the deposition of T2.The other high,oblique fossil T2/T1riser along the other tributary stream to the east (ES)is cut and offset 180±10m by the fault.The uncertainty on the offset measurements is domi-nated by the width of the feature concerned,its angle to the fault and,where required,projection to the fault.2.2.Sulamu Tagh Site[8]The Sulamu Tagh site ($37.7°N,87.4°E,Figure 1)is located 60km east of the Cherchen He site,at a much greater elevation,between 4400and 5000m asl.Here,the N75°E striking ATF cuts a landscape shaped primarily by ice action (Figures 6–9).Emanating from catchments on the highest peaks of the range (>6000m asl),the two longest glaciers on the south flank of Sulamu Tagh,reach closest to the fault at this site.For at least 20km east and west oftheseFigure 2.Offset terrace risers and channels of tributaries of Cherchen He west of Tura (37.6°N,86.4°E,$3000m asl).(a)Corona image (DS 1025–2118DA031).(b)Results of field mapping.Locations of surface samples are designated as diamonds;DP indicates the locations of subsurface sampling for cosmogenic dating.Terrace surfaces are numbered and shaded as a function of increasing age and elevation.WS is the western stream,ES is the eastern stream,and PC and RG are the paleochannel and regressive channel in incised T2terrace,respectively.Measured riser and stream offsets and average terrace ages are shown.active glaciers no comparably large glaciers exist along the fault (Figure 6).Ice ponding at the terminus of the widest,western,glacier (WG,Figures 7and 8)encroaches across the fault trace,while the more deeply entrenched,eastern glacier (EG)terminates only $700m north of it.[9]Though now essentially free of ice,the area south of the fault bears strong imprint of glacial invasion.Till mantles a flattish,1–2km wide,hanging bench,4600–5000m high,that stretches along the south side of the fault to about 8km east of the western glacier terminus (Figures 7and 8).To the east,the northern edge of this till-mantled surface is defined by a rectilinear,$100-m-high,north facing wall,incised along the fault by the eastern glacier and its outwash (EO,Figures 8and 9d).This precipitous north facing wall now isolates the till deposited on the bench from the Sulamu range.South of the wall the till bench slopes gently and narrows to the south,breaching the surrounding relief (Figures 7and 8).The funnel-like geom-etry of this passage was carved by the confluence of the western (WG)and eastern (EG)glaciers (Figures 7,8,and 9a).This paleoglacial confluence,CP,is subdivided by morainic ridges into four broad channels that become deeper from east to west.The principal postglacial streams draining the till bench flow along these channels,between the abandoned lateral moraines (Figures 7and 8).The highest,best defined moraine,M1,is located along the east side of the deepest,western channel,WC.West of CP,another paleoglacial valley breaches the relief south of the till bench (WV ,Figures 7,8,and 9c),providing an outlet for one of the two main outwashes (CO)of the western glacier.Downstream from its east directed bend,the south side of WV is bounded by another abandoned lateral moraine,M2,with even steeper side slopes and sharper crest than M1(Figure 9c).[10]The till and moraines on the bench must have been emplaced by WG and EG when they crossed the fault,during glacial maxima,and before EG deviated eastward along the fault (Figures 7and 8).Similarly,the western paleoglacial valley can only have been incised by the western glacier before it retreated to pond against relief displaced by the fault.Thus it is clear that both CP and WV have been left-laterally offset large distances from their sources by the ATF.[11]Reconstruction of the paleoconfluence is achieved by aligning its outer edges with the present eastern and western edges of the eastern,and western glacier valleys,respec-tively.The displacement estimates are sensitive to relatively small errors (300m)and yield an offset of 3660±300m (Figures 10and 11a).That the separation of the outer edges of glacial incision is the same ($4km)north and south of the fault further justifies this reconstruction.Retrofitting the deepest channel on the east side of the paleoconfluence,EC (east of M1),with the eastern glacier valley yields an offset of 2080±100m (Figure 11b).The M1morainic ridge itself has been displaced 1400±100m relative to the oblique,ESE trending southeastern edge of the western glacier valley (Figure 11c)The sinistral offset of the eastern edge of the WV paleoglacial valley relative to that of thepresentFigure 3.Total station profiles projected perpendicular to the average strike of the ATF,N159°.(top)Average slope indicated on the 1Â1scale projected profiles;(bottom)projection with vertical exaggeration 4Â.Height of terraces above the western stream (WS)is indicated.Inset is a map view of the total station profiles.(western)ice stream north of the fault is 1020±100m (Figures 11d and 12b).Finally the two main postglacial streams that cross the till bench between the glaciers (labeled ‘‘S1’’and ‘‘S2’’,Figure 12a)show sharp dogleg offsets on the fault of 500±20m and 460±20m,respectively.3.Surface Dating3.1.Analytical Approach[12]The timing of surface abandonment was determined by radiocarbon dating (Table 1)and 10Be and 26Al cosmic ray surface exposure dating of both subsurface and par-tially embedded,surface quartz pebbles (Tables 2and 3).All of the isotopic measurements,14C,10Be and 26Al,were made at the Center for Accelerator Mass Spectrom-etry at Lawrence Livermore National Laboratory.The radiocarbon data are calibrated after Stuiver et al.[1998],and the chemical separation methods for Be and Al follow Kohl and Nishiizumi [1992].[13]Model ages for 10Be and 26Al were calculated using the following expression in which the concentration of the nuclide,N ,is a function of the nuclide production rate atthe surface,P 0,the exposure time,t ,the depth below the surface,z ,the decay constant (for radionuclides),l ,and the erosion rate,e :N z ;t ðÞ¼P 0e Àr z =L l þre =L1Àe Àl þre =L ðÞt;ð1Þwhere L is the absorption mean free path and r is the material density.For surface samples (z =0)experiencing negligible erosion (e =0)this reduces toN 0;t ðÞ¼P 0=l ðÞ1Àe Àl t ÀÁ:ð2Þ[14]The 10Be and 26Al production rates are based on the work by Nishiizumi et al.[1989]recalculated with the revised 13,000-year glacial retreat ages [Clark et al.,1995]and rescaled for altitude and elevation [Lal ,1991].Production rates were further modified to include the effects of a reduced muonogenic contribution of $3%and a spallogenic contribution of 97%at sea level high latitude (SLHL)[Owen et al.,2002].Uncertainties on the concen-trations include those from the procedural blank,carrierFigure 4.Cherchen He site.(a)Overview of site looking to the northeast.The Cherchen He (CH)is inthe right foreground,and the western stream (WS)incises the T1surface.The T1/T2riser is on the right side of the photograph.The arrows show the fault trace.(b)Typical quartz cobble embedded in the T1surface.(c)The T0/T1riser which was refreshed to obtain subsurface samples.The riser is 3–4m high.composition,and counting statistics.Errors on the model ages are calculated by propagating the analytical uncertain-ties together with a 6%error on the production rates [Stone ,2000]and 3.3%and 2.8%uncertainties for the decay con-stants of 10Be and 26Al,respectively [Gosse and Phillips ,2001].To account for the decreased production rates at depth,the ages of subsurface samples are ‘‘depth-corrected’’using equation (1)with r =2.1g/cm 3and L =175g/cm 2.Errors are calculated as above and include additional uncertainties in density and attenuation length of 10%.[15]The dates obtained by both 10Be and 26Al are reasonably consistent,but the 26Al ages appear to be systematically younger (Tables 1and 3).We believe that this may be due to loss of volatile Al complexes during sample preparation.In general,we tend to have more confidence in the 10Be ages,as they require only one measurement 10Be/9Be,while 26Al requires measurement of both 26Al/27Al and Al concentration.In this paper we will discuss only the 10Be results.As 10Be ages are systemati-cally older than the 26Al ones,using the 10Be alone will,holding all other factors constant,yield a relative minimum rate.3.2.Results3.2.1.Cherchen He Site[16]Surface cobbles were collected north and south of the fault on the T1and T2surfaces,and on T3north of the fault.To evaluate the effects of predepositional inheritance on the cosmogenic ages [Anderson et al.,1996;Hancock et al.,1999],subsurface samples were also collected from the T1terrace near WS (Figure 4c).For this we sampled two near vertical,free-faced risers cut by WS both up and down-stream from the fault.Small charcoal fragments were retrieved near ES a few tens of centimeters below the uppermost sand and gravel layer beneath the surface of T1(Figures 2and 5).[17]The three charcoal ages from the silt and clay from beneath the surface of T1are in correct stratigraphic order,with ages ranging from 7.8to 6.4ka (Figure 5and Table 1).None of these samples come from burrows or bioturbated sediments.Detrital charcoal samples often yield ages older than the age of deposition due to inclusion of aninheritedFigure 5.Sketch of the left-bank stream cut face of the T1terrace of the eastern stream (ES)from which the charcoal samples were retrieved.All of the samples are located below the topmost level of gravels.Calibrated ages (ka)are indicated (INTERCAL’98[Stuiver et al.,1998]).Figure 6.SPOT image (KJ 222-274)showing all the glaciers of the Sulamu Tagh massif.Western glacier (WG)and eastern glacier (EG)are the largest glaciers on the south flank of the range.component.Here,however,the uppermost sample was collected in a burn lens that we interpret to be an in situ campfire,and therefore T1must be younger than 6.4±0.07ka.[18]The two 10Be depth profiles in T1yield depth-corrected ages of subsurface samples (nine in total)ranging from as young as $6to 72ka (Table 2).Depth-corrected ages of subsurface samples can only be perturbed from the true abandonment age by inheritance.The youngest sub-surface samples therefore provide a maximum bound on the true abandonment age of the surface that,in turn,yields a minimum slip rate.The maximum age constraint provided by the youngest depth-corrected ages for T1,$6ka,is also in good agreement with the radiocarbon dating.Together these age estimates provide a strong argument for the abandonment of T1at $6ka and also provides a basis for comparison with age estimates obtained from cosmogenic dating of surface samples.[19]Age estimates from cosmogenic dating of surface materials can be influenced by predepositional inheritance,postdepositional contamination,erosion,and other surface processes that lead to mixing and turbation.The age distri-bution for surface and subsurface materials can thereforerepresent the amalgamation of more than one age population and can be further perturbed by surface processes.The observed distribution of ages therefore need not be normally distributed,or even unimodal.This is clearly demonstrated by the 10Be model ages from T1surface.While this surface is rather firmly dated at $6ka based on radiocarbon dating,consistent with the youngest 10Be ages of subsurface sam-ples,the 2710Be dates obtained (from both surface and subsurface cobbles)on T1range from 3.55to 72ka (Table 2);the mean square weighted deviation (MSWD)is $47indicating that the sample cannot be drawn from a single,normally distributed population.Of the 27samples,12fall within 2000years of the radiocarbon/subsurface age estimate and only 2samples yield ages that are significantly younger (TU3-59and TU3-60;although as the radiocarbon age estimate is an upper bound on the surface age,these too may be in agreement).The remaining 15samples are older than the radiocarbon age estimate by various amounts,and illustrate predepositional exposure inheritance,or diachro-nous deposition/abandonment as the predominant sources of error.[20]Age clusters are often defined by visual rejection of outliers [Van der Woerd et al.,2002b,1998].An established method for discarding outliers is Chauvenet’s criterion which assesses the probability of finding a datum differing from the average by a given amount [see Bevington and Robinson ,2002,p.58].If the number of events expected at a certain value is less than some discriminant (typically 0.5events),then that event can be discarded.The result of iterative application of this criterion to the T1samples eliminates the 7oldest ages from the population.The remaining 20ages range from 3.7to 11.6ka (Figure 13).The simple average of the remaining data is 7.3±2.2ka (error is 1s ).While still not normally distributed (MSWD =21.4),the 1s error bracket calculated from the filtereddataFigure 7.SPOT image draped on a digital elevation modelof the Sulamu Tagh area processed from a digitized 1:100,000scale Chinese map.WG and EG,west and east glaciers,respectively;WV,west paleoglacial valley;EC,east paleoglacial confluence;WO,CO,EO,west,central,and east glacial outwashes,respectively;M1,M2,youngest abandoned lateral moraines.The glacial confluence area (CP)abraded by glacial action is clearly smoother than the surroundingrelief.Figure 8.Map of glacial geomorphic features overlain on Corona image.The cumulative geomorphic scarp south of the fault (red line)and triangular facets north of ATF are shaded violet.Yellow lines (piercing lines)mark glacial channels or moraines.Cumulative offsets (in meters)are indicated.Numbers below arrows refer to offsets of eastern edge of WG.Numbers above the arrows are offsets relative to the eastern edge of EG.S1and S2indicate offset postglacial streams,with offsets of 500±20m and 460±20m,respectively.captures$75%of the filtered data,as well as the radiocar-bon age constraint of$6ka(Figure13).[21]Surface erosion can result in model ages that are younger than the true exposure age,but will not have a significant effect on samples as young as those on T1 (Figure14).Postabandonment contamination of the sur-face can also perturb cosmogenic ages,but has no effect on subsurface radiocarbon ages.For T1,the agreement between radiocarbon ages and the youngest surface and subsurface cosmogenic ages demonstrates that erosion and postabandonment contamination have had negligible ef-fect on the cosmogenic age determinations,and supports the use of zero-erosion rate model ages.On the basis of these three different age determinations,we conclude that T1was abandoned no earlier than7.3ka and more likely after6.4ka as required by the uppermost charcoal age near ES.[22]Only surface samples for cosmogenic dating were obtained from T2(Table2).Like those from T1,the 15surface10Be dates from T2are not normally distributed (MSWD=20.0),but are clearly older than the T1samples ranging from10.0to38.9ka.In the absence of subsurface and/or radiocarbon ages,we have applied Chauvenet’s criterion to filter the data,discarding the two oldest samples,TU3-64and TU3-46,as outliers,likely influenced by predepositional exposure.The remaining13data range from10.0to21.8ka.The corresponding,unweighted average(and standard deviation)is16.6±3.9ka.While again,not normally distributed(MSWD=11.4)the1s error bracket does captures a majority of the data(Figure13). Although we do not have other age constraints to compare with the surface samples,the similarity of the T1and T2 surfaces’morphologies,lithologies and age distributions provides support for these error estimates.Hence we conclude that T2was abandoned after16.6±3.9ka.This average age,16.6± 3.9ka,includes the effects of diachronous emplacement/abandonment and inheritance. The final abandonment of T2may be better approximated by the age of the youngest cobble,TU3-50,10.0±0.71ka.Also,as is the case for T1,erosion has little effect on cosmogenic nuclide concentrations for samples of this age(Figure14),and we use only model ages in the discussion.[23]Three samples from the T3surface yield ages be-tween72.3and91.6ka(Table2).The number of samples analyzed is too small to yield a robust age estimate. However,it is clear that T3is considerably older than T1 and T2,confirming the correlation between surface height and relative age.In summary,the direct surface dating we performed supports the inference derived from geomorphic observation.The highest T3remnant is oldest,and signif-icantly predates the LGM.Both T1and T2postdate the LGM.The high-level fill terrace,T2,whose emplacement was likely due to deglaciation,is appreciably older thanthe Figure9.Sulamu Tagh site.(a)Overview of the paleoglacial confluence and more particularly the M1 moraine in the foreground;view to the northeast.(b)Fresh mole tracks and sag ponds on glacial till at Sulamu Tagh;view to the west.(c)Western valley WV and the youngest M2moraine;view to the south.(d)Eastern outwash of EG.Note the200-m-high till bench that isolates EO from CP;view to the east.。