ASP中利用OWC控件绘制图表
- 格式:docx
- 大小:15.55 KB
- 文档页数:2
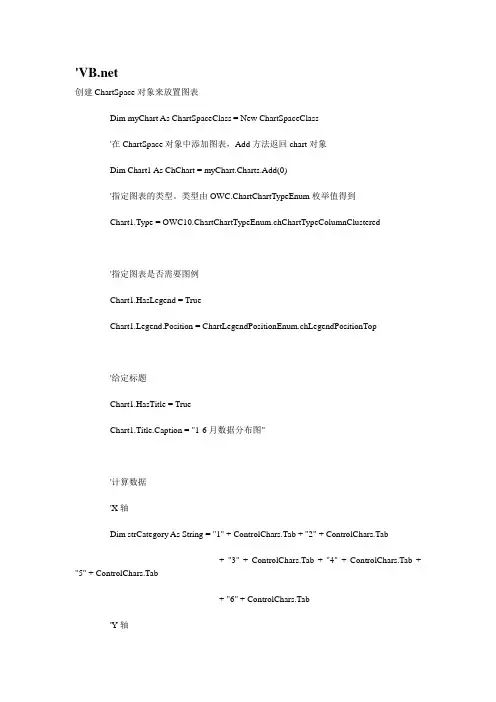
'创建ChartSpace对象来放置图表Dim myChart As ChartSpaceClass = New ChartSpaceClass'在ChartSpace对象中添加图表,Add方法返回chart对象Dim Chart1 As ChChart = myChart.Charts.Add(0)'指定图表的类型。
类型由OWC.ChartChartTypeEnum枚举值得到Chart1.Type = OWC10.ChartChartTypeEnum.chChartTypeColumnClustered'指定图表是否需要图例Chart1.HasLegend = TrueChart1.Legend.Position = ChartLegendPositionEnum.chLegendPositionTop'给定标题Chart1.HasTitle = TrueChart1.Title.Caption = "1-6月数据分布图"'计算数据'X轴Dim strCategory As String = "1" + ControlChars.Tab + "2" + ControlChars.Tab _+ "3" + ControlChars.Tab + "4" + ControlChars.Tab + "5" + ControlChars.Tab _+ "6" + ControlChars.Tab'Y轴Dim strV alue As String = "9" + ControlChars.Tab + "8" + ControlChars.Tab _+ "4" + ControlChars.Tab + "10" + ControlChars.Tab + "12" + ControlChars.Tab _+ "6" + ControlChars.Tab'Z轴Dim strV alue2 As String = "0.3" + ControlChars.Tab + "0.63" + ControlChars.Tab _+ "0.48" + ControlChars.Tab + "0.86" + ControlChars.Tab + "0.95" + ControlChars.Tab _+ "0.18" + ControlChars.Tab'1. 添加一个seriesDim Ser1 As ChSeries = Chart1.SeriesCollection.Add(0)'给定series的名字Ser1.SetData(ChartDimensionsEnum.chDimSeriesNames, _ ChartSpecialDataSourcesEnum.chDataLiteral, "Product")'给定分类Ser1.SetData(ChartDimensionsEnum.chDimCategories, _ ChartSpecialDataSourcesEnum.chDataLiteral, strCategory)'给定值Ser1.SetData(ChartDimensionsEnum.chDimV alues, _ChartSpecialDataSourcesEnum.chDataLiteral, strV alue)'2. 再添加一个seriesDim Ser2 As ChSeries = Chart1.SeriesCollection.Add(1)'给定series的名字Ser2.SetData(ChartDimensionsEnum.chDimSeriesNames, _ ChartSpecialDataSourcesEnum.chDataLiteral, "Ratio")'给定分类Ser2.SetData(ChartDimensionsEnum.chDimCategories, _ ChartSpecialDataSourcesEnum.chDataLiteral, strCategory)'给定值Ser2.SetData(ChartDimensionsEnum.chDimV alues, _ ChartSpecialDataSourcesEnum.chDataLiteral, strV alue2)Ser2.Ungroup(True)Ser2.Type = ChartChartTypeEnum.chChartTypeLineMarkers'添加Z轴Dim AxesZ As ChAxis = Chart1.Axes.Add(Ser2.Scalings(ChartDimensionsEnum.chDimV alues))AxesZ.NumberFormat = "0.00%"AxesZ.Position = ChartAxisPositionEnum.chAxisPositionRight'给定x,y轴的图示说明'默认只有X,Y两个轴Chart1.Axes(-3).HasTitle = TrueChart1.Axes(-3).Title.Caption = "Y轴: 数量"Chart1.Axes(-2).HasTitle = TrueChart1.Axes(-2).Title.Caption = "X 轴:月份"AxesZ.HasTitle = TrueAxesZ.Title.Caption = "Z 轴:Ratio"'输出成GIF文件.Dim strAbsolutePath As String = "C:Images" & Format(Date.Now, "yyyyMMddhhmmss") & ".gif"myChart.ExportPicture(strAbsolutePath, "GIF", 600, 350)Me.Image1.ImageUrl = strAbsolutePath本文来自CSDN博客,转载请标明出处:/coso/archive/2006/09/17/1233263.aspx。

如何在中用OWC绘制图表一、概述在开发应用程序时,经常会遇到必须提供交互式图表的情况。
例如,你可能在开发一个管理销售和产品数据的应用程序,数据保存在SQL Server数据库上,应用程序允许用户添加数据、更新现有数据,但除了这些功能之外,客户还要求应用程序能够用饼图、柱形图或XY散点图的形式直观地描述数据。
在Windows桌面应用程序中,这类要求从来不成为问题,可供选用的图形库和绘图组件实在太多了。
但对于Web应用程序,问题就变得复杂多了。
要在Web应用中绘制图表,可供选择的办法包括:■客户端:利用各种ActiveX组件,Web浏览器内完全有可能达到“丰富”Windows客户程序那样的功能。
缺点是客户端的设置复杂化,要求发布客户端软件,通常按照每客户端的方式计算许可证费用。
另外,非MS Windows/IE的客户端一般难以运行。
■服务器端:利用Web服务器上运行的服务器端代码,动态地生成图表,然后以GIF或JPG图形的形式发送给客户端。
这种办法的优点是,客户端只需要一个标准的浏览器。
与客户端技术相比的缺点是,图形的交互能力差(除非向服务器提交新的请求,否则就不能缩放、滚动)。
许多地图网站(例如)大量地运用了这一技术。
注意,地图图形不是保存在Web服务器上,而是用户发出一个请求时动态从地图数据库生成。
本文主要讨论如何利用服务器端的图表绘制技术在 Web页面中提供图形功能二、设置图表引擎如果要在应用程序中绘制图表,必须要有一个合适的图表引擎。
有一个内建的图形工具库,即System.Drawing名称空间的GDI+,可以用来创建简单的饼图、柱形图、折线图等,不过它属于低级的API,算不上绘制图表的引擎,特别是不适合绘制复杂的图表。
本文要讨论的主角是OWC,即Office Web Components,或者“Office Web组件”。
按照微软的定义,OWC是一种“将类似Office的功能扩展到Web的微软技术”。
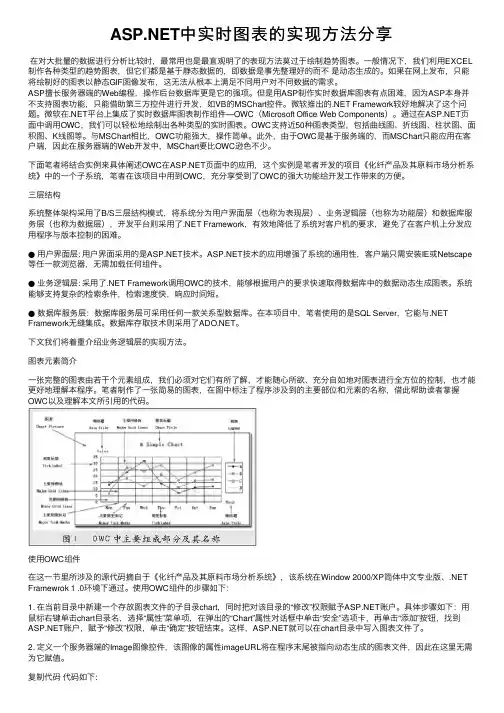
中实时图表的实现⽅法分享在对⼤批量的数据进⾏分析⽐较时,最常⽤也是最直观明了的表现⽅法莫过于绘制趋势图表。
⼀般情况下,我们利⽤EXCEL 制作各种类型的趋势图表,但它们都是基于静态数据的,即数据是事先整理好的⽽不是动态⽣成的。
如果在⽹上发布,只能将绘制好的图表以静态GIF图像发布,这⽆法从根本上满⾜不同⽤户对不同数据的需求。
ASP擅长服务器端的Web编程,操作后台数据库更是它的强项。
但是⽤ASP制作实时数据库图表有点困难,因为ASP本⾝并不⽀持图表功能,只能借助第三⽅控件进⾏开发,如VB的MSChart控件。
微软推出的.NET Framework较好地解决了这个问题。
微软在.NET平台上集成了实时数据库图表制作组件—OWC(Microsoft Office Web Components)。
通过在页⾯中调⽤OWC,我们可以轻松地绘制出各种类型的实时图表。
OWC⽀持近50种图表类型,包括曲线图、折线图、柱状图、⾯积图、K线图等。
与MSChart相⽐,OWC功能强⼤,操作简单。
此外,由于OWC是基于服务端的,⽽MSChart只能应⽤在客户端,因此在服务器端的Web开发中,MSChart要⽐OWC逊⾊不少。
下⾯笔者将结合实例来具体阐述OWC在页⾯中的应⽤,这个实例是笔者开发的项⽬《化纤产品及其原料市场分析系统》中的⼀个⼦系统,笔者在该项⽬中⽤到OWC,充分享受到了OWC的强⼤功能给开发⼯作带来的⽅便。
三层结构系统整体架构采⽤了B/S三层结构模式,将系统分为⽤户界⾯层(也称为表现层)、业务逻辑层(也称为功能层)和数据库服务层(也称为数据层),开发平台则采⽤了.NET Framework,有效地降低了系统对客户机的要求,避免了在客户机上分发应⽤程序与版本控制的困难。
●⽤户界⾯层: ⽤户界⾯采⽤的是技术。
技术的应⽤增强了系统的通⽤性,客户端只需安装IE或Netscape 等任⼀款浏览器,⽆需加载任何组件。
●业务逻辑层: 采⽤了.NET Framework调⽤OWC的技术,能够根据⽤户的要求快速取得数据库中的数据动态⽣成图表。
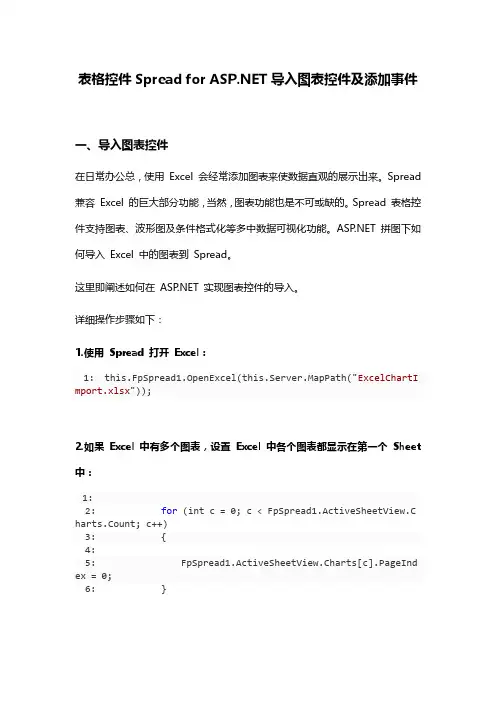
表格控件Spread for 导入图表控件及添加事件一、导入图表控件在日常办公总,使用Excel 会经常添加图表来使数据直观的展示出来。
Spread 兼容Excel 的巨大部分功能,当然,图表功能也是不可或缺的。
Spread 表格控件支持图表、波形图及条件格式化等多中数据可视化功能。
拼图下如何导入Excel 中的图表到Spread。
这里即阐述如何在 实现图表控件的导入。
详细操作步骤如下:1.使用Spread 打开Excel:1: this.FpSpread1.OpenExcel(this.Server.MapPath("ExcelChartI mport.xlsx"));2.如果Excel 中有多个图表,设置Excel 中各个图表都显示在第一个Sheet 中:1:2: for (int c = 0; c < FpSpread1.ActiveSheetView.C harts.Count; c++)3: {4:5: FpSpread1.ActiveSheetView.Charts[c].PageInd ex = 0;6: }3.在webconfig 文件中,添加图表配置节点。
1: <httpHandlers>2: <add path="FpChart.axd" verb="*" type="FarPoint.Web.Ch art.ChartImageHttpHandler" validate="true" />3: </httpHandlers>效果图如下:二、添加事件Spread for 中添加事件的方法十分简单方便-在前台的属性窗体中即可添加。
但是需要在后台重置Spread ,这样所有前台添加的事件都被重置。
这里我们介绍如何通过前台js 代码添加Spread 客户端事件。
MVC项⽬开发之统计图的使⽤(前⾔)接触这个项⽬,是项⽬组长已经完成了多数需求,并且有2个项⽬需要完⼯的情况下,让我加⼊,给了我2个表格,让我去设计出统计图。
第⼀次做统计图,可以说没有任何经验,不知道该如何下⼿,表格的数据量不少,重要的是分⽀很多,就准备先找下统计图插件,看下那个⽐较好⽤,并且做下对⽐。
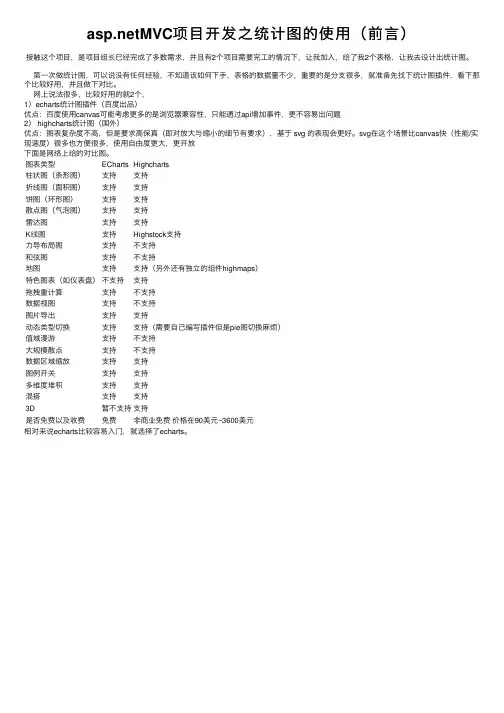
⽹上说法很多,⽐较好⽤的就2个,1)echarts统计图插件(百度出品)优点:百度使⽤canvas可能考虑更多的是浏览器兼容性,只能通过api增加事件,更不容易出问题2) highcharts统计图(国外)优点:图表复杂度不⾼,但是要求⾼保真(即对放⼤与缩⼩的细节有要求),基于 svg 的表现会更好。
svg在这个场景⽐canvas快(性能/实现速度)很多也⽅便很多,使⽤⾃由度更⼤,更开放下⾯是⽹络上给的对⽐图。
图表类型ECharts Highcharts柱状图(条形图)⽀持⽀持折线图(⾯积图)⽀持⽀持饼图(环形图)⽀持⽀持散点图(⽓泡图)⽀持⽀持雷达图⽀持⽀持K线图⽀持Highstock⽀持⼒导布局图⽀持不⽀持和弦图⽀持不⽀持地图⽀持⽀持(另外还有独⽴的组件highmaps)特⾊图表(如仪表盘)不⽀持⽀持拖拽重计算⽀持不⽀持数据视图⽀持不⽀持图⽚导出⽀持⽀持动态类型切换⽀持⽀持(需要⾃⼰编写插件但是pie图切换⿇烦)值域漫游⽀持不⽀持⼤规模散点⽀持不⽀持数据区域缩放⽀持⽀持图例开关⽀持⽀持多维度堆积⽀持⽀持混搭⽀持⽀持3D暂不⽀持⽀持是否免费以及收费免费⾮商业免费价格在90美元~3600美元相对来说echarts⽐较容易⼊门,就选择了echarts。
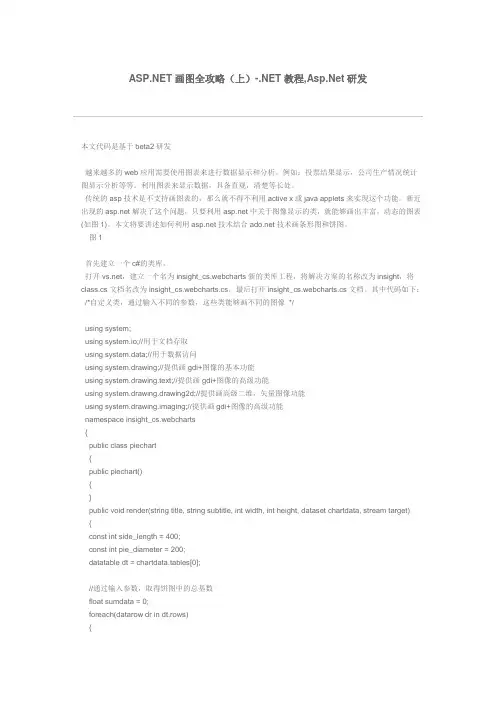
画图全攻略(上)教程,研发本文代码是基于beta2研发越来越多的web应用需要使用图表来进行数据显示和分析。
例如:投票结果显示,公司生产情况统计图显示分析等等。
利用图表来显示数据,具备直观,清楚等长处。
传统的asp技术是不支持画图表的,那么就不得不利用active x或java applets来实现这个功能。
新近出现的解决了这个问题,只要利用中关于图像显示的类,就能够画出丰富,动态的图表(如图1)。
本文将要讲述如何利用技术结合技术画条形图和饼图。
图1首先建立一个c#的类库。
打开,建立一个名为insight_cs.webcharts新的类库工程,将解决方案的名称改为insight,将class.cs文档名改为insight_cs.webcharts.cs,最后打开insight_cs.webcharts.cs文档。
其中代码如下: /*自定义类,通过输入不同的参数,这些类能够画不同的图像*/using system;using system.io;//用于文档存取using system.data;//用于数据访问using system.drawing;//提供画gdi+图像的基本功能using system.drawing.text;//提供画gdi+图像的高级功能using system.drawing.drawing2d;//提供画高级二维,矢量图像功能using system.drawing.imaging;//提供画gdi+图像的高级功能namespace insight_cs.webcharts{public class piechart{public piechart(){}public void render(string title, string subtitle, int width, int height, dataset chartdata, stream target) {const int side_length = 400;const int pie_diameter = 200;datatable dt = chartdata.tables[0];//通过输入参数,取得饼图中的总基数float sumdata = 0;foreach(datarow dr in dt.rows){sumdata += convert.tosingle(dr[1]);}//产生一个image对象,并由此产生一个graphics对象bitmap bm = new bitmap(width,height);graphics g = graphics.fromimage(bm);//配置对象g的属性g.scaletransform((convert.tosingle(width))/side_length,(convert.tosingle(height))/side_length);g.smoothingmode = smoothingmode.default;g.textrenderinghint = textrenderinghint.antialias;//画布和边的设定g.clear(color.white);g.drawrectangle(pens.black,0,0,side_length-1,side_length-1);//画饼图标题g.drawstring(title,new font("tahoma",24),brushes.black,new pointf(5,5));//画饼图的图例g.drawstring(subtitle,new font("tahoma",14),brushes.black,new pointf(7,35));//画饼图float curangle = 0;float totalangle = 0;for(int i=0;i<dt.rows.count;i++){curangle = convert.tosingle(dt.rows[i][1]) / sumdata * 360;g.fillpie(newsolidbrush(chartutil.getchartitemcolor(i)),100,65,pie_diameter,pie_diameter,totalangle,curangle);g.drawpie(pens.black,100,65,pie_diameter,pie_diameter,totalangle,curangle);totalangle += curangle;}//画图例框及其文字g.drawrectangle(pens.black,200,300,199,99);g.drawstring("legend",new font("tahoma",12,fontstyle.bold),brushes.black,new pointf(200,300));//画图例各项pointf boxorigin = new pointf(210,330);pointf textorigin = new pointf(235,326);float percent = 0;for(int i=0;i<dt.rows.count;i++){g.fillrectangle(new solidbrush(chartutil.getchartitemcolor(i)),boxorigin.x,boxorigin.y,20,10);g.drawrectangle(pens.black,boxorigin.x,boxorigin.y,20,10);percent = convert.tosingle(dt.rows[i][1]) / sumdata * 100;g.drawstring(dt.rows[i][0].tostring() + " - " + dt.rows[i][1].tostring() + " (" + percent.tostring("0") + "%)",new font("tahoma",10),brushes.black,textorigin);boxorigin.y += 15;textorigin.y += 15;}//通过response.outputstream,将图像的内容发送到浏览器bm.save(target, imageformat.gif);//回收资源bm.dispose();g.dispose();}}//画条形图public class barchart{public barchart(){}public void render(string title, string subtitle, int width, int height, dataset chartdata, stream target) {const int side_length = 400;const int chart_top = 75;const int chart_height = 200;const int chart_left = 50;const int chart_width = 300;datatable dt = chartdata.tables[0];//计算最高的点float highpoint = 0;foreach(datarow dr in dt.rows){if(highpoint<convert.tosingle(dr[1])){highpoint = convert.tosingle(dr[1]);}}//建立一个graphics对象实例bitmap bm = new bitmap(width,height);graphics g = graphics.fromimage(bm);//配置条图图像和文字属性g.scaletransform((convert.tosingle(width))/side_length,(convert.tosingle(height))/side_length); g.smoothingmode = smoothingmode.default;g.textrenderinghint = textrenderinghint.antialias;//设定画布和边g.clear(color.white);g.drawrectangle(pens.black,0,0,side_length-1,side_length-1);//画大标题g.drawstring(title,new font("tahoma",24),brushes.black,new pointf(5,5));//画小标题g.drawstring(subtitle,new font("tahoma",14),brushes.black,new pointf(7,35));//画条形图float barwidth = chart_width / (dt.rows.count * 2);pointf barorigin = new pointf(chart_left + (barwidth / 2),0);float barheight = dt.rows.count;for(int i=0;i<dt.rows.count;i++){barheight = convert.tosingle(dt.rows[i][1]) * 200 / highpoint;barorigin.y = chart_top + chart_height - barheight;g.fillrectangle(newsolidbrush(chartutil.getchartitemcolor(i)),barorigin.x,barorigin.y,barwidth,barheight);barorigin.x = barorigin.x + (barwidth * 2);}//配置边g.drawline(new pen(color.black,2),new point(chart_left,chart_top),new point(chart_left,chart_top + chart_height));g.drawline(new pen(color.black,2),new point(chart_left,chart_top + chart_height),new point(chart_left + chart_width,chart_top + chart_height));//画图例框和文字g.drawrectangle(new pen(color.black,1),200,300,199,99);g.drawstring("legend",new font("tahoma",12,fontstyle.bold),brushes.black,new pointf(200,300));//画图例pointf boxorigin = new pointf(210,330);pointf textorigin = new pointf(235,326);for(int i=0;i<dt.rows.count;i++){g.fillrectangle(new solidbrush(chartutil.getchartitemcolor(i)),boxorigin.x,boxorigin.y,20,10);g.drawrectangle(pens.black,boxorigin.x,boxorigin.y,20,10);g.drawstring(dt.rows[i][0].tostring() + " - " + dt.rows[i][1].tostring(),newfont("tahoma",10),brushes.black,textorigin);boxorigin.y += 15;textorigin.y += 15;}//输出图像bm.save(target, imageformat.gif);//资源回收bm.dispose();g.dispose();}}public class chartutil{public chartutil(){}public static color getchartitemcolor(int itemindex){color selectedcolor;switch(itemindex){case 0:selectedcolor = color.blue;break;case 1:selectedcolor = color.red;break;case 2:selectedcolor = color.yellow;break;case 3:selectedcolor = color.purple;break;default:selectedcolor = color.green;break;}return selectedcolor;}}}代码分析:1.引入一些namespaceusing system;using system.io;//用于文档存取using system.data;//用于数据访问using system.drawing;//提供画gdi+图像的基本功能using system.drawing.text;//提供画gdi+图像的高级功能using system.drawing.drawing2d;//提供画高级二维,矢量图像功能 using system.drawing.imaging;//提供画gdi+图像的高级功能这些namespace将在后面被应用。
竭诚为您提供优质文档/双击可除asp表格控件篇一:.net4.0表格控件4.0表格控件表格控件有三个控件组成,包括htmltable控件、htmltableRow控件和htmltable控件。
其中htmltable控件用来控制元素。
在html中,用来建立一个表格。
htmltablecell控件用来控制和元素。
在html中,这些元素用来建立表格单元格和表格标题单元格。
htmltableRow控件用来控制元素。
在html中,元素用来建立表格行。
htmltable 控件可以配合htmltableRow以及htmltablecell控件来动态的产生表格。
表格控件之间的关系可以这样认为:htmltable控件是由许多列(Row)所组成,而每一列中是由许多储存格(cell)所组成。
所以htmltable控件中有Rows集合,htmltableRow 控件中有cells集合。
我们依秩序利用htmltableRow中cells集合的add方法,将htmltablecell控件串成一列(Row)后,再将这一列加到htmltable的Rows集合中,这样一来表格就大功告成了。
下面是一个使用表格控件生成表格的实例,代码如下所示。
篇二:asp中利用owc控件绘制图表asp中利用owc控件绘制图表在页面动态绘制图表的问题。
在asp中动态生成图表主要有2种方式,一是使用表格控制生成;另一种方式是使用office的owc控件生成图表。
本文讨论的是如何实现在asp 中用owc控件动态生成图表图片,保存在服务器端然后发送到浏览器显示,客户端浏览器只要支持标签就能显示图表,可避免直接输出动态图表到客户端时有可能带来的一系列问题。
*owc简介owc是officewebcompent的缩写,即microsoft的officeweb组件,它为在web中绘制图形提供了灵活的同时也是最基本的机制。
通过在asp页面中调用owc,我们可以轻松地绘制出各种类型的实时图表。
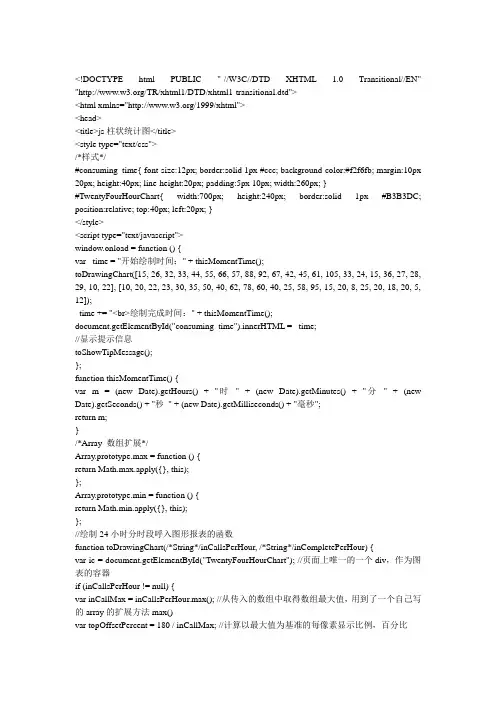
<!DOCTYPE html PUBLIC "-//W3C//DTD XHTML 1.0 Transitional//EN" "/TR/xhtml1/DTD/xhtml1-transitional.dtd"><html xmlns="/1999/xhtml"><head><title>js柱状统计图</title><style type="text/css">/*样式*/#consuming_time{ font-size:12px; border:solid 1px #ccc; background-color:#f2f6fb; margin:10px 20px; height:40px; line-height:20px; padding:5px 10px; width:260px; }#TwentyFourHourChart{ width:700px; height:240px; border:solid 1px #B3B3DC; position:relative; top:40px; left:20px; }</style><script type="text/javascript">window.onload = function () {var _time = "开始绘制时间:" + thisMomentTime();toDrawingChart([15, 26, 32, 33, 44, 55, 66, 57, 88, 92, 67, 42, 45, 61, 105, 33, 24, 15, 36, 27, 28, 29, 10, 22], [10, 20, 22, 23, 30, 35, 50, 40, 62, 78, 60, 40, 25, 58, 95, 15, 20, 8, 25, 20, 18, 20, 5, 12]);_time += "<br>绘制完成时间:" + thisMomentTime();document.getElementById("consuming_time").innerHTML = _time;//显示提示信息toShowTipMessage();};function thisMomentTime() {var m = (new Date).getHours() + "时" + (new Date).getMinutes() + "分" + (new Date).getSeconds() + "秒" + (new Date).getMilliseconds() + "毫秒";return m;}/*Array 数组扩展*/Array.prototype.max = function () {return Math.max.apply({}, this);};Array.prototype.min = function () {return Math.min.apply({}, this);};//绘制24小时分时段呼入图形报表的函数function toDrawingChart(/*String*/inCallsPerHour, /*String*/inCompletePerHour) {var ic = document.getElementById("TwentyFourHourChart"); //页面上唯一的一个div,作为图表的容器if (inCallsPerHour != null) {var inCallMax = inCallsPerHour.max(); //从传入的数组中取得数组最大值,用到了一个自己写的array的扩展方法max()var topOffsetPercent = 180 / inCallMax; //计算以最大值为基准的每像素显示比例,百分比for (var i = 0; i < inCallsPerHour.length; i++) { //循环24小时数据var sumrow = document.createElement("div"); //创建一个div元素sumrowsumrow.id = "sumrow_" + i + "_" + inCallsPerHour[i];//为刚刚创建的div元素sumrow添加id 属性(这里把时间,呼入电话总量数据写入到id中,后面显示这些信息的时候有用)sumrow.setAttribute("class", "incallchartsumrow"); //添加属性//设置元素的left(每个div宽度为10px,那么第i个元素就应该是i*10,因为还有一列10像素的组装图,所以还要*2,加上距离左侧40px边距+ 每2个柱状图为一组之间的间隔空隙6px,所以得出如下,)sumrow.style.left = (i * 10) * 2 + (i * 6) + 40 + "px";//高度的计算,Math.round四舍五入取值,百分比的基数乘以当前时段的呼入数据,为统计图的高度sumrow.style.height = Math.round(topOffsetPercent * inCallsPerHour[i]) + "px";sumrow.style.width = "10px"; //宽度10px像素sumrow.style.position = "absolute"; //绝对定位sumrow.style.overflow = "hidden"; //超出部分隐藏sumrow.style.background = "none repeat scroll 0 0 #1280ef"; //背景颜色sumrow.style.display = "block"; //块状显示//距离容器上边框的距离,图表高度200 减去当前这个柱状图图表高度sumrow.style.top = 200 - Math.round(topOffsetPercent * inCallsPerHour[i]) + "px";ic.appendChild(sumrow); //将创建的sumcow元素添加到ic容器中去var timerow = document.createElement("div");timerow.id = "timerow_" + i;timerow.setAttribute("class", "callnum");timerow.style.left = (10 * i) * 2 + (i * 6) + 40 + "px";timerow.style.width = "10px";timerow.style.position = "absolute";timerow.style.top = "205px";timerow.innerHTML = '<span style="font-size:12px; color:#666666;"> ' + i + '</span>';ic.appendChild(timerow);var cptrow = document.createElement("div");cptrow.id = "cptrow_" + i + "_" + inCompletePerHour[i];cptrow.setAttribute("class", "incallchartsumrow");cptrow.style.width = "10px";cptrow.style.height = Math.round(topOffsetPercent * inCompletePerHour[i]) + "px";cptrow.style.position = "absolute";cptrow.style.background = "none repeat scroll 0 0 #92be0f";cptrow.style.left = (i * 10) * 2 + 10 + (i * 6) + 40 + "px";cptrow.style.display = "block";cptrow.style.top = 200 - Math.round(topOffsetPercent * inCompletePerHour[i]) + "px";ic.appendChild(cptrow);}//绘制标尺线for (var i = 0; i < 5; i++) {var tity = document.createElement("div");tity.setAttribute("class", "tity");tity.style.width = "30px";tity.style.position = "absolute";tity.style.top = (36 * i) + (20 - 6) + "px";tity.style.left = "15px";tity.innerHTML = '<span style="font-size:12px; color:#666666;"> ' + Math.round(inCallMax - (inCallMax / 5) * i) + '</span>';ic.appendChild(tity);var liney = document.createElement("div");liney.setAttribute("style", "width:620px; left:40px; border-top:1px dotted #B9B9B9; height:1px; line-height:1px; display:block; overflow:hidden; position:absolute; ");liney.style.top = (36 * i) + 20 + "px";ic.appendChild(liney);}} else {icArea.innerHTML = '<div style="color:#0066cc; font-size:12px; margin:20px 0 0 80px;">暂无统计数据</div>';}}//鼠标提示显示24小时实时>》呼入《<监控的详细数据function toShowTipMessage() {var nodes = document.getElementById("TwentyFourHourChart").getElementsByTagName("div");for (var i = 0; i < nodes.length; i++) {nodes[i].onmouseover = function () {var temp = this.id.split("_");var type = temp[0];var hour = temp[1];var times = temp[2];var tipMessage = "";var tip = document.createElement("div");tip.id = "TipMessage";tip.style.position = "absolute";tip.style.top = (parseInt(document.getElementById(this.id).style.top.replace("px", "")) - 20) + "px";tip.style.left = document.getElementById(this.id).style.left;if (type == "sumrow") {tipMessage = "今日" + hour + "时呼入" + times;} else if (type == "cptrow") {tipMessage = "今日" + hour + "时已接" + times;}tip.innerHTML = '<span style="font-size:12px; display:block; height:20px; background-color:#ffffff; padding:0px 2px; line-height:20px;">' + tipMessage + '</span>'; document.getElementById("TwentyFourHourChart").appendChild(tip);nodes[i].onmouseout = function () {var tip = document.getElementById("TipMessage");document.getElementById("TwentyFourHourChart").removeChild(tip);}}}</script></head><body><!-- 下面这个div consuming_time 是为了显示左上角,绘制图表耗时显示之用,在实际使用中午用处--><div id="consuming_time"></div><div id="TwentyFourHourChart"></div></body></html><!DOCTYPE html PUBLIC "-//W3C//DTD XHTML 1.0 Transitional//EN" "/TR/xhtml1/DTD/xhtml1-transitional.dtd"><html xmlns="/1999/xhtml"><head><title>js柱状统计图</title><style type="text/css">/*样式*/#consuming_time{ font-size:12px; border:solid 1px #ccc; background-color:#f2f6fb; margin:10px 20px; height:40px; line-height:20px; padding:5px 10px; width:260px; }#TwentyFourHourChart{ width:700px; height:240px; border:solid 1px #B3B3DC; position:relative; top:40px; left:20px; }</style><script type="text/javascript">window.onload = function () {var _time = "开始绘制时间:" + thisMomentTime();toDrawingChart([15, 26, 32, 33, 44, 55, 66, 57, 88, 92, 67, 42, 45, 61, 105, 33, 24, 15, 36, 27, 28, 29, 10, 22], [10, 20, 22, 23, 30, 35, 50, 40, 62, 78, 60, 40, 25, 58, 95, 15, 20, 8, 25, 20, 18, 20, 5, 12]);_time += "<br>绘制完成时间:" + thisMomentTime();document.getElementById("consuming_time").innerHTML = _time;//显示提示信息toShowTipMessage();};function thisMomentTime() {var m = (new Date).getHours() + "时" + (new Date).getMinutes() + "分" + (new Date).getSeconds() + "秒" + (new Date).getMilliseconds() + "毫秒";return m;/*Array 数组扩展*/Array.prototype.max = function () {return Math.max.apply({}, this);};Array.prototype.min = function () {return Math.min.apply({}, this);};//绘制24小时分时段呼入图形报表的函数function toDrawingChart(/*String*/inCallsPerHour, /*String*/inCompletePerHour) {var ic = document.getElementById("TwentyFourHourChart"); //页面上唯一的一个div,作为图表的容器if (inCallsPerHour != null) {var inCallMax = inCallsPerHour.max(); //从传入的数组中取得数组最大值,用到了一个自己写的array的扩展方法max()var topOffsetPercent = 180 / inCallMax; //计算以最大值为基准的每像素显示比例,百分比for (var i = 0; i < inCallsPerHour.length; i++) { //循环24小时数据var sumrow = document.createElement("div"); //创建一个div元素sumrowsumrow.id = "sumrow_" + i + "_" + inCallsPerHour[i];//为刚刚创建的div元素sumrow添加id 属性(这里把时间,呼入电话总量数据写入到id中,后面显示这些信息的时候有用)sumrow.setAttribute("class", "incallchartsumrow"); //添加属性//设置元素的left(每个div宽度为10px,那么第i个元素就应该是i*10,因为还有一列10像素的组装图,所以还要*2,加上距离左侧40px边距+ 每2个柱状图为一组之间的间隔空隙6px,所以得出如下,)sumrow.style.left = (i * 10) * 2 + (i * 6) + 40 + "px";//高度的计算,Math.round四舍五入取值,百分比的基数乘以当前时段的呼入数据,为统计图的高度sumrow.style.height = Math.round(topOffsetPercent * inCallsPerHour[i]) + "px";sumrow.style.width = "10px"; //宽度10px像素sumrow.style.position = "absolute"; //绝对定位sumrow.style.overflow = "hidden"; //超出部分隐藏sumrow.style.background = "none repeat scroll 0 0 #1280ef"; //背景颜色sumrow.style.display = "block"; //块状显示//距离容器上边框的距离,图表高度200 减去当前这个柱状图图表高度sumrow.style.top = 200 - Math.round(topOffsetPercent * inCallsPerHour[i]) + "px";ic.appendChild(sumrow); //将创建的sumcow元素添加到ic容器中去var timerow = document.createElement("div");timerow.id = "timerow_" + i;timerow.setAttribute("class", "callnum");timerow.style.left = (10 * i) * 2 + (i * 6) + 40 + "px";timerow.style.width = "10px";timerow.style.position = "absolute";timerow.style.top = "205px";timerow.innerHTML = '<span style="font-size:12px; color:#666666;"> ' + i + '</span>';ic.appendChild(timerow);var cptrow = document.createElement("div");cptrow.id = "cptrow_" + i + "_" + inCompletePerHour[i];cptrow.setAttribute("class", "incallchartsumrow");cptrow.style.width = "10px";cptrow.style.height = Math.round(topOffsetPercent * inCompletePerHour[i]) + "px";cptrow.style.position = "absolute";cptrow.style.background = "none repeat scroll 0 0 #92be0f";cptrow.style.left = (i * 10) * 2 + 10 + (i * 6) + 40 + "px";cptrow.style.display = "block";cptrow.style.top = 200 - Math.round(topOffsetPercent * inCompletePerHour[i]) + "px";ic.appendChild(cptrow);}//绘制标尺线for (var i = 0; i < 5; i++) {var tity = document.createElement("div");tity.setAttribute("class", "tity");tity.style.width = "30px";tity.style.position = "absolute";tity.style.top = (36 * i) + (20 - 6) + "px";tity.style.left = "15px";tity.innerHTML = '<span style="font-size:12px; color:#666666;"> ' + Math.round(inCallMax - (inCallMax / 5) * i) + '</span>';ic.appendChild(tity);var liney = document.createElement("div");liney.setAttribute("style", "width:620px; left:40px; border-top:1px dotted #B9B9B9; height:1px; line-height:1px; display:block; overflow:hidden; position:absolute; ");liney.style.top = (36 * i) + 20 + "px";ic.appendChild(liney);}} else {icArea.innerHTML = '<div style="color:#0066cc; font-size:12px; margin:20px 0 0 80px;">暂无统计数据</div>';}}//鼠标提示显示24小时实时>》呼入《<监控的详细数据function toShowTipMessage() {var nodes = document.getElementById("TwentyFourHourChart").getElementsByTagName("div");for (var i = 0; i < nodes.length; i++) {nodes[i].onmouseover = function () {var temp = this.id.split("_");var type = temp[0];var hour = temp[1];var times = temp[2];var tipMessage = "";var tip = document.createElement("div");tip.id = "TipMessage";tip.style.position = "absolute";tip.style.top = (parseInt(document.getElementById(this.id).style.top.replace("px", "")) - 20) + "px";tip.style.left = document.getElementById(this.id).style.left;if (type == "sumrow") {tipMessage = "今日" + hour + "时呼入" + times;} else if (type == "cptrow") {tipMessage = "今日" + hour + "时已接" + times;}tip.innerHTML = '<span style="font-size:12px; display:block; height:20px; background-color:#ffffff; padding:0px 2px; line-height:20px;">' + tipMessage + '</span>'; document.getElementById("TwentyFourHourChart").appendChild(tip);}nodes[i].onmouseout = function () {var tip = document.getElementById("TipMessage");document.getElementById("TwentyFourHourChart").removeChild(tip);}}}</script></head><body><!-- 下面这个div consuming_time 是为了显示左上角,绘制图表耗时显示之用,在实际使用中午用处--><div id="consuming_time"></div><div id="TwentyFourHourChart"></div></body></html>。
ASP NET MVC 中使用MsChart制作图 MVC 中使用MsChart制作图表(附实例)000微软新发布的图表控件MSChart,依赖于.NET Framework3.5 sp1的环境,制作出的图表非常漂亮。
同时,支持webfrom,winform,MVC。
本文主要介绍在ASP .NET MVC 下如何使用MSCHART制作图表。
1.下面简单列举一下MSCHART的部分图表类型2维堆积饼状图2维面积图2维气泡图2维线性图二维柱状图三维饼状图三维面积图三维线性图2. 在 MVC 框架下,如何使用MSCHART.首先看效果柱状图饼状图下面介绍使用MsChart制作图表实现的步骤:首先修改web.config 1. 将控件的命名空间加到("<system.web><pages><controls>" ) : <add tagPrefix="asp" namespace="System.Web.UI.DataVisualization.Chartin g"assembly="System.Web.DataVisualization,Version=3.5 .0.0,Culture=neutral, PublicKeyToken=31bf3856ad364e35"/> 2. 添加一个httpHandler ("<httpHandlers>"下面) :<add path="ChartImg.axd" verb="GET,HEAD"type="System.Web.UI.DataVisualization.Charting.Cha rtHttpHandler,System.Web.DataVisualization, Version=3.5.0.0, Culture=neutral, PublicKeyToken=31bf3856ad364e35" validate="false"/>3. 然后根据自己的需要,绘制不同的图表。
在 Web应用程序中用OWC动态绘制图表
丁俊英;庄小兵
【期刊名称】《福建电脑》
【年(卷),期】2007(000)003
【摘要】动态电子商务是电子商务发展的目标,而Web服务是其核心技
术.OWC(Microsoft Office Web Components)是一个组件对象模型(COM)控件集合,用于在网上发布电子表格、图表和数据库以及在网上查看已发布的组件和"数据访问页".本文介绍了在 Web应用程序开发中,如何利用OWC动态绘制图表.
【总页数】2页(P196,200)
【作者】丁俊英;庄小兵
【作者单位】湖北城市建设职业技术学院,湖北,武汉,430070;湖北城市建设职业技术学院,湖北,武汉,430070
【正文语种】中文
【中图分类】TP3
【相关文献】
中用OWC10及XML技术实现各种动态统计图的方法研究 [J], 隆小光
2.一种基于OWC在Web页动态绘制图表的方法 [J], 林永兴;许小燕
3.在 Web应用程序中用OWC动态绘制图表 [J], 张能立;欧阳毅
4.基于和OWC组件的Web图表实现 [J], 李志云
5.基于ASP.NET和OWC组件的Web图表实现 [J], 李志云
因版权原因,仅展示原文概要,查看原文内容请购买。
中⽣成饼状与柱状图实例本⽂实例讲述了中⽣成饼状与柱状图的实现⽅法。
分享给⼤家供⼤家参考。
具体⽅法如下:复制代码代码如下:using System;using System.Collections.Generic;using System.Text;////using System.Data;//using System.Web.UI.WebControls;//using System.Drawing;using System.Drawing.Imaging;namespace Tools{public static class OWCImageHelp{/// <summary>/// 动态的⽣成柱状图和饼状图/// </summary>/// <param name="arrValueNames">⾏坐标要显⽰的字段</param>/// <param name="arrValues">纵坐标要显⽰的数字</param>/// <param name="title">标题</param>public static void GetZBImage(string[] arrValueNames, int[] arrValues, string title){Bitmap objBitMap = new Bitmap(650, 300);Graphics objGraphics;objGraphics = Graphics.FromImage(objBitMap);objGraphics.Clear(Color.White);//int[] arrValues = { 40000, 32000, 24000, 30000, 36000, 28000 };//string[] arrValueNames = new string[] { "第⼀次", "第⼆次", "第三次", "第四次", "第五次", "第六次" };objGraphics.DrawString(title, new System.Drawing.Font("宋体", 16), Brushes.Blue, new PointF(5, 5));PointF symbolLeg = new PointF(335, 20);PointF descLeg = new PointF(360, 16);//画出说明部分的图形for (int i = 0; i < arrValueNames.Length; i++){objGraphics.FillRectangle(new SolidBrush(GetColor(i)), symbolLeg.X, symbolLeg.Y, 20, 10);objGraphics.DrawRectangle(Pens.Black, symbolLeg.X, symbolLeg.Y, 20, 10);objGraphics.DrawString(arrValueNames[i].ToString(), new System.Drawing.Font("宋体", 10), Brushes.Black, descLeg);symbolLeg.Y += 15;descLeg.Y += 15;}float TotalValues = 0;for (int i = 0; i <= arrValues.Length - 1; i++){TotalValues += arrValues[i];}//绘出矩形图。
ASP导出到Excel代码一、使用OWC什么是OWC?OWC是Office Web Compent的缩写,即Microsoft的Office Web组件,它为在Web中绘制图形提供了灵活的同时也是最基本的机制。
在一个intranet环境中,如果可以假设客户机上存在特定的浏览器和一些功能强大的软件(如IE5和Office 2000),那么就有能力利用Office Web组件提供一个交互式图形开发环境。
这种模式下,客户端工作站将在整个任务中分担很大的比重。
<%Option ExplicitClass ExcelGenPrivate objSpreadsheetPrivate iColOffsetPrivate iRowOffsetSub Class_Initialize()Set objSpreadsheet = Server.CreateObject("OWC.Spreadsheet")iRowOffset = 2iColOffset = 2End SubSub Class_Terminate()Set objSpreadsheet = Nothing "Clean upEnd SubPublic Property Let ColumnOffset(iColOff)If iColOff >0 theniColOffset = iColOffElseiColOffset = 2End IfEnd PropertyPublic Property Let RowOffset(iRowOff)If iRowOff >0 theniRowOffset = iRowOffElseiRowOffset = 2End IfEnd Property Sub GenerateWorksheet(objRS)"Populates the Excel worksheet based on a Recordset"s contents"Start by displaying the titlesIf objRS.EOF then Exit SubDim objField, iCol, iRowiCol = iColOffsetiRow = iRowOffsetFor Each objField in objRS.FieldsobjSpreadsheet.Cells(iRow, iCol).V alue = objSpreadsheet.Columns(iCol).AutoFitColumns"设置Excel表里的字体objSpreadsheet.Cells(iRow, iCol).Font.Bold = TrueobjSpreadsheet.Cells(iRow, iCol).Font.Italic = FalseobjSpreadsheet.Cells(iRow, iCol).Font.Size = 10objSpreadsheet.Cells(iRow, iCol).Halignment = 2 "居中iCol = iCol + 1Next "objField"Display all of the dataDo While Not objRS.EOFiRow = iRow + 1iCol = iColOffsetFor Each objField in objRS.FieldsIf IsNull(objField.V alue) thenobjSpreadsheet.Cells(iRow, iCol).V alue = ""ElseobjSpreadsheet.Cells(iRow, iCol).V alue = objField.V alueobjSpreadsheet.Columns(iCol).AutoFitColumnsobjSpreadsheet.Cells(iRow, iCol).Font.Bold = FalseobjSpreadsheet.Cells(iRow, iCol).Font.Italic = FalseobjSpreadsheet.Cells(iRow, iCol).Font.Size = 10End IfiCol = iCol + 1Next "objFieldobjRS.MoveNextLoopEnd Sub Function SaveWorksheet(strFileName)"Save the worksheet to a specified filenameOn Error Resume NextCall objSpreadsheet.ActiveSheet.Export(strFileName, 0)SaveWorksheet = (Err.Number = 0)End FunctionEnd ClassDim objRSSet objRS = Server.CreateObject("ADODB.Recordset")objRS.Open "SELECT * FROM xxxx", "Provider=SQLOLEDB.1;Persist Security Info=True;User ID=xxxx;Password=xxxx;Initial Catalog=xxxx;Data source=xxxx;" Dim SaveNameSaveName = Request.Cookies("savename")("name")Dim objExcelDim ExcelPathExcelPath = "Excel\" & SaveName & ".xls"Set objExcel = New ExcelGenobjExcel.RowOffset = 1objExcel.ColumnOffset = 1objExcel.GenerateWorksheet(objRS)If objExcel.SaveWorksheet(Server.MapPath(ExcelPath)) then"Response.Write "<html><body bgcolor="gainsboro" text="#000000">已保存为Excel文件. <a href="" & server.URLEncode(ExcelPath) & "">下载</a>"ElseResponse.Write "在保存过程中有错误!"End IfSet objExcel = NothingobjRS.CloseSet objRS = Nothing%>二、用Excel的Application组件在客户端导出到Excel或Word注意:两个函数中的“data“是网页中要导出的table的id<input type="hidden" name="out_word" onclick="vbscript:buildDoc" value="导出到word" class="notPrint"><input type="hidden" name="out_excel" onclick="AutomateExcel();" value="导出到excel" class="notPrint">导出到Excel代码<SCRIPT LANGUAGE="javascript"><!--function AutomateExcel(){// Start Excel and get Application object.var oXL = new ActiveXObject("Excel.Application");// Get a new workbook.var oWB = oXL.Workbooks.Add();var oSheet = oWB.ActiveSheet;var table = document.all.data;var hang = table.rows.length;var lie = table.rows(0).cells.length;// Add table headers going cell by cell.for (i=0;i<hang;i++){for (j=0;j<lie;j++){oSheet.Cells(i+1,j+1).value = table.rows(i).cells(j).innerText;}}oXL.Visible = true;erControl = true;}//--></SCRIPT>导出到Word代码<script language="vbscript">Sub buildDocset table = document.all.datarow = table.rows.lengthcolumn = table.rows(1).cells.lengthSet objWordDoc = CreateObject("Word.Document")objWordDoc.Application.Documents.Add theTemplate, FalseobjWordDoc.Application.Visible=TrueDim theArray(20,10000)for i=0 to row-1for j=0 to column-1theArray(j+1,i+1) = table.rows(i).cells(j).innerTEXTnextnextobjWordDoc.Application.ActiveDocument.Paragraphs.Add.Range.InsertBefore("综合查询结果集") //显示表格标题objWordDoc.Application.ActiveDocument.Paragraphs.Add.Range.InsertBefore("")Set rngPara = objWordDoc.Application.ActiveDocument.Paragraphs(1).RangeWith rngPara.Bold = True //将标题设为粗体.ParagraphFormat.Alignment = 1 //将标题居中 = "隶书" //设定标题字体.Font.Size = 18 //设定标题字体大小End WithSet rngCurrent = objWordDoc.Application.ActiveDocument.Paragraphs(3).RangeSet tabCurrent = ObjWordDoc.Application.ActiveDocument.Tables.Add(rngCurrent,row,column) for i = 1 to columnobjWordDoc.Application.ActiveDocument.Tables(1).Rows(1).Cells(i).Range.InsertAfter theArray(i,1)objWordDoc.Application.ActiveDocument.Tables(1).Rows(1).Cells(i).Range.ParagraphFormat.ali gnment=1nextFor i =1 to columnFor j = 2 to rowobjWordDoc.Application.ActiveDocument.Tables(1).Rows(j).Cells(i).Range.InsertAfter theArray(i,j)objWordDoc.Application.ActiveDocument.Tables(1).Rows(j).Cells(i).Range.ParagraphFormat.ali gnment=1NextNextEnd Sub</SCRIPT>三、直接在IE中打开,再存为EXCEL文件把读出的数据用<table>格式,在网页中显示出来,同时,加上下一句即可把EXCEL表在客客户端显示。
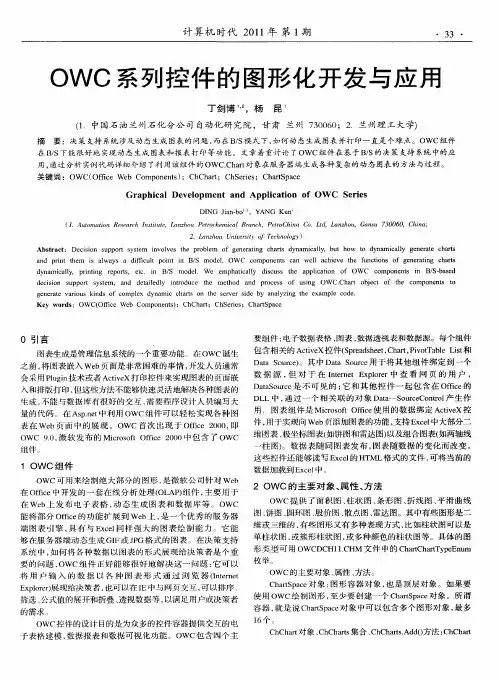
用OWC组件绘制基于Web的油藏动态分析图件[摘要]在使用asp或进行web开发中,经常需要将各种统计数据或数据库以图形的方式表达出来。
如果是绘制简单的直线或柱状图可以采用画表格或缩放特定的gif图象的高度和宽度来实现,但如果要绘制一些复杂的曲线就比较困难了。
本文通过对office自带的owc(microsoft office web compoent)控件的研究和认识实现了复杂曲线的绘制,并将这种方法绘制了鄯善油田常用的几类油藏动态分析图件。
[关键词]绘图 asp owc 控件中图分类号:te19 文献标识码:a 文章编号:1009-914x(2013)10-0075-011、关于owc组件owc(microsoft office web components)是 microsoft office 使用的数据绑定 activex 控件,用于向 web 页添加图表功能。
owc 支持microsoft excel 2000中大部分的二维图表(如折线图、柱形图、股价图等)和极坐标图表(如饼图和雷达图),并支持组合图表,如两轴线-柱图,数据表会随同图表发布,图表随着数据的变化而改变。
owc能将处理结果做为标准gif输出并下载到浏览器中显示2、owc图表对象区工作模型在右图中chartspace代表一个图表工作区集合,它就是顶层的图表容器;一个图表工作区可以设置很多属性例如border(边界)属性、interior(填充)属性、wcdatasource(数据源)属性等;每个图表都有一个wccharts对象代表,在创建了一个图表后可以设置该图表的wcaxies(坐标)属性、wcfont(字体属性)等。
owc 详细的方法和属性介绍请读者参照microsoft office的有关帮助文件。
3、owc在开发数据库中的应用3.1 安装owc组件尽管owc的安装过程很简单,只需要一个正版授权的office 2000(或以上版本),然后在web服务器上运行setup程序。
ASP中利用OWC控件绘制图表在页面动态绘制图表的问题。
在asp中动态生成图表主要有2种方式,一是使用表格控制生成;另一种方式是使用office的owc控件生成图表。
本文讨论的是如何实现在ASP中用OWC控件动态生成图表图片,保存在服务器端然后发送到浏览器显示,客户端浏览器只要支持<img>标签就能显示图表,可避免直接输出动态图表到客户端时有可能带来的一系列问题。
* OWC简介
OWC是Office Web Compent的缩写,即Microsoft的Office Web组件,它为在Web中绘制图形提供了灵活的同时也是最基本的机制。
通过在ASP页面中调用OWC,我们可以轻松地绘制出各种类型的实时图表。
* 下载及安装
下载owc10.exe或owc11.exe文件安装到服务器。
也可以从office上安装。
我们需要一个正版授权的Office,然后在Web服务器上运行setup程序。
选择定制安装,在工具标题下,只选择中Web组件选项。
当然,我们也可以在Web 服务器上安装Office的完整版本,其中自然也就包含了Web组件。
接着,Setup程序顺序地完成其它工作,包括组件注册。
下面以在asp页面中生成柱状图为例,说明如何在asp页面中实现图表显示。
更多设置请参考安装完成后C:\Program Files\Common Files\Microsoft Shared\Web Components\10\2052中的帮助文档。
aspchart.asp源程序代码如下,本人调试通过。
需要注意的是生成的图片要存放服务器的文件夹下,需要这个文件夹的写权限。
<%@ Language=VBScript codepage=65001 %>
<html xmlns="/1999/xhtml">
<head>
<meta http-equiv="Content-Type" content="text/html; charset=gb2312">
<meta http-equiv="Content-Language" content="zh-cn">
<title>在ASP中用OWC控件动态生成图表显示</title>
</head>
<body>
<%
'测试数据
categories=Array("10","20","30","40")
values=Array(11,22,3,5)
'创建owc对象
set chart=Server.CreateObject("OWC10.ChartSpace")
chart.clear
set chartShow=chart.Charts.Add
set chartConst = chart.Constants'设定图表类型,图表类型有很多种,详见OWC帮助文件ChartChartTypeEnum chartShow.type=chartConst.chChartTypeLine 'chChartTypeColumnStacked/chChartTypeColumnClustered
''设定图表是否有图例(Legend)
chartShow.HasLegend=false '(显示图例)
'以下为图表标题设定
chartShow.HasTitle=true
chartShow.Title.Caption="统计表"
set fnt=chartShow.title.font
fnt.size=13
fnt.bold=true
fnt.color="blue"
chartShow.Axes(0).HasTitle=True
chartShow.Axes(0).Title.Caption="T1"
chartShow.Axes(1).HasTitle=True
chartShow.Axes(1).Title.Caption="T2"
chartShow.Axes(1).Title.font.size=10
chartShow.Axes(0).MajorUnit = 5
chartShow.Axes(0).Scaling.Maximum=20
chartShow.SetDatachartConst.chDimCategories, chartConst.chDataLiteral, categories
chartShow.SeriesCollection(0).SetDatachartConst.chDimValues, chartConst.chDataLiteral, values
chartShow.SeriesCollection(0).Interior.Color = "Red"
'chartShow.Axes(chartConst.chAxisPositionLeft).NumberFormat = "0.00%"
'chartShow.Axes(chartConst.chAxisPositionLeft).MajorUnit = 25
'chartShow.Axes(chartConst.chAxisPositionLeft).GroupingUnit=1
'chartShow.Axes(chartConst.chAxisPositionValue).Scaling.Maximum=200
'以上语句定义Y轴最大值,缺省就是根据数据的范围自动定义
With chartShow.SeriesCollection(0).DataLabelsCollection.Add
.HasValue = true
.Font.Size = 9
' .Column.Color = RGB(255, 255, 0)
End With
strChartAbsPath=Server.MapPath("temp")'将图保存到当前路径下的temp文件夹。
strChartRelPath = "temp"
strChart = ExportChartToGIF(chart, strChartAbsPath, strChartRelPath,400,300)
'*****************************
'生成图片的函数
'*****************************
Function ExportChartToGIF(objCSpace, strAbsFilePath, strRelFilePath,picHigh,picWidth)Dim strFileName
Randomize
strFileName = Timer&Rnd&".gif"
'response.writestrAbsFilePath& "/" &strFileName
objCSpace.ExportPicturestrAbsFilePath& "/" &strFileName,"gif",picHigh, picWidthExportChartToGIF = strRelFilePath&"/" &strFileName
End Function
%>
<br>
<imgsrc="<%=strChart%>" border="0" />
</body>
</html>。