HND财政预算报告范本(英文版)(pdf 8页)
- 格式:doc
- 大小:78.50 KB
- 文档页数:9
HND-财政预算OUTCOME-分析报告--你不过我从此消失!HND-财政预算OUTCOME-报告--你不过我从此消失!————————————————————————————————作者:————————————————————————————————日期:A financial analysis report for Tricol plcOutcome 3and4Class;10E6Name:Ma bodaSCN:125099297Candidate Num:22IntroductionTo operate better in financial aspect, the management of Tricol plc asked me to analyze their financial condition then make recommendations for them.FindingsPart A(ⅰ) Flex budget in line with actual activityTricol plc Flexed Budget for JuneOriginal budget FlexedbudgetActualresultsVariance2000 units 1600 units 1600 units F/A££££Direct material 80,000 64,000 61,600 2,400 F Direct labor 36,000 28,800 35,200 6,400 A Variable production overhead 4,000 3,200 3,200 0 Fixed costDepreciation 1,500 1,500 1,500 0 Rent and rates 2,500 2,5002,500 0 Administration overhead 2,000 2,000 2,200 200 A Insurance costs 2,200 2,200 2,400 200 A Total 128,200 104,200 108,600 4,400 A (ⅱ) Varianc es calculationDirect material total variance(Standard units of actual production*standard price) -(actual quantity*actual price) (4 kg*1,600*£10) -£61,600 =£2,400 (F)Rate of significance: (3.75%)Direct material usage varianceStandard price*(standard units of actual production -actual quantity)£10*[ (4kgⅹ1,600) -5,600kg]= £8,000 (F)Rate of significance (12.5%)Direct material price varianceActual quantity * (standard price -actual price)5,600kg*[£10 -(£61,600/ 5,600kg) ]= £(5,600) (A)Rate of significance: (8.75%)Direct labour total variance(Standard hours of actual production*standard rate ph) - (actual hours*actual rate ph) [ (2hrs*1,600) *£9]-£35,200=£(6,400) (A)Rate of significance: (22.22%)Direct labour efficiency varianceStandard rate ph* (standard hours of actual production -actual hours)£9*(2hrs*1,600-3,520hrs)=(2,880) (A)Rate of significance: (10%)Direct labour rate varianceActual hours*(standard rate ph – actual rate ph)3,520hrs*(£9*-£35,200/3,520hrs)= £(3,520) (A)Rate of significance: (12.22%)Total overhead varianceTotal standard overhead for actual production -total actual overheads(£18,000/12+£2,500+£2,200+£2,000)- (£1,500+£2,500+£2,200+£2,400)=£(400) (A)Rate of significance: (3.5%)(ⅲ) Report about variancesDirect material varianceThe direct material total variance can be analyzed in two aspects which are direct material volume and direct material price.For volume side, as calculated above, the budget volume is 6400kg; the actual volume is 5600kg. So there is 800kg variance which is favorable and each unit variance is 0.5kg. The likely reason causing the variance comes from three aspects. First of all, the company upgraded the production machinery recently, and new machine may use materials efficiently, so it reduced the waste of materials. Secondly, the company switched suppliers and using higher-grade materials can decrease waste of materials too. Finally, the company has concluded a higher-than-expected wage settlement for production operatives, which will maintain employees with higher skills as well as decrease turnover of employees, and it also can increase efficiency in using materials.For price aspect, the budget price is £10 per kg, and the actual price is £11per kg, it is adverse that one pound over the budget price. The company switching suppliers may cause the increase of negotiation cost. There may be a long-term relationship between Tricol plc and its old suppliers, so the suppliers may take lots of discounts to the firm. After changing suppliers, the discount may disappear. Furthermore, higher gradematerials increased unit price.Overall, the total material variance is favorable. £8,000 -£5,600=£2,400.Direct labour varianceThe direct labour total variance is composed of direct labour efficiency variance and direct labour rate variance.The budget direct labour hours are 3,200hrs and the actual labour hours are 3,520 hrs. There are more 320hrs needed than the budget, and each unit is 0.2hrs, which it isobviously adverse. The company upgrading the production machinery may need time for employees to adopt it. Also, employees need training time. The rebuild process of machinery consumed time too. In a word, the chargeable hours have increased.The budget direct laour hours rate is £9 per hour, the actual hours rate is £10 per hour. It is adverse that one pound higher than budgeted. It is possible caused by both internal and external factors. Higher-than-expected wage settlement may be internal reason for the variance, and new machinery may be needed to recruit new employees to operate the machinery, which also can increase the expense. For external factors, the changing of labour market may increase labour cost; the government legislation also can increase the labour cost, for example minimum pay.Both direct labour efficiency and direct labour rate variances are adverse, so the direct labour total variance is adverse.Overhead varianceAs calculated above, total overhead variance is caused by administration and insurance. Each factor has £200 variance, so the total overhead variance is £400 and it is adverse. During the process of changing supplier, the company needed moreexpense on public relationship or negotiation, in addition, in order to maintain the new machinery, administration cost will be increased too. For insurance aside, the improvement of machinery will need more insurance fees to cover, which also contributes to the increase of insurance fee of new employees.Part BSelection and application of two investment appraisal techniquesAs the company is keen to recoup the cost of the investment within five years, I will choose Payback period and Net Present Value to help me complete the appraisal.In order to fulfill the appraisal easily, there are some assumptions listed below should be considered before the appraisal.⑴ All revenue and inflow are assumed cash flow⑵ All investment cost incurred in year 0⑶ No uncertainty is considered⑷ Do not consider inflation and taxation⑸ Market rate of return is expected rate of return⑹ Rate of return is varying along with timeTricol plc Payback period for project distribution armYear Net cash flow Cumulative Cash Flow££Cash Flow Year 0 (1,000,000) (1,000,000) Cash Inflow Year 1 160,000 (840,000)Year 2 160,000 (680,000)Year 3 320,000 (360,000)Year 4 320,000 (40,000)Year 5 320,000 280,000 Net Cash Benefit Year 5 280.000 Note: req uire 40,000/320,000 in year 5= 1/8*year=1.5 mothsPayback=4 years 1.5 mothsTricol plc Net Present Value for project distribution armAnnual cash flow Present valuePresent Valuefactors at 10%£££Year 0 (1,000,000) 1.000 (1,000,000) Year 1 160,000 0.909 145,440Year 2 160,000 0.826 132,160Year 3 320,000 0.751 240,320Year 4 320,000 0.683 218,560Year 5 320,000 0.621 198,720 935,200 NPV (64,800)◆Recommendation about investmentAccording to Payback Period analysis, the investment cost can be recouped in year 4 and 1.5 moths. In other words, the period is under company’s expectation. The project can be executed. However, according to Net Present Value analysis, in terms of present value, within five years, what the NPV will bring net result is net cash loss but not net cash surplus. In general, the company should consider time value and other factors, so the project should not be executed.◆Factors impact on the investment should be consid eredVarious factors will impact on result of investment. I will outline factors should be considered when the management reviewing my recommendation in financial and non-financial factors.Financial factorAs distribution arm is financial long-term beneficial project, it can be used inlong-term period and bring benefits continuous. Theinvestment cost is £1,000,000, which can be considered a large investment. So it more likely needs long period payback period. The management should focus on longer cash flows for longer period of future. On the other hand, Net Present Value in year five is (28,000) only take 2.8% percents of the investment cost, it is more likely surplus in year six. Another financial factor is source of million pounds. If it is internal source, the management mainly concentrate on opportunities cost. If it is cost of capital or cost of capital taking much weight of the source, the management must pay cost of the source firstly, the marketing rate of return likely low for the company, in addition, the management should use higher discounted cash flow.Non-financial factorThe investment must be consistence with company’s strategic plan. As Tricol is a plc, it must take social responsibility such as obeying government policy, minimizing impact on environment and minimizing impact on natives.ConclusionFor real competition is more complex and fierce, in order to make accurate decisions, management should consider more factors during the decision-making; furthermore, the management should use more tools to help them such as IRR, DCF.。
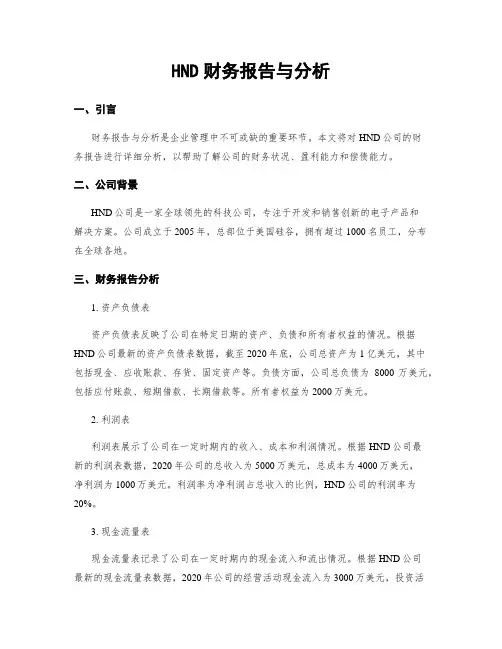
HND财务报告与分析一、引言财务报告与分析是企业管理中不可或缺的重要环节。
本文将对HND公司的财务报告进行详细分析,以帮助了解公司的财务状况、盈利能力和偿债能力。
二、公司背景HND公司是一家全球领先的科技公司,专注于开发和销售创新的电子产品和解决方案。
公司成立于2005年,总部位于美国硅谷,拥有超过1000名员工,分布在全球各地。
三、财务报告分析1. 资产负债表资产负债表反映了公司在特定日期的资产、负债和所有者权益的情况。
根据HND公司最新的资产负债表数据,截至2020年底,公司总资产为1亿美元,其中包括现金、应收账款、存货、固定资产等。
负债方面,公司总负债为8000万美元,包括应付账款、短期借款、长期借款等。
所有者权益为2000万美元。
2. 利润表利润表展示了公司在一定时期内的收入、成本和利润情况。
根据HND公司最新的利润表数据,2020年公司的总收入为5000万美元,总成本为4000万美元,净利润为1000万美元。
利润率为净利润占总收入的比例,HND公司的利润率为20%。
3. 现金流量表现金流量表记录了公司在一定时期内的现金流入和流出情况。
根据HND公司最新的现金流量表数据,2020年公司的经营活动现金流入为3000万美元,投资活动现金流出为2000万美元,筹资活动现金流入为1000万美元。
净现金流量为2000万美元。
四、财务指标分析1. 偿债能力分析偿债能力是衡量公司偿还债务能力的指标。
常用的指标有流动比率和速动比率。
流动比率=流动资产/流动负债,速动比率=(流动资产-存货)/流动负债。
根据HND公司的数据计算,流动比率为2.5,速动比率为1.5。
这说明HND公司具有较强的偿债能力,能够及时偿还债务。
2. 盈利能力分析盈利能力是衡量公司盈利能力的指标。
常用的指标有毛利率、净利率和资产收益率。
毛利率=(销售收入-销售成本)/销售收入,净利率=净利润/销售收入,资产收益率=净利润/总资产。
根据HND公司的数据计算,毛利率为40%,净利率为20%,资产收益率为10%。
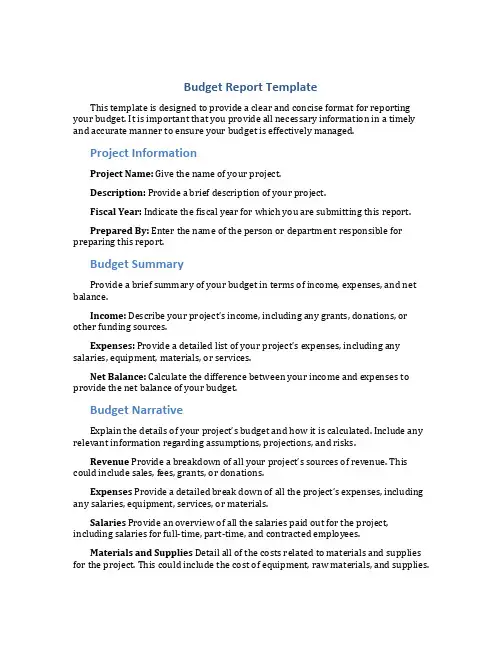
Budget Report TemplateThis template is designed to provide a clear and concise format for reporting your budget. It is important that you provide all necessary information in a timely and accurate manner to ensure your budget is effectively managed.Project InformationProject Name: Give the name of your project.Description: Provide a brief description of your project.Fiscal Year: Indicate the fiscal year for which you are submitting this report.Prepared By: Enter the name of the person or department responsible for preparing this report.Budget SummaryProvide a brief summary of your budget in terms of income, expenses, and net balance.Income:Describe your project’s income, including any grants, donations, or other funding sources.Expenses: Prov ide a detailed list of your project’s expenses, including any salaries, equipment, materials, or services.Net Balance: Calculate the difference between your income and expenses to provide the net balance of your budget.Budget NarrativeExplain the detail s of your project’s budget and how it is calculated. Include any relevant information regarding assumptions, projections, and risks.Revenue Provide a breakdown of all your project’s sources of revenue. This could include sales, fees, grants, or donations.Expenses Provide a detailed break down of all the project’s expenses, including any salaries, equipment, services, or materials.Salaries Provide an overview of all the salaries paid out for the project, including salaries for full-time, part-time, and contracted employees.Materials and Supplies Detail all of the costs related to materials and supplies for the project. This could include the cost of equipment, raw materials, and supplies.Services Provide a breakdown of all services utilized during the project, including contract services such as IT or marketing services, accounting or legal fees, and other professional services.Other Expenses Provide information on all other expenses not covered by the categories above, including travel, meals, and other reimbursable expenses.Other Revenue Include any additional revenues or funding sources that were not covered in the previous sections.Budget JustificationExplain the reasoning behind your project’s budget. This should include how the expenses relate to the project’s goals and how the revenue is expected to be generated.SummaryProvide a summary of your budget report, including any potential risks and challenges that may affect the budget. Be sure to indicate any changes that have been made since the last budget report.SignatureEnter the name of the person who prepared the report, and the date the report was prepared. Ensure that the report has been authorized and signed off by the responsible officer.。

HND-财政预算OUTCOME-报告--你不过我从此消失!————————————————————————————————作者:————————————————————————————————日期:A financial analysis report for Tricol plcOutcome 3and4Class;10E6Name:Ma bodaSCN:125099297Candidate Num:22IntroductionTo operate better in financial aspect, the management of Tricol plc asked me to analyze their financial condition then make recommendations for them.FindingsPart A(ⅰ) Flex budget in line with actual activityTricol plc Flexed Budget for JuneOriginal budget FlexedbudgetActualresultsVariance2000 units 1600 units 1600 units F/A££££Direct material 80,000 64,000 61,600 2,400 F Direct labor 36,000 28,800 35,200 6,400 A Variable production overhead 4,000 3,200 3,200 0 Fixed costDepreciation 1,500 1,500 1,500 0 Rent and rates 2,500 2,500 2,500 0 Administration overhead 2,000 2,000 2,200 200 A Insurance costs 2,200 2,200 2,400 200 A Total 128,200 104,200 108,600 4,400 A (ⅱ) Variances calculationDirect material total variance(Standard units of actual production*standard price) -(actual quantity*actual price) (4 kg*1,600*£10) -£61,600 =£2,400 (F)Rate of significance: (3.75%)Direct material usage varianceStandard price*(standard units of actual production -actual quantity)£10*[ (4kgⅹ1,600) -5,600kg]= £8,000 (F)Rate of significance (12.5%)Direct material price varianceActual quantity * (standard price -actual price)5,600kg*[£10 -(£61,600/ 5,600kg) ]= £(5,600) (A)Rate of significance: (8.75%)Direct labour total variance(Standard hours of actual production*standard rate ph) - (actual hours*actual rate ph) [ (2hrs*1,600) *£9]-£35,200=£(6,400) (A)Rate of significance: (22.22%)Direct labour efficiency varianceStandard rate ph* (standard hours of actual production -actual hours)£9*(2hrs*1,600-3,520hrs)=(2,880) (A)Rate of significance: (10%)Direct labour rate varianceActual hours*(standard rate ph – actual rate ph)3,520hrs*(£9*-£35,200/3,520hrs)= £(3,520) (A)Rate of significance: (12.22%)Total overhead varianceTotal standard overhead for actual production -total actual overheads(£18,000/12+£2,500+£2,200+£2,000)- (£1,500+£2,500+£2,200+£2,400)=£(400) (A)Rate of significance: (3.5%)(ⅲ) Report about variances✧Direct material varianceThe direct material total variance can be analyzed in two aspects which are direct material volume and direct material price.For volume side, as calculated above, the budget volume is 6400kg; the actual volume is 5600kg. So there is 800kg variance which is favorable and each unit variance is 0.5kg. The likely reason causing the variance comes from three aspects. First of all, the company upgraded the production machinery recently, and new machine may use materials efficiently, so it reduced the waste of materials. Secondly, the company switched suppliers and using higher-grade materials can decrease waste of materials too. Finally, the company has concluded a higher-than-expected wage settlement for production operatives, which will maintain employees with higher skills as well as decrease turnover of employees, and it also can increase efficiency in using materials.For price aspect, the budget price is £10 per kg, and the actual price is £11per kg, it is adverse that one pound over the budget price. The company switching suppliers may cause the increase of negotiation cost. There may be a long-term relationship between Tricol plc and its old suppliers, so the suppliers may take lots of discounts to the firm. After changing suppliers, the discount may disappear. Furthermore, higher grade materials increased unit price.Overall, the total material variance is favorable. £8,000 -£5,600=£2,400.✧Direct labour varianceThe direct labour total variance is composed of direct labour efficiency variance and direct labour rate variance.The budget direct labour hours are 3,200hrs and the actual labour hours are 3,520 hrs. There are more 320hrs needed than the budget, and each unit is 0.2hrs, which it isobviously adverse. The company upgrading the production machinery may need time for employees to adopt it. Also, employees need training time. The rebuild process of machinery consumed time too. In a word, the chargeable hours have increased.The budget direct laour hours rate is £9 per hour, the actual hours rate is £10 per hour. It is adverse that one pound higher than budgeted. It is possible caused by both internal and external factors. Higher-than-expected wage settlement may be internal reason for the variance, and new machinery may be needed to recruit new employees to operate the machinery, which also can increase the expense. For external factors, the changing of labour market may increase labour cost; the government legislation also can increase the labour cost, for example minimum pay.Both direct labour efficiency and direct labour rate variances are adverse, so the direct labour total variance is adverse.Overhead varianceAs calculated above, total overhead variance is caused by administration and insurance. Each factor has £200 variance, so the total overhead variance is £400 and it is adverse. During the process of changing supplier, the company needed more expense on public relationship or negotiation, in addition, in order to maintain the new machinery, administration cost will be increased too. For insurance aside, the improvement of machinery will need more insurance fees to cover, which also contributes to the increase of insurance fee of new employees.Part BSelection and application of two investment appraisal techniquesAs the company is keen to recoup the cost of the investment within five years, I will choose Payback period and Net Present Value to help me complete the appraisal.In order to fulfill the appraisal easily, there are some assumptions listed below should be considered before the appraisal.⑴ All revenue and inflow are assumed cash flow⑵ All investment cost incurred in year 0⑶ No uncertainty is considered⑷ Do not consider inflation and taxation⑸ Market rate of return is expected rate of return⑹ Rate of return is varying along with timeTricol plc Payback period for project distribution armYear Net cash flow Cumulative Cash Flow££Cash Flow Year 0 (1,000,000) (1,000,000) Cash Inflow Year 1 160,000 (840,000)Year 2 160,000 (680,000)Year 3 320,000 (360,000)Year 4 320,000 (40,000)Year 5 320,000 280,000 Net Cash Benefit Year 5 280.000 Note: req uire 40,000/320,000 in year 5= 1/8*year=1.5 mothsPayback=4 years 1.5 mothsTricol plc Net Present Value for project distribution armAnnual cash flow Present valuePresent Valuefactors at 10%£££Year 0 (1,000,000) 1.000 (1,000,000) Year 1 160,000 0.909 145,440Year 2 160,000 0.826 132,160Year 3 320,000 0.751 240,320Year 4 320,000 0.683 218,560Year 5 320,000 0.621 198,720 935,200 NPV (64,800)◆Recommendation about investmentAccording to Payback Period analysis, the investment cost can be recouped in year 4 and 1.5 moths. In other words, the period is under company’s expectation. The project can be executed. However, according to Net Present Value analysis, in terms of present value, within five years, what the NPV will bring net result is net cash loss but not net cash surplus. In general, the company should consider time value and other factors, so the project should not be executed.◆Factors impact on the investment should be consideredVarious factors will impact on result of investment. I will outline factors should be considered when the management reviewing my recommendation in financial and non-financial factors.✧Financial factorAs distribution arm is financial long-term beneficial project, it can be used inlong-term period and bring benefits continuous. The investment cost is £1,000,000, which can be considered a large investment. So it more likely needs long period payback period. The management should focus on longer cash flows for longer period of future. On the other hand, Net Present Value in year five is (28,000) only take 2.8% percents of the investment cost, it is more likely surplus in year six. Another financial factor is source of million pounds. If it is internal source, the management mainly concentrate on opportunities cost. If it is cost of capital or cost of capital taking much weight of the source, the management must pay cost of the source firstly, the marketing rate of return likely low for the company, in addition, the management should use higher discounted cash flow.Non-financial factorThe investment must be consistence with company’s strategic plan. As Tricol is a plc, it must take social responsibility such as obeying government policy, minimizing impact on environment and minimizing impact on natives.ConclusionFor real competition is more complex and fierce, in order to make accurate decisions, management should consider more factors during the decision-making; furthermore, the management should use more tools to help them such as IRR, DCF.。
A financial analysis report for Tricol plcOutcome 3and4Class;10E6Name:Ma bodaSCN:125099297Candidate Num:22IntroductionTo operate better in financial aspect, the management of Tricol plc asked me to analyze their financial condition then make recommendations for them.FindingsPart A(ⅰ) Flex budget in line with actual activityTricol plc Flexed Budget for JuneOriginal budget FlexedbudgetActualresultsVariance2000 units 1600 units 1600unitsF/A££££Direct material 80,000 64,000 61,600 2,400 F Direct labor 36,000 28,800 35,200 6,400 A Variable productionoverhead4,000 3,200 3,200 0 Fixed costDepreciation 1,500 1,500 1,500 0 Rent and rates 2,500 2,500 2,500 0 Administration overhead 2,000 2,000 2,200 200 A Insurance costs 2,200 2,200 2,400 200 A Total 128,200 104,200 108,600 4,400 A(ⅱ) Variances calculationDirect material total variance(Standard units of actual production*standard price) -(actualquantity*actual price)(4 kg*1,600*£10) -£61,600 =£ 2,400 (F)Rate of significance: (3.75%)Direct material usage varianceStandard price*(standard units of actual production - actual quantity) £ 10*[ (4kgⅹ1,600) -5,600kg]= £8,000 (F)Rate of significance (12.5%)Direct material price varianceActual quantity * (standard price - actual price)5,600kg*[£ 10 -(£61,600/ 5,600kg) ]= £ (5,600) (A)Rate of significance: (8.75%)Direct labour total variance(Standard hours of actual production*standard rate ph) - (actual hours*actual rate ph)[ (2hrs*1,600) *£9]-£35,200=£(6,400) (A)Rate of significance: (22.22%)Direct labour efficiency varianceStandard rate ph* (standard hours of actual production - actual hours) £9*(2hrs*1,600-3,520hrs)=(2,880) (A)Rate of significance: (10%)Direct labour rate varianceActual hours*(standard rate ph – actual rate ph)3,520hrs*(£9*-£35,200/3,520hrs)= £(3,520) (A)Rate of significance: (12.22%)Total overhead varianceTotal standard overhead for actual production - total actual overheads (£18,000/12+£2,500+£2,200+£2,000)- (£1,500+£2,500+£2,200+£2,400)=£(400) (A)Rate of significance: (3.5%)(ⅲ) Report about variancesDirect material varianceThe direct material total variance can be analyzed in two aspects which are direct material volume and direct material price.For volume side, as calculated above, the budget volume is 6400kg; the actual volume is 5600kg. So there is 800kg variance which is favorable and each unit variance is 0.5kg. The likely reason causing the variance comes from three aspects. First of all, the company upgraded the production machinery recently, and new machine may use materials efficiently, so it reduced the waste of materials. Secondly, the company switched suppliers and using higher-grade materials can decrease wasteof materials too. Finally, the company has concluded ahigher-than-expected wage settlement for production operatives, which will maintain employees with higher skills as well as decrease turnoverof employees, and it also can increase efficiency in using materials.For price aspect, the budget price is £10 per kg, and the actual priceis £11per kg, it is adverse that one pound over the budget price. The company switching suppliers may cause the increase of negotiation cost. There may be a long-term relationship between Tricol plc and its old suppliers, so the suppliers may take lots of discounts to the firm. Afterchanging suppliers, the discount may disappear. Furthermore, higher grade materials increased unit price.Overall, the total material variance is favorable. £8,000 -£5,600=£2,400.Direct labour varianceThe direct labour total variance is composed of direct labour efficiency variance and direct labour rate variance.The budget direct labour hours are 3,200hrs and the actual labour hours are 3,520 hrs. There are more 320hrs needed than the budget, and each unit is 0.2hrs, which it is obviously adverse. The company upgrading the production machinery may need time for employees to adopt it. Also, employees need training time. The rebuild process of machinery consumed time too. In a word, the chargeable hours have increased.The budget direct laour hours rate is £9 per hour, the actual hours rate is £10 per hour. It is adverse that one pound higher than budgeted. It is possible caused by both internal and external factors.Higher-than-expected wage settlement may be internal reason for the variance, and new machinery may be needed to recruit new employees to operate the machinery, which also can increase the expense. For external factors, the changing of labour market may increase labour cost; the government legislation also can increase the labour cost, for example minimum pay.Both direct labour efficiency and direct labour rate variances are adverse, so the direct labour total variance is adverse.✧Overhead varianceAs calculated above, total overhead variance is caused by administration and insurance. Each factor has £200 variance, so the total overhead variance is £400 and it is adverse. During the process of changing supplier, the company needed more expense on public relationship or negotiation, in addition, in order to maintain the new machinery, administration cost will be increased too. For insurance aside, the improvement of machinery will need more insurance fees to cover, which also contributes to the increase of insurance fee of new employees.Part B◆Selection and application of two investment appraisal techniquesAs the company is keen to recoup the cost of the investment within five years, I will choose Payback period and Net Present Value to help me complete the appraisal.In order to fulfill the appraisal easily, there are some assumptions listed below should be considered before the appraisal.⑴ All revenue and inflow are assumed cash flow⑵ All investment cost incurred in year 0⑶ No uncertainty is considered⑷ Do not consider inflation and taxation⑸ Market rate of return is expected rate of return⑹ Rate of return is varying along with timeTricol plc Payback period for project distribution armYear Net cash flow Cumulative Cash Flow££Cash Flow Year 0 (1,000,000) (1,000,000) Cash Inflow Year 1 160,000 (840,000)Year 2 160,000 (680,000)Year 3 320,000 (360,000)Year 4 320,000 (40,000)Year 5 320,000 280,000 Net Cash Benefit Year 5 280.000 Note: req uire 40,000/320,000 in year 5= 1/8*year=1.5 mothsPayback=4 years 1.5 mothsTricol plc Net Present Value for project distribution armPresent Value Annual cash flow Present valuefactors at 10%£££Year 0 (1,000,000) 1.000 (1,000,000) Year 1 160,000 0.909 145,440Year 2 160,000 0.826 132,160Year 3 320,000 0.751 240,320Year 4 320,000 0.683 218,560Year 5 320,000 0.621 198,720 935,200 NPV (64,800)◆Recommendation about investmentAccording to Payback Period analysis, the investment cost can be recouped in year 4 and 1.5 moths. In other words, the period is under company’s expectation. The project can be executed. However, according to Net Present Value analysis, in terms of present value, within five years, what the NPV will bring net result is net cash loss but not net cash surplus. In general, the company should consider time value and other factors, so the project should not be executed.◆Factors impact on the investment should be consideredVarious factors will impact on result of investment. I will outline factors should be considered when the management reviewing my recommendation in financial and non-financial factors.✧Financial factorAs distribution arm is financial long-term beneficial project, it can be used inlong-term period and bring benefits continuous. The investment cost is £1,000,000, which can be considered a large investment. So it more likely needs long period payback period. The management should focus on longer cash flows for longer period of future. On the other hand, Net Present Value in year five is (28,000) only take 2.8% percents of the investment cost, it is more likely surplus in year six. Another financial factor is source of million pounds. If it is internal source, the management mainly concentrate on opportunities cost. If it is cost of capital or cost of capital taking much weight of the source, the management must pay costof the source firstly, the marketing rate of return likely low for the company, in addition, the management should use higher discounted cash flow.Non-financial factorThe investment must be consistence with company’s strategic plan. As Tricol is a plc, it must take social responsibility such as obeying government policy, minimizing impact on environment and minimizing impact on natives.ConclusionFor real competition is more complex and fierce, in order to make accurate decisions, management should consider more factors during the decision-making; furthermore, the management should use more tools to help them such as IRR, DCF.。
Contents1.0 Introduction ...................................................................................................................... - 2 -2.0 The flexed budget ............................................................................................................. - 2 -3.0 Calculate the Materials variances, Labour variances and the Total overhead.....- 2 -3.1Direct the materials variances , labour variances and the total overhead....- 2 -3.2Variance analysis ................................................................................................... - 3 -4.0 The recommendations for management (variances) ........................................................ - 4 -5.0 Using four different methods to evaluate the financial .................................................... - 5 -5.1Identify the accounting rate of return ..................................................................... - 5 -5.2Identify the payback .............................................................................................. - 5 -5.3Identify the Net present value ................................................................................ - 5 -5.4Identify the Internal rate of return ......................................................................... - 6 -6.0 Recommendations for investment decision ...................................................................... - 6 -7.0 Conclusion ........................................................................................................................ - 7 -8.0 Appendices ....................................................................................................................... - 7 -1.0 IntroductionThis report will divided into two parts. Part A and Part B. In Part A,First of all, I will prepare a flexed budget in line with actual activity. Second, this will including the Materials variances, Labour variances and total overhead. At the same time, I will identify a minimum of one possible cause of the each variance. Finally, according to data analysis, there have been some recommendations to management of Matteck PLC. In Part B, It will have four different ways to evaluate financial performance and give recommendations for Matteck PLC. These ways are ARR ,Payback, NPV and IRR.Part A2.0 The flexed budgetFor Flex budged of Matteck PLC, we can see the Appendix 1.3.0 Calculate the Materials variances, Labour variances and the Total overhead.3.1Direct the materials variances , labour variances and the total overhead・This section shows the Appendix 2.3.2Variance analysis.Material price variance:The material price variance is £32,000(F). According to the data analysis, it is £2/kg less expensive-2-than planned. The possible reasons can be divided into three points: first, they could replace raw materials, using a lower - grade material. Second, the supplier to provide some discount for this batch of raw materials. Finally, learn from the case, the company has managed to locate new materials from an overseas. Due to the product from overseas, according to different exchange rate, the material will reduce the price.Material usage variance:The material usage variance is £30,000(A). The possible reasons include the effects of raw materials and the influence of the machine. If the company using poor quality raw materials, it may be more difficult to work. This will increase the waste materials. At the same time, the case shows that the company's new machinery can be fully used in the second week. The delay time may have caused the machine to use more materials than planned.Material total variance:The material total variance is 2,000(F). Case shows that the company's raw materials are from overseas suppliers. This will reduce some costs. Which leads to the material price variance is 32,000 (F). On the other hand, the company has introduced a new machine, the influence of machine installed time, caused some wasted of materials. This makes the material usage variance is €30000 (A). Even if The company's material total variance is 2000 (F). The company's management still should pay attention to The utilization of raw materials.Labour efficiency variance:The Labour efficiency variance is 10,000(F). The possible reasons could include the new machine to improve staff work cfYiciency. Using new machine can less labour hours. At the same lime , the case shows that the company has had to employ more highly qualified staff. They can increase theworking efficiently through the higher skill.Labour Rate Variance:The Labour rate variance is 15,000(A). Through the calculation, the labour rate is £1.50 per hour higher than original. The possible reasons is £1.50 per hour higher than planned. The cost of direct labour is adverseness for this firm.Labour Total Variance:the Labour total variance is 5,000(A). The reasons of variance, the company has introduced the newmachine, As the result the direct labor efficiency variance is favorable which is 10.000(F). On other hand, the labour rate is higher than standard labour rate. Finally, lead to the labour total variance is adverse,4.0 The recommendations for management (variances)・1.The company should be had a variety of data investigation to set up complete data system. At the same time, through the difierent variance, the company can know more about the market information.2.The company should intensify the performance monitor for statTbecause the lower performance will accelerate waste of material and then lead to the material usage is increase, the performance monitor can help the company shrink the variance.3.Management: the company can provide some motivation policies to motivate the staft' that is work hard and enhance the work enthusiastic of the staff. This can improve the staff work efficiency.Part B5.0 Using four different methods to evaluate the financial. 5.1 Identify the accounting rate of return ・ARRAverage profit= 3,300,0005=660,000Accounting rate of retum==26.4%The cases show that the company should have an accounting rate of return of at least 15%, through calculation, the ARR is 26.4%. Therefore, the data has meet company standards.5.2 Identify the payback.The company hopes to recover the cost of the investment within 4 four years. In fact, they just use 3 years 341 days, (see Appendix 3.)5.3 Identify the Net present value.The NPV method calculates the present values of cash inflows and outflows and establishes whether. Basically, NPV provides an objective for evaluating and selecting investment projects. Moreover, it takes into account required rate of return of company and then takes into account time value of money. But there are substantial660,000 2,500,000uncertainly factors in our world. For instance the inflation and deflation, the exchange rate. When the Matteck's cost of capital is 10%. The NPV is (46200). The NPV value less than 0. The company should not invest this project. ( see Appendix 4.)5.4Identify the Internal rate of return.When the present value is 5%, the internal rate of return is 9.39%. Which less than 10% of company slandard.thcrcfore,the company should not invest this project.(see Appendix 5)6.0 Recommendations for investment decision.1.According the four method, The ARR and Payback are both implement for this project, but the NPV and IRR are not implemented for this Project. In this case ,thc company should focus on the NPV and IRR.2.By calculates the net present values, it seems that the deficit, which means that the annual cash flows are not enough to allow more interest to be deducted and still repay the original investment. This investment is unworthy .3.Within five years. All the market factors are changeable. The information will have different change. And there are maybe some other situations occurred. So the Matteck PLC should not concern with the project.7.0 ConclusionThe report can help the company make the flex budget, and then by variances analysis and use the-6-four methods to evaluate the financial. Through the recommendations can help the company choose the best investment to gain the maximum profits.8.0 Appendices8.1Appendix 18.2Appendix 2-7-。
1. IntroductionThis report is about a company Tricol plc, which makes a range of furniture and kitchenware, is now considering the development of its own distribution arm. It is provided assumptions, application of pay back period and NPV, evaluation and recommendation and other factors to be considered in this report. It could has important significance for assessing the rationalization of investment.2.0 Part AThe budget and calculation is showed on AppendixThere is a company policy to apply a rate of significance of 3% for any variance analysis. And the direct material variance can be analyzed in two aspects which are direct material volume and direct material price.The direct material price variance is adverse. The company has recently switched suppliers and it is now using high-grade materials. This may make the company lose the discount offered by original suppliersDirect labour variance is adverse. Reason may be that insurance is more than the budget insurance. The new machines use may result in this kind of situation, for the same reason overhead, including installation charges, staffing fees, maintenance increase and so on.There are two aspects what are weight of the direct materials and direct material price to analysis the total variance of direct material. From the weight of the direct materials, the budget for 6400 kg weight, the actual weight for 4600 kg, and the weight of each unit sent a 0.5 kg. The reasons are: the company changed suppliers,use the advanced materials to reduce the material waste; the production of equipment get upgrades, improve the production efficiency; Raised salary for employees to keep the higher technology and reduce the error, improve the efficiency in the use of materialsOverhead variance: total overhead variance is caused by administration and insurance. Each factor has £200 variance, so the total overhead variance is £400 and it is adverse. In addition, on side of insurance, Improving mechanical efficiency will need to pay more insurance cost, the employee of operate these equipment insurance costs also will be increasedRecommendationThere are some Suggestions can make the situation improved. The first, Ensure the quality, the price is cheap, but use the material. Secondly, The Company can establish policies to control administrative costs. They can try to use material price discount. The variance of labor, for enterprise is a must for the long-term cost of place, and wage increase, and may continue to increase, but Labour had reduced rate. Also has some advice. The company can provide the plan of the training, in order to improve production efficiency. Can also make employees responsible for the machine can be used a longer time.2.1 Part BAssumptionsThere are some views in the use of these data.The effects of the tax and inflation are neglected. Second, a given market returns will not change.●In the initial outflows of cash flow is satisfied, the time value of money beignored, not including interest is for the initial capital investment.●The expected return on the investment, here is to point to deduct the net cash flowfrom all the relevant costs.●Uncertainty does not exist●All the market factors are stableNet Present Value (NPV): The NPV method calculates the present values of cash inflows and outflows and establishes whether, in total, the present value of cash inflows is greater than the present value of cash outflows.Calculation of net present value, It is showed by Appendix.Payback: Those ways of in order to restore the original investment cost methods have to investment and project evaluation have many years, in order to received effect in shortest time. (1) year 0 means now (2) year 1 means at the end of 12 months from now (3) year 2 at the end of 2 years from now.Calculation of the payback period method, It is showed by Appendix.AnalyzeThe analysis of two investment appraisal techniquesDisadvantages of the payback method·It ignores cash flows after initial outflow has been met·It ignores risk·It ignores time value of money·It ignores the fact that benefits from different projects may accrue at an uneven rate ·No allowance is made for interest on the initial capital investment.Advantages of the NPV method·Provides an objective basis for evaluating and selecting investment projects ·Takes account of both magnitude and timing of expected cash flows in each period of a project’s lifeInvestors can not use a single formula to calculate the rate of return, they should consider the value of the time.In view of the data calculated above, payback will take four years and one-and-half month to complete, therefore, it seems to be reasonable to accept and invest this kind of project. However, in other method, it is impossible to fulfill a requirement of a 10% return. The actual rate of return must be less than 10%.Taking this two methods into consideration, firstly, net present value methods is more accurate than payback period method, secondly, although it cannot realize the expected return in 10% in the first 5 years, mainly basing on growing slowly and low return at beginning, it may bring a higher revenue and positive cash inflow in the future years.Personally, I think we can accept the new project for a period time. RecommendationThere are some Suggestions to continue to do investment company. We can from the financial factor analysis and the financial factors. The first. Form the economic factors. There are some Suggestions. The company must make sure that they have enough money to complete this investment. The company also need to consider budget control and the ability to solve problems. And then sure need to move on this investment. The company should consider whether to profit the most for the companylong-term interests. Then from non-financial aspects. Focus on the information about the change in the current social economic, political and legal. Whether can increase employment guidance. Clearly know people are willing to pay is suitable for this investment. Finally, the investment is in accordance with the company's strategy.3. ConclusionsThe company's consultants, this report can help the company bend of the budget and variance and use these two kinds of methods are analyzed, and help the company choose investment investment method. The company will make much profit.4. AppendixTricol Plc Flexed budgedBased on the all information about “Zupper” expendable table, I draw a table as following:The calculation of the variances and the variance rate1.Direct material total variance(standard units of actual production×standard price) –(actual quantity×actual price)[(4kg×1600)×£10] –£61600= £64000 –£61600=£2400 ( F )The rate for direct material total variances is £ 2,400/£ 64,000×100%=3.75%2.Direct material price varianceactual quantity×( standard price-actual price)=5600kg×( £10- £11)=5600kg×£1=5600 (A)The rate of direct material price variance is £ 5,600/£ 64,000×100%=8.75%3.Direct material usage variancestandard price×(standard units of actual production-actual units)=£10×(4kg×1600-5600kg)=£10×800kg=£8000 (F)The rate of direct material usage variance is £ 8,000/£ 64,000×100%=12.5%Note: When adding the price and usage variances the result must equal the total variance. Therefore, £5600(A) (price)+£8000(F) (usage) = £2400(F) (total).4.Direct labour total variance( standard hours of actual production×standard rate ph) -(actual hours×actual rate ph)[(2h×1600)×£9] -(3520h×£10)=(3200h×£9)-£35200=£28800 -£35200=£6400(A)The rate of diretc labour variance is 6400/28800×100%=22.2%5.Direct labour rate varianceactual hours×( standard rate ph-actual rate ph)3520h×(£9-£10)=3520h×£1=£3520(A)The rate of direct labour rate variance is £ 3,520/£ 28,800×100%=12.2%6.Direct labour efficiency variancestandard rate ph ×( standard hours of actual production-actual hours)£9×[2h×1600-3520h]=£9×(3200h-3520h)=£9×320h=£2880(A)The rate of direct labour efficiency variance is £ 2,880/£ 28,000×100%=10% Note: When adding rate and efficiency variances the result must equal the totalvariance. Therefore, £3520(A) (rate)+£2880(A) (efficiency) = £6400(A) (total).7.Overhead total variance(standard insurance cost-actual insurance cost)+(standard administration overheads-actual administration overheads)(£2200-£2400)+(£2000-£2200)=£200(A)+£200(A)=£400(A)The rate of overhead total variance is £ 400/£ 4,200×100%=9.52%Calculation of net present value at 10%Payback period method:In Year 5 the cash inflows for the full year are £320,000 but only £40,000 is required to recoup the initial investment. This is therefore reached in 1.5 months.Payback= 40000/320000*Year 5= 1/8 Year 5= 4 year 1.5monthsPayback will take 4 year 1.5months.。

Beijing Institute of Technology SQA HND AssignmentTable of contentsIntroduction (3)Part A (3)Part B (5)Conclusion (6)Reference (6)Appendix (7)IntroductionThis report is for Tricol plc which makes a range of furniture and kitchenware. One of the most popular products is the Zupper expandable table. It will do some variance analysis in the Part A. It will includes direct material usage, direct material price, direct labor rate direct, labor efficiency and total overhead. Some suggestions will be given following the analysis. In Part B, there will take two methods to analyze the project that is whether to accept. It will discuss the advantages and disadvantages of the two methods, finding out the best methods that is suit for the company. At last, some other factors such as environment, technology, legal, and customers will be discussed for the managers. Furthermore, some needed appendixes will be followed the report.Part AVariance analysis and reportingOnce the variances have been calculated, they should be analyzed to find what the problems are. The criterion that the rate of variance needs to be analyzed is more than 3%, and according to the Appendix 3, as a result, it needs to analyze all the variances.Direct material usage:According to the Appendix 2, the variance of direct material usage is favorable, which is about £8000 and the rate of direct material usage variance reaches 12.5%. This is a high level and it may due to the two reasons such as higher quality materials and higher grade workforce. The company chooses the higher quality materials could reduce the spoilages during the producing. And it could reduce the inferiors in the finish products. To reduce the materials is as a result. Giving the labor higher workforce may reduce the mistakes by labors during the producing that will reduce the rejection rate and save the materials.Direct material priceAccording to the Appendix 2, the variance of direct material price is adverse, which is about £5600 and at the rate of 8.75%. There may be two reasons for this result. One is higher quality materials. Because of the higher quality, this kind of materials will be more expensive than other low quality materials. It will increase the costs of the materials. Also, the loss of discounts will be another reason to make the material price increase. Tricol may cooperate with a new supplier; company may not get the discounts received because of the low reliance.Direct labor rateAccording to the Appendix 2, the variance of direct labor rate is £3520 in adverse, and at the rate of 12.2%. There may be also two reasons for this result. One is salary increase award. Company made the labor rate become £10 per hour, which is higher than standard labor rate for £1 per hour. This could encourage the staffs to work hard and improve their efficiency and reduce the mistakes. Another reason may be the unplanned overtime. For this situation, company may pay more wages to the staffs for their overtime work.Direct labor efficiencyAccording to the Appendix 2, the variance of direct labor efficiency is adverse with £2880 in the rate of 10%. There are two reasons for this. One is may be the low morale. Because the company let its labors to work overtime for the unplanned goals and the high workforce will make the staffs unsatisfied. The second reason is that there may be shortage of skilled labor, which results in more labor hours and labors to finish the goals.Total overheadAccording to the Appendix 2, the variance of total overhead is £400 in adverse, and at the rate of 3.51%. It may due to the higher insurance, and higher administration. Company may spend too much on the insurance of its staffs. Some wages of the managers may be higher.Recommendation for the managementThe direct material usage is a good sign for the company. Company should continue to reduce the spoilages during its producing. However, the price of the materials are little higher. It is not a good sign. Company may purchase the lower quality materials from the new supplier. And try the best to get some discount received. The price of materials should be lower than before but quality could not be too lower. This action will reduce the costs in the materials and insurance the low rejection rate. According to the labor, company should not raise the employees’wages easily to motivate the staffs and it should not do much the unplanned overtime. Because of the much unplanned overtime, the staffs may against this action and become morale. So, company should reduce the unplanned overtime and use the other ways to encourage its staffs often. However, in order to finish the unplanned overtime, the company may hire some new employees to work. But there is shortage of skilled labor. Company should give them some training to improve their skills. The total overhead is not very good for the company. The insurance and administration may be higher for the company. Company should go to the greatest extent of reducing the costs in the insurance. It may be possible for company get some discount allowed form theinsurance company. And control the spending in the managing.Part BAssumptionThe premise of payback period methodsIdentify all of the costs of initial investment. Assume that they will be paid now. Find the cash inflow for each project. Add up cash flows each year until cost of project covered. Pick the project with the shortest payback period. If the payback period is only one year then it should be compared with an internal figureThe premise of discounted cash flow techniqueUncertainty does not exist. There is no inflation. The appropriate discount rate to use is known, to avoid unnecessary calculations. When undertaking DCF questions, the discount rates have been computed for you, and are given in the discount tables .Unlimited funds can be raised at a competitive rate.Analyzing payback period methodAccording to the payback period method, the original capital that the company invest is £1,000,000 and there are 5 years for the company to get the return that is the budgeted payback period. According to the program, 4 years and 1.5 months that the company will get its all investments. At the last year, company will get the return about £280,000. As a result, based on the period method, the project will be profitable and is worth to invest.Analyzing discounted cash flow techniqueIf the company uses the discounted cash flow technique, according to the peogram, the investment is £1,000,000, and the net present value is 10%. The budgeted payback period is 5 years. After 5 years, the NPV for the project will be £-64,800. It shows that the return is less than the investment. It will be the loss of £64,800 to invest this project. So this project will not be profitable and is not worth to invest.RecommendationAccording to the two methods, it is not difficult to find that the company would better to choose the payback period method. The company chooses payback period method could get the profit of £280,000 and less 5 years could get the all investment. And for the discounted cash flow technique, it will cost 5 years and loss £64,800 at last of the project. So, based on the profit, the company would better to choose thepayback period method.Consideration of other factorsFirst, the environment is one factor that the managers should to consider. Tricol makes a range of furniture and kitchenware. It may make pollute during the producing. If the company does not pay attention to the environment, it may get some fine.Technology is one factor that the managers should to consider about. If the company uses the new technology and equipment in the project, it could improve its productivity. And improve its profitability.The company should also think about the legal. The company should insure that the project is not against the legal. If not, company may be punished by the government and even be banded.At last, company should consider its customers. It should consider that its products, making by the project, will be attracted by the customers. If no customers like it, they may get little profit for the project.ConclusionAs an advisor for the company, this report can help the company make the flex budget and variances and use the two methods to analysis the investment and help the company choose the best method. This will help company make much profit. ReferenceSQA, preparing Financial Forecast (version 3),China Modern Economic Publishing House, 2004./definition/direct-labor-efficiency-variance.html/wiki/Payback_period/terms/d/dcf.aspThe calculation of the variances would be:1.Direct material total variance(standard units of actual production × standard price) – (actual quantity × actual price)[(4kg × 1600) ×£10]–£61600=£64000–£61600=£2400 ( F )2.Direct material usage variancestandard price × (standard units of actual production-actual units)=£10 × (4kg × 1600-5600kg)=£10 × 800kg=£8000 (F)3.Direct material price varianceactual quantity × (standard price-actual price)=5600kg × (£10-£11)=5600kg ×£1=£5600 (A)4.Direct labor total variance(standard hours of actual production × standard rate ph)-(actual hours × actual rate ph)[(2h×1600) ×£9]-(3520h ×£10)=(3200h ×£9)-£35200=£28800-£35200=£6400(A)5.Direct labor rate varianceactual hours × (standard rate ph-actual rate ph)3520h × (£9-£10)=3520h ×£1=£3520(A)6.Direct labor efficiency variancestandard rate ph × (standard hours of actual production-actual hours)£9×[2h×1600-3520h]=£9×(3200h-3520h)=£9×320h=£2880(A)7.Total overhead variance(budgeted variable overhead + budgeted fixed overhead-(actual variable overhead + actual fixed overhead)(£3200+£8200)+(£3200+£8600)=£11400(A)-£11800(A)=£400(A)Appendix 3Variance ratio:The rate for direct material total variances is £ 2400/£ 64000×100%=3.75% The rate of direct material usage variance is £ 8000/£ 64000×100%=12.5% The rate of direct material price variance is £ 5600/£ 64000×100%=8.75% The rate of direct labor variance is 6400/28800×100%=22.2%The rate of direct labor rate variance is £ 3520/£ 28800×100%=12.2%The rate of direct labor efficiency variance is £ 2880/£ 28000×100%=10% The rate of total overhead variance is £ 400/(£ 3200+8600)×100%=3.51%Payback Period:Discounted Cash Flow:。
Budget Report Template for English Writing IntroductionBudget reports are essential for businesses, organizations and projects to keep track of their expenses and revenue. As a writer, it is important to be able to create a budget report in English that is clear and concise. In this document, we will provide a template for a budget report in English writing.Budget Report TemplateIntroductionThe introduction section should provide a brief overview of the budget report. It should include the name of the project/organization/business, the period covered by the budget report, and the purpose of the report.RevenueThe revenue section should list all sources of income for the period covered by the budget report. This can include sales revenue, grants, donations, and other sources of income. It should also include any changes in revenue from the previous period if applicable.ExpensesThe expenses section should list all expenses incurred during the period covered by the budget report. This can include salaries, rent, utilities, marketing costs, and any other expenses. It should also include any changes in expenses from the previous period if applicable.Profit/LossThe profit/loss section should calculate the difference between revenue and expenses for the period covered by the budget report. If the result is a positive number, it represents profit, and if it is a negative number, it represents a loss.ConclusionThe conclusion section should summarize the key findings of the budget report. It should highlight any areas where revenue and expenses have changed significantly from the previous period, and any areas where adjustments may need to be made in the future.ConclusionWriting a budget report in English can seem daunting, but with this template, you can create a clear and concise budget report for your organization or project. Remember to provide an overview of the period covered by the report, list all sources of income and expenses, calculate the profit/loss, and summarize the key findings. By following these steps, you can create an effective budget report that is easy to understand and use.。
第1篇Executive SummaryThis document provides an in-depth analysis of the financial report for [Company Name], covering the period from [Start Date] to [End Date]. The analysis includes an overview of the company’s financial performance, liquidity, solvency, profitability, and investment activities. It also identifies key strengths, weaknesses, and areas of concern that could impact the company’s future financial health.1. Introduction[Company Name] is a [Industry] company that has been operating in the market for [Number of Years]. The company’s primary business activities include [List Key Business Activities]. This financial report analysis aims to provide stakeholders with a comprehensive understanding of the company’s financial position and per formance.2. Financial Performance Overview2.1 Revenue and Net Income- Revenue: [Amount] for the period [Start Date] to [End Date], representing a [Percentage] increase/decrease from the previous year.- Net Income: [Amount] for the period [Start Date] to [End Date], representing a [Percentage] increase/decrease from the previous year.2.2 Earnings Per Share (EPS)- EPS: [Amount] for the period [Start Date] to [End Date], representing a [Percentage] increase/decrease from the previous year.2.3 Gross Margin- Gross Margin: [Percentage] for the period [Start Date] to [End Date], indicating the percentage of revenue remaining after accounting for the cost of goods sold.2.4 Operating Margin- Operating Margin: [Percentage] for the period [Start Date] to [End Date], reflecting the company’s profitability from its core operations.3. Liquidity Analysis3.1 Current Ratio- Current Ratio: [Ratio] for the period [Start Date] to [End Date], indicating the company’s ability to cover its short-term liabilities with its current assets.3.2 Quick Ratio- Quick Ratio: [Ratio] for the period [Start Date] to [End Date], providing a more stringent measure of liquidity by excluding inventory from current assets.3.3 Cash Flow from Operations- Cash Flow from Operations: [Amount] for the period [Start Date] to [End Date], showing the cash generated from the company’s core operations.4. Solvency Analysis4.1 Debt-to-Equity Ratio- Debt-to-Equity Ratio: [Ratio] for the period [Start Date] to [End Date], indicating the proportion of debt to equity used to finance the company’s assets.4.2 Interest Coverage Ratio- Interest Coverage Ratio: [Ratio] for the period [Start Date] to [End Date], measuring the company’s ability to cover its interest expenses with its operating income.5. Profitability Analysis5.1 Return on Assets (ROA)- ROA: [Percentage] for the period [Start Date] to [End Date],reflecting the company’s efficiency in using its assets to generate profits.5.2 Return on Equity (ROE)- ROE: [Percentage] for the period [Start Date] to [End Date],indicating the return on investment for shareholders.6. Investment Activities6.1 Capital Expenditures- Capital Expenditures: [Amount] for the period [Start Date] to [End Date], representing the company’s investments in long-term assets.6.2 Dividends Paid- Dividends Paid: [Amount] for the period [Start Date] to [End Date], showing the cash distributed to shareholders.7. Key Strengths- Strong Revenue Growth: The company has demonstrated consistent revenue growth over the past few years.- Solid Profit Margins: The company maintains healthy profit margins, indicating efficient operations.- Robust Cash Flow: The company has generated substantial cash flow from operations, providing financial flexibility.8. Key Weaknesses- High Debt Levels: The company has a high debt-to-equity ratio, which may increase financial risk.- Dependence on Key Customers: The company’s revenue is heavily reliant on a few key customers, which could be a potential risk.- Competition: The company operates in a highly competitive industry, which may impact its profitability.9. Areas of Concern- Regulatory Changes: Changes in regulations could impact the company’s operations and profitability.- Economic Downturn: An economic downturn could negatively affect the company’s revenue and profitability.- Technological Disruption: The company may face challenges from technological advancements that disrupt its business model.10. Conclusion[Company Name] has demonstrated strong financial performance, with robust revenue growth and healthy profit margins. However, the company also faces certain risks and challenges, including high debt levels and dependence on key customers. Stakeholders should closely monitor the company’s liquidity, solvency, and profitabi lity to ensure its long-term financial health.11. Recommendations- Reduce Debt Levels: The company should focus on reducing its debt-to-equity ratio to mitigate financial risk.- Diversify Customer Base: The company should work on diversifying its customer base to reduce dependence on key customers.- Invest in Research and Development: The company should invest in research and development to stay competitive in a rapidly evolving industry.Appendix- Financial Statements (Income Statement, Balance Sheet, Cash Flow Statement)- Key Financial Ratios- Industry Comparison---This template provides a comprehensive framework for analyzing a company’s financial report. It can be customized to fit the specific needs of the analysis and to include additional information as required.第2篇Executive SummaryThis report provides an in-depth analysis of the financial performance of [Company Name] for the fiscal year [Year]. The analysis covers key financial metrics, profitability, liquidity, solvency, and efficiency ratios, as well as a comparative study with industry benchmarks. The report aims to offer insights into the company's financial health, performance trends, and potential areas of improvement.1. Introduction[Company Name] is a [brief description of the company's industry and business activities]. The company operates in a highly competitive market and has been experiencing [mention any recent developments or market trends]. This report is prepared to evaluate the company's financial position and performance over the fiscal year [Year].2. Financial Statement OverviewThe following sections provide a summary of the company's financial statements for the fiscal year [Year].2.1 Income StatementThe income statement shows the company's revenues, expenses, and net income over the fiscal year [Year]. Key points to consider include:- Revenue Growth: Compare the revenue for the current year with the previous year to determine if there is an increase or decrease in sales.- Expense Analysis: Examine the cost of goods sold, operating expenses, and other expenses to identify any trends or anomalies.- Net Income: Calculate the net income by subtracting total expenses from total revenue and analyze the trend over the years.2.2 Balance SheetThe balance sheet provides a snapshot of the company's assets, liabilities, and equity at a specific point in time. Key points to consider include:- Assets: Analyze the composition of assets, including current assets, fixed assets, and intangible assets.- Liabilities: Review the company's short-term and long-term liabilities to assess its financial obligations.- Equity: Evaluate the changes in equity over time, including retained earnings and additional paid-in capital.2.3 Cash Flow StatementThe cash flow statement tracks the inflow and outflow of cash from the company's operating, investing, and financing activities. Key points to consider include:- Operating Cash Flow: Assess the cash generated from the company's core operations.- Investing Cash Flow: Analyze the cash used for investments, such as purchasing new assets or selling existing assets.- Financing Cash Flow: Review the cash used for financing activities, such as issuing or repurchasing stock, and taking on or repaying debt.3. Financial Ratio AnalysisThis section presents an analysis of various financial ratios to evaluate the company's financial performance and health.3.1 Liquidity RatiosLiquidity ratios measure the company's ability to meet its short-term obligations. Key ratios to consider include:- Current Ratio: Compare current assets to current liabilities to determine the company's short-term solvency.- Quick Ratio: Calculate the quick ratio by excluding inventory from current assets to assess the company's ability to meet short-term obligations without relying on inventory.- Working Capital: Calculate the difference between current assets and current liabilities to determine the company's working capital.3.2 Solvency RatiosSolvency ratios measure the company's long-term financial stability. Key ratios to consider include:- Debt-to-Equity Ratio: Compare the company's total debt to its equity to assess its leverage.- Interest Coverage Ratio: Calculate the interest coverage ratio by dividing earnings before interest and taxes (EBIT) by interest expense to determine the company's ability to cover its interest payments.- Times Interest Earned: Calculate the times interest earned by dividing EBIT by interest expense to assess the company's ability to generate sufficient income to cover its interest obligations.3.3 Profitability RatiosProfitability ratios measure the company's ability to generate profits from its operations. Key ratios to consider include:- Net Profit Margin: Calculate the net profit margin by dividing net income by revenue to determine the company's profitability.- Return on Assets (ROA): Calculate the ROA by dividing net income by total assets to assess the company's efficiency in using its assets to generate profits.- Return on Equity (ROE): Calculate the ROE by dividing net income by shareholders' equity to assess the company's profitability from the perspective of its equity holders.3.4 Efficiency RatiosEfficiency ratios measure how effectively the company uses its resources to generate revenue. Key ratios to consider include:- Inventory Turnover: Calculate the inventory turnover by dividing the cost of goods sold by average inventory to assess how efficiently the company manages its inventory.- Accounts Receivable Turnover: Calculate the accounts receivable turnover by dividing net credit sales by average accounts receivable to assess how efficiently the company collects payments from its customers.- Fixed Asset Turnover: Calculate the fixed asset turnover by dividing sales by average fixed assets to assess how efficiently the company uses its fixed assets to generate revenue.4. Comparative AnalysisThis section compares the company's financial ratios with industry benchmarks to assess its relative performance.4.1 Industry BenchmarksProvide a comparison of the company's financial ratios with industry averages to identify any areas where the company is performing better or worse than its peers.4.2 Peer Group AnalysisSelect a group of similar companies and compare their financial ratios to identify the company's competitive position within the industry.5. ConclusionBased on the analysis of the company's financial statements and ratios, the following conclusions can be drawn:- Overall Performance: [Summarize the company's overall financial performance, including profitability, liquidity, solvency, and efficiency].- Areas of Strength: [Identify the company's areas of strength, such as high profitability, strong liquidity, or efficient operations].- Areas for Improvement: [Identify the company's areas for improvement, such as reducing debt levels, improving liquidity, or increasing efficiency].6. RecommendationsBased on the analysis, the following recommendations are made:- Strategic Actions: [Suggest strategic actions the company can take to improve its financial performance, such as expanding into new markets or improving cost management].- Operational Improvements: [Recommend operational improvements to enhance efficiency and productivity].- Financial Decisions: [Advise on financial decisions that can strengthen the company's financial position, such as refinancing debt or investing in growth opportunities].7. AppendicesThe appendices provide additional supporting information, such as detailed financial statements, calculations of financial ratios, and industry data.---This template serves as a comprehensive guide for analyzing a company's financial report. It can be customized to suit the specific needs of the analysis and to incorporate additional information or metrics as required.第3篇Executive SummaryThis report provides a comprehensive analysis of the financial performance of [Company Name] for the fiscal year ending [Date]. The analysis covers key financial statements, including the balance sheet, income statement, and cash flow statement. The report aims to evaluatethe company's profitability, liquidity, solvency, and efficiency, and to provide insights into its financial health and future prospects.I. Introduction[Company Name] is a [brief description of the company’s industry and business]. The company has been operating in the market for [number of years], and has established itself as a [mention any significant market position or achievements]. This report aims to analyze the financial performance of the company over the fiscal year, providing stakeholders with a clear understanding of its financial health and strategic direction.II. Financial Statements AnalysisA. Balance Sheet Analysis1. Assets Analysis- Current Assets: The current assets of [Company Name] include [list current assets like cash, receivables, inventory, etc.]. An analysis of the trends in current assets can provide insights into the company's liquidity position. For instance, an increasing trend in accounts receivable might indicate a growth in sales, but it could also suggest a longer collection period, which might be a concern.- Fixed Assets: The fixed assets of [Company Name] consist of [list fixed assets like property, plant, and equipment]. An analysis of the depreciation expense and the useful life of these assets can help in understanding the company's investment in long-term assets.- Intangible Assets: [Company Name] has [mention any intangible assets like patents, trademarks, etc.]. An assessment of the value and usage of these assets can provide insights into the company's competitive advantage.2. Liabilities Analysis- Current Liabilities: The current liabilities of [Company Name] include [list current liabilities like accounts payable, short-termloans, etc.]. An analysis of the trends in current liabilities can provide insights into the company's short-term financial obligations and its ability to meet these obligations.- Long-term Liabilities: The long-term liabilities of [Company Name] consist of [list long-term liabilities like long-term loans, bonds, etc.]. An analysis of these liabilities can help in understanding the company's capital structure and its ability to meet long-term financial obligations.3. Equity Analysis- Shareholder’s Equity: The shareholder’s equity of [Company Name] includes common stock, retained earnings, and other equity accounts. An analysis of the changes in equity can provide insights into the company's profitability and its dividend distribution policies.B. Income Statement Analysis1. Revenue Analysis- Revenue Trends: An analysis of the revenue trends over the fiscal year can provide insights into the company's sales performance. An increasing trend in revenue might indicate a successful sales strategy, while a decreasing trend might suggest a need for a new marketing approach.- Revenue Composition: An analysis of the revenue composition can provide insights into the company's dependence on different productlines or services. For instance, if the company is heavily reliant on a single product line, it might be vulnerable to changes in market demand for that product.2. Expense Analysis- Cost of Goods Sold (COGS): An analysis of the COGS can provide insights into the company's cost structure and its efficiency in producing goods or services.- Selling, General, and Administrative Expenses (SG&A): An analysis of SG&A expenses can provide insights into the company's operating efficiency and its marketing and administrative strategies.3. Profitability Analysis- Net Profit Margin: The net profit margin can be calculated by dividing net income by revenue. This metric provides an indication of the company's profitability.- Return on Assets (ROA): The ROA can be calculated by dividing net income by total assets. This metric provides an indication of the company's efficiency in using its assets to generate profits.C. Cash Flow Statement Analysis1. Operating Cash Flow: The operating cash flow provides insights into the cash generated from the company's core business operations. A positive operating cash flow is generally a good sign, indicating that the company can generate enough cash to sustain its operations.2. Investing Cash Flow: The investing cash flow provides insights into the cash used for or generated from investments in assets, such as property, plant, and equipment, and acquisitions.3. Financing Cash Flow: The financing cash flow provides insights into the cash used for or generated from financing activities, such as issuing or repurchasing shares, and taking on or repaying debt.III. Financial Ratios AnalysisThis section presents a summary of key financial ratios that provide a more detailed view of the company's financial performance.1. Liquidity Ratios- Current Ratio: Indicates the company's ability to meet short-term obligations.- Quick Ratio: A more stringent measure of liquidity, excluding inventory.2. Solvency Ratios- Debt-to-Equity Ratio: Indicates the proportion of debt used to finance the company's assets.- Interest Coverage Ratio: Indicates the company's ability to meetits interest payments.3. Profitability Ratios- Gross Margin: Indicates the company's ability to maintain a healthy profit margin on its sales.- Net Profit Margin: Indicates the company's overall profitability.- Return on Equity (ROE): Indicates the return earned on the shareholders' equity.4. Efficiency Ratios- Inventory Turnover: Indicates how quickly the company sells its inventory.- Receivables Turnover: Indicates how quickly the company collectsits receivables.IV. ConclusionThe financial analysis of [Company Name] for the fiscal year ending [Date] indicates that the company has demonstrated strong profitability and liquidity. The company has maintained a healthy balance between debt and equity, and has generated positive cash flow from its operations. However, there are areas of concern, such as the increasing trend in accounts receivable, which might require further investigation and action.Based on the analysis, the following recommendations are made:- Improving Collections: The company should implement strategies to improve its collections process and reduce the average collection period.- Cost Optimization: The company should continue to optimize its cost structure to improve profitability.- Diversification: The company should consider diversifying its product lines or services to reduce dependence on a single market segment.This report provides a comprehensive overview of [Company Name]'s financial performance and offers insights that can guide strategic decision-making and future growth.V. AppendicesThis section includes additional supporting data and analyses, such as detailed financial statements, variance analysis, and industry benchmarks.---This template is a starting point for analyzing a financial report. It can be customized based on the specific needs of the analysis and the nature of the company being evaluated.。
A financial analysis report for Tricol plcOutcome 3and4Class;10E6Name:Ma bodaSCN:125099297Candidate Num:22IntroductionTo operate better in financial aspect, the management of Tricol plc asked me to analyze their financial condition then make recommendations for them.FindingsPart A(ⅰ) Flex budget in line with actual activityTricol plc Flexed Budget for JuneOriginal budget FlexedbudgetActualresultsVariance2000 units 1600 units 1600unitsF/A££££Direct material 80,000 64,000 61,600 2,400 F Direct labor 36,000 28,800 35,200 6,400 A Variable productionoverhead4,000 3,200 3,200 0 Fixed costDepreciation 1,500 1,500 1,500 0 Rent and rates 2,500 2,500 2,500 0 Administration overhead 2,000 2,000 2,200 200 A Insurance costs 2,200 2,200 2,400 200 A Total 128,200 104,200 108,600 4,400 A(ⅱ) Variances calculationDirect material total variance(Standard units of actual production*standard price) -(actualquantity*actual price)(4 kg*1,600*£10) -£61,600 =£ 2,400 (F)Rate of significance: (3.75%)Direct material usage varianceStandard price*(standard units of actual production - actual quantity) £ 10*[ (4kgⅹ1,600) -5,600kg]= £8,000 (F)Rate of significance (12.5%)Direct material price varianceActual quantity * (standard price - actual price)5,600kg*[£ 10 -(£61,600/ 5,600kg) ]= £ (5,600) (A)Rate of significance: (8.75%)Direct labour total variance(Standard hours of actual production*standard rate ph) - (actual hours*actual rate ph)[ (2hrs*1,600) *£9]-£35,200=£(6,400) (A)Rate of significance: (22.22%)Direct labour efficiency varianceStandard rate ph* (standard hours of actual production - actual hours) £9*(2hrs*1,600-3,520hrs)=(2,880) (A)Rate of significance: (10%)Direct labour rate varianceActual hours*(standard rate ph – actual rate ph)3,520hrs*(£9*-£35,200/3,520hrs)= £(3,520) (A)Rate of significance: (12.22%)Total overhead varianceTotal standard overhead for actual production - total actual overheads (£18,000/12+£2,500+£2,200+£2,000)- (£1,500+£2,500+£2,200+£2,400)=£(400) (A)Rate of significance: (3.5%)(ⅲ) Report about variancesDirect material varianceThe direct material total variance can be analyzed in two aspects which are direct material volume and direct material price.For volume side, as calculated above, the budget volume is 6400kg; the actual volume is 5600kg. So there is 800kg variance which is favorable and each unit variance is 0.5kg. The likely reason causing the variance comes from three aspects. First of all, the company upgraded the production machinery recently, and new machine may use materials efficiently, so it reduced the waste of materials. Secondly, the company switched suppliers and using higher-grade materials can decrease wasteof materials too. Finally, the company has concluded ahigher-than-expected wage settlement for production operatives, which will maintain employees with higher skills as well as decrease turnoverof employees, and it also can increase efficiency in using materials.For price aspect, the budget price is £10 per kg, and the actual priceis £11per kg, it is adverse that one pound over the budget price. The company switching suppliers may cause the increase of negotiation cost. There may be a long-term relationship between Tricol plc and its old suppliers, so the suppliers may take lots of discounts to the firm. Afterchanging suppliers, the discount may disappear. Furthermore, higher grade materials increased unit price.Overall, the total material variance is favorable. £8,000 -£5,600=£2,400.Direct labour varianceThe direct labour total variance is composed of direct labour efficiency variance and direct labour rate variance.The budget direct labour hours are 3,200hrs and the actual labour hours are 3,520 hrs. There are more 320hrs needed than the budget, and each unit is 0.2hrs, which it is obviously adverse. The company upgrading the production machinery may need time for employees to adopt it. Also, employees need training time. The rebuild process of machinery consumed time too. In a word, the chargeable hours have increased.The budget direct laour hours rate is £9 per hour, the actual hours rate is £10 per hour. It is adverse that one pound higher than budgeted. It is possible caused by both internal and external factors.Higher-than-expected wage settlement may be internal reason for the variance, and new machinery may be needed to recruit new employees to operate the machinery, which also can increase the expense. For external factors, the changing of labour market may increase labour cost; the government legislation also can increase the labour cost, for example minimum pay.Both direct labour efficiency and direct labour rate variances are adverse, so the direct labour total variance is adverse.✧Overhead varianceAs calculated above, total overhead variance is caused by administration and insurance. Each factor has £200 variance, so the total overhead variance is £400 and it is adverse. During the process of changing supplier, the company needed more expense on public relationship or negotiation, in addition, in order to maintain the new machinery, administration cost will be increased too. For insurance aside, the improvement of machinery will need more insurance fees to cover, which also contributes to the increase of insurance fee of new employees.Part B◆Selection and application of two investment appraisal techniquesAs the company is keen to recoup the cost of the investment within five years, I will choose Payback period and Net Present Value to help me complete the appraisal.In order to fulfill the appraisal easily, there are some assumptions listed below should be considered before the appraisal.⑴ All revenue and inflow are assumed cash flow⑵ All investment cost incurred in year 0⑶ No uncertainty is considered⑷ Do not consider inflation and taxation⑸ Market rate of return is expected rate of return⑹ Rate of return is varying along with timeTricol plc Payback period for project distribution armYear Net cash flow Cumulative Cash Flow££Cash Flow Year 0 (1,000,000) (1,000,000) Cash Inflow Year 1 160,000 (840,000)Year 2 160,000 (680,000)Year 3 320,000 (360,000)Year 4 320,000 (40,000)Year 5 320,000 280,000 Net Cash Benefit Year 5 280.000 Note: req uire 40,000/320,000 in year 5= 1/8*year=1.5 mothsPayback=4 years 1.5 mothsTricol plc Net Present Value for project distribution armAnnual cash flow Present valuePresent Valuefactors at 10%£££Year 0 (1,000,000) 1.000 (1,000,000) Year 1 160,000 0.909 145,440Year 2 160,000 0.826 132,160Year 3 320,000 0.751 240,320Year 4 320,000 0.683 218,560Year 5 320,000 0.621 198,720 935,200 NPV (64,800)Recommendation about investmentAccording to Payback Period analysis, the investment cost can be recouped in year 4 and 1.5 moths. In other words, the period is under company’s expectation. The project can be executed. However, according to Net Present Value analysis, in terms of present value, within five years, what the NPV will bring net result is net cash loss but not net cash surplus. In general, the company should consider time value and other factors, so the project should not be executed.◆Factors impact on the investment should be consideredVarious factors will impact on result of investment. I will outline factors should be considered when the management reviewing my recommendation in financial and non-financial factors.✧Financial factorAs distribution arm is financial long-term beneficial project, it can be used inlong-term period and bring benefits continuous. The investment cost is £1,000,000, which can be considered a large investment. So it more likely needs long period payback period. The management should focus on longer cash flows for longer period of future. On the other hand, Net Present Value in year five is (28,000) only take 2.8% percents of the investment cost, it is more likely surplus in year six. Another financial factor is source of million pounds. If it is internal source, the management mainly concentrate on opportunities cost. If it is cost of capital or cost of capital taking much weight of the source, the management must pay cost of the source firstly, the marketing rate of return likely low for the company, in addition, the management should use higher discounted cashflow.Non-financial factorThe investment must be consistence with company’s strategic plan. As Tricol is a plc, it must take social responsibility such as obeying government policy, minimizing impact on environment and minimizing impact on natives.ConclusionFor real competition is more complex and fierce, in order to make accurate decisions, management should consider more factors during the decision-making; furthermore, the management should use more tools to help them such as IRR, DCF.。
Contents1.Introduction (What will you introduce and analyze in this report)2.Flexed the budgetsee Appendix ?3.Variances analysis ( the calculation of variance shown in Appendix 2)(Explain the variance and indicate the possible reasons for theses variance)1)Material variances analysisSampleThe total variance for direct materials is found by comparing actual direct material cost to standard direct material cost. The direct ma terial total variance is …. It means that the actual material costs are much higher than anticipated. I will break the direct materials variance into two components so that we can identify its cause more accuratelyMaterials Price Variance: A variance that reveals the difference between the standard price for materials purchased and the amount actually paid for those materials2)Labor variance analysis3)Overheads variance analysis4.Recommendations5.Assumptions made for the investment appraisal techniques6.The evaluation of the project using payback period and accounting rate ofreturn methods. Recommendations about investment (What?How? The advantage and disadvantage of these investment appraisal techniques.Recommend based on the case provided)7.The evaluation of the project using Net Present Value and Internal Rate ofReturn(What?How? Recommend based on the case provided)8.Consideration of Non-financial Factors9.Conclusions and recommendations10.Reference11.AppendixesRequirements1. A4 Paper of white color should be used2. Sub- Heading: Times New Roman, 14, Bold, Flush Left3. Text: Times New Roman 12, Line spacing: 1.5, 0.5 line spacing before and after paragraph, Flush Left4. Page numbers: lower case Roman numerals, centered on bottom of page5. Contents, Reference and Appendix: appears as a separate pageReference•Citing References in the report– E.g. Making reference to published work appears to be characteristic of writing for a professional audience (Cormack 1994).–Cormack (1994, p.32-33) states that 'when writing for a professional readership, writers invariably make reference to already publishedworks'•All citation entries are listed in alphabetical order based the first author's last name•Book:Redman, P.(2006). Good essay writing: a social sciences guide. 3rd ed. London: Open University in assoc. p.63-64.–(Redman, 2006)•Journal Article: Norton JE, Ashley MV(2001). What health care assistants know about clean hands. Nursing Times, 97(22), p.63-64.–(Norton and Ashley 2001)•News paper:Slapper, G.(2005). Corporate manslaughter: new issues for lawyers. The Times, 3 Sep. p.4-5.•Web Site:Kenway, P. (2008) Addressing in-work poverty [online], available:/publications/addressing-work-poverty[accessed 21 January 2010]–Citing References in the report e.g.–Kenway (2009) emphasizes….•If no author is given for this webpage•BBC (2010) Obama makes jobs priority [online], available: /1/hi/world/americas/8484400.stm [accessed 21 January 2010].–Citing References in the report e.g.– A BBC (2010) report queriesAppendix 1Flexed budget in line with actual activityAppendix 21. Material Total Cost Variance=(Budgeted Quantity × Budgeted Price) − (Actual Quantity × Actual Price) =2. Direct Material Price:Actual Quantity × (Budgeted Price − Actual Price)=3. ….7. Total Overhead(Budgeted Variable Overhead + Budgeted Fixed Overhead) − (Actual Variable Overhead + Actual Fixed Overhead)=Appendix 3Accounting Rate of ReturnTotal profit = Average profit = ARR =Appendix 4Net present valuePV factor =nr )1(1where “r” is the discount rate and “n” is the year of the cash flowCalculation of net present value at ?%Internal rate of returnFormula (P267)。
Contents1.0 Introduction ......................................................................................................... - 2 -2.0 The flexed budget ............................................................................................... - 2 -3.0 Calculate the Materials variances, Labour variances and the Total overhead. ... - 2 -3.1 Direct the materials variances , labour variances and the total overhead. .. - 2 -3.2 Variance analysis. ........................................................................................ - 3 -4.0 The recommendations for management (variances). .......................................... - 4 -5.0 Using four different methods to evaluate the financial. ...................................... - 5 -5.1 Identify the accounting rate of return........................................................... - 5 -5.2 Identify the payback. .................................................................................... - 5 -5.3 Identify the Net present value. ..................................................................... - 5 -5.4 Identify the Internal rate of return. ............................................................... - 6 -6.0 Recommendations for investment decision. ....................................................... - 6 -7.0 Conclusion .......................................................................................................... - 7 -8.0 Appendices .......................................................................................................... - 7 -1.0 IntroductionThis report will divided into two parts. Part A and Part B. In Part A,First of all, I will prepare a flexed budget in line with actual activity. Second, this will including the Materials variances, Labour variances and total overhead. At the same time, I will identify a minimum of one possible cause of the each variance. Finally, according to data analysis, there have been some recommendations to management of Matteck PLC. In Part B, It will have four different ways to evaluate financial performance and give recommendations for Matteck PLC. These ways are ARR ,Payback, NPV and IRR.Part A2.0 The flexed budgetFor Flex budged of Matteck PLC, we can see the Appendix 1.3.0 Calculate the Materials variances, Labour variances and the Total overhead.3.1 Direct the materials variances , labour variances and the total overhead.This section shows the Appendix 2.3.2 Variance analysis.Material price variance:The material price variance is ₤32,000(F). A ccording to the data analysis, it is ₤2/kg less expensive than planned. The possible reasons can be divided into three points: first, they could replace raw materials, using a lower - grade material. Second, the supplier to provide some discount for this batch of raw materials. Finally, learn from the case, the company has managed to locate new materials from an overseas. Due to the product from overseas, according to different exchange rate, the material will reduce the price.Material usage variance:The material usage variance is ₤30,000(A). The possible reasons include the effects of raw materials and the influence of the machine. If the company using poor quality raw materials, it may be more difficult to work. This will increase the waste materials. At the same time, the case shows that the company's new machinery can be fully used in the second week. The delay time may have caused the machine to use more materials than planned.Material total variance:The material total variance is 2,000(F). Case shows that the company's raw materials are from overseas suppliers. This will reduce some costs. Which leads to the material price variance is 32,000 (F). On the other hand, the company has introduced a new machine, the influence of machine installed time, caused some wasted of materials. This makes t he material usage variance is ₤30000 (A). Even if The company’s material total variance is 2000 (F). The company's management still should pay attention to The utilization of raw materials.Labour efficiency variance:The Labour efficiency variance is 10,000(F). The possible reasons could include the new machine to improve staff work efficiency. Using new machine can less labour hours. At the same time , the case shows that the company has had to employ more highly qualified staff. They can increase the working efficiently through the higher skill.Labour Rate Variance:The Labour rate variance is 15,000(A). Through the calculation, the labour rate is ₤1.50 per hour higher than original. The possible reasons is ₤1.50 per hour higherthan planned. The cost of direct labour is adverseness for this firm.Labour Total Variance:the Labour total variance is 5,000(A). The reasons of variance, the company has introduced the new machine, As the result the direct labor efficiency variance is favorable which is 10,000(F). On other hand, the labour rate is higher than standard labour rate. Finally, lead to the labour total variance is adverse,4.0 The recommendations for management (variances).1. The company should be had a variety of data investigation to set up complete data system. At the same time, through the different variance, the company can know more about the market information.2. The company should intensify the performance monitor for staff because the lower performance will accelerate waste of material and then lead to the material usage is increase, the performance monitor can help the company shrink the variance.3. Management: the company can provide some motivation policies to motivate the staff that is work hard and enhance the work enthusiastic of the staff. This can improve the staff work efficiency.Part B5.0 Using four different methods to evaluate the financial. 5.1 Identify the accounting rate of return.ARRAverage profit=5000,300,3=660,000Accounting rate of return=000,500,2000,660 =26.4%The cases show that the company should have an accounting rate of return of at least 15%, through calculation, the ARR is 26.4%. Therefore, the data has meet company standards.5.2 Identify the payback.The company hopes to recover the cost of the investment within 4 four years. In fact, they just use 3 years 341days. (see Appendix 3.)5.3 Identify the Net present value.The NPV method calculates the present values of cash inflows and outflows and establishes whether. Basically, NPV provides an objective for evaluating and selecting investment projects. Moreover, it takes into account required rate of return of company and then takes into account time value of money. But there are substantial uncertainly factors in our world. For instance the inflation and deflation, the exchange rate.When the Matteck ’s c ost of capital is 10%. The NPV is (46200). The NPV value less than 0. The company should not invest this project. ( see Appendix 4.)5.4 Identify the Internal rate of return.When the present value is 5%, the internal rate of return is 9.39%. Which less than 10% of company standard.therefore,the company should not invest this project.( see Appendix 5)6.0 Recommendations for investment decision.1. According the four method, The ARR and Payback are both implement for this project, but theNPV and IRR are not implemented for this Project. In this case ,the company should focus on the NPV and IRR.2.By calculates the net present values, it seems that the deficit, which means that the annual cash flows are not enough to allow more interest to be deducted and still repay the original investment. This investment is unworthy .3.Within five years. All the market factors are changeable. The information will have different change. And there are maybe some other situations occurred. So the Matteck PLC should not concern with the project.7.0 ConclusionThe report can help the company make the flex budget, and then by variances analysis and use the four methods to evaluate the financial. Through the recommendations can help the company choose the best investment to gain the maximum profits.8.0 Appendices8.1 Appendix 1Matteck PLC Flexed budgetFor December 2011Original budget 5000 units Flexed budget4500 unitsActual results4500 unitsVarianceF/A₤₤₤₤Direct Material 180,000 162,000 160,000 2000(F)Direct Labour 100,000 90,000 95,000 5000(A)VariableOverheads50,000 45,000 47,500 2500(A) Supervision Cost 3,300 3,300 3,400 100(A) Rent and Rates 1,000 1,000 1,200 200(A)AdministrationOverheads2,000 2,000 2,100 100(A) Depreciation 3,000 3,000 3,000 0 Total 306,300 312,200 5,900(A)8.2 Appendix 28.3 Appendix 3PaybackCapital cost ₤2,500,00Year 1 ₤500,000Year 2 ₤600,000Year 3 ₤700,000Year 4 ₤750,000Year 5 ₤750,000Total ₤3,300,000Payback=3 year+000,750000 ,800,1000,500,2−×365days =3 year 341days8.4 Appendix 4YearAnnual cashflowPresent valueFactors at10%Present Value₤₤₤₤0 (2,500,000) 1,000 (2,500,000)1 500,000 0.909 454,5002 600,000 0.826 495,6003 700,000 0.751 525,7004 750,000 0.683 512,2505 750,000 0.621 465,750 2,453,800NPV (46,200) 8.5 Appendix 5Year Annual cashflowPresent valueFactors at 5%Present Value ₤₤₤₤0 (2,500,000) (2,500,000) 1 500,000 0.952 476,000 2 600,000 0.907 544,200 3 700,000 0.864 604,800 4 750,000 0.823 617,2565 750,000 0.874 588,000 2,830,256 NPV330,256R=10% NPV=(46200)R=5% NPV=330256IRR=5%+)200,46(256,330256,330−×5%=9.39%。
Parti⑴(2)The variances are calculated as followed:DIRECT MATERIAL TOTAL VARIANCE(STANDARD UNITS OF ACTUAL PRODUCTIOSTANDARD PRICE) —(ACTUAL QUANTITY^ ACTUAL PRICE)[(4kg 水600)疼 10] —£ 61,600=£ 64,000- £ 61,600=£ 2,400 (F)DIRECT MATERIAL PRICE VARIANCEACTUAL QUANTITY (STANDARD PRICE —ACTUAL PRICE)5,600kgs (£ 10—£ 61,600/5,600kgs)=5,600kgs (£ 10—£ 11)= £ 5,600 (A)DIRECT MATERIAL USAGE VARIANCESTANDADR PRICEX (STANDARD UNITS OF ACTUAL PROCUTION —ACTUAL UNITS)£ 10X[(4kg X,600)— 5,600kgs]= £ 8,000 (F)DIRECT LABOUR TOTAL VARIANCE(STANDARD HOURS OF ACTUAL PRODUCTIONSTANDARD RATE ph) —(ACTUAL HOURS ACTUAL RATE ph)[(2hours 1^600) £ 9] —£ 35,200=£ 2,8800- £ 35,200= £ 6,400 (A)DIRECT LABOUR RATE VARIANCEACTUAL HOURD(STANDARD RATE p.h. —ACTUAL RATE ph)3,520hrs (£ 9—£ 35,200/3,520hrs)=3,520hrs (£ 9—£ 10)= £ 3,520 (A)DIRECT LABOUR EFFICIENCY VARIANCEACTUAL HOURS (STANDARD HOURS OF ACTUAL PRODUCTION —ACTUAL HOURS)£ 9X[(2hours 1,600)—3,520hrs]= £ 9X320=£ 2,880 (A)OVERHEAD TOTAL VARIANCETotal Sta ndard Overhead for actual productio—Total Actual Overheads£ 2X1,600+ £ 2,000+ £ 2,500+ £ 1,500+ £ 2,200— ( £ 3,200+ £ 2,200+£ 2,500+ £ 1,500+£ 2,400)=400 (A)(3)In the first part, we have calculated cost varia nces for Tricol plc at Jun e. It totally produced 4,400 adverse varianee that include £ 2,400 favorable material varianee, £ 6,400 adverse labor varianee and £ 400 adverse overheads varianee. All these varia nces have exceeded the rate of sig nifica nee of 3%. Direct material total varia nee can be divided in to two comp onen ts: the direct material usage varia nee and the direct material price varia nee. Direct material total varia nee of Tricol pic in June is £ 2,400 (F) with the rate of significanee of 3.75%( The level of significance of Direct Material TotalVariance=400/64,000=3.75%). The direct material usage varia nee is the favorable varia nces in£ 8,000, a rate of sig nifica nee is 12.5%( The level of significanee of Direct Material Usage Varianee=8,000/64,000=12.5%), the possible reasonsfor this varianee may be the company use higher quality raw material and higher grade workforce. the direct material price varianee is £ 5,600 (A), and a rate of significanee is 8.75%( The level of significanee of Direct Material Price Varian ce=5,600/64,000=8.75%). The reason is the compa ny has switched supplier and using higher-grade materials; and because the fluctuations of excha nge rate in the intern ati onal market react on price of the raw materials. Similar with direct material total varianee, the Direct Labour Total Varianee was made up by the Direct Labour Rate Varia nee and Direct Labour Efficie ncy Varia nee. It is a adverse varianee of Tricol plc in June (£ 6,400) with the rate of significanee of 18.18% (The level of sig nifica nee of Direct Labour Total Varia nee =6,400/35,200=18.18%). The direct labor efficie ncy varia nee is the adverse varia nee in £ 2,880, and a rate of significanee is 8.18% (The level of significanee of Direct Labour Efficie ncy Variance=2,880/35,200=8.18%). The reason for this varia nee may be the company lowers its workforce grade and also the morale. Possibly it is that the compa ny eon ducts the pay rise which is higher tha n expected for producti on operatives, or it lack qualified and skilled labor to operate the upgraded machinery lead a adverse varianee in the direct labor rate, a£ 3,520 , with a rate of significanee as 10% (The level of sig nifica nee of Direct Labour Rate Varia nee =3,520/35,200=10%).The overheads total varia nee in June was £ 400 which was a adverse varia nee. The level of sig ni fica nee of Overhead=400/12,200=3.3%. There are two factors cause this. First, the in sura nee fee exceed an ticipated budget. Second, there occur extra admi nistrati on overheads.For all the varia nee above, there are some recomme ndati ons prese nted in the follows: All the varia nces rate of sig nifica nee are more tha n 3%, so a detail an alysis of all the aspects should be take n, and find out a settleme nt for this problem, as to elim in ate the adverse variances and holding the favorable variances. The company has recently con cluded a higher-tha n-excepted wage, however, the labor efficie ncy decreased. The man ageme nt n eeds to do a farther research.Considering the adverse varianee of material price, the purchasing department en deavor to n egotiate with the supplier about the extra disco un t, if it sig ns a Ion g-term and large purchas ing con tract with the supplier; or search for new supplier who can provide the same higher-grade material with relative lower price.Appendix1.Payback Period:Year Annual Cash Flow Cumulative0 (£ 1,000,000) (£ 1,000,000)1£160,000 (£ 840,000)2£ 160,000 (£ 680,000)3£320,000 (£ 360,000)4£320,000 (£ 40,000)5£ 320,000 £ 280,000Payback period = 4 years and 1.5 mon ths (40,000/320,000)2.Disco un ted Cash Flow:Year PV factor - 10% Cash Flow NPV Cumulative0 1.000 (£ 1,000,000) (£ 1,000,000) (£ 1,000,000)1 0.909 £ 160,000 £ 145,440 (£ 854,560)2 0.826 £ 160,000 £ 132,160 (£ 722,400)3 0.751 £ 320,000 £ 240,320 (£ 482,080)4 0.683 £ 320,000 £ 218,560 (£ 263,520)5 0.621 £ 320,000 £ 198,720 (£ 64,800) Net Prese nt Value for the Project =£ -64,800Part 21.There are some key assumptions should be clearly stated(1)The management should assume that the given ‘ market rate of returnwill no vary.(2)Managers should ignore the impact of taxation and inflation on the above figures.(3)The figures of expect revenue which appear in this report are net cash flow, after paid off allreleva nt costs.(4)Assu ming that the total cost of the project will be payable at the beg inning.2.The calculation and analysis of two investment appraisal technique.⑴ Payback Period:Payback as a method of investment appraisal measuresthe number of years it is expected to take to recover the cost of the origi nal in vestme nt. Payback period is 4 years and 1.5 mon ths. In the 5 yearafter the in vestme nt, the huge inv estme nt will get a complete return, and obtain the net present valueof the return at £ 280,000 from this project. So, the payback is applicable.(2) Discounted Cash Flow:With this technique, the company would not return their investment. The market rate of return on investment projects is 10%, the Tricol plc will not recover its in vestme nt over the n ext 5 years, the net prese nt value of the retur n i£ 935,200, and the net present value for the project is a negative numerical that means a loss of £ 64,800. So the DCF technique indicted that this investment was not appeared to be profitable.3.On the basis of the above investment appraisal analysis, the management should be recomme ndedthat the pla nned in vestme nt should not go ahead. Because net present value for the Project is £ -64,800. That is to say the company can not recover the orig inal inv estme nt. However, the prese nt value of the retur n shall not be used for completely in dicate the recovery of the cost, so therecomme ndati on is that the man ageme nt should thi nk the follow ing additi onal factors over.4.Some other factors which the management should consider.This pla nned inv estme nt may have a Ion g-term reve nue retur n after 5 years. For example,the motor vehicles may have residual values and the land or build ings will have a Ion ger useful life. The man ageme nt could con sider the reve nue for Ion ger tha n 5 years.The management would consider that whether the invest plan has fit the compa ny' s overall corporate strategy.The financial condition should also be considered. Is the company has sufficie nt fun ds? In ano ther words, does the curre nt cash flow positi on can support such an in vestme nt.。
Content1. Introduction ................................. 错误!未定义书签。
2. Tricol Plc Flexed budged ............. 错误!未定义书签。
3. The calculation of the variances and the variance rate ......................................................... 错误!未定义书签。
4. Variance analysis and report ........ 错误!未定义书签。
5. Recommendation ......................... 错误!未定义书签。
6. Analysis of two investment appraisal technique错误!未定义书签。
Assumption ...................................... 错误!未定义书签。
7. Calculation of net present value ... 错误!未定义书签。
8. Calculation of the payback period method错误!未定义书签。
9. Recommendation for investment decision错误!未定义书签。
10. Consideration of other factors that management should consider ................................ 错误!未定义书签。
11. Conclusion ................................. 错误!未定义书签。
1. IntroductionThis report for Tricol plc which is now considering the development of its own distribution arm involved the interrelated issue about the investment appraisal. It includes 4 parts, assumptions, application of payback period and NPV, evaluation and recommendation and other factors to be considered, which could has important significance for assessing the rationalization of investment.2. Tricol Plc Flexed budgedIt shows the Appendix 1.3. The calculation of the variances and the variance rateIt shows the Appendix 2.4. Variance analysis and reportConsidering the policy of Tricol plc, the criterion that need to analyse the variance is more than a rate of significance of 3%, as a result, it need to analyse all variances.Based on the information above, the variance of this company is adverse in June, there are some reasons which caused of this situation, including these below:●Based on the upgraded the production machinery of Tricol plc, it improved thematerial usage which can saving large amount of material of about 800kg. At the same time, due to employees of the company who can not operate the new machines masterly to produce a product, then the time of produce a products will require more than the original hours for 12 minutes, the time changes from 3200 hours to 3520 hours. The changeable of the machine have made some adverse result for the company.●According to switched suppliers of Tricol plc currently, it is using thehigher-grade material now, moreover the material price must increase from original £10 per kg to £11 per kg. But the higher-grade material can save the amount for this products, even the price for ont unit is increased, the cost of direct material is still favorable for this company.●With the updated machines, this company need to provide the higher gradeworkforces and employeed higher-grade employees. Also Tricol plc has recently concluded a higher-than-expected wage settlement for production operations.That made the labour rate become £10 per hour, which is higher than standard labour rate for £1 per hour. In a conclusion, the cost of direct labour is adverse for this company.●Seeing on overhead, caused by the difficult trade condition, this company need topay much more money on products' promotion, and the insurance is rising. Thesereasons must caused insurance cost and administration cost increased for £200, so this company will has £400 adverse.5. RecommendationTo sum up, the company's actual spending is much higher than the standard spending, in order to change this situation, it has some recoomendation for Tricol plc.●Improve the labour efficiency may be a good solution for the adverse situation.Because the variance of direct labour is main problem, and the employees spend much more time to produce a product. As a result this company can provide some training classes for them to improve their skill and knowledge about using upgraded machines and materials, then they can operate the new machineries easily to save the time and money.●Use inferior quality materials. Because the high price of the high quality materialwill lead this company can not achieve the target standard for the difficult trade condition, which may result in a large number of stocks and then the cash flow will appeared some problem too.●Reduce labour rate, this company can employ some lower grade workforce, sothis company can pay a lower salary, and make a plan for overtime. Also the company can provide some motivation system to motivate the staff who are work hard and the work enthusiastic of the staff will increase.Before calculate the answer we should suppose the period of this project is five years and it has no other cash flows except this. Then we do not need to consider the exchange of the materials and the taxation from government. Here below, it will get the answer in two methods.6. Analysis of two investment appraisal techniqueAssumptionDuring the process of using net present value and the payback period method, the assumption should be taken into consideration, so that we can easily to understand the underlying principle.The assumption is as follows:●The life of this investment is within five years●There is no other income or expenditure in the investment projects●The inflation and deflation doesn’t exist, and there is no change in exchange rate ●Taxation by government can be excluded●All the market factors are stable●Uncertainty does not exist.●The appropriate discount rate to use is known, to avoid unnecessary calculations,when undertaking DCF questions, the discount rates have been computed for you and are given in the discount tables provided at the end of this unit.●Unlimited funds can be raised at a competitive rate.7. Calculation of net present valueIt is showed by Appendix 3.8. Calculation of the payback period methodIt is showed by Appendix 4.9. Recommendation for investment decisionThe analysis of two investment appraisal techniquesDisadvantages of the payback method·It ignores cash flows after initial outflow has been met·It ignores risk·It ignores time value of money·It ignores the fact that benefits from different projects may accrue at an uneven rate ·No allowance is made for interest on the initial capital investment.Advantages of the NPV method·Provides an objective basis for evaluating and selecting investment projects ·Takes account of both magnitude and timing of expected cash flows in each period of a project’s lifeInvestors can not use a single formula to calculate the rate of return, they should consider the value of the time.In view of the data calculated above, payback will take four years and one-and-half month to complete, therefore, it seems to be reasonable to accept and invest this kind of project. However, in other method, it is impossible to fulfill a requirement of a 10% return. The actual rate of return must be less than 10%.Taking this two methods into consideration, firstly, net present value methods is more accurate than payback period method, secondly, although it cannot realize the expected return in 10% in the first 5 years, mainly basing on growing slowly and low return at beginning, it may bring a higher revenue and positive cash inflow in thefuture years.Personally, I think we can accept the new project for a period time.10. Consideration of other factors that management should consider1. The investor’s belief in the future, based on forecasts of internal and external factors.2. Whether the capital is sufficient or not. If not, the cost of capital finance will influence the net present value.3. The investor’s attitude to risk, The profit of long term may be more positive.4. The cost of human resource management should be considered. Because the project of distribution arm need purchase of several new motor vehicles, and this need employee training arrangement and new department established.11. ConclusionAs an advisor for the company, this report can help the company make the flex budget and variances and use the two methods to analysis the investment and help the company choose the investment method. This will company make much profit.Appendix 1Tricol Plc Flexed budgedBased on the all information about “Zupper”expendable table, I draw a table as following:Appendix 2The calculation of the variances and the variance rate1.Direct material total variance(standard units of actual production×standard price) –(actual quantit y×actual price)[(4kg×1600)×£10] –£61600= £64000 –£61600=£2400 ( F )The rate for direct material total variances is £ 2,400/£ 64,000×100%=3.75%2.Direct material price varianceactual quantity×( standard price-actual price)=5600kg×( £10- £11)=5600kg×£1=5600 (A)The rate of direct material price variance is £ 5,600/£ 64,000×100%=8.75%3.Direct material usage variancestandard price×(standard units of actual production-actual units)=£10×(4kg×1600-5600kg)=£10×800kg=£8000 (F)The rate of direct material usage variance is £ 8,000/£ 64,000×100%=12.5%Note: When adding the price and usage variances the result must equal the total variance. Therefore, £5600(A) (price)+£8000(F) (usage) = £2400(F) (total).4.Direct labour total variance( standard hours of actual production×standard rate ph) -(actual hours×actual rate ph)[(2h×1600)×£9] -(3520h×£10)=(3200h×£9)-£35200=£28800 -£35200=£6400(A)The rate of diretc labour variance is 6400/28800×100%=22.2%5.Direct labour rate varianceactual hours×( standard rate ph-actual rate ph)3520h×(£9-£10)=3520h×£1=£3520(A)The rate of direct labour rate variance is £ 3,520/£ 28,800×100%=12.2%6.Direct labour efficiency variancestandard rate ph ×( standard hours of actual production-actual hours)£9×[2h×1600-3520h]=£9×(3200h-3520h)=£9×320h=£2880(A)The rate of direct labour efficiency variance is £ 2,880/£ 28,000×100%=10%Note: When adding rate and efficiency variances the result must equal the total variance. Therefore, £3520(A) (rate)+£2880(A) (efficiency) = £6400(A) (total).7.Overhead total variance(standard insurance cost-actual insurance cost)+(standard administration overheads-actual administration overheads)(£2200-£2400)+(£2000-£2200)=£200(A)+£200(A)=£400(A)The rate of overhead total variance is £ 400/£ 4,200×100%=9.52%Appendix 3Calculation of net present value at 10%Appendix 4Payback period method:In Year 5 the cash inflows for the full year are £320,000 but only £40,000 is required to recoup the initial investment. This is therefore reached in 1.5 months.Payback= 40000/320000*Year 5= 1/8 Year 5= 4 year 1.5monthsPayback will take 4 year 1.5months.。
Jamieson Tech Ltd Job Cost Operating StatementReference number: Job 35/TGBDirect Materials Calculation ££Material V 100kg×£8/kg 800Material Z 80kg×£12/kg 9601760 Direct LabourDepartment A 100hours×£6/hour 600Department B 110hours×£4/hour 4401040 Direct ExpensesMachine Hire 400 Prime Cost 3200 ProductionOverheadsDepartment A 100hours×£4/hour 400Department B 80hours×£20/hour 1602000Production Cost 5200 Administration £3200×10% 320Selling andDistribution£5200×10% 520840 Total Cost 6040 Profit margin A-£6040Selling priceNOTES:1.Department A overhead absorption rate:£24,000/60,000 hours = £4 per hour2.Department B overhead absorption rate:£280,000/14,000 hours = £20 per hour3.Selling price:Let selling price: AThen: £6040 +20%A =AA=Profit =A - £6040 =Q 2.Cost Operating Statement for Jamieson Tech Ltd100 units of product CPOReject Offer Accept Offer (closedepartment C)Accept Offer(retain departmentC)Unit Sold Per unit 100 100 100££££££££Sale 3310 297,900 304,000 304,000 Less V ariableCostsMaterialsMaterial T 640 64,000 51,200 51,200Material Y 300 30,000 24,000 24,000LabourDepartment A360 36,000 36,000 54,000 Department B 320 32,000 32,000 32,000Less contributionfrom department C10,0001,620 162,000 153,200 161,200 Contribution 1,690 135,900 150,800 142,800 Less fied costsOverheadsdepartment A240 24,000 24,000 24,000 Additionaloverheads fromDepartment C2,000Overheadsdepartment B400 4,000 4,000 40,000 Additionaloverheads fromDepartment C1,000Administration 162 16,200 16,200 16,200Selling andDistribution226 22,600 22,600 22,6001,028 102,800 105,800 102,800 Profit 662 33,100 45,000 40,000 NOTES:1.The sale if reject offer : £3,310×100units×(1-10%) =£297,9002.Cost of direct material T if accept offer: £640×100units×(1-20%) =£51,2003.Cost of direct labour for department A if accept offer and retain department C:£360×100units×1.5 =£54,0001.Introduction:Jamineson Tech Ltd had been approached by Ceesay plc who was willing to offer an order of £304,000 for 100-unit product CPO. There is a problem that the future selling price will fall by 10% for the product if Jamineson Tech Ltd accept the special offer, and it has three options to deal with the problem. Then this report will illustrate the comparisons and analyses of the results for taking different decision to help the company choose a beneficial option.2.Findings:2.1. If Jamineson Tech Ltd rejects this offer, then it will lose a 10% of turnover of the original sale, while the variable costs, fixed costs, costs of administration and selling and distribution have no changes. The final profit Jamineson Tech making will be £33,100 for 100 units.2.2. If Jamineson Tech Ltd accept the offer and close department C, the direct material supplys will provide an additional trade discount of 20%, and the cost of direct labour retains the same. There will be a loss of contribution (£10,000) for TUC because the employees will be transferred from department C to department A. The sale is £304,000 for 100 units, so the contribution cost will be £150,800. Then the fixed overheads from department C will be transferred to department A and department B for total £30,000. The costs of administration and selling and distribution remain at the same. So the final profit to this decision is £45,000.2.3. If Jamineson Tech Ltd accept the offer and keep department C disclosed, the direct material supplys will promise to provide an additional trade discount of 20%, and there will be an 1.5 times of direct labour time in department A. And the fixed costs in both department A and department B remain at the same. So the final profit to this decision is £40,000.3.Conclusion:After analysing the three different conditions, it can be found that there are different merits and shortages. But the decision of accepting the offer and closing department C can provide the greatest profit, and the second one is accepting the offer and disclosing department C. Rejecting the offer makes a lowest profit compared the other options.4.Recommendation:According to the results of analyses, it is reasonably to recommend Jamineson Tech Ltd to accept the offer from Ceesay plc. It is the best choice for making a great profit whatever whether Jamineson Tech Ltd close department C or not. And they need to pay attention to the maintenance of machines to avoid an extra cost in re-purchasing of machines, as well as the processes of selling and distribution.。
Report aboutPreparing Financial ForecastsOutcome 3&4Unit code: DE3J 35Unit title: Preparing Financial Forecasts Candidate’s Name: Hu HanchangScottish Candidate Number: 115517880 Instructor:Zhang JiaDate: 23th12 2011contents1.0 Introduction (3)2.0 Main Bodies (3)Part A (3)2.1 Tricol Plc Flexed budged (3)2.2 The calculation of the variances (3)2.3 Variance analysis and recommendations (3)2.3.1 Direct material total variance and recommendations (3)2.3.2 Direct material usage variance (4)2.3.3 Direct material price variance (4)2.3.4 Direct labour total variance (5)2.3.5 Direct labour efficiency variance (5)2.3.6 Direct labour rate variance (6)2.3.7 Total Overhead variance (6)Part B (7)2.4 Analysis of two investment appraisal technique (7)2.4.1 Calculation of net present value and features of NPV (7)2.4.2 Calculation of the payback period method (8)2.4.3 Recommendations for investment decision (9)2.5 Other non-financial factors (9)3.0 Conclusion (10)4.0 Reference (10)5.0 Appendix (11)1.0 IntroductionThe report about Tricol plc which is main containing two parts: Part A and Part B.In Part A, this report will give the Flex the budget figures with actual activity and analysis variances, furthermore the report will give some recommendations to management. In Part B, the report will application of two investment appraisal techniques to evaluation the financial viability of Tricol plc and give recommendations.2.0 Main BodiesPart A2.1 Tricol Plc Flexed budgedFor Flex budged of Tricol plc, we can see the Appendix 12.2 The calculation of the variancesThis section shows the Appendix 2.2.3 Variance analysis and recommendationsIn this part, we need considerate that the company policy need to analyses the variance is more than a rate of significance of 3%, on the other hand, difficult trading conditions, actual production of June was 80% of the target amount.2.3.1 Direct material total variance and recommendationsDirect material total variance is favourable.The reasons of variance, recently, the company has introduced the production machinery, due to the employees who can not expertly operate the new machinery to produce which leads to the material usage variance is increase to 8000F. In addition,The Company has switched suppliers currently; it is using the higher-grade material now, as the result of issue, the material price must raise from original £10 per kg to £11 per kg, which leads to the material price variance is 5600A. Further direct material total variance is 2400F.Recommendations:The actual activity is over the Flex the budget, due to the company uses thehigher-grade material. We suggest that the company can use the lower grade quality materials to shrink the variance; in addition, the company can hire the higher grade workforce to expertly operation the new machine, and then shrink the variance.2.3.2 Direct material usage varianceDirect material usage variance is favourable.The reasons of it, the company has switched suppliers currently, the material is higher quality, which can produce substantial products than lower material, and then the average usage of direct material is low. Moreover, the company has updated machines; it can produce to the higher quality of products, and then reduce the amount of rejected products. Finally the material usage variance is 8000F.Recommendations: the rate of direct material usage variance is12.5%, it is more than 3%. So we should consideration that reduces the variance, if the company has decided to use the higher-grade material to production, we suggest that the company should intensify the performance monitor for staff because the lower performance will accelerate waste of material and then lead to the material usage is increase, the performance monitor can help the company shrink the variance.2.3.3 Direct material price varianceDirect material price variance is adverseThe reasons of variance, the company has switched suppliers currently, it is using thehigher-grade material now, as the result of issue, the material price must raise from original £10 per kg to £11 per kg. In addition, the loss of discount, also can effect the material price variance.Recommendations: The company can turn to others suppliers who can help you reduce the cost of material. On the other hand, the company can negotiation with suppliers to gain the lower discount also can shrink the variance.2.3.4 Direct labour total varianceDirect labour total variance is adverseThe reasons of variance, the company has introduced the new machine, however, the employees who inexpertly operate the new machinery to produce, as the result, the actual labor hours is over the budget, the hours changes from 3200 hours to 3520 hours. As the result the direct labor efficiency variance is adverse which is 2880 A. In addition, the company has recently concluded a higher-than-expected wage settlement for production operations. As the result of that, the labour rate is higher than standard labour rate from £9 per hour to £10 per hour. As the result of it, the direct labour rate variance is adverseness for this firm which is 3520A. Finally, lead to the labour total variance is adverse, which is 6400.Recommendations:The company can provide training to enhance the staff’s skill, in addition, it can hire the higher-grade employee to improve the efficiency.2.3.5 Direct labour efficiency varianceDirect labour efficiency variance is adverseReasons of it, maybe low incentive, the staff need continuously motivation who can improve the efficiency. In addition, the company maybe hire lower-grade workforce to produce, it has negative impact of efficiency.Recommendations:Because the company has upgraded the production machine, as the result the staff only gains the new skills, furthermore the company can provide some trainings of high quality to staff. In addition, the company can hire the higher-grade workforce to reduce the shrink variance.2.3.6 Direct labour rate varianceDirect labour rate variance is adverseReasons of it, the firm has recently concluded a higher-than-expected wage settlement for production operations. As the result of that, the labour rate is higher than standard labour rate from £9 per hour to £10 per hour. As the result of it, the cost of direct labour is adverseness for this firm.Recommendations:This company can hire some lower grade workforce, and then can pay a lower salary. Moreover, the company can provide some motivation policies to motivate the staff that is work hard and enhance the work enthusiastic of the staff.2.3.7 Total Overhead varianceTotal Overhead variance is adverseThe reasons of it, due to the company using the higher-grade material, it maybe lead to the administration overhead is increase such as the company needs hire the expensive transport charges to transport the higher-grade material, as the result the administration overhead is increase to 2200. In addition, the company has upgraded the machinery; it leads to the insurance cost is increase by 200; finally the total overhead variance is adverse which is 400A.Recommendations: we suggest that the company use the low-grade material and training staff to shrink the variance.Part B2.4 Analysis of two investment appraisal techniqueIn this part, the report will use net present value and the payback period method to describe, in addition, making some assumptions to analysis.The assumption as follows:Within five years. All the market factors are stably. There is no change in exchange rate. And the report is taking no account of the inflation and deflation. In addition, taxation can be excluded by government. Moreover, there is no other income or expenditure in the investment projects. Furthermore, unlimited funds can be provided during the developing.2.4.1 Calculation of net present value and features of NPVIt is showed by Appendix 3.Net Present ValueThe NPV method calculates the present values of cash inflows and outflows and establishes whether, in total, the present value of cash inflows is greater than the present value of cash outflows.Advantages of NPV as follows:Basically, NPV provides an objective for evaluating and selecting investment projects. Moreover, it takes into account required rate of return of company and then takes into account time value of money. In addition, it focuses on cash inflows and outflow rather on accounting profits. Also it takes account of both magnitude and timing of expected cash inflows in each period of a project's life.Disadvantages of NPV:Firstly, there are substantial uncertainly factors in our world. For instance the inflationand deflation, the exchange rate, if they have a little change then the cash flow is uncertainly. In addition, the concept is difficult for the layman to grasp. On the other hand, assumes that we can borrow as required and at a competitive rate of interest. Also, the cost of capital used to calculate the discount factor is usually hard to forecast.2.4.2 Calculation of the payback period methodIt is showed by Appendix 4.Payback periodGenerally speaking, It is mostly popular techniques. Further, the number of years is the measures method. And then it is expected to be taken to recover the cost of the original investment.Advantages of it as follows:It is known to all that Payback period was considered easy to operate and understand. Indeed, as a measure to compare the profitability of the project, and it is use of cash flow rather than accounting profit which is a more objective basis. In addition, it is believed that the investment recovery period is short, low-risk projects. Furthermore, in short-term, this way can reduce the risk of loss through the obsolescence. Beside these, it useful as a measure of liquidity, a more direct return of cash is preferred.Disadvantages of it:Initial, it ignored risk and time value of money, further it ignores cash flows after initial outflow has been met. In addition, it is ignoring the fact that benefit from different projects may accrue at uneven rate. There is no allowance for interest and the initial capital investment2.4.3 Recommendations for investment decisionSome recommendations for the company:As leader, the actual profit is indispensable for them who should consider the value of the time rather than they can use a single formula to calculate the rate of return.In my opinion, Payback period will take four years and one-and-half month to return the investment capital, It is slowly growing and can return, if the leader decisions long-term investment, I think that it is reasonable to accept this project.Nonetheless, by calculates the net present values, it seems that the deficit, which means that the annual cash flows are not enough to allow more interest to be deducted and still repay the original investment. This investment is unworthy while as it less than 10% return. This is because too much interest has been deducted to allow all the capital to be repaid. If consideration the method, I suggest that the company can reject this project.2.5 Other non-financial factorsAs the leaders, they need consideration the whole factors such as non-financial factors to make decision as follows:For Technological factors, it is mostly importance to company because it is changing rapidly; the company purchases these products whether they can meet the organization development in the future.For government, whether government supports are produced or use these products.For environment, and the products have effect for environment, such as carbon dioxide, it will lead to the global warming, as the company, it has responsibility for communities.In addition, the human resource factors, whether the company need hire the new staff to achievement the organization’s goals.3.0 ConclusionThe report can help the company make the flex budget, and then by variances analysis and use the two methods to analysis the investment, further it can help the company choose the best investment to gain the maximum profits.4.0 ReferenceBooks:SQA Unit Student Guide (2005): DG6M 34-International Marketing: An Introduction, China Modern Economic Publishing House.Appendix 1Tricol Plc Flexed budgedDue to difficult trading conditions, actual production of June was 80% of the target amount. We can get next chart:The calculation of the variances and the variance rateDirect material total variance(Standard units of actual production × standard price) – (actual quantity ×actual price) [(4kg×1600)×£10] –£61600= £64000 –£61600=£2400 ( F )The rate for direct material total variances is £ 2,400/£ 64,000×100%=3.75%Direct material usage varianceStandard price× (standard units of actual production-actual units)£10×(4kg×1600-5600kg)=£10×800kg=£8000 (F)The rate of direct material usage variance is £ 8,000/£ 64,000×100%=12.5%Direct material price varianceActual quantity×( standard price-actual price)5600kg×( £10 - £11)=5600kg×£1=5600 (A)The rate of direct material price variance is £ 5,600/£ 64,000×100%=8.75%Note: When adding the price and usage variances equal the total variance. Therefore, £5600(A) (price)+£8000(F) (usage) = £2400(F) (total).Direct labour total variance( Standard hours of actual production × standard rate ph) -(actual hours × actual rate ph)[(2h×1600)×£9] -(3520h×£10)=(3200h×£9)-£35200=£28800 -£35200=£6400(A)The rate of direct labor variance is 6400/28800×100%=22.2%Direct labour efficiency varianceStandard rate ph ×( standard hours of actual production-actual hours)£9×[2h×1600-3520h]=£9×(3200h-3520h)=£9×320h=£2880(A)The rate of direct labors efficiency variance is £ 2,880/£ 28,000×100%=10%Direct labour rate varianceActual hours×( standard rate ph-actual rate ph)3520h×(£9-£10)=3520h×£1=£3520(A)The rate of direct labors rate variance is £ 3,520/£ 28,800×100%=12.2%Note: When adding rate and efficiency variances equal the total variance. Therefore, £3520(A) (rate)+£2880(A) (efficiency) = £6400(A) (total).Total Overhead variance(Standard insurance cost-actual insurance cost)+(standard administration overheads -actual administration overheads)(£2200-£2400)+(£2000-£2200)=£200(A)+£200(A)=£400(A)The rate of overhead total variance is £ 400/£ 4,200×100%=9.52%Appendix 3Calculation of net present value at 10%Appendix 4Payback period method:In 5 Year, the cash inflows for the full year are £320,000 but only £40,000 is return the initial investment. Payback= 40000/320000*Year = 1/8 Year = 1.5months Payback will take 4 year 1.5months.。
HND财政预算报告范本(英文版)(pdf 8页)更多企业学院:《中小企业管理全能版》183套讲座+89700份资料《总经理、高层管理》49套讲座+16388份资料《中层管理学院》46套讲座+6020份资料《国学智慧、易经》46套讲座《人力资源学院》56套讲座+27123份资料《各阶段员工培训学院》77套讲座+ 324份资料《员工管理企业学院》67套讲座+ 8720份资料《工厂生产管理学院》52套讲座+ 13920份资料《财务管理学院》53套讲座+ 17945份资料《销售经理学院》56套讲座+ 14350份资料《销售人员培训学院》72套讲座+ 4879份资料IntroductionTricol plc a company who makes a range of furniture and kitchenware. And one of its most popular products is the ‘Zupper’expandable table.The purpose of writing this report is to do the variance analysis, project evaluation and to compare the budget and actual data by using the technique.FindingsPart APossible Reason for Variances1. MaterialDirect Material – Total - £2,400 F made up:Direct Material Usage –£20000 F(Level of significance –usage/total budgeted Material costs = 8,000/64,000 = 12.5% > 3%, should be reviewed)2000 kg less materials are used than budgeted for the actual level of production. Possible reason may be using the higher-grade material with less wastage. Or the new machinery use less materials and incurs less wstage.Direct Material Price –£5,600 A(5,600/64,000=8.75% >3%)It is £1 per kg more expensive than plannedPossible reason:New material supplier does not give discounts for materials.Hither-grade materials have been used which is more expensive.2. LabourDirect Labour Total - £6,400ADirect Labour Rate –£3,520A(3,520/28,800=12.2%>3%)On average, the actual labour rate is £1/hour higher than budgetedPossible reason:The wage settlement is higher than expectedThe new machine requires trainings so that overtime required more than expected.Direct labour Efficiency - £2000 A>3%)4.16%Actually, more than 200 labour hours have been used than budgeted. Possible reason:New machinery requires more hours for training..Human resource issues – the skilled operatives is not enough.3.Total Overhead - £600 FRate is 4.70%Unpredicted increase in insurance and Administration costsPossible reason:New machinery brings more expensive insurance, higher maintenance and additional administrative costs.Part B1. Key assumptions made:a)There is no taxation and inflation.b)Assumed that there is no vary given return market rate.c)The total cost of the project will be payable at the startd)The expected revenue from the investment – this is the expected Net CashFlow after deduction of all relevant costs2. PaybackPayback in this case is 4.125 years (total investment-return period is five years). So the company can get back the investment.The Net Present Value is £- 64,800. It indicates that the project does not appear to be financially viable.ConclusionPart BThis project is available because the payback is 4.125years.But the Net Present Value (NPV) is negative. So the project is not available. However, we should use the conclusion of the Net Present Value because the Net Present Value (NPV) considered the time value of money. RecommendationsPart ARecommendations for management action:1.All the variances should be analysis because all of them are above 3%, thelevel of significance.2.Particularly, the direct labour variances need further investigation – why isthe company paying a higher wage rate but the labour productivity is lower than planned.Part B1.To consider the effect of the new facilities on company’s own staff –interms of employment and redeployment opportunities.2.To consider any changes in any other areas, like social, political, economic,legal and technological factors.3.Whether it is possible for the company to raise the sufficient funds –toconsider if the current cash flow position can support such an investment.AppendixPart A1.Table 1 Tricol plc Flexed Budget for JuneTricol plc Flexed Budget For JuneFixed Budget 2,000 units Flexed Budget1,600 unitsActual1,600 unitsVariance££££A/FDirect Material 10*4*2,000=80,000 10*4*1,600=64,00061,600 2,400 FDirect Labor 2*9*2,000=36,000 2*9*1,600=28,80035,200 6,400 AVariable Production Overheads 2*2,000=4,0002*1,600=3,2003,200 0Insurance costs 2,200 2,200 2,400 200 A Depreciation 1,500 1,500 1,500 0Rent and Rates 2,500 2,500 2,500 0 AdministrationOverheads2,000 2,000 2,200 200 AFixed Overheads 8,200 8,200 8,600 400 A Total 128,200 104,200 108,600 4,400 A2.Further Variance AnalysisThe calculation of the variancesa)Direct material total :(Budgeted Quantity*Budgeted Price) – (Actual Quantity*Actual Price)=(4kg*1,600*£10per kg) - (5,600kg*£11 per kg)=£64,000-£61,600=£2,400 F b)Direct material usage :Budgeted price* (Budgeted Quantity – Actual Quantity)=£10per kg * (4kg * 1,600-5,600kg)= £8,000 Fc)Direct material price :Actual Quantity* (Budgeted price –Actual price)=5,600kg*(£10 per kg -£11 per kg)=£5,600Ad)Direct labor total :Budgeted Hours*Budgeted Rate – Actual hours*Actual Rate=(2hours*1600*£9)- £35200=£6,400Ae)Direct labor rate :Actual Hours*(Budgeted Rate – Actual Rate)=3,520hours*(£9-£10)= £3,520Af)Direct labor efficiency :Budgeted Rate*(Budgeted Hours – Actual Hours)=£9-(2hours*1600-3520hours)= £2,880Ag)Total overhead :(Budget Variable Overhead + Budget Fixed Overhead) - (Actual Variable Overhead + Actual Fixed Overhead) = (£4000 + £8200) - (£3200 + £8600) = £400 FPart B1. Payback period methodYear Yearly netcash flow£Cumulative cash flow£0 (1,000,000) (1,000,000)1 160,000 (840,000)2 160,000 (680,000)3 320,000 (360,000)4 320,000 (40,000)5 320,000 280,000Net cash benefits 280,000 280,000 Payback = 4 + 40,000/320,000= 4.125 years2. Discount cash flow technique(net present value) Calculation of Net Present Value(NPV)at 10%Year Annualcash flow Present valuefactors at10%Present Value£££0 (1000,000) 1.000 (1,000,000)1 160,000 0.909 145,4402 160,000 0.826 132,1603 320,000 0.751 240,3204 320,000 0.683 218,5605 320,000 0.621 198,720 935,200 Net PresentValue (NPV)(64,800)。