环境科学与工程英文版教材
- 格式:doc
- 大小:283.00 KB
- 文档页数:7
环境工程(代码:083002)一、培养目标培养面向世界,面向未来,面向现代化,德智体全面发展的高层次从事环境工程研究及实践的专门人才。
具体要求是:1.具有扎实的环境科学理论基础,了解国内外环境工程的进展和动态,掌握环境工程的进展和动向,掌握环境工程的基本技能和研究方法,能独立从事一般性环境工程的基础研究。
学位获得者应具有良好的科学素质,能胜任高等院校、科研单位、设计部门以及国家、地方部门的教学和科研等工作。
2.掌握环境工程专业坚实的基础理论和系统的专业知识,具有独立从事科学研究、教学工作或担任专门技术工作的能力。
3.掌握一门外国语,并能运用该门外国语比较熟练地阅读本专业的外文资料;具有一定的从事环境工程专业业务工作的能力和适应相邻专业业务工作的能力和素质。
4.具有健康的体魄和心理素质。
二、学习年限1、学习年限:硕士研究生学制为3年,培养年限最长不超过4年。
在完成培养要求的前提下,对少数学业优秀的研究生,可申请提前毕业或攻读博士学位。
在规定学制内,未达培养要求的,可以申请延长学习年限,延长期满仍未完成学业者,按退学处理。
2、学分:在学习期内,课程最低要求为31学分(见下表),另有专业实践和学术活动各2学分,合计35学分。
三、研究方向1、工业废弃物处理与资源化研究工业废水、废气、废渣的污染物迁移与转化规律,开发工业废弃物的净化处理与资源化利用技术。
2、土壤污染治理与生态修复研究污染土壤修复的机理与过程调控技术;污染土壤修复的原位与异位修复技术体系;矿区土壤复垦理论与技术。
3、水与大气污染控制与资源化饮用水、废水处理及回用技术开发研究、污染状况的监测与评价;针对煤烟型大气污染从源头开始进行煤炭、煤系固废燃烧过程和燃烧后的除尘、降尘、减少SO2排放等技术开发。
四、课程设置(参见附表“教学进度表”)1、课程设置(参见附表“教学进度表”)2、补修课程以同等学力入学和跨专业入学的学生,必须补修3门环境工程学科核心课程,学分另计,但不能顶替所攻读学位的课程学分。
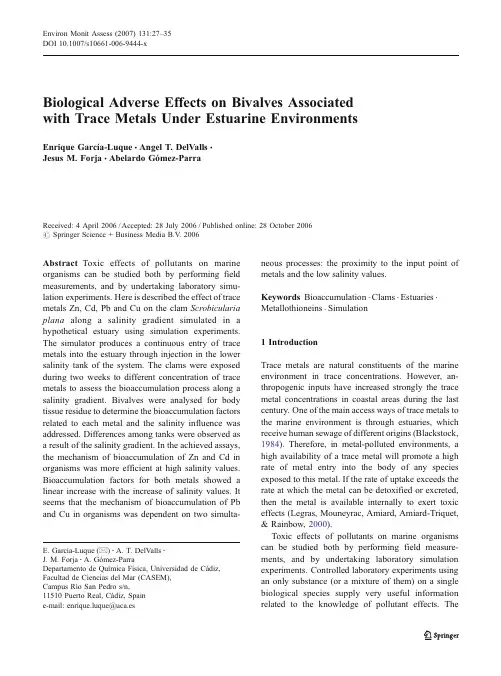
Biological Adverse Effects on Bivalves Associated with Trace Metals Under Estuarine EnvironmentsEnrique García-Luque&Angel T.DelValls&Jesus M.Forja&Abelardo Gómez-ParraReceived:4April2006/Accepted:28July2006/Published online:28October2006#Springer Science+Business Media B.V.2006Abstract Toxic effects of pollutants on marine organisms can be studied both by performing field measurements,and by undertaking laboratory simu-lation experiments.Here is described the effect of trace metals Zn,Cd,Pb and Cu on the clam Scrobicularia plana along a salinity gradient simulated in a hypothetical estuary using simulation experiments. The simulator produces a continuous entry of trace metals into the estuary through injection in the lower salinity tank of the system.The clams were exposed during two weeks to different concentration of trace metals to assess the bioaccumulation process along a salinity gradient.Bivalves were analysed for body tissue residue to determine the bioaccumulation factors related to each metal and the salinity influence was addressed.Differences among tanks were observed as a result of the salinity gradient.In the achieved assays, the mechanism of bioaccumulation of Zn and Cd in organisms was more efficient at high salinity values. Bioaccumulation factors for both metals showed a linear increase with the increase of salinity values.It seems that the mechanism of bioaccumulation of Pb and Cu in organisms was dependent on two simulta-neous processes:the proximity to the input point of metals and the low salinity values.Keywords Bioaccumulation.Clams.Estuaries. Metallothioneins.Simulation1IntroductionTrace metals are natural constituents of the marine environment in trace concentrations.However,an-thropogenic inputs have increased strongly the trace metal concentrations in coastal areas during the last century.One of the main access ways of trace metals to the marine environment is through estuaries,which receive human sewage of different origins(Blackstock, 1984).Therefore,in metal-polluted environments,a high availability of a trace metal will promote a high rate of metal entry into the body of any species exposed to this metal.If the rate of uptake exceeds the rate at which the metal can be detoxified or excreted, then the metal is available internally to exert toxic effects(Legras,Mouneyrac,Amiard,Amiard-Triquet, &Rainbow,2000).Toxic effects of pollutants on marine organisms can be studied both by performing field measure-ments,and by undertaking laboratory simulation experiments.Controlled laboratory experiments using an only substance(or a mixture of them)on a single biological species supply very useful information related to the knowledge of pollutant effects.TheEnviron Monit Assess(2007)131:27–35DOI10.1007/s10661-006-9444-xE.García-Luque(*):A.T.DelValls:J.M.Forja:A.Gómez-ParraDepartamento de Química Física,Universidad de Cádiz, Facultad de Ciencias del Mar(CASEM),Campus Río San Pedro s/n,11510Puerto Real,Cádiz,Spaine-mail:enrique.luque@uca.esdevelopment of this kind of bioassays is essential to assess the real impact produced by pollutants.In this study,the adverse effects produced by trace metals on estuarine clams have been characterised using a dynamic simulator of estuaries by conducting different bioassays in which clams were exposed to a dynamic flow of trace metals.The idea of dynamic simulation is basically similar to that described by Bale and Morris(1981).Nevertheless,the dimensions and the features offered by this new simulator are considerably greater(for example,with this system tidal effects also can be simulated).The metals selected for these experiments were Zn, Cd,Pb and Cu.Among benthic species,bivalve molluscs are characterised by being able to accumulate trace metals in concentrations proportional to those present in water or in sediments.Therefore,bivalve molluscs have been used to monitor bioavailability of such contaminants(Pavicic,Skreblin,&Raspor, 1987).The biological species selected in this study was Scrobicularia plana due to its ubiquity,local abundance and importance in the estuarine trophic chain(Ruiz,Bryan,Wigham,&Gibbs,1995).In fact, Scrobicularia plana is an infaunal species commonly inhabiting the intertidal soft bottoms of Northeast Atlantic estuaries,from the Norwegian Sea into the Mediterranean and south to Senegal(Tebble,1966).The general objective of this study is to character-ise the adverse effects produced by trace metals on estuarine clams by means of a dynamic simulator.For this,it has been necessary to quantify the trace metal concentrations in the soft body tissue from specimens of Scrobicularia plana,to calculate the bioaccumula-tion factors for the four trace metals selected and to determine the concentration of metallothioneins in specimens of Scrobicularia plana collected from each tank(as biological response determined).2Materials and Methods2.1Simulator descriptionThe simulator system consists of eight tanks(Plexiglas, cylindrical,and of about10l capacity)interconnected under a hydrodynamic regime(Figure1).The upper tank is supplied with fresh water.The lower tank is supplied with seawater sampled in a clean coastal area. From the lower to the upper tanks,there is a forced flow of water controlled by peristaltic pumps.In the inverse direction,filling the containers in series with fresh water generates a down flow.This permits a constant volume of10l to be maintained in each tank.The flow and temperature control is carried out by a personal computer using specific software devel-oped in Visual Basic and an AID21-bit translation card.The regulation of flow involves setting-up the peristaltic pumps(Masterflex,7521-55)in phase with the flow meters(McMillan Company,111).The temperature is controlled by means of coated dip heaters through thermistor probes.The water mixture is kept homogeneous in each tank by using variable-velocity mechanical stirrers.A more detailed descrip-tion of this system has been previously reported by García-Luque,Forja,DelValls,and Gómez-Parra (2003).After15days,adsorption of metals onto wall tanks can be neglected because this process has a kinetic order of about hours instead of days,reaching stationary state before the first24h.2.2Experimental designThe area of marine influence of a typical estuary was simulated.Specifically,the salinity gradient simulated was comprised between values of10and36,to avoid osmotic impact on the clams.Prior to the beginning of the assay,the clams were purified during10days in an aquarium of70l thanks to a continuos flux of oxygenated water.After this, the specimens of the clam Scrobicularia plana(10per aquarium;average length: 4.4cm;average wet weight:2.5g)were placed in each tank after two weeks of previous acclimatisation period to each salinity value under controlled conditions.Then,a solution with known concentration of the four metals was injected in the lowest salinity tank of the system in a continuous flow by means of a peristaltic pump. (The measured trace metal concentrations in this solution were Zn:Cd:Pb:Cu,5:0.2:1:2mg·l−1,respec-tively).This metal injection was diluted as it reached succeeding tanks.Dilution is result of two processes: the hydrodynamic regime and the inherent reactivity of trace metals along a salinity gradient.The exposure period of the bioassay was15days.After this,clams were collected to assess possible adverse effects (bioaccumulation,metallothionein synthesis)derived of their exposure to trace metals.Parallel to theexperiment,10clams were maintained in a reference aquarium(absence of introduced metals).Along the experiments,some physicochemical parameters(salinity,temperature,pH and dissolved oxygen)were measured in each tank of the simulator to ensure the correct development of the assays.2.3Data calculation and statistical analysisThe results obtained for salinity values,concentration of the four dissolved trace metals,concentration of trace metals bioaccumulated and concentration of metallothioneins were related by means of factor analysis,using principal components(PCA)as the extraction procedure,which is a multivariate statistical technique(MAA)to explore variable distributions.The objective of PCA is to derive a reduced number of new variables as linear combinations of the original varia-bles.This provides a description of the structure of the data with the minimum loss of information.The factor analysis was performed on the correlation matrix,i.e., the variables were auto-scaled(standardised)so as to be treated with equal importance(DelValls&Chapman, 1998).All analyses were performed using the PCA option of the FACTOR procedure,followed by the basic setup for factor analysis procedure(P4M)from the BMDP statistical software package(Frane,Jennrich, &Sampson,1985).The sorted rotated factor loadings are coefficients correlating the original variables and the principal components in this analysis.The variables are reordered so the rotated factor loadings for each factor are grouped together.In this study,we selected to interpret a group of variables as those associated with a particular component where loadings were0.35 or greater,corresponding to an associated explained variance of more than35%.2.4Analytical techniquesPrior to sampling and setting-up the simulations,all equipment,filters,beakers and containers used were thoroughly cleaned with acid(10%HNO3)and then rinsed in reagent grade water(Milli-Q).Figure1Schematic represen-tation of the estuarine hydro-dynamic simulation system (adapted from García-Luque et al.,2003).The salinity was determined by means of an induction salinometer (Beckman RS-10).The total concentration of dissolved trace metals (Zn,Cd,Pb,Cu)was assessed in water samples using a differential pulse anodic stripping voltametry (DPASV),after a digestion procedure with UV radiation (4h)at 85°C (Metrohm,705UV).Measurements were made with static drop mercury electrode (SMDE),using a Metrohm 693processor as reported by Gómez-Parra,Forja,DelValls,Sáenz,and Riba (2000).The analyt-ical procedure for dissolved metals was checked using reference material CASS3with an accuracy of ±90%.All samples were measured at the end of the experiment.Nevertheless,the system had reached stationary state when the injection of the trace metal solution to the system was carried out.Therefore,measured concentrations at the end of the assays are similar than those found during the experiment.To analyse the residue of tissue body for trace metals and to address the bioaccumulation process,organisms were lyophilised and pounded prior to an acidic digestion with nitric acid and hydrogen perox-ide during 1h at 95°C.Samples (previously filtered)were analysed by atomic absorption spectrophotome-try.The concentrations of trace metals Zn and Cu in the samples were determined with a Perkin-Elmer 2100Flame atomic absorption spectrophotometry.The trace metals Cd and Pb were measured by graph-ite furnace atomic absorption spectrophotometry (Perkin-Elmer,4100ZL).The concentration of metallothioneins was ana-lysed on the total body of the organisms at the end of the experiment through Anodic Stripped V oltammetry in the heat stable fraction (the supernatant of the second centrifugation),based on the protocol outlined by Olafson and Olsson (1991).Rabbit liver metal-lothionein (Sigma)was used as reference for the standard addition calibration curve.Total content of protein determination was based on the Bradford method (1976).Metallothionein concentration was expressed in relation to total protein content.3Results and DiscussionFigure 2shows the concentrations of dissolved trace metals along the salinity gradient obtained during the bioassay.In all cases,it can be observed how obtained values are below the theoretical dilution line,showing a non-conservative behaviour for all the metals assessed.Therefore,a high chemical reactivity is shown mainly at low salinity values.The non-conservative behaviour of these metals has been reported for other estuaries (e.g.,Benoit et al.,1994;Windom et al.,1991).Although the behaviour of the assessed metals in the simulation assay is non-conservative,the decreases in concentration in the dissolved phase with salinity show a similar pattern.The trace metalSalinity1620242832[C u ] (p p b )20406080Salinity1620242832[P b ] (p p b )10203040[C d ] (p p b )481216[Z n ] (p p b )4080120160200240Figure 2Concentration of dissolved Zn,Cd,Pb and Cu along the salinity gradient achieved at the bioassay.Dotted line shows the theo-retical dilution line;solid line shows exponential fittings for variations of metal concen-tration with salinity values.concentration gradients versus the salinity increase are described by the following exponential equation:C ¼a þb Áe Àc ÁSð1Þwhere C is the trace metal concentration in the dissolved phase,S is the salinity,and a ,b ,and c are the fitted parameters for each metal.Values for these parameters as well as the correlation coefficients for the equation are shown in Table I .The trace metal concentrations in the soft body tissue from three specimens of Scrobicularia plana collected in each tank of the simulator also was quantified.Figure 3shows the concentrations of bioaccumulated Zn,Cd,Pb and Cu along the salinity gradient in the clams (concentration of metals in biological tissues is expressed taking into consider-ation wet weight of the tissues).In this figure,two different behaviour patterns can be observed.Theconcentrations of Zn and Cd do not show a clear pattern with the salinity increase.On the other hand,the concentrations of Pb and Cu exhibit a decrease with the salinity increase.In fact,bioaccumulation for both metals (Pb and Cu)decreases exponentially with salinity describing an equation similar to expression (1),with correlation coefficients of 0.889for Pb and 0.988for Cu.Bioaccumulation factors (BCFs)for the four trace metals have been calculated also.These factors are calculated as the ratio between the concentration of the bioaccumulated metal and the concentration of the dissolved metal.Obtained results are showed in Figure 4.The bioaccumulation factors for Zn and Cd increase following lightly a linear pattern with the salinity increase.It indicates that the bioaccumulation of Zn and Cd is more effective when salinity increases.Therefore,at high salinity values,the amount of bioaccumulated trace metals (Zn and Cd)is about the same that at low salinity values (Figure 3),although Zn and Cd concentrations in water decrease with the salinity increase (Figure 2).The BCF for Pb does not show a clear trend with the salinity,and varies around an average value (850l kg −1).Therefore,the bioaccumulation of Pb could not depend on salinity values,being controlled by the amount of dissolved Pb along the salinity gradient.Thus,at high salinity values,where dissolved PbTable I Fitted parameters corresponding to Equation (1)(and correlation coefficients)calculated for the trace metal (Zn,Cd,Pb and Cu)concentrations versus salinity values during the bioassayab c r 2Zn 98.23263.7·1050.560.745Cd 4.531539.940.310.739Pb 6.764197.420.290.885Cu20.11743.180.150.932[Z n ] (µ g ·g -1)200300400[C d ] (µ g ·g -1)0.350.400.450.500.55Salinity1620242832[C u ] (µ g ·g -1)020406080Salinity1620242832[P b ] (µ g ·g -1)0102030Figure 3Concentration of Zn,Cd,Pb and Cu bioaccumulated by specimens related to their total weight along the salinity gradient achieved at the bioas-say (metal concentration is expressed taking into consider-ation wet weight of the tissues).concentration is low,it is measured the lowest bio-accumulation for Pb (Figure 3).The variation of BCF for Cu along the salinity gradient is shown in Figure 4.The BCFs are higher at low (16–22)than at high salinity (24–32)values.It could inform that bioaccumulation of Cu is higher at low than at high salinity values.To assess possible adverse effects derived from the exposure of clams to trace metals at different salinity values,the concentration of metallothioneins in speci-mens of Scrobicularia plana collected from each tank has been analysed.Summarised results of metal-lothionein concentrations and total proteins concen-trations in analysed clams are shown in Table II .The metallothionein concentration shows intersite differ-ences that could be associated with the salinity gradient in the simulated estuary.Recent studies (e.g.,Legras et al.,2000;Mouneyrac,Amiard-Triquet,Amiard,&Rainbow,2001)indicate the existence of a relationship between salinity and metallothionein concentration.Salinity gradient in an estuary influen-ces on the chemical speciation of the trace metals and,therefore,on its bioavailability.The results obtained for salinity values,concentra-tion of the four dissolved trace metals,concentration of trace metals bioaccumulated and concentration of metallothioneins were linked by means of a MAA.The application of PCA to the chemical data represents the original variables by four new variables,or principal factors (Table III ).These factors explain 94.5%of the variance in the original data set.The loadings following varimax rotation for the four factors are given in Table III .Each factor is described according to the dominant group of variables.Table II Concentration of metallothioneins (MTs,μg)normalised to the total content of proteins (Tot.prot.,mg)measured in the soft body of individuals of the clam Scrobicularia plana collected from each tank in the simulatorTank 1Tank 2Tank 3Tank 4Tank 5Tank 6Tank 7Tank 8MTs/Tot.prot.(μg mg −1)Specimen A 70.4347.2730.9733.4845.1374.5199.3378.92Specimen B 45.8048.8649.4237.2965.5668.69111.9067.21St.dev.17.42 1.1313.05 2.6914.45 4.128.898.27Total proteins (mg ml −1)Specimen A 1.63 2.48 2.33 2.22 4.69 1.62 2.60 1.06Specimen B1.342.11 1.41 1.96 1.63 2.19 1.22 1.42St.dev.0.200.260.650.192.160.410.980.26Standard deviation values are also expressed.B C F Z n (l ·k g -1)10002000300040005000B C F C d (l ·k g -1)4080120Salinity1620242832B C F P b (l ·k g -1)40080012001600Salinity1620242832B C F C u (l ·k g -1)2004006008001000Figure 4Bioaccumulation fac-tors (BCFs)calculated for Zn,Cd,Pb and Cu along the salin-ity gradient achieved at the bioassay.The first principal factor,#1is predominant and accounts for 70.41%of the total variance;this factor could be called ‘Influence of salinity on concentration of dissolved and bioaccumulated trace metals.’This component shows positive loadings on the concentra-tion of dissolved Zn,Cd,Pb and Cu,and the concentration of bioaccumulated Pb and Cu.A negative loading has been founded for the salinity.Clearly,this component relates inversely the concen-tration of the four dissolved trace metals and the concentration of bioaccumulated Pb and Cu with salinity.Therefore,at high salinity values,low concentrations of dissolved trace metals and low concentrations of bioaccumulated Pb and Cu are quantified.Besides,it confirms that the values of bioaccumu-lated Pb and Cu are related to the concentrations of dissolved Pb and Cu in a direct way.Amiard,Amiard-Triquet,Berthet,and Metayer (1987)described a similar behaviour for both metals.They indicated that field and laboratory studies conducted using individ-uals of the clam Scrobicularia plana and another species show that the bioaccumulated trace metals depend mainly on environmental levels of these metals.On the other hand,the bioaccumulation of Zn and Cd is not associated with this factor,so could be prevailing at high salinity values as has been discussed previously for the BCF of these two metals.The second factor,#2accounts for the 13.41%of the total variance and could be called “Influence of the physicochemical variable ‘salinity ’on metal-lothionein synthesis.”This component shows nega-tive loadings on the salinity and the concentration of metallothioneins.This component relates lightly these two variables.It could indicate that,under theconditions of this bioassay,a physicochemical vari-able (salinity)shows higher influence in the induction of metallothioneins than the concentration of trace metals (dissolved or bioaccumulated).The third factor,#3accounts for the 7.12%of the total variance (a low loading of the total value)and could be called ‘Bioaccumulation of Cd in soft body tissue clam.’This factor shows only positive loading on the concentration of bioaccumulated Cd.It could inform that the influence of the different variables was not addressed under the conditions of this bioassay,so other processes should be affecting the bioaccumula-tion of this metal.The fourth factor,#4,could be called ‘Bioaccumu-lation of Zn in soft body tissue clam.’It is the only factor in which the concentration of Zn in clams is2Factor 1Factor 22-2-2Tank 1Tank 5Tank 7Tank 6Tank 3Tank 4Tank 2Tank 8(13.41%)(70.41%)Figure 5Distribution of the different cases (represented by the tanks of the simulator)in the space defined by factors 1and 2(F1:70.41%of the total variance and F2:13.41%of the total variance).Variable Factor 1(70.41%)Factor 2(13.41%)Factor 3(7.12%)Factor 4(3.56%)t3.1Salinity −0.8248−0.4823––t3.2Diss.[Zn]0.8069––0.4216t3.3Diss.[Cd]0.7973––0.4294t3.4Diss.[Pb]0.8422––0.3810t3.5Diss.[Cu]0.8351–––t3.6Bioacc.[Zn]–––0.9142t3.7Bioacc.[Cd]––0.9397–t3.8Bioacc.[Pb]0.8698–––t3.9Bioacc.[Cu]0.7348––0.6160t3.10[MTs]–−0.9491––t3.11Table III Sorted rotated factor loading (pattern)of 10variables on the bioassay The loading matrix has been rearranged so that the col-umns appear in decreasing order of variance (in brack-ets)explained by factors.Only loading greater than 0.35is shown in table.Factors are numbered con-secutively from left to right in order of decreasing vari-ance explained.included,but with the lowest variance explained (3.56%).So,its description should be taken with caution.Figure5shows the ordination of the cases (represented by the tanks of the simulator)in the space defined by factors1and2(83.8%of the total variance,as a whole).Tanks1and8represent two extreme situations.Tank1shows the highest score for Factor1,so the highest dissolved concentrations for the four metals and the highest concentrations of Pb and Cu in clams can be found at salinity value of Tank1(18).Tank8represents the opposite situation: dissolved concentrations for the four metals and concentrations of Pb and Cu in clams show the lowest values.The rest of the tanks show intermediate situations.This behaviour is related to the distance of each tank to the input point of metals into the system. On the other hand,Tanks5,6and7show a relatively significant induction of metallothioneins,being Tank 7where this process is specially marked(This Tank shows the highest score for Factor2).The other two factors(3and4)are not shown in Figure5owing to the low proportion of the total variance explained by them.4ConclusionsIn this study,adverse effects provoked by trace metals on estuarine clams have been characterised using a dynamic simulator.The bioaccumulation factors related to each metal and the salinity influence were addressed.Under conditions employed in these bio-assays,it could be inferred that:(1)The mechanism of bioaccumulation for Zn andCd in clams was more efficient at high salinity values.Therefore,bioaccumulation factors for both metals showed a linear increase with the increase of salinity values.(2)It seems that the mechanism of bioaccumulationfor Pb and Cu in bivalves was dependent on two simultaneous processes:a)the proximity to the input point of trace metals employed and b)the low salinity values.(3)The process of induction of metallothioneins inthis experiment is more related to existing salinity values than concentration of the metals employed.Acknowledgments This research was supported by projects with Spanish Ministries:‘Ministerio de Ciencia y Tecnología’(REN2002-01699)and‘Ministerio de Fomento’(PATRIM/PR/ 2002-139).ReferencesAmiard,J.C.,Amiard-Triquet,C.,Berthet,B.,&Metayer,C.(1987).Comparative study of the patterns of bioaccumu-lation of essential(Cu,Zn)and non-essential(Cd,Pb) trace metals in various estuarine and coastal organisms.Journal of Experimental Marine Biology and Ecology, 106,73–89.Bale,A.J.,&Morris,A.W.(1981).Laboratory simulation of chemical processes induced by estuarine mixing:The behaviour of iron and phosphate in estuaries.Estuarine, Coastal and Shelf Science,13,1–10.Benoit,G.,Otkay-Marshall, A.,Cantu, A.,Hood, E.M., Coleman, C.H.,Corapcioglu,M.O.,et al.(1994).Partitioning of Cu,Pb,Ag,Zn,Fe,Al and Mn between filter-retained particles,colloids,and solution in six Texas estuaries.Marine Chemistry,45,307–336. Blackstock,K.J.(1984).Biochemical metabolic regulatory responses of marine invertebrates to natural environmental change and marine pollution.Oceanography and Marine Biology:Annual review,22,263–313.Bradford,M.M.(1976).A rapid and sensitive method for the quantitation of microgram quantities of protein utilizing the principle of protein-dye binding.Analytical Biochemistry, 72,248–254.DelValls,T.A.,&Chapman,P.M.(1998).Site-specific sediment quality values for the Gulf of Cádiz(Spain)and San Francisco Bay(USA),using the sediment quality triad and multivariate analysis.Ciencias Marinas,24,313–336. Frane,J.,Jennrich R.,&Sampson,P.(1985).Factor analysis.In:W.J.Dixon(Ed.),BMDP statistical software(pp.480–500).Berkeley:University of California.García-Luque,E.,Forja,J.M.,DelValls,T.A.,&Gómez-Parra,A.(2003).The behaviour of heavy metals from theGuadalquivir estuary after the Aznalcóllar mining spill: Field and laboratory surveys.Environmental Monitoring and Assessment,83,71–88.Gómez-Parra,A.,Forja,J.M.,DelValls,T.A.,Sáenz,I.,& Riba,I.(2000).Early contamination by heavy metals of the Guadalquivir Estuary after the Aznalcóllar mining spill (SW Spain).Marine Pollution Bulletin,40,1115–1123. Legras,S.,Mouneyrac,C.,Amiard,J.C.,Amiard-Triquet,C., &Rainbow,P.S.(2000).Changes in metallothionein concentrations in response to variation in natural factors (salinity,sex,weight)and metal contamination in crabs from a metal-rich estuary.Journal of Experimental Marine Biology and Ecology,246,259–279.Mouneyrac,C.,Amiard-Triquet,C.,Amiard,J.C.,&Rainbow, P.S.(2001).Comparison of metallothionein concentra-tions and tissue distribution of trace metals in crabs (Pachygrapsus marmoratus)from a metal-rich estuary,in and out of the reproductive parative Bio-chemistry and Physiology.Part C,129,193–209.Olafson,R.W.,&Olsson,P. E.(1991).Electrochemical detection of metallothionein.Methods in Enzymology, 205,205–213Pavicic,J.,Skreblin,M.,&Raspor,B.(1987).Metal pollution assessmet of the marine environment by determination of metal-binding proteins in Mytillus sp.Marine Chemistry, 22,235–248.Ruiz,J.M.,Bryan,G.W.,Wigham,G.D.,&Gibbs,P.E.(1995).Effects of tributyltin(TBT)exposure on thereproduction and embryonic development of the bivalve Scrobicularia plana.Marine Environmental Research,40, 363–379.Tebble,N.(1966)British bivalve seashells(p.212).London: British Museum Natural History.Windom,H.,Byrd,J.,Smith,R.,Hungspreugs,M.,Dharm-vanij,S.,Thumtrakul,W.,et al.(1991).Trace metal–nutrient relationships in estuaries.Marine Chemistry,32, 177–194.。
environmental engineering 书
1. 《环境工程学导论》(Introduction to Environmental Engineering):作者是Mackenzie L Davis和David A. Cornwell,这本书是环境工程领域的入门教材,涵盖了水质、水污染控制、废水处理、大气污染控制等内容。
2. 《环境工程学基础》(Fundamentals of Environmental Engineering):作者是James R. Mihelcic和Julie B. Zimmerman,这本书介绍了环境工程学的基本概念、原则和方法,包括水、废水、固体废弃物和大气污染控制等内容。
3. 《环境工程实践》(Environmental Engineering Practice):作者是N. K. Nema,这本书侧重于环境工程在实际项目中的应用,包括环境影响评价、环境管理系统、环境监测与调查等方面。
4. 《环境化学与环境工程》(Environmental Chemistry and Environmental Engineering):作者是James G. Speight,这本书结合环境化学和环境工程,介绍了环境污染的化学特性以及相应的治理技术。
环境科学与工程英文文献Environmental Science and EngineeringEnvironmental science and engineering is an interdisciplinary field that combines knowledge from various scientific disciplines to understand and address environmental issues. It encompasses the study of the natural environment, the built environment, and the interactions between them.One key aspect of environmental science and engineering is the study of air pollution. Air pollution refers to the presence of harmful substances in the air, which can have detrimental effects on human health and the environment. Research in this area focuses on identifying sources of air pollution, measuring air quality, and developing strategies to mitigate pollution. For example, studies may investigate the impact of industrial emissions on air quality in urban areas and propose technologies to reduce pollutant emissions.Water pollution is another important concern for environmental scientists and engineers. Water pollution occurs when harmful substances contaminate water bodies, making it unsafe for use or threatening the survival of aquatic organisms. Research in this area may involve studying the effects of agricultural runoff on water quality or developing technologies for wastewater treatment. Additionally, researchers may explore the impacts of climate change on water availability and quality.Environmental scientists and engineers are also involved in the field of waste management. This includes the study of wastegeneration, collection, and disposal methods. Researchers may investigate the environmental impact of different waste management practices and evaluate the efficacy of recycling and waste reduction programs. Innovative approaches, such as waste-to-energy technologies, may be explored to minimize the environmental impact of waste disposal.Another area of focus in environmental science and engineering is the study of renewable energy sources. With the increasing demand for energy and the need to reduce greenhouse gas emissions, researchers are exploring alternative energy options. This may involve studying the efficiency and environmental impacts of solar, wind, and biomass energy systems. Additionally, researchers may investigate the feasibility of energy storage technologies to ensure a reliable and sustainable energy supply. Overall, environmental science and engineering play a crucial role in understanding and addressing environmental challenges. By combining scientific knowledge and engineering principles, researchers aim to protect and preserve the natural environment for current and future generations. The application of innovative technologies and the development of sustainable practices are essential for promoting a clean and healthy environment.。
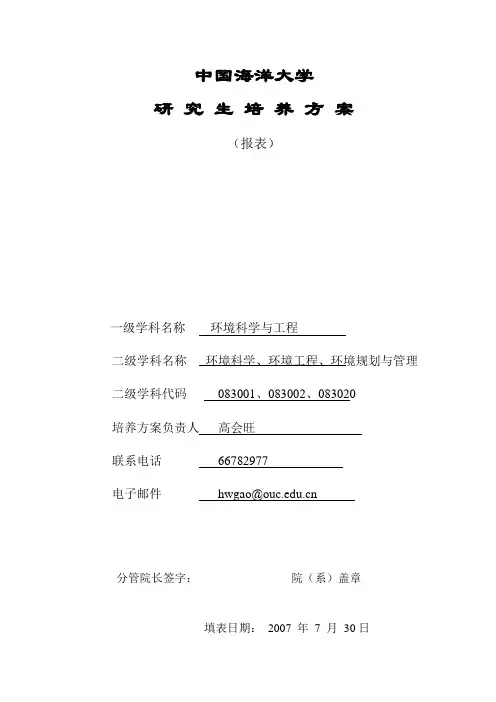
中国海洋大学研究生培养方案(报表)一级学科名称环境科学与工程二级学科名称环境科学、环境工程、环境规划与管理二级学科代码083001、083002、083020培养方案负责人高会旺联系电话66782977电子邮件hwgao@分管院长签字:院(系)盖章填表日期:2007 年7 月30日一级学科:____环境科学与工程_____________英文名称: Environmental Science and Engineering代码:____08300________________一、学科简介环境科学与工程学院设有环境科学与工程博士和硕士学位授予权一级学科,涵盖环境科学、环境工程、环境规划与管理三个博士点,环境科学、环境工程、环境规划与管理三个硕士点。
设有环境工程工程硕士点和管理工程硕士点。
设有环境科学与工程博士后流动站。
环境科学和环境工程两个二级学科均为山东省重点学科。
环境科学是国家重点学科,山东省“十五”和“十一五”强化建设的重点学科。
持有国家环境评价甲级证书。
海洋环境与生态教育部重点实验室是学院科学研究和人才培养的重要支撑。
本学科点现有教学科研人员68人(包括外聘12人),其中博士生导师2 2人(包括校外博导10人),教授33人(包括外聘12人),副教授16人,另有中国科学院院士1人,中国工程院双聘院士2人,“长江学者讲座教授”2人。
教学科研人员中81%具有博士学位,高级职称人员中70%具有国外留学或访问经历,45岁以下学术带头人及学术骨干占教师总数的70%,形成了以“长江学者讲座教授”、新世纪优秀人才、“973”课题、国家基金重大和重点项目负责人为学术带头人的学缘结构和年龄合理的学术团队。
经过“211工程”和“985工程”建设,本学科点和教育部重点实验室现有大型仪器设备总价值达2000余万元,形成了功能完备的海洋环境现场观测、室内分析测试和数值计算等研究和人才培养平台。
实验室总面积约4000m2。

环境科学与工程专业英语第四版Environmental Science and Engineering: A Vital Discipline for Sustainable Development.Environmental science and engineering, often referred to as environmental engineering, is a crucial field that focuses on addressing environmental issues through the application of scientific principles and engineering techniques. This interdisciplinary field integrates knowledge from various disciplines such as biology, chemistry, physics, and engineering to develop sustainable solutions for environmental protection and resource management.The fourth edition of the textbook "Environmental Science and Engineering" is an comprehensive guide to this field, covering a wide range of topics from the basics of environmental science to advanced engineering principles. This edition brings together the latest research and developments in the field, providing students andprofessionals with a robust understanding of the environmental challenges we face and the tools and techniques available to address them.One of the key features of this edition is its emphasis on sustainability. With the global push towards sustainable development, environmental engineering has become increasingly important. This textbook highlights the role of environmental engineers in developing sustainable solutions for energy, water, waste, and air pollution management. It also emphasizes the need for a holistic approach that considers both environmental and economic factors in decision-making.Another noteworthy aspect of this edition is its focus on innovation and technology. Environmental engineering is a rapidly evolving field, and this textbook keeps pace with the latest advancements in technology. It covers topics such as renewable energy, green building design, and sustainable transportation systems, highlighting the role of environmental engineers in developing and implementing these innovative solutions.The textbook also dedicates significant attention to environmental policy and regulations. It examines the role of governments and international organizations in promoting sustainable development and environmental protection. It also explores the legal and ethical frameworks that govern environmental engineering practices, ensuring that these practices are carried out in a responsible and sustainable manner.Moreover, the fourth edition of "Environmental Science and Engineering" includes numerous real-world case studies and examples. These case studies bring the theoretical concepts to life, allowing students and professionals to understand the practical applications of environmental engineering principles. They also provide insights into the challenges and opportunities faced by environmental engineers in various settings, from urban centers to remote regions.In conclusion, the fourth edition of "Environmental Science and Engineering" is an essential resource foranyone interested in understanding and addressing environmental issues. It provides a comprehensive overview of the field, covering its principles, applications, and challenges. With its focus on sustainability, innovation, and responsible practice, this textbook serves as a valuable guide for students, professionals, and anyone committed to building a more sustainable future.。
0830环境科学与工程一级学科简介一级学科(中文)名称:环境科学与工程(英文)名称:Environmental Sciences and Engineering一、学科概况伴随经济发展而出现的各种环境问题以及社会对解决环境问题的迫切需求,以研究与解决环境问题为核心任务的环境科学与工程学科应运而生。
二十世纪七十年代中后期,我国环境科学与工程学科开始萌芽于化学、物理、地学、土木建筑、给排水工程、化学工程、法学、经济等传统学科之中,经历过七、八十年代的发展起步阶段,以及九十年代的快速发展,环境科学与工程学科在研究与解决环境问题的过程中得到了长足发展,培养了大量不同类型环境科学与工程专业人才,对解决我国日趋严重的环境问题和实施可持续发展战略发挥了重要作用。
环境科学与工程是基于自然科学、工程科学与社会科学而发展起来的综合性交叉新兴学科,是一门研究人与环境相互作用及其调控的学科,主要研究人类-环境系统的发展规律,调控二者之间的物质、能量与信息的交换过程,寻求解决环境问题的途径和方法,以实现人类-环境系统的协调和持续发展。
环境科学与工程下含环境科学与和环境工程两个研究方向。
其中,环境科学专业涉及环境的自然科学、技术科学与人文社会科学领域,主要研究环境演化规律、揭示人类活动同自然生态系统的相互作用关系以及探索人类与环境和谐共处的途径与方法。
环境工程专业则涉及环境领域里的工程和技术问题,主要研究大气污染防治、水污染防治、固体废物处置与资源化、噪声控制,以及光、热、放射性和电磁辐射污染与防治等。
当前,人类社会面临复杂的发展与环境之间的矛盾,我国经济的持续高速发展面临巨大的环境压力,解决环境问题的知识需求以及大量专业人才的需求已经成为环境科学与工程学科进一步发展的动力源泉,二十一世纪将是环境科学与工程学科的蓬勃发展时期。
学科内涵将随着对环境问题研究的深入和对学科方法论的创新而日益丰富和完善,研究领域亦将随之不断深化与扩展。
环境科学专业英语教学大纲01.教学单位名称:环境与资源学院02.课程代码:64106203.课程名称:环境科学专业英语04.课程英文名称:Professional English in Environmental Science05.课程类别:学科基础课06.课程性质:选修07.课程学时:48学时08.课程学分:309.授课对象:环境科学专业本科生10.开课学期:5学期(秋季)11.选用教材:张晖等编著:环境科学与工程专业英语,科学出版社,2009年11月第二版12. 主要参考书:[1]胡龙兴编:环境科学与工程专业英语,中国石化出版社,2011年12月第一版[2]彭举威等编:新编环境科学与工程专业英语,化学工业出版社,2010年7月第一版13. 大纲执笔人:14. 课程中文简介:环境科学专业英语是为环境科学本科生开设的一门课程。
环境科学专业英语课程所选阅读材料均来自近年出版的英文原版教材,专著或其他文献资料,内容涵盖环境科学的各个研究方向,包括环境化学,环境生物学,环境生态学,环境规划与管理,环境经济学,环境法学,和环境工程蹙额等。
通过本门课的学习,学生应该能够掌握一定数量的环境科学专业词汇,学习专业构词表达法,最后能够较好的阅读,理解,翻译环境科学专业文献,提高学生在环境科学专业领域的英语应用能力。
15. 课程英文简介:Professional English in environmental science is a course opened to students majored in environmental sciences. All materials in this course were selected from original English textbooks, academic monographs, and other professional literature, and the those materials cover all aspects of environmental science, including environmental chemistry, environmental biology, environmental ecology, environmental planning and management, environmental economy, environmental laws, and environmental engineering. Through the study of this course, the students should learn some vocabulary and grammar in environmental science. By taking this class, the students should improve their overall English skill in environmental science, and they are expected to read, comprehend, and translate academic literature in the field.16. 课程包含的教学任务、教学要求和教学目的(1)教学任务Unit 1(3学时)Introduction of environmental engineering and scienceUnit 2(3学时)Finding solutions for tough environmental problemsUnit 3(3学时)Climate change and greenhouse effectUnit 4(3学时)Overview of ecological restorationUnit 5(3学时)Environmental security: an evolving conceptUnit 6(3学时)The process of environmental assessmentUnit 7(3学时)Introduction to environmental information systemUnit 8(3学时)International standard for environmental management system (ISO14000)Unit 9(3学时)Overview of environmental and resource economics as a subdiscipline in economicsUnit 10(3学时)Environmental analytical chemistryUnit 11(3学时)Wastewater treatmentUnit 12(3学时)Advanced wastewater treatmentUnit 13(3学时)Control of pollutant particlesUnit 14(3学时)Disposal of unprocessed refuse in sanitary landfillUnit 15(3学时)Planning and realization of soil remediationUnit 16(3学时)How to write a scientific paper(2)教学要求在每节课的学习中,学生应该掌握相关环境科学专业词汇熟练朗读,总并翻译相关课程材料了解相关环境科学专业英语表达法教学手段:以教师教授结合多媒体教学为主。
Environmental science and engineering环境科学与工程专业本文仅供低年级学生参考,大四的就可以直接忽略本文了。
关于环境科学与工程的专业介绍,环境科学与工程(ESE)官网上很详细,也很清楚;而至于课程安排介绍,官网上也详细的列了出从大一到大四要读的所有课程;委实不愿意浪费时间在做一遍重复。
所以,就大概讲一下就业吧。
本文所写的就业方向,仅供参考,而且也仅限经济不似现在这般萧条的情况下。
读者自斟。
水/污水处理四年学到的东西,很大一部分都和水有关,无论是新水的生产亦或是污水的处理。
包括工艺流程的设计,也包括相关设备的设计销售,很大一部分都是和当初所学的知识相近的。
在新加坡的这样的公司和工厂,虽然不是很大,但是前几年,职位需求缺口还是很大。
至于今年或者明后两年,基本上已经明确了不怎么需要新人。
甚至想PUB这样的政府机构,也说,我们现在对于环境工程这边,主要是内部消化自己培养的奖学金得主,甚至奖学金得主都没有机会做水这边。
一个重要的原因是,新加坡关于水,污水处理已经很先进了。
Waste(Energy)把waste和energy放在一起是因为很多时候,他们两个是紧密关联的。
包括新加坡的焚烧发电,印尼那边的微生物产生能源。
如何合理的处理利用废物,是一个很严峻的问题。
同样的,新加坡在这个领域做的很好,通过各式各样的招聘会等等,个人感觉,几乎没有职位缺口。
不过,在中国却是有很大的需求。
Air更多的是作为一个监测评估身份参与到对大气污染的管理中。
比如,建设奥运主体运动场时,ARUP就有自己专门的人员参与气体监测中。
不过,这种工作可遇不可求,学完ESE,会有能力去做,但是,结业面比较窄。
EIA&Auditing不明白EIA什么意思的可以去google。
新毕业的学生很少有人有机会做EIA或者Auditing,一是本身需求量不是很大,二是需要一些经验。
不过,还是有公司提供这样的职位给新毕业的学生。
Acid Deposition Research in NetherlandsPeking University Shenzhen Graduate SchoolLishui Road Nanshan District Shenzhen Guangdong Province, ChinaAbstract:The EMEP model is applied to simulate the atmospheric transport and deposition of acid pollutants in Europe’s atmosphere with a 50×50 km2horizontal resolution. The model evaluations for the past twenty years indicate that rather serious exceedances are found for the South and East of the Netherlands. Netherlands have exceeded the limits of acid deposition as regulated by the European mission in the Goteborg Protocol. The European mission requires that thsituation is remedied within 2 years. Large fractions of nitrogen oxide(s)(NO x) and sulfur dioxide(SO2) emitted in the Netherlands , are deposited in their neighbouring countries. So reduction of these pounds would not influence acid deposition in The Netherlands very much. As to ammonia, a large portion is deposited within the Netherlands. Hence it is concluded that only ammonia(NH3) reductions can be effective to reach the European air quality standards within the period. pared to other sources, agriculture is the main source of ammonia. So some proposed measures are necessary to reduce the ammonia production of agriculture, specially of the stock-raising. The feasible way is to develop the eco-ariculture and reuse the waste of livestocks.Keyword: EMEP model, Acid Deposition, Exceedance, Reductions1. IntroductionAlthough the nitrogen deposition in the Netherlands(NL) has slightly been reduced the last few years, and the acidifying deposition of sulphur has decreased sharply the last few years, The Netherlands still has a relatively serious acidification problem pared to other European Countries. Both the reductions of the nitrogen oxides and sulphur dioxide do not reach the the standards of acid deposition as regulated by the European mission. Ammonia which contributes considerably to the potential acid deposition in the Netherlands increased a bit in the last 20 years.Direct harmful effects on vegetation caused by high concentrations of nitrogen and sulphur pounds in air no longer occur at current levels. However, deposition of these poundsin nature areas leads to acidification and eutrophication. Using EMEP model, it is estimated how many moles of nitrogen and sulphur pounds are emitted and deposited in most European countries. Nitrate oxides, sulphur dioxide and ammonia emissions are calculated with 50×50 grid while deposition with 10×10. The relation between emissions and deposition in Netherlands is used to show how to solve the acid deposition problems in coordination with the other countries. On the basis of the calculations of the emission/receptor relations it is shown how the acid deposition problems can be solved in an efficient way.2. Method and analysis of the Regional air pollution situationThe main objective of EMEP is to provide the parties to the convention with information on emissions, transport, concentrations and depositions of air pollutants in Europe. It was set up in 1977 for monitoring and evaluation of the long-range transmission of air pollutants. The EMEP model is used to evaluate the emissions and receptions in Europe with per 50×50 km or 10×10 km a grid on the map. With the data from each monitor stations, all emission and receptions for each grid are summed up. The pollutants of all grids in Netherlands count up to the emissions of Dutch.(??)(sentence can be omitted, I believe.2.1. The Monitoring methodThree main processes for deposition can be distinguished for monitoring which are wet deposition , occult deposion and dry deposion. Wet deposion is transported to the surface by means of precipitationDry deposition includes deposition of aerosol particles and gases directly on vegetation and soil without prior uptake in the water phase.And the dry deposition flux is product of vertical deposition velocity (Vd) and ambient concentration(Cx). By measuring the Vd and Cx, the dry deposition flux can be calculated.On each monitoring station, both wet deposition and dry deposition are measured exactly not true, the basis is thye model, not monitoring by stations. That is used to validate = check truth, of model. The occult deposition is only important where much fog is. So it is not mentioned in the research.. Figure2 shows how the grid map is made up.Figure3. Critical loads for Europe, acidification2.2 Analysis of acid deposition dataListed in Table 1, Table 2 and Table 3 are the data of import and export of acidifying pollutants for Europe, the results are calculated by EMEP model and given in these tables as transport matrix for SO2, NOx and NHx in Europe. These tables provide data on import and export of SO2, NOx and NHx for the different countries in Europe. In the table, the row indicated as NL gives this information. Let’s take an example. In the first half of the table it is indicated (see cross of row NL and column NL that 140 times 100 tons (= 14000 tons) of deposited SOx is caused by the sulfur emissions from The Netherlands itself. The contributions4200 tons.(see Table 1).Table 1 Transport matrix SOx in EuropeTable 2 Transport matrix NOx in EuropeTable 3 Transport matrix NHx in Europeupper column meanslower column3. ResultThe results of analysis of acid deposition in this chapter is given in Table 1, Table 2 and Table 3.The origins of acidifying depositions in the Netherlands are given in table 4 and 5. The total deposition amount is shown in Table 4, the forecasted emissions of the Netherlands for the year 2000 are shown in Table 5.Source: RIVM 2001More than 40% of acid deposition originates in other countries, according to calculations made on the basis of EMAP data. Emissions for the year 2000 have been estimated. A large portion of the NOx, emitted in the NL is exported to other countries, and will not be deposited in the Netherlands. The same situation exists for SO2 . paring the data of SO2 , NOx and NHx , we can find that the ammonia emissions are the main problem in the Netherlands , 2/3 of emitted ammonia is deposited within the Dutch borders. Over 40% of the average acid deposition in the Netherlands es from ammonia emissions from Dutch agriculture. The Traffic and transport target sector contributes over 8% to acid deposition, with the other sectors contributing less than 3% each.4. Assessments, Measures, and ProposalsTo reduce the emissions in Netherlands, a lot of measures must be taken. As most of the sulphur dioxides and nitrate oxides are emitted in other countries, controling the emissions only in the Netherlands will not have the desired effect. It depends more on the coordination with the neighborhood. But the most of the ammonia deposited in The Netherlands are emitted by itself. And the largest part is emitted by agriculture. So to solve the problem, the Dutch must control the emission of agriculture .The agricultural area amounts to two million hectares and in 1999, there were 103,000 farms altogether.The enterprises of the farms in Netherlandsconcentrate on cattle (56 %), horticulture (21 %) and other types of farms(23%).Cattle productionis the main source of ammonia .It is effective and helpful to look at some similar cases in other countries.Take Japan as an exampleA dairy farm in Hokkaidousesa biogas fuel cell co-generation system to deal with the waste. The organic waste of livestock and corn produces biogas by way high-speed fermentation. This Efficient fermentation system reduces not only energy demand, but also the production of ammonia which the waste generates.Netherlands should follow the example of Hokkaido. There are thousands of farms in Netherlands, which produce more ammonia than the Hokkaido farm. The Dutch government may use the3R (Reduce,Recycle and Reuse)system to deal with the waste produced by the livestock. Although Netherlands have a long way to go in order to reach the standards of acid deposition as regulated by the European mission in the Goteborg Protocol, these measures may help to reach the goal.5. ConclusionsThe European mission has indicated that The Netherlands will be fined with up to of 2 billion Euro, if the limit is not reached in 2006. NOx, SO2, and ammonia contribute to acid deposition in The Netherlands, for respectively, 20, 20 and 60 %. Reduction is required of 500 to 1000 moles per hectare per year, on a level of 3000 moles.ha-1.yr-1. In view of the general practice in Europe, a reduction of 700 moles per ha per year seems very reasonable to meet the demands of the mission.At moment about 10% of the nature areas are sustainably protected against acidification and eutrophication. It is estimated that the deposition of nitrogen and acidifying substances will both still be on average 0-20% above the deposition targets. Because about 45% of the potential acid deposition and 35% of the nitrogen deposition originate outside the Netherlands, this will be highly dependent on emission reductions in the surrounding countries.A large portion (2/3) of the NOx, emitted in the Netherlands is exported to other countries, and will not be deposited in The Netherlands. The same situation exists for SO2. But 2/3 of the emitted ammonia is deposited within the Dutch borders. Hence it is concluded that only ammonia reductions can be effective to reach the European air quality standards within the period of 2 years.Foreign examples, such as closed cycle farming in Japan, can indicate how the necessaryreduction can be obtained. Netherlands may take the same measures to reach the standards.ReferencesRIVM - Netherlands Environmental Assessment Agency. 2003. The Netherlands contribution to the EMEP air quality assessment report. Acidification and air quality in the past decades and policy targets for 2021. Adopted from the Netherlands Environmental Balance, 2002 & 2003 ediitions.Krzysztof Olendrzynski, Erik Berge, Jerzy Bartnicki. 2000. EMEP Eulerian acid deposition model and its application. European Journal of OperationaL Researth. 122: 429-439.Richard V. Pouyat, Margaret A. McGlinch.1998. A legislative solution to acid deposition. Environmental Science & Policy. 1: 249-259.HIROSHI HARA. 1998. ACID DEPOSITION CHEMISTRY IN ASIA, EUROPE, AND NORTH AMERICA. Progress in Nuclear Energy. Vol. 32, No, 3/4, pp. 331-338,1998. ©1998 Elsevier Science Ltd.ELISABETH RENYMY, CATHERINE MOUGENOT. 2002. Inventories and Maps: Cognitive Ways of Framing the Nature Policies in Europe. Journal of Environmental Policy & Planning.4: 313-322. ©1998 Elsevier Science Ltd.ED BUIJSMAN, JAN M. M. ABEN, BERNARD G. VAN ELZAKKER, MARCEL G. MENNEN.1998. AN AUTOMATIC ATMOSPHERIC AMMONIA NETWORK IN THE NETHERLANDS SET-UP AND RESULTS. Atmospheric Environment. Vol.. 32, No.3, pp. 317-324, 1998. ©1998 Elsevier Science Ltd.RIVM (2001). Luchtkwaliteit. Jaaroverzicht 2000. RIVM, Bilthoven. ·Landelijk Meetnet Luchtkwaliteit : .lml.rivm.nl/Francesco Melita, Organic Farming in the Netherlands. , 30.3.2000:202-214.© Stiftung Ökologie & Landbau (SÖL), Bad Dürkheim, Germany, 2000. NEP. 2001. Invitation Program of Asian New Energy Specialists. New Energy Plaza. Vol. 17, No.2.。
环境工程原理教学大纲01.教学单位名称:环境与资源学院02.课程代码:64202503.课程名称:环境工程原理04.课程英文名称:Principles of Environmental Engineering05.课程类别:学科基础课06.课程性质:必修07.课程学时:48学时(其中实验8学时)08.课程学分:309.授课对象:环境工程专业本科生.开课学期:5学期(秋季)10.选用教材:《环境工程原理》第二版,胡洪营等,高等教育出版社,2011.主要参考书:[1]郭仁惠等,《环境工程原理》,郭仁惠等,化学工业出版社,2009[2]温瑞媛等,《化学工程基础》,温瑞媛等,北京大学出版社,2002[3]王志魁,《化工原理》,(第三版),王志魁,化学工业出版社,2005.大纲执笔人:11.课程中文简介:《环境工程原理》是环境工程专业学生必修的一门专业基础课程,它在《数学》、《物理》、《普通化学》、《有机化学》、《物理化学》等基础课与专业课之间起着承先启后的作用,是自然科学领域的基础课向工程科学的专业课过渡的入门课程。
主要讲述水处理工程、大气污染控制工程、固体废弃物处理处置工程等环境污染防治以及生态修复工程中涉及的具有共性的基本现象和基本过程的基本原理。
主要内容包括环境工程原理基础、别离过程原理和反响工程原理三局部。
环境工程原理基础局部主要讲述物料与能量守恒原理、传递过程等。
别离过程原理局部主要讲述过滤、吸收、吸附等基本原理。
反响工程原理局部讲述化学和生物反响计量学、动力学、各类反响器的过程解析等。
12.课程英文简介:13.课程教学任务、教学目的和教学要求通过学习,要求学生初步掌握污染控制工程和公害防治技术的基本原理和基本方法;掌握环境污染物净化的基本理论、必要的基本知识和涉及工程设计方便的基本技能;了解化学、物理化学、生物、自控和信息等其他高新技术在环境工程技术上的应用,能运用环境的观点来理解相关学科中涉及环境的有关问题。
中国海洋大学研究生培养方案(报表)一级学科名称环境科学与工程二级学科名称环境科学、环境工程、环境规划与管理二级学科代码 083001、083002、083020培养方案负责人高会旺联系电话 66782977电子邮件 hwgao@分管院长签字:院(系)盖章填表日期: 2007 年 7 月 30日一级学科:____环境科学与工程_____________英文名称: Environmental Science and Engineering代码:____08300________________一、学科简介环境科学与工程学院设有环境科学与工程博士和硕士学位授予权一级学科,涵盖环境科学、环境工程、环境规划与管理三个博士点,环境科学、环境工程、环境规划与管理三个硕士点。
设有环境工程工程硕士点和管理工程硕士点。
设有环境科学与工程博士后流动站。
环境科学和环境工程两个二级学科均为山东省重点学科。
环境科学是国家重点学科,山东省“十五”和“十一五”强化建设的重点学科。
持有国家环境评价甲级证书。
海洋环境与生态教育部重点实验室是学院科学研究和人才培养的重要支撑。
本学科点现有教学科研人员68人(包括外聘12人),其中博士生导师2 2人(包括校外博导10人),教授33人(包括外聘12人),副教授16人,另有中国科学院院士1人,中国工程院双聘院士2人,“长江学者讲座教授”2人。
教学科研人员中81%具有博士学位,高级职称人员中70%具有国外留学或访问经历,45岁以下学术带头人及学术骨干占教师总数的70%,形成了以“长江学者讲座教授”、新世纪优秀人才、“973”课题、国家基金重大和重点项目负责人为学术带头人的学缘结构和年龄合理的学术团队。
经过“211工程”和“985工程”建设,本学科点和教育部重点实验室现有大型仪器设备总价值达2000余万元,形成了功能完备的海洋环境现场观测、室内分析测试和数值计算等研究和人才培养平台。
实验室总面积约4000m2。
Unit 3 What is Waste Reduction/Waste Minimization?什么是废物减量化,废物最少化美国花费了大量的时间在讨论像资源减量化,废物最小化,循环和阻止污染这些术语上,EPA已经提供了以下的定义。
资源减量化:减少在于一个过程中的大量废物的任何行为。
它包括,例如,过程调整,原料调整,提高管理和回收在循环。
废物最少化:产生的废物最大程度减少,然后处理,存储,或者处置。
它包括了被导致了只要减量化与现在或将来威胁到人类健康和环境的最小化的目标一致的总容量或废物数量的减少或者废物毒性的减少,或者两方面兼备的发生器承担任何资源减量化或循环的活动。
回收:作为一个商业产品的代替品,或作为一个工业过程的原料的利用或再利用。
它包括了废物的有用的小部分或来自允许再用的去除了污染物的废物的在现场或离开现场的回收利用。
污染的防止:污染可能在生产过程之中产生,或者在当一个产品被用作商业用途或被消费者使用的时候产生。
这样可能在三个方式上被阻止:改变投入/减少依赖有毒物或有害的原材料;改变过程/增加效率/提高类似设备修改的维修保养,更好的管理,在过程中闭环循环;或者改变产出/减小对有毒或者有害产品的依赖。
随着1984年危险废物和固体废物修正案资源保护和恢复法的通过,美国国会建立一个国家政策来表明回收或消除危险废物的产生重要性。
美国国会宣称它是一项无论在美国哪里都可行的国家政策,要尽可能迅速地回收或消除危险废物的产生。
然而产生的废物还是应被处理、储存或处置,从而尽量减少现在和将来对人类健康和环境的威胁。
在1990年,美国国会通过污染防治法,建立了一个全国废物管理政策。
表明第一污染应该被预防或回收;;第二,废物应该用一种环保安全的方式进行循环利用;第三,废物应该被处理;最后,废物应该被除去或降解到环境。
在美国,随着这些和其他环境法规的通过,废物最少化成为一种重要的工作理念.废物回收/废物最少化技术同时,对于一些特定的工厂,废物最少化的当然是在具体的工厂或在实地,能用的技术能被分为以下主要几类:●product changes产品改变●process changes过程改变●equipment modifications设备改造●operating practices操作训练●recycling and reuse回收和再利用在实践中,尽量减少废物的机会是有限的,只有被工厂人员的聪明才智所利用. 这种技术已经被运用与大数量的工业和工业化生产过程,同时也被应用于有危险性和非危险性的废物。
Acid Deposition Research in NetherlandsPeking University Shenzhen Graduate SchoolLishui Road Nanshan District Shenzhen Guangdong Province, ChinaAbstract:The EMEP model is applied to simulate the atmospheric transport and deposition of acid pollutants in Europe’s atmosphere with a 50×50 km2 horizontal resolution. The model evaluations for the past twenty years indicate that rather serious exceedances are found for the South and East of the Netherlands. Netherlands have exceeded the limits of acid deposition as regulated by the European Commission in the Goteborg Protocol. The European Commission requires that thsituation is remedied within 2 years. Large fractions of nitrogen oxide(s)(NO x) and sulfur dioxide(SO2) emitted in the Netherlands , are deposited in their neighbouring countries. So reduction of these compounds would not influence acid deposition in The Netherlands very much. As to ammonia, a large portion is deposited within the Netherlands. Hence it is concluded that only ammonia(NH3) reductions can be effective to reach the European air quality standards within the period. Compared to other sources, agriculture is the main source of ammonia. So some proposed measures are necessary to reduce the ammonia production of agriculture, specially of the stock-raising. The feasible way is to develop the eco-ariculture and reuse the waste of livestocks.Keyword: EMEP model, Acid Deposition, Exceedance, Reductions1. IntroductionAlthough the nitrogen deposition in the Netherlands(NL) has slightly been reduced the last few years, and the acidifying deposition of sulphur has decreased sharply the last few years, The Netherlands still has a relatively serious acidification problem compared to other European Countries. Both the reductions of the nitrogen oxides and sulphur dioxide do not reach the the standards of acid deposition as regulated by the European Commission. Ammonia which contributes considerably to the potential acid deposition in the Netherlands increased a bit in the last 20 years. Direct harmful effects on vegetation caused by high concentrations of nitrogen and sulphur compounds in air no longer occur at current levels. However, deposition of these compoundsin nature areas leads to acidification and eutrophication. Using EMEP model, it is estimated how many moles of nitrogen and sulphur compounds are emitted and deposited in most European countries. Nitrate oxides, sulphur dioxide and ammonia emissions are calculated with 50×50 grid while deposition with 10×10. The relation between emissions and deposition in Netherlands is used to show how to solve the acid deposition problems in coordination with the other countries. On the basis of the calculations of the emission/receptor relations it is shown how the acid deposition problems can be solved in an efficient way.2. Method and analysis of the Regional air pollution situationThe main objective of EMEP is to provide the parties to the convention with information on emissions, transport, concentrations and depositions of air pollutants in Europe. It was set up in 1977 for monitoring and evaluation of the long-range transmission of air pollutants. The EMEP model is used to evaluate the emissions and receptions in Europe with per 50×50 km or 10×10 km a grid on the map. With the data from each monitor stations, all emission and receptions for each grid are summed up. The pollutants of all grids in Netherlands count up to the emissions ofDutch.(??)(sentence can be omitted, I believe.2.1. The Monitoring methodThree main processes for deposition can be distinguished for monitoring which are wet deposition , occult deposion and dry deposion. Wet deposion is transported to the surface by means of precipitation Dry deposition includes deposition of aerosol particles and gases directly on vegetation and soil without prior uptake in the water phase. And the dry deposition flux is product of vertical deposition velocity (Vd) and ambient concentration(Cx). By measuring the Vd and Cx, the dry deposition flux can be calculated.On each monitoring station, both wet deposition and dry deposition are measured exactly not true, the basis is thye model, not monitoring by stations. That is used to validate = check truth, of model. The occult deposition is only important where much fog is. So it is not mentioned in the2.2SO22, NOx and.Table 1 Transport matrix SOx in EuropeTable 2 Transport matrix NOx in EuropeTable 3 Transport matrix NHx in Europeupper column meanslower column3. ResultThe results of analysis of acid deposition in this chapter is given in Table 1, Table 2 and Table 3. The origins of acidifying depositions in the Netherlands are given in table 4 and 5.The total deposition amount is shown in Table 4, the forecasted emissions of the Netherlands for the year 2000 are shown in Table 5.Table 4 Origins of acidifying depositions in the Netherlands.Source: RIVM 2001More than 40% of acid deposition originates in other countries, according to calculations made on the basis of EMAP data. Emissions for the year 2000 have been estimated. A large portion of the NOx, emitted in the NL is exported to other countries, and will not be deposited in the Netherlands. The same situation exists for SO2 . Comparing the data of SO2 , NOx and NHx , we can find that the ammonia emissions are the main problem in the Netherlands , 2/3 of emitted ammonia is deposited within the Dutch borders. Over 40% of the average acid deposition in the Netherlands comes from ammonia emissions from Dutch agriculture. The Traffic and transport target sector contributes over 8% to acid deposition, with the other sectors contributing less than 3% each.4. Assessments, Measures, and ProposalsTo reduce the emissions in Netherlands, a lot of measures must be taken. As most of the sulphur dioxides and nitrate oxides are emitted in other countries, controling the emissions only in theNetherlands will not have the desired effect. It depends more on the coordination with the neighborhood. But the most of the ammonia deposited in The Netherlands are emitted by itself. And the largest part is emitted by agriculture. So to solve the problem, the Dutch must control the emission of agriculture .The agricultural area amounts to two million hectares and in 1999, there were 103,000 farms altogether. The enterprises of the farms in Netherlands concentrate on cattle (56 %), horticulture (21 %) and other types of farms(23%). Cattle production is the main source of ammonia .It is effective and helpful to look at some similar cases in other countries. Take Japan as an example A dairy farm in Hokkaido uses a biogas fuel cell co-generation system to deal with the waste. The organic waste of livestock and corn produces biogas by way high-speed fermentation. This Efficient fermentation system reduces not only energy demand, but also the production of ammonia which the waste generates.Netherlands should follow the example of Hokkaido. There are thousands of farms in Netherlands, which produce more ammonia than the Hokkaido farm. The Dutch government may use the3R (Reduce,Recycle and Reuse) system to deal with the waste produced by the livestock. Although Netherlands have a long way to go in order to reach the standards of acid deposition as regulated by the European Commission in the Goteborg Protocol, these measures may help to reach the goal.5. ConclusionsThe European Commission has indicated that The Netherlands will be fined with up to of 2 billion Euro, if the limit is not reached in 2006. NOx, SO2, and ammonia contribute to acid deposition in The Netherlands, for respectively, 20, 20 and 60 %. Reduction is required of 500 to 1000 moles per hectare per year, on a level of 3000 moles.ha-1.yr-1. In view of the general practice in Europe, a reduction of 700 moles per ha per year seems very reasonable to meet the demands of the Commission.At moment about 10% of the nature areas are sustainably protected against acidification and eutrophication. It is estimated that the deposition of nitrogen and acidifying substances will both still be on average 0-20% above the deposition targets. Because about 45% of the potential acid deposition and 35% of the nitrogen deposition originate outside the Netherlands, this will be highly dependent on emission reductions in the surrounding countries.A large portion (2/3) of the NOx, emitted in the Netherlands is exported to other countries, and will not be deposited in The Netherlands. The same situation exists for SO2. But 2/3 of the emitted ammonia is deposited within the Dutch borders. Hence it is concluded that only ammonia reductions can be effective to reach the European air quality standards within the period of 2 years.Foreign examples, such as closed cycle farming in Japan, can indicate how the necessary reduction can be obtained. Netherlands may take the same measures to reach the standards.ReferencesRIVM - Netherlands Environmental Assessment Agency. 2003. The Netherlands contribution to theEMEP air quality assessment report. Acidification and air quality in the past decades and policy targets for 2010. Adopted from the Netherlands Environmental Balance, 2002 & 2003 ediitions. Krzysztof Olendrzynski, Erik Berge, Jerzy Bartnicki. 2000. EMEP Eulerian acid deposition model and its application. European Journal of OperationaL Researth. 122: 429-439.Richard V. Pouyat, Margaret A. McGlinch.1998. A legislative solution to acid deposition. Environmental Science & Policy. 1: 249-259.HIROSHI HARA. 1998. ACID DEPOSITION CHEMISTRY IN ASIA, EUROPE, AND NORTH AMERICA. Progress in Nuclear Energy.Vol. 32, No, 3/4, pp. 331-338,1998. ©1998 Elsevier Science Ltd.ELISABETH RENYMY, CATHERINE MOUGENOT. 2002. Inventories and Maps: Cognitive Ways of Framing the Nature Policies in Europe. Journal of Environmental Policy & Planning.4: 313-322. ©1998 Elsevier Science Ltd.ED BUIJSMAN, JAN M. M. ABEN, BERNARD G. V AN ELZAKKER, MARCEL G. MENNEN.1998. AN AUTOMATIC ATMOSPHERIC AMMONIA NETWORK IN THE NETHERLANDS SET-UP AND RESULTS. Atmospheric Environment. V ol.. 32, No.3, pp. 317-324, 1998. ©1998 Elsevier Science Ltd.RIVM (2001). Luchtkwaliteit. Jaaroverzicht 2000. RIVM, Bilthoven. ·Landelijk Meetnet Luchtkwaliteit : http://www.lml.rivm.nl/Francesco Melita, Organic Farming in the Netherlands. , 30.3.2000:202-214.© Stiftung Ökologie & Landbau (SÖL), Bad Dürkheim, Germany, 2000. NEP. 2001. Invitation Program of Asian New Energy Specialists. New Energy Plaza. Vol. 17, No.2.。