
Topic Model for Graph Mining
Junyu Xuan,Jie Lu,Senior Member,IEEE,Guangquan Zhang,and Xiangfeng Luo,Member,IEEE
Abstract—Graph mining has been a popular research area because of its numerous application scenarios.Many unstruc-tured and structured data can be represented as graphs,such as, documents,chemical molecular structures,and images.However, an issue in relation to current research on graphs is that they cannot adequately discover the topics hidden in graph-structured data which can be bene?cial for both the unsupervised learning and supervised learning of the graphs.Although topic models have proved to be very successful in discovering latent topics, the standard topic models cannot be directly applied to graph-structured data due to the“bag-of-word”assumption.In this paper,an innovative graph topic model(GTM)is proposed to address this issue,which uses Bernoulli distributions to model the edges between nodes in a graph.It can,therefore,make the edges in a graph contribute to latent topic discovery and further improve the accuracy of the supervised and unsupervised learn-ing of graphs.The experimental results on two different types of graph datasets show that the proposed GTM outperforms the latent Dirichlet allocation on classi?cation by using the unveiled topics of these two models to represent graphs.
Index Terms—Graph mining,latent Dirichlet allocation(LDA), topic model.
I.I NTRODUCTION
G RAPH is a structure of a set of nodes where some pairs
of nodes are connected by links.Many unstructured and structured data can be represented as graphs.The research about this graph structured data belongs to the graph min-ing area[1].The motivation for graph mining is that the edges(formed structures)will contribute to the classi?ca-tion or clustering of the data as compared to instance mining which only considers nodes[1],[2].In text mining,a doc-ument(see[3],[4]),is composed of some words as nodes and word relations,which can be co-occurrence relations, Manuscript received July5,2014;revised October13,2014;accepted December10,2014.Date of publication January20,2015;date of cur-rent version November13,2015.This work was supported in part by the Australian Research Council under Discovery Grant DP110103733and Discovery Grant DP140101366,in part by the China Scholarship Council,in part by the National Science Foundation of China under Grant61471232, and in part by the Key Innovation Program of Shanghai Municipal Education Commission under Grant13ZZ064.This paper was recommended by Associate Editor https://www.doczj.com/doc/7b2688721.html,st.
J.Xuan is with the Centre for Quantum Computation and Intelligent Systems,School of Software,Faculty of Engineering and Information Technology,University of Technology,Sydney,Ultimo,NSW2007,Australia, and also with the School of Computer Engineering and Science,Shanghai University,Shanghai200444,China.
J.Lu and G.Zhang are with the Centre for Quantum Computation and Intelligent Systems,School of Software,Faculty of Engineering and Information Technology,University of Technology,Sydney,Ultimo, NSW2007,Australia(e-mail:jie.lu@https://www.doczj.com/doc/7b2688721.html,.au).
X.Luo is with the School of Computer Engineering and Science,Shanghai University,Shanghai,China.
Color versions of one or more of the?gures in this paper are available online at https://www.doczj.com/doc/7b2688721.html,.
Digital Object Identi?er10.1109/TCYB.2014.2386282association relations,or other semantic relations.The classi-?cation of these document graphs can improve the accuracy of document retrieval with word vectors as representations.To provide another example,a chemical molecular structure can be represented by a graph with basic elements as nodes and chemical bonds as edges.The classi?cation of these chem-ical molecular graphs can help to label molecular structures which is normally a very dif?cult and time-consuming process. Moreover,products,services,website retrieval,and many real-world tasks can bene?t from such graph mining.However, the existing graph mining algorithms are mainly based on the frequent subgraph representation[5]–[7]which transforms a graph into an instance where each subgraph is a dimen-sion and then the existing instance-based machine learning algorithms can be adopted.The problem with this is that the links between subgraphs in a single graph are omitted.This omission unfortunately loses some valuable information.
On the other hand,although the topic detection in text min-ing[8]and video processing[9]is a hot research area,the research issue,that of discovering hidden topics in graph-structured data,has not been well solved.For example,in the text mining area,if topics are from scienti?c papers about a research area,the topics mean the different research directions of this research area,i.e.,cloud computing and machine learn-ing;in the image mining area,if topics are about the images in a scene,the topics mean the different background seman-tics(e.g.,the combinations of objects,like the combination of “sky”and“water”can actually be the“environment”).These discovered topics are useful for many real-world tasks,such as,topic detection and tracking in text mining,image segmen-tation and retrieval,and dimensionality reduction,but we do not have a suitable solution for graphs since the existing works on topic discovery are only based on instance-represented data[10]–[12].A challenging question therefore arises:how do we discover hidden topics for graph-structured data?
In order to resolve this research issue,we propose a topic model for graph mining(GTM)in this paper.To the best of our knowledge,we are the?rst to apply the topic model for graph mining.Although topic models have proved to be very successful in discovering latent topics,the standard topic mod-els cannot be directly applied to graph-structured data because of the“bag-of-word”assumption.Here,we make an assump-tion that if there is an edge between two nodes in a graph, these two nodes tend to“talk”similar content.In GTM,a Bernoulli distribution is adopted to model the existence of an edge parameterized by topics of two linked nodes.By directly the modeling edges,GTM can make the edges contribute to latent topic discovery instead of the process of using frequent subgraphs.Finally,we compare the performance of GTM and latent Dirichlet allocation(LDA)on the classi?cation task.The
2168-2267c 2015IEEE.Personal use is permitted,but republication/redistribution requires IEEE permission.
See https://www.doczj.com/doc/7b2688721.html,/publications_standards/publications/rights/index.html for more information.
experimental results show that the ability of GTM on docu-ment and chemical formula classi?cations is better than LDA. The discovered topics by GTM are also better than LDA.In other words,topics from GTM can more accurately describe graphs than LDA.
The contributions of this paper are as follows.
1)An innovative GTM for graph-structured data is built by
modeling the edges in graphs using Bernoulli distribu-tion,which makes the edges in graphs contribute to the discovered topics.
2)Two Inference Algorithms:Variational algorithm and
Markov chain Monte Carlo(MCMC)algorithm are developed to resolve the proposed GTM.
The rest of this paper is organized as follows.Some related works are given in Section II.In Section III,we introduce the proposed GTM with the inference algorithms.In Section IV, experiments are conducted to compare traditional LDA with the proposed GTM on the classi?cation.Finally,Section V concludes this paper and discusses further work.
II.R ELATED W ORK
In this section,we will review the state-of-the-art research in two areas:1)topic models and2)graph mining.A successful model and also our competitive model will be introduced in more detail.
A.Topic Models
Probabilistic latent semantic indexing(pLSI)[13],which is an extension of latent semantic indexing(LSI)[14],can be seen as the?rst topic model.The original idea of this comes from the sparse document-keyword matrix.LSI uses singu-lar value decomposition from the dimension reduction view and pLSI builds a generative model to?nd the latent classes (topics).However,there is an over-?tting problem in the pLSI model,which is addressed by LDA[11]using a Dirichlet prior to all the topic distributions with the resulting sacri?ce of the inference complexity[15].There are also many extensions of LDA which have considered different aspects of data,such as the label[16],time[12],author[17],emotion[18],and so on.More information about topic models can be found in[19]and[20].
There are also some works which try to capture the depen-dencies using topic models.Here,we class them as three categories according to the dependence level:1)topic-level;
2)document-level;and3)word-level.At the topic level,a correlated topic model is proposed to capture the relations between hidden topics by replacing the Dirichlet prior with log-normal prior[21].An in?nite topic tree is learned from the data by a nested hierarchal Dirichlet process[22].At the document-level,the citation relations between scienti?c papers are considered by a relational topic model[23],[24].Both topic-level and document level models are still based on the bag-of-word assumption.At the word level,Grif?ths et al.[25] tried to?ll this gap by adding the syntactic relations of words in a sentence to the model.The hidden Markov model[26] is combined with the topic model by assuming that the key-words in a document are generated under an inherent linguistic sequence.Although these two works have proved to be suc-cessful,only the linguistic linear relation of all keywords in a sentence or document are considered.Actually,there are many types of relations between keywords in a document and these relations are not limited in a sentence.This paper belongs to the third level,i.e.,the https://www.doczj.com/doc/7b2688721.html,pared with cur-rent works,our model can be extended to the graph mining area,because our model can capture more general relations (e.g.,graph structure).
B.Graph Mining
Graph mining[27]has become an important research topic and has been successfully applied to numerous applications, like computational biology,chemistry,and so https://www.doczj.com/doc/7b2688721.html,pared with the traditional instance-based data representation,the graph-based representation expresses more data information which constitutes the structure of data.The main work in the graph mining area is to?nd a way to incorporate this structural information into the traditional algorithms,such as classi?cation,clustering,frequent pattern mining,and so on. Frequent subgraph mining is of signi?cance in graph min-ing because it is the bridge connecting traditional data mining algorithms and graphs.So,there are plenty of frequent sub-graph mining algorithms proposed in the literature which are categorized in terms of“general purpose”and“pattern dependent”algorithms[28].Based on the graph traversing strategies,breath?rst search and depth?rst search,some algo-rithms are designed,like FSG[29],DPMine[30],gSpan[31], GASTON[32],etc.
Graph classi?cation provides the labels for the unlabeled graphs using labeled graphs as training data.A similarity measure between two graphs is the basis for the graph clas-si?cation,because the traditional measures do not work for graphs,e.g.,cosine,Euclidean distance,and Minkowski dis-tance.Kernel-based[33]methods are proposed to resolve this problem.Since the direct comparison between two graphs is the NP hard problem,some graph kernels[34],[35]are pro-posed to measure the distance between the two graphs by considering the properties of graphs,like nodes,edges,and paths.The original kernel-based methods[34],[36]are nor-mally time-consuming.For example,the geometric random walk graph kernel[36]requires O(n6)time.Four approxi-mation methods are proposed to reduce this complexity to O(n4),and,for some sparse graphs,the time only requires O(n2)[37].Subgraph-based graph classi?cation is also a
prevalent method[5],[7].Some boosting approaches have been adopted to select interesting subgraphs from the origi-nal big subgraph set[38].The dual active features[6]and positive labels[39]are considered.
Graph clustering clusters the graphs with similar labels. Apparently,the most important thing for graph clustering is the existence of similarity between two graphs.Some ideas of graph classi?cation can also be adopted here.There are also some other methods,like the entropy-based method[40] and some works try to improve ef?ciency by employing the parallel algorithm[41].
To sum up,although various methods about graph have been proposed,there is little work on the probabilistic model for
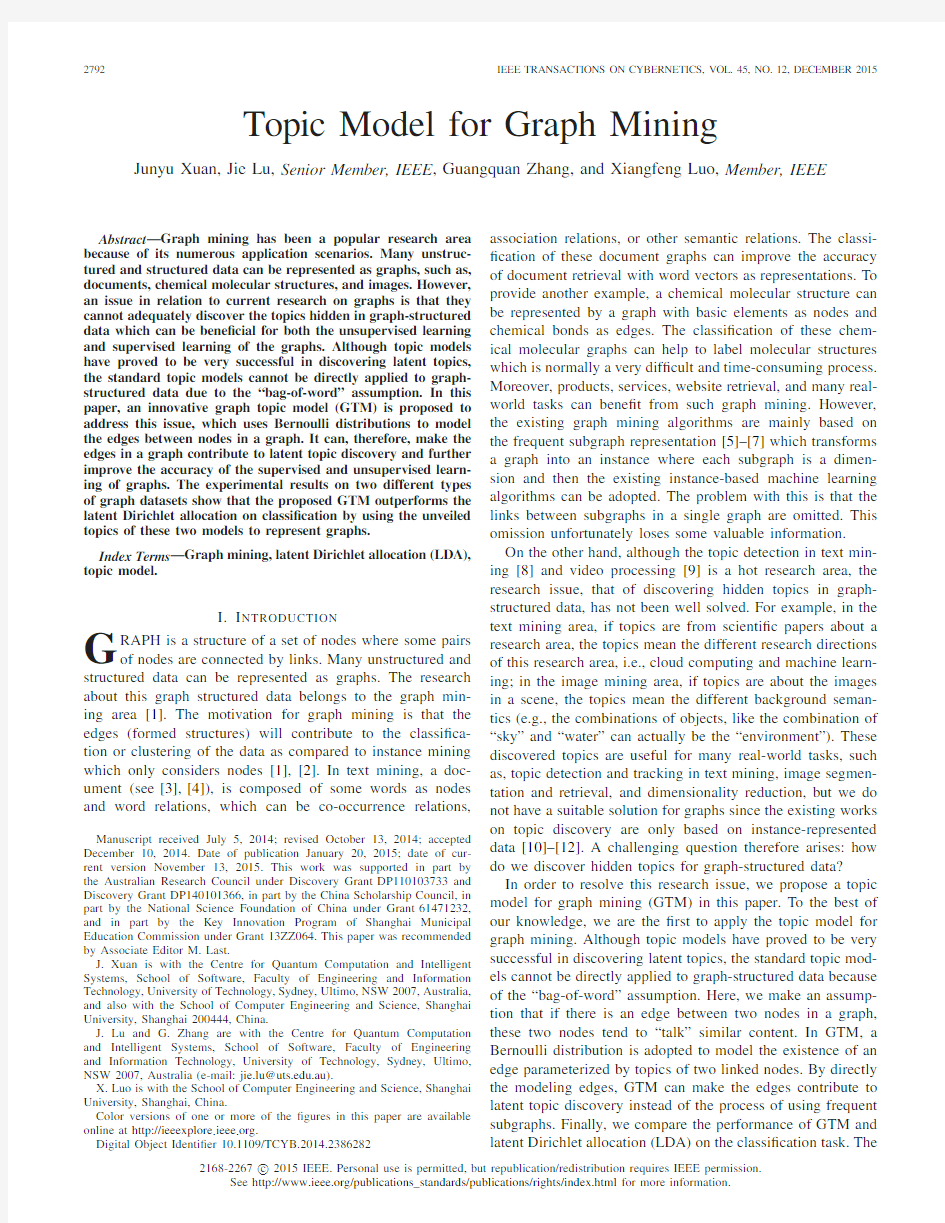
Fig.1.Instance-based and graph-based representation of a document.Each node in the graph denotes a word in the document.The edges denotes a kind of relationes between
words.
Fig.2.Instance-based and graph-based representation of a chemical formula.A chemical formula (left ?gure)is composed by different elements,like O,C,HO,and so on.The connections between these elements are called bonds between them,which have almost same ability to in?uence the function of a chemical formula.Here,two different representations are constructed for the same chemical
formula.
Fig.3.Graphical representation of LDA.
graph mining.Accordingly,we have sought to build a prob-abilistic model for the different kinds of graphs based on the idea of topic models.
C.LDA
Since this paper is based on LDA and it aims to extend LDA to graphs,we will provide more details about this model.LDA [11]is a generative graphical model,as shown in Fig.3.The documents are selected as the example dataset in line with the original paper,but it should be noted that LDA can be used for any instance-based representation objects.The aim of this model is to discover the underlying topics in a corpus.It assumes that a document is composed by a number of topics with different weights (called topic distribution),and a topic is composed by a number of keywords 1with different weights
1“Keywords”are the selected words to express/represent the semantics of
the documents.Here,the keywords in this paper are nonstopwords and these are stemmed by the Natural Language processing tools.All the words are also given certain POS,and then only the nouns and verbs are kept analogous with other literature,because the document classi?cation is mainly sensitive to nouns and verbs.
(called keyword distributions).The generative process are as follows.
1)Drawφz~Dir(β)for each topic.
2)Drawθd~Dir(α)for each document.
3)For all keywords in a document:
a)draw z d,n~multi(θd)for each keyword;
b)draw n d~multi(φz d,n)for each keyword.
The inference for this model is the inverse process of this generative process.The expectation maximization algorithm is adopted to get optimized latent variables for maximizing the model likelihood.In this generative process,the topic assign-ment of each keyword is determined by the topic distribution of the belonged documents,and each keyword is determined by its topic assignment and keyword distribution of topics,as shown in Fig.3.It is a pity that the relations between keywords in a document have been overlooked in previous studies.
III.GTM
In this section,we?rst present some basic concepts used in this paper.Based on these concepts,we introduce the proposed model followed by two inference algorithms.In order to show the procedure and intrinsic of the algorithms,an illustrative example is given at last.
A.Graph
The de?nition of graph is given here and its representative ability is shown by two examples:a document graph and a chemical graph.Besides,some basic concepts and notations will also be given,which will be used throughout this paper. De?nition1(Graph):A graph g is composed by nodes and edges
g:=
Graph can be used to model or represent lots of items.In this paper,we give two examples of graphs,one is document graph and the other is chemical graph.
1)Document Graph:A document is apparently composed by some words,which is the reason why most of researches about documents using a word vector to represent a document. In order to construct a graph for a document,we just need to add relations between these keywords as shown in Fig.1. The relation in this paper between keywords is selected as the co-occurrence relation.Co-occurrence frequency of two keywords is
f co=|G n
i
∩G n
j
|
|G|
where G n
i is the documents which contain keyword n i.An
edge e n
i,n j exists only if the co-occurrence frequency of them
exceeds a thresholdρ.This edge means that these two key-words have a big probability to be used to describe a similar topic.If there are a number of topics,it means these two keywords may have similar topic distribution.
The reason why this co-occurrence relation is selected here is that it is a weak-semantic relation between keywords
TABLE I
N OTATIONS U SED IN T HIS P
APER
and can be easily and automatically constructed without
appealing to other resources.Actually,there are other con-
crete and rich-semantic relations can be discovered by some
other methods,like resource description framework[42]or
ontology[43],[44].However,they normally need the help of
outer data resources or the human intervention.For an arbitrary
corpus,co-occurrence relation is a better choice.
2)Chemical Graph:Each chemical formula seems nat-urally a graph with each chemical element as a node and
chemical bonds as edges.However,the nodes may occur twice
in a single chemical formula with different positions.Since a
treatment function is normally expressed by the combination
of basic chemical elements[45],we cannot directly use the
original graph structure.
Here,we use the frequent subgraphs in a dataset as the
nodes and the links between subgraphs as edges.At?rst,
gSpan2is adopted to mine the subgraphs.Each chemical
formula is rerepresented as a vector of subgraphs
g c=
ical graph g c.At last,the subgraph relations are de?ned as
their inclusive relation.For example,if a subgraph sg i con-
tains another subgraph sg j,there will be an edge
De?nition2(Topic):A topic is a vector of all nodes in a dataset with their weights.
From different datasets,topics have different meanings.For
example,the topics from scienti?c papers can be seen as the
different research directions;the topics from chemical formu-
las can be seen as the different treatment functions,such as
activity,toxicity,etc.
Some other frequently used notations in this paper are listed
in Table I.
B.Proposed Model
This model is an extension of LDA,so it is also a generative
model.The graphical representation of GTM is shown in Fig.4
and the corresponding generative process are as follows.
1)Drawφk~Dir(β)for each topic.
2)Drawθg~Dir(α)for each graph.
3)For all nodes in a graph:
a)draw z g,n~multi(θg)for one node;
b)draw n g~multi(φz g,n)for one node.
2https://www.doczj.com/doc/7b2688721.html,/~xyan/software/gSpan.htm
Fig.4.Graphical representation of GTM.
4)For all edges in a graph:
draw e g n
i,n j ~π(p g n
i,n j
)for an edge e n
i,n j
p g n
i,n j
e g i,j=1
=f(z g,n
i
,z g,n
j
,φ)
=φz
g,n i
?φz
g,n j
.(3)
The p g n
i,n j is the parameter of Bernoulli distribution of the
existing of an edge between two nodes n i and n j.It should be noted that the edge generation here is different from the edge de?nition in Section III-A.The edge de?nition is a description of the observed data.But the edge generation here is a part of the statistical model assumption.We just learn the data from this model assumption.The difference from LDA and the main idea of this model lie on modeling the edges in graphs using Bernoulli distribution parameterized by the topic distribution
of nodes.We can see from Fig.4that e g n
i,n j is generated by
{z g,n
i ,z g,n
j
, }.It means that the probability of the existence of
an edge between two nodes is determined by the similarity of their topic distributions.This similarity is measured by vector
inner product betweenφz
g,n i andφz
g,n j
,whereφz
g,n i
is node
distribution of topic{z g,n
i },as shown in(3).The more similar
topics of two keywords are,the more likely there is an edge between these two nodes.As discussed in the next subsection, the learning process for this model will show that the edges between nodes will in?uence the topic assignment of nodes and then in?uence the topic distribution of a graph.It is just this in?uence that makes the discovered topics are better than ones from LDA.
C.Variational Inference
For model learning,variational expectation maximization is adopted to learn the posterior distribution of graphs.It has two steps:1)e-step and2)m-step.In the e-step,the key work is to compute probability distribution of latent variables of the model.The posterior distribution of latent variables of a graph is
p(θg,z g,φ1:K|n g,e g,α,β).(4) Generally,this distribution is intractable to compute.The idea of variational inference is to use Jensen’s inequality to maximize the lower bound on the log likelihood.The original posterior distribution in(4)is factorized into some selected distributions parameterized by variational parameters.
For GTM,the distributions used to factorize posterior distribution are
θg~Dir(γg)
z g,n~multi(?g,n)
φk~multi(κk)(5) whereγg,?g,n,andκk are variational parameters.Actually, they are not just three distributions but three distribution fami-lies composed by distributions with different parameter values. Then,(4)is factorized as
q(θg,z g,φ1:K|γg,?g,κg)
=qθ(θg|γg)
N
n=1
q z(z g,n|?g,n)
K
k=1
qφ(φk|κk).(6)
This is an approximation of the posterior distribution.The distance between this approximation and original posterior distribution can be measured by Kullback–Leibler distance,as log p(n g,e g|α,β)=log E q
p(θg,z g,φ1:K,n g,e g|α,β)
q(θg,z g,φ1:K)
≥E q
log p(θg,z g,φ1:K,n g,e g|α,β)
?E q
log q
θg,z g,φ1:K
.(7)
Through the adjusting of variational parameters,the dis-tributions that can maximize(7)can be found from the variational distribution families.After transforming the search-ing of variational distributions to an optimization problem,the variational parameters can be computed as
γg,k=αk+
N
n
?g,n,k(8) and
?f(?g,n,k)
??g,n,k
=
(κk,n)?
N
n
κk,n
+ (γg,k)
?
K
k
γg,k
?log?g,n,k?1
+
n j∈Ne(n i)
ζ?1·κ?g,n j,k
k,n j
·lnκk,n·κ?g,n,k
k,n
(9) and
?f(κk,n)
?κk,n
=
,(κk,n)? ,
N
n
κk,n
?g,n,k+βn?κk,n
+
n j∈Ne(n i)
ζ?1·?g,n
i,k
·κ?g,n i,k?1
k,n i
·κ?g,n j,k?1
k,n j
(10) and
ζ=N(n
i,n j)
K
k
κ?g,n i,k
k,n i
·κ?g,n j,k
k,n j
(11)
where Ne(n)is the number of neighbors of a node n andζis the parameter of Taylor expansion of log probability of(3) (the detail is shown in the Appendix).We can compute the
Algorithm1:Variational Inference for GTM
Input:Topic number K,graph dataset G
Output:γ,?andκ
1:random initialization of variational variablesγ,?andκ2:i=1
3:while i≤max iteration do
4:for g=0to|G|do
5:Updateγg through Eq.(8)
6:Update?g by gradient-based optimization with derivative in Eq.(9)
7:end for
8:Updateκby gradient-based optimization with
derivative in Eq.(10)
9:Updateζby gradient-based optimization with
derivative in Eq.(11)
10:i=i+1.
11:end while
exact form ofγandζ,but?andκcannot.So,gradient-based optimization method3is adopted to get the optimized?andκ.The whole procedure,named variational inference for GTM,is shown in Algorithm1.
After getting the posterior distribution of each graph in(4), we need to maximize the likelihood of the graph by selecting αandβin the m-step.The Newton method4is adopted here. The detail is omitted,because there is no difference from the method used in LDA.
Let us see how the edges in a graph impact on the topic dis-tributionθg of this graph.Sinceγg is the variational parameter ofθg,the value ofγg will in?uence the topic distributionθg of a graph g.In(8),it can be seen thatγg is in?uenced by topic assignments?g,n of its nodes and?g,n is in turn impacted by its neighbors as(9)shown.This is consisted with our former discussion about GTM.
D.MCMC Inference
Another method to get posterior distribution in(4)for each graph is Gibbs sampling,which construct a Markov chain with stationary distribution as the desired posterior distribution. What we need to do is to?nd the conditional distribu-tions for each variables in this posterior distribution in the model.
At?rst,since the prior ofθis Dirichlet distribution and its likelihood is multinomial distribution,the posterior distribution ofθg conditioned on all other variables is easily found out as p(θg|···)~Dir(α1+m g,1,α2+m g,2,...,αK+m g,K)
(12) where m g,k is the number of z i=k in graph g.Equation(13) relies on the conjugation between Dirichlet distribution and multinomial distribution.
Sampling z will be a little more complicated.We know that the prior for z g,n=k is multinomial distribution parameterized 3https://www.doczj.com/doc/7b2688721.html,/wiki/Gradient_descent
4https://www.doczj.com/doc/7b2688721.html,/wiki/Newton’s_method byθg.The likelihood should be
p(n|φz=k)·
?
?
m∈Ne(n)
p(e n,m=1|φz=k,φk m)
?
?
?
?
j/∈Ne(n)
p(e n,j=0|φz=k,φk j)
?
?(13)
where k m is the topic assignment of node m.The likelihood contains three parts.The?rst part is for the generation of node n.Second part is for the generation of edges in graph g. It should be noted that the third part,which is for the edges with0weights,is also necessary.With the prior and likelihood in hand,the conditional distribution of z g,n=k is given as p(z g,n=k|···)
∝θk·p(n|φk)·
?
?
m∈Ne(n)
p(e n,m=1|φk,φk m)
?
?
?
?
j/∈Ne(n)
p(e n,j=0|φk,φk j)
?
?.(14)
For theφk,its prior is Dirichlet distribution with parameterβ.The likelihood should be derived for its condi-tional distribution.In GTM,the are used to generate nodes and edges.So,the likelihood for node generations ofφk is
n:k n=k
p(n|φk)(15)
n:k n=k are the nodes that are assigned to topic k.And the likelihood for edge generations is
?
?
e n,m=1&k n=k
p(e n,m=1|φk,φk m)
?
?
?
?
e n,m=0&k n=k
p(e n,m=0|φk,φk m)
?
?.(16)
Here,all the edges with one node assigned to topic k are separated into two groups,one is with weight1(existence) and one is with weight0(nonexistence).Combine the prior and two likelihoods
p(φk|···)∝p(φk|β)·
n:k n=k
p(n|φk)
?
?
e n,m=1
k n=k
p(e n,m=1|φk,φk m)
?
?
?
?
e n,m=0
k n=k
p(e n,m=0|φk,φk m)
?
?.(17)
The iterative samplingθg,z g,andφ1:K for all graphs will get the samples of posterior distribution of the whole dataset. Except forθg,z g,andφ1:K,the model parametersαandβcould also join the sampling without prede?ning speci?c val-ues.For the symmetric Dirichlet distribution,the prior for αandβcould be Gamma distribution and the likelihoods
Fig.5.Illustrative example.
Algorithm2:MCMC Inference for GTM
Input:Topic number K,graph dataset G
Output:φ,θand z
1:random initialization of variablesφ,θand z
2:i=1
3:while i≤max iteration do
4:for g=0to|G|do
5:Updateθg through Eq.(13)
6:Update z g through Eq.(14)
7:end for
8:Updateφthrough Eq.(17)
9:i=i+1.
10:end while
are also easily computed.The?nal algorithm,named MCMC inference for GTM,is described in Algorithm2.
E.Intuitive Example to Show the Implication of GTM Here,a simple example is made up to show how the algo-rithms work.Suppose we have a document graph dataset that contains three document graphs as shown in Fig.5.There are only two hidden topics discussed in these documents: 1)the?rst is about planting apple tree and2)the second is about apple computer and electronic equipments.The topic assignment of each graph can be represented by a2-D vec-tor(a,b)in which a denotes the probability of this graph assigned to?rst topic and b denotes the probability of this graph assigned to second topic.In Fig.5,?rst frame denotes a very simple graph in dataset and composed by three nodes (words):1)plant;2)CPU;and3)apple with an edge between apple and CPU and an edge between apple and plant.The other two graphs have same nodes with the?rst one but different edges.
At?rst,we can see that this graph dataset will be equal to the corresponding instance dataset if the edges are omitted. In this situation,all the graphs are identical.Take the?rst graph as an example,there is one word CPU that belongs to second topic apple computer and electronic equipments. At the same time,there is one word“plant”that belongs to ?rst topic planting apple tree.Third word apple could belong to either one.To sum up,the topic assignment of the?rst graph is(0.5,0.5).The other two graphs are same with the ?rst graph.
However,when we consider their structure(edges),three graphs are not identical any more.Take Algorithm2as an example.We do the following steps.
1)Input:Three graphs and topic number is two.
2)Initialization:Randomly set the topic assignments of
graphs.Here,we give them the same topic assignments:
(0.5,0.5);topic assignments of keywords of all graphs:
(0.5,0.5);and the keyword assignments(apple,CPU,
plant)of topics(0.33,0.33,0.34).
3)For the?rst graph,we can update the topic assignment
of the?rst graph from(0.5,0.5)to(0.5,0.5),according to(13).
4)According to(14),the topic assignment of apple will
change from(0.5,0.5)to(0.5,0.5),the topic assign-ment of CPU will change from(0,1)to(0.2,0.8),and the topic assignment of plant will change from(1,0)to
(0.8,0.2).
5)For the second graph,we can update its topic assignment
from(0.5,0.5)to(0.3,0.7),according to(13).
6)According to(14),the topic assignment of apple will
change from(0.5,0.5)to(0.3,0.7),the topic assign-ment of CPU will change from(0,1)to(0.1,0.9),and the topic assignment of plant will change from(1,0) to(1,0).
7)For the third graph,we can update its topic assignment
from(0.5,0.5)to(0.7,0.3),according to(13).
8)According to(14),the topic assignment of“apple”will
change from(0.5,0.5)to(0.7,0.3),the topic assign-ment of CPU will change from(0,1)to(0.1,0.9),and the topic assignment of plant will change from(1,0)to
(0.9,0.1).
9)Then,we update keyword assignment of topics
using(17),the?rst topic from(0.33,0.33,0.34) to(0.3,0.2,0.5),and the second topic from
(0.33,0.33,0.34)to(0.3,0.5,0.2).
10)Stop until reach the max iteration number.
Using the Algorithm2,we get different topic assignments of graphs.The topic assignment of the?rst graph does not change.But the one of second graph changes from(0.5,0.5)
TABLE II
S TATISTICS OF D OCUMENT G RAPH D
ATASET
TABLE III
V ALUE OF
ρ
(the result of omitting edges)to(0.3,0.7)(the result of Algorithm2).It means the second graph is more likely dis-cussing second topic.The reason why the Algorithm2gets this result is because there is an edge between apple and CPU. By the effect of this edge,the word apple is more likely dis-cussing second topic.Overall,the second graph is more tend to talk about second topic.
From this simple example,we can see that the edges do affect the hidden topic discovery and intuitively these edges can improve the accuracy of discovered topics from Fig.5. Next,we will test on the real-world datasets to verify our algorithms.
IV.E XPERIMENTS AND R ESULT A NALYSIS
In order to verifying the merit of considering edges between nodes,we compare our proposed GTM with LDA on two dif-ferent types of datasets,one type is document and the other is chemical formula.The objects are represented as instances and graphs and trained by LDA and GTM,respectively.After that,objects are rerepresented by the topic distributions that are outputs of both models.This new rerepresented objects are used for a typical graph mining task-classi?cation.The accurate classi?cation result means the topics can better rep-resent the semantic of objects.The implementation of LDA is from JGibbLDA.5The two inference methods of GTM are implemented by MATLAB in this paper for documents and chemical formula,respectively.
A.Document Classi?cation
The document dataset used here is Reuters-215786in which documents have been labeled with topics.Two topics,“earn”and“acq,”are selected and some statistics are shown in Table II after removing documents which have less than ten keywords(only considering noun and verb).Each document in these two topics is represented by90%of keywords(only considering noun and verb)ranked by tf-idf[46]in this doc-ument.k-nearest neighbor algorithm(k-NN)[47]is selected as the classi?cation method,because it is simple and does not do much operations on the features of data comparing with other classi?cation methods,like decision tree or support vector machine(SVM).The implementation of k-NN comes 5https://www.doczj.com/doc/7b2688721.html,/#Grif?ths04
6http://www.daviddlewis.
com/resources/testcollections/reuters21578/Fig.6.Threshold of relations between
keywords.
Fig.7.In?uence of parameter of k-NN(the number of neighbors from 5to
50).
Fig.8.In?uence of parameter of k-NN(the number of neighbors from 50to500).
from Weka7with ten times cross-validation.In order to com-pare LDA and GTM,the numbers of topics are all set2which is just the number of topics of data.
7https://www.doczj.com/doc/7b2688721.html,/ml/weka/
Fig.9.Log likelihoods of GTM at each iteration by MCMC inference and the classi?ers.Here,we use four different classi?ers:1)k-NN;2)decision tree(J48); Since relations between keywords are considered in GTM,
the number of links in documents need to be given,which
is controlled by threshold of co-occurrence frequencyρ.
As shown in Fig.6,the distribution of average density of
document graphs andρapproximate power-law distribution.
The average document graph densities are given in Table III
in which four kinds of density and correspondingρare given.
The results are shown in Figs.7and8.There are six meth-
ods are compared in these two?gures:1)LDA-tf(original
LDA);2)LDA-t?df(use tf-idf to replace tf of keyword weights
in original LDA[48]);3)GTM-0.01(GTM withρ=0.01);
4)GTM-0.0042(GTM withρ=0.0042);5)GTM-0.0017
(GTM withρ=0.0017);and6)GTM-0.0006(GTM with ρ=0.0006).To sum all,the ef?ciency of GTM is better than LDA.The density of average graphs impacts on the ef?ciency
of GTM,because the GTM relies on the relations between
keywords.However,it does not mean that the more links the is
B.
8 Each chemical formula is represented as a graph with atoms as nodes and bonds as edges.According to the activity against corresponding cancer,each graph has a label“active”or “inactive.”We use them as the dataset,and select1000active and inactive graphs of which frequent subgraphs are mined by 8https://www.doczj.com/doc/7b2688721.html,
TABLE IV
S TATISTICS OF C HEMICAL G RAPH D
ATASET
gSpan algorithm9with support30.The statistics are shown in Table IV.We use these graphs as the original data and trans-form them into new graphs with frequent subgraphs as nodes by the method proposed in2.
To compare the performance of GTM with LDA,we use the topic distributions from both LDA and GTM as the new rep-resentations of graphs to do classi?cation.The more accurate the discovered topics are,the better the classi?cation results would be.The MCMC inference method is used for GTM in this section.Fig.9shows the convergence of log likelihood of GTM with Gibbs iteration number.The?nal results are also shown in Fig.9.Here,four different classi?ers are adopted, including k-NN,J48,SVM,and NB(implementations are also from Weka).Except the SVM for NCI81,all the classi?ers on three datasets indicate that the topics learned from the GTM are better than LDA.It should be noted that these differences are determined by the natures of different classi?ers.Some classi?ers,like kNN and J48,are more sensitive to the dif-ferent data representation(the topic distribution from GTM or LDA)and some are not,like NB.This difference is not our focus in this paper.We only use these classi?ers to show the topics mined from our proposed GTM are better than the ones from LDA.To sum up,our proposed GTM outweighs LDA. Normally,the variational inference is more ef?cient than MCMC inference,and MCMC inference is more easily extended to some more complicated tasks.In this paper,we just show two basic inferences for graph mining.More graph mining tasks can be bene?t from topic models by extending them.
V.C ONCLUSION
In order to extend the topic model for graph mining,we have proposed a GTM.The innovative premise of this model is that Bernoulli distributions has been used to model the edges between two nodes in a graph,which are parameterized by the similarity between two topics of two linked nodes.Considering the edges of graphs,the discovered topic distribution of a graph by GTM is not just determined by its nodes.Two infer-ence algorithms have been developed to resolve the proposed model.The experimental results on different datasets have ver-i?ed that the topics discovered by GTM can describe graphs better than the ones from LDA.This improvement is due to the fact that the edges of graphs are considered in our innovative model and this makes the discovered topics far more suitable for the graph data.Therefore,the proposed model can be used 9https://www.doczj.com/doc/7b2688721.html,/~xyan/software/gSpan.htm for graph mining,including the supervised learning and unsu-pervised learning.Possible applications that could be improved by our proposed model also include document retrieval and chemical graph labeling.
In the future,we aim to investigate how to incorporate the structural information of graphs into the model and not just consider each edge separately.The reason for this is that there should be some hidden relations between these edges which will impact on their formation as well.Incorporating these structures may further improve the classi?cation accuracy. Another interesting extension of this paper is to use nonpara-metric learning methods to avoid prede?ning the number of topics,e.g.,hierarchical Dirichlet processes[49].
A PPENDIX
Some Derivation of Variational Inference
For(7),we can expand it as
log p(n g,e g|α,β)
≥E q
log p(θg,z g,φ1:K,n g,e g|α,β)
?E q
log q
θg,z g,φ1:K
=
N
n
E q
log p
w g,n|z g,n,φ
+E q
log p
θg|α
+
(n i,n j)
E q
log p
c n
i,n j
|z g,n
i
,z g,n
j
,φz
n i
,φz
n j
+
K
k
E q
log p(φk|β)
+
N
n
E q
log p
z g,n|θg
?
K
k
E q
log qφ(φk|κk)
?
N
n
E q
log q z
z g,n|?g,n
?E q
log qθ
θg|γg
.(18) Since many parts of(18)are similar with other topic models, we just focus on the third part of this equation which is related to the relations between keywords
(n i,n j)
E q
log p
e n
i,n j
|z g,n
i
,z g,n
j
,φz
n i
,φz
n j
=
(n i,n j)
E q
log
φz
g,n i
?φz
g,n j
≈
(n i,n j)
E q
ζ?1
K
k
φz
g,n i,k
·φz
g,n j,k
+logζ?1
=
(n i,n j)
ζ?1κ?g,n i,k
k,n i
·κ?g,n j,k
k,n j
+logζ?1
.(19)
In(19),we use the Taylor expansion for function log(x) in order to get the expectation of this function andζis the expansion point.
R EFERENCES
[1] D.Chakrabarti and C.Faloutsos,“Graph mining:Laws,generators,and
algorithms,”ACM Comput.Surv.,vol.38,no.1,p.2,2006.
[2]S.Rehman,A.Khan,and S.Fong,“Graph mining:A survey of graph
mining techniques,”in Proc.7th Int.Conf.Digit.Inf.Manage.(ICDIM), Macau,China,2012,pp.88–92.
[3]X.Luo,N.Fang,B.Hu,K.Yan,and H.Xiao,“Semantic representa-
tion of scienti?c documents for the e-science knowledge grid,”Concurr.
Comput.Pract.Exp.,vol.20,no.7,pp.839–862,2008.
[4]J.Tomita,H.Nakawatase,and M.Ishii,“Calculating similarity between
texts using graph-based text representation model,”in Proc.13th ACM Int.Conf.Inf.Knowl.Manage.(CIKM),Washington,DC,USA,2004, pp.248–249.
[5]J.V ogelstein,W.Roncal,R.V ogelstein,and C.Priebe,“Graph classi?-
cation using signal-subgraphs:Applications in statistical connectomics,”
IEEE Trans.Pattern Anal.Mach.Intell.,vol.35,no.7,pp.1539–1551, Jul.2013.
[6]X.Kong,W.Fan,and P.S.Yu,“Dual active feature and sample selection
for graph classi?cation,”in Proc.17th ACM SIGKDD Int.Conf.Knowl.
Disc.Data Min.(KDD),New York,NY,USA,2011,pp.654–662. [7]K.Henderson et al.,“It’s who you know:Graph mining using recursive
structural features,”in Proc.17th ACM SIGKDD Int.Conf.Knowl.Disc.
Data Min.(KDD),New York,NY,USA,2011,pp.663–671.
[8]Q.Liu,H.Huang,and C.Feng,“Micro-blog post topic drift detec-
tion based on LDA model,”in Behavior and Social Computing (Lecture Notes in Computer Science8178),L.Cao et al.,Eds.Cham, Switzerland:Springer,2013,pp.106–118.
[9]J.Varadarajan,R.Emonet,and J.-M.Odobez,“A sequential topic
model for mining recurrent activities from long term video logs,”Int.J.
Comput.Vis.,vol.103,no.1,pp.100–126,2013.
[10]M.I.Jordan,Learning in Graphical Models.Cambridge,MA,USA:
MIT Press,2002.
[11] D.M.Blei,A.Y.Ng,and M.I.Jordan,“Latent Dirichlet allocation,”
J.Mach.Learn.Res.,vol.3,pp.993–1022,Jan.2003.
[12]X.Wang and A.McCallum,“Topics over time:A non-Markov
continuous-time model of topical trends,”in Proc.12th ACM SIGKDD Int.Conf.Knowl.Disc.Data Min.(KDD),Philadelphia,PA,USA,2006, pp.424–433.
[13]T.Hofmann,“Probabilistic latent semantic indexing,”in Proc.22nd
Annu.Int.ACM SIGIR Conf.Res.Dev.Inf.Retrieval(SIGIR),Berkeley, CA,USA,1999,pp.50–57.
[14]S.Deerwester,S.T.Dumais,G.W.Furnas,https://www.doczj.com/doc/7b2688721.html,ndauer,and
R.Harshman,“Indexing by latent semantic analysis,”J.Assoc.Inf.Sci.
Tech.,vol.41,no.6,pp.391–407,1990.
[15]https://www.doczj.com/doc/7b2688721.html,ndauer,D.S.McNamara,S.Dennis,and W.Kintsch,Handbook
of Latent Semantic Analysis.New York,NY,USA:Psychology Press, 2013.
[16]J.D.Mcauliffe and D.M.Blei.“Supervised topic models,”in Proc.
Adv.Neural Inf.Process.Syst.(NIPS),2008,pp.121–128.
[17]M.Rosen-Zvi, C.Chemudugunta,T.Grif?ths,P.Smyth,and
M.Steyvers,“Learning author-topic models from text corpora,”ACM Trans.Inf.Syst.,vol.28,no.1,p.4,2010.
[18]S.Bao et al.,“Mining social emotions from affective text,”IEEE Trans.
Knowl.Data Eng.,vol.24,no.9,pp.1658–1670,Sep.2012.
[19]V.Jelisavcic,B.Furlan,J.Protic,and https://www.doczj.com/doc/7b2688721.html,utinovic,“Topic models and
advanced algorithms for pro?ling of knowledge in scienti?c papers,”in Proc.35th Int.Conv.(MIPRO),Opatija,Croatia,2012,pp.1030–1035.
[20] A.Daud,J.Li,L.Zhou,and F.Muhammad,“Knowledge discov-
ery through directed probabilistic topic models:A survey,”Frontiers Comput.Sci.China,vol.4,no.2,pp.280–301,2010.
[21] D.M.Blei and https://www.doczj.com/doc/7b2688721.html,fferty,“A correlated topic model of science,”
Ann.Appl.Stat.,vol.1,no.1,pp.17–35,2007.
[22]J.Paisley, C.Wang, D.Blei,and M.Jordan,“Nested hierarchical
Dirichlet processes,”IEEE Trans.Pattern Anal.Mach.Intell.,vol.37, no.2,pp.256–270,Feb.2015.
[23]J.Chang and D.M.Blei,“Hierarchical relational models for document
networks,”Ann.Appl.Stat.,vol.4,no.1,pp.124–150,2010.
[24]R.M.Nallapati,A.Ahmed,E.P.Xing,and W.W.Cohen,“Joint latent
topic models for text and citations,”in Proc.14th ACM SIGKDD Int.
Conf.Knowl.Disc.Data Min.(KDD),Las Vegas,NV,USA,2008, pp.542–550.
[25]T.L.Grif?ths,M.Steyvers, D.M.Blei,and J. B.Tenenbaum,
“Integrating topics and syntax,”in Proc.Neural Inf.Process.
Syst.(NIPS),Whistler,BC,Canada,2005,pp.537–544.
[26]M.Andrews and G.Vigliocco,“The hidden Markov topic model:
A probabilistic model of semantic representation,”Topics Cogn.Sci.,
vol.2,no.1,pp.101–113,2010.
[27]S.Parthasarathy,S.Tatikonda,and D.Ucar,“A survey of graph min-
ing techniques for biological datasets,”in Managing and Mining Graph Data.New York,NY,USA:Springer,2010,pp.547–580.
[28] C.Jiang,F.Coenen,and M.Zito,“A survey of frequent subgraph mining
algorithms,”Knowl.Eng.Rev.,vol.28,no.1,pp.75–105,2013.[29]M.Kuramochi and G.Karypis,“Frequent subgraph discovery,”in Proc.
Int.Conf.Data Min.(ICDM),San Jose,CA,USA,2001,pp.313–320.
[30]N.Vanetik, E.Gudes,and S. E.Shimony,“Computing frequent
graph patterns from semistructured data,”in Proc.Int.Conf.Data Min.(ICDM),Melbourne,FL,USA,2002,pp.458–465.
[31]X.Yan and J.Han,“CloseGraph:Mining closed frequent graph pat-
terns,”in Proc.9th ACM SIGKDD Int.Conf.Knowl.Disc.Data Min.(KDD),Washington,DC,USA,2003,pp.286–295.
[32]S.Nijssen and J.N.Kok,“A quickstart in frequent structure mining
can make a difference,”in Proc.10th ACM SIGKDD Int.Conf.Knowl.
Disc.Data Min.(KDD),Washington,DC,USA,2004,pp.647–652.
[33]S.Wang,J.Wang,and F.L.Chung,“Kernel density estimation,kernel
methods,and fast learning in large data sets,”IEEE Trans.Cybern., vol.44,no.1,pp.1–20,Jan.2014.
[34]H.Kashima,K.Tsuda,and A.Inokuchi,“Marginalized kernels between
labeled graphs,”in Proc.20th Int.Conf.Mach.Learn.(ICML),vol.3.
Washington,DC,USA,2003,pp.321–328.
[35]N.Shervashidze,P.Schweitzer,E.J.van Leeuwen,K.Mehlhorn,and
K.M.Borgwardt,“Weisfeiler-Lehman graph kernels,”J.Mach.Learn.
Res.,vol.12,pp.2539–2561,Feb.2011.
[36]W.Imrich and S.Klavzar,Product Graphs Structure and Recognition.
New York,NY,USA:Wiley,2000.
[37]S.V.N.Vishwanathan,N.N.Schraudolph,R.Kondor,and
K.M.Borgwardt,“Graph kernels,”J.Mach.Learn.Res.,vol.11, pp.1201–1242,Aug.2010.
[38]H.Saigo,S.Nowozin,T.Kadowaki,T.Kudo,and K.Tsuda,“gBoost:
A mathematical programming approach to graph classi?cation and
regression,”Mach.Learn.,vol.75,no.1,pp.69–89,2009.
[39]Y.Zhao,X.Kong,and P.Yu,“Positive and unlabeled learning for graph
classi?cation,”in Proc.Int.Conf.Data Min.(ICDM),Vancouver,BC, Canada,2011,pp.962–971.
[40] E.Kenley and Y.-R.Cho,“Entropy-based graph clustering:Application
to biological and social networks,”in Proc.Int.Conf.Data Min.(ICDM), Vancouver,BC,Canada,2011,pp.1116–1121.
[41]H.N.Djidjev and M.Onus,“Scalable and accurate graph clustering
and community structure detection,”IEEE Trans.Parallel Distrib.Syst., vol.24,no.5,pp.1022–1029,Jan.2013.
[42]G.Klyne,J.J.Carroll,and B.McBride,“Resource description frame-
work(RDF):Concepts and abstract syntax,”W3C Recommendation, vol.10,Feb.2004.[Online].Available:https://www.doczj.com/doc/7b2688721.html,/TR/2004/ REC-rdf-syntax-grammar-20040210/
[43]K.Amailef and J.Lu,“Ontology-supported case-based reasoning
approach for intelligent m-Government emergency response services,”
Decis.Support Syst.,vol.55,no.1,pp.79–97,2013.
[44] C.Wang,J.Lu,and G.Zhang,“Integration of ontology data through
learning instance matching,”in Proc.IEEE/WIC/ACM Int.Conf.Web Intell.(WI),Hong Kong,2006,pp.536–539.
[45] A.A.Shelat and R.K.Guy,“Scaffold composition and biological
relevance of screening libraries,”Nature Chem.Biol.,vol.3,no.8, pp.442–446,2007.
[46]G.Salton and C.Buckley,“Term-weighting approaches in automatic
text retrieval,”Inf.Process.Manage.,vol.24,no.5,pp.513–523,1988.
[47]T.Cover and P.Hart,“Nearest neighbor pattern classi?cation,”IEEE
Trans.Inf.Theory,vol.13,no.1,pp.21–27,Jan.1967.
[48] A.T.Wilson and P.A.Chew,“Term weighting schemes for latent
Dirichlet allocation,”in Proc.Annu.Conf.North Amer.Chapter Assoc.
Comput.Linguist.Human Lang.Technol.(NAACL HLT),Los Angeles, CA,USA,2010,pp.465–473.
[49]Y.W.Teh,M.I.Jordan,M.J.Beal,and D.M.Blei,“Hierarchical
Dirichlet processes,”J.Amer.Stat.Assoc.,vol.101,no.476, pp.1566–1581,
2006.
Junyu Xuan received the bachelor’s degree from
the China University of Geosciences,Beijing,China,
in2008.He is currently pursuing the dual-doctoral
degrees from Shanghai University,Shanghai,China,
and the University of Technology,Sydney,Ultimo,
NSW,Australia.
His current research interests include machine
learning,complex network,and web mining.
Jie Lu(SM’13)received the Ph.D.degree from
Curtin University,Perth,Australia,in2000.
She is a Full Professor and the Head of the School
of Software,University of Technology,Sydney,
Ultimo,NSW,Australia.Her current research inter-
ests include decision support systems and uncer-
tain information processing.She has published?ve
research books and270papers.
Prof.Lu was the recipient of the?ve Australian
Research Council Discovery Grants and ten other
grants and the University Research Excellent Medal in2010.She serves as an Editor-in-Chief for Knowledge-Based Systems (Elsevier),the International Journal of Computational Intelligence Systems (Atlantis),an Editor for book series on Intelligent Information Systems(World Scienti?c)and a Guest Editor for six special issues for international journals,
as well as delivered six keynote speeches at international
conferences.
Guangquan Zhang received the Ph.D.degree in
applied mathematics from the Curtin University of
Technology,Perth,WA,Australia.
He is an Associate Professor with the Faculty of
Engineering and Information Technology,University
of Technology,Sydney,Ultimo,NSW,Australia.He
was with the Department of Mathematics,Hebei
University,Baoding,China,from1979to1997,as
a Lecturer,an Associate Professor,and a Professor.
His current research interests include the multiob-
jective,bilevel and group decision making,decision support system tools,fuzzy measure,fuzzy optimization,and uncertain infor-mation processing.He has published four monographs,four reference books, and over200papers in refereed journals,conference proceedings,and book chapters.
Prof.Zhang was the recipient of the four Australian Research Council Discovery Grants and several research
grants.
Xiangfeng Luo(M’10)received the master’s
and Ph.D.degree from the Hefei University of
Technology,Hefei,China,in2000and2003,
respectively.
He is a Professor with the School of Computers,
Shanghai University,Shanghai,China.He is cur-
rently a Visiting Professor with Purdue University,
West Lafayette,IN,USA.He was a Post-Doctoral
Researcher at the China Knowledge Grid Research
Group,Institute of Computing Technology,Chinese
Academy of Sciences,Beijing,China,from2003to 2005.His current research interests include web wisdom,cognitive informat-ics,and text understanding.He has authored or co-authored over50publi-cations and his publications have appeared in the IEEE T RANSACTIONS ON A UTOMATION S CIENCE AND E NGINEERING,the IEEE T RANSACTIONS ON S YSTEMS,M AN,AND C YBERNETICS-P ART C,the IEEE T RANSACTIONS ON L EARNING T ECHNOLOGY,Concurrency and Computation:Practice and Experience,and New Generation Computing.
Dr.Luo has served as a Guest Editor of ACM Transactions on Intelligent Systems and Technology.He has also served on the committees of sev-eral conferences/workshops,including the Program Co-Chair of International Conference on Web-based Learning2010(Shanghai),International Workshop on Web Information Systems Modeling2012(Chengdu),International Workshop on Cognitive-based Text Understanding and Web Wisdom2011 (Sydney),and over40PC members of conferences and workshops.