Numerical studies on the inter-particle breakage of a confined particle assembly in rock crushing
- 格式:pdf
- 大小:1.27 MB
- 文档页数:20

Geant4⽰例EXAMPLES内容简介Geant4 Example⽰例(译)⽰例的类型新⼿(Novice)-很简单:⾮相互作⽤粒⼦的平凡探测器【Simple: Trivial detector with non-interacting particles】- 详细说明:复杂的完整的物理检测【Detailed: Complex detector with full physics 】扩展(Extended)- 测试和验证【Testing and validation 】- 展⽰Geant4的⼯具【Demonstrating Geant4 tools】- 扩展Geant4【Extending Geant4】⾼级(Advanced)- 实⽤的应⽤程序【Practical applications】- 从外⾯HEP的例⼦(空间,医疗等)【Examples from outside HEP (space, medical, etc) 】新⼿例N01固定⼏何:氩⽓母卷,铝圆柱和铅铝块⽚与Al⽚块【Fixed geometry: Ar gas mother volume with Al cylinder and Pb block with Al slices】⼊射粒⼦是⼀个geantino;没有物理相互作⽤【Incident particle is a geantino;no physics interactions】⽆磁场,只有运输过程中启⽤【No magnetic field and only the transportation process is enabled】硬编码的批处理作业和冗长【Hard coded batch job and verbosity】新⼿⽰例N02铅靶,氙⽓室【Pb target, Xe gas chambers】所有的EM流程+衰变,γ和带电轻⼦和带电强⼦【All EM processes + decay,included for γ, charged leptons and charged hadrons】探测器响应【Detector response】轨迹和命中可能被存储【Trajectories and chamber hit collections maybe stored】可视化检测器和事件【Visualization of detector and event】命令接⼝介绍【Command interface introduced】运⾏时可以改变⽬标,室材料,⼊射粒⼦类型,动量等【Can change target, chamber materials, incident particle type, momentum, etc. at run time】Ps:⼊射三种粒⼦,先经过⼀个⼩铅块(标出)然后经过五个氙⽓室(黄⾊)。
主动配电网分布式电源渗透率研究刘 剑,李学斌(中国能源建设集团天津电力设计院,天津 300400)摘要:本文提出一种基于网络重构的提高主动配电网分布式电源渗透率的方法。
一种基于粒子群和启发式算法的混合优化方法被用来寻找具有更高渗透率的网络结构。
首先,利用二进制粒子群(BPSO)优化算法进行初始搜索,然后,对粒子群优化结果进行聚类分析,作为启发式算法的初始解进一步寻优。
一种新的网络拓扑分析方法与粒子群算法相结合用于提高粒子的搜索效率。
连续潮流方法被用来精确求解配电网最大输送能力,克服常规潮流计算分岔点附近不收敛的问题。
通过IEEE123算例仿真分析,测试结果验证了本文所提方法在大幅提高系统最大输送能力方面的有效性。
关键词:主动配电网;分布式电源;网络重构;二进制粒子群优化算法;连续潮流;启发式方法。
中图分类号:TM72 文献标志码:B 文章编号:1671-9913(2018)S2-0239-06Research on Distributed Power SupplyPermeability of Active D istribution NetworkLIU Jian, LI Xue-bin(China Energy Engineering Group Tianjin Electric Power Design Institute, Tianjin 300400, China)Abstract: This paper proposes a method based on network reconfiguration technology to improve the permeability of DG outs in an active distribution network. A hybrid optimization method based on particle swarm optimization (PSO) is used to seek the better network configuration with a higher permeability. Firstly, binary particle swarm optimization (BPSO) algorithm is employed for a preliminary search. Secondly, make the results obtained from PSO clustering analysis and are used as the initial solution of the heuristic algorithm. A new method of network topology analysis combined with PSO is used to improve the efficiency of particle search. The continuation power flow method is used to seek the maximum delivery capacity of distribution network accurately, overcoming the problem of nonconvergence near the bifurcation point for the conventional power flow solver. The IEEE 123-bus test network is used to verify the proposed methodology and the numerical studies demonstrate the effectiveness of the proposed methodology in greatly increasing available delivery capability.Key words: active distribution network; distributed generation; network reconfiguration; BPSO; continuation power flow; heuristic method.* 收稿日期:2018-04-11作者简介:刘剑(1984- ),男,江苏邳州人,硕士,工程师,从事智能配电网研究及设计工作。
PERSPECTIVESChinese Journal of Chemical Engineering, 18(6) 889—898 (2010)Advances in Studies on Turbulent Dispersed Multiphase Flows*ZHOU Lixing (周力行)**Department of Engineering Mechanics, Tsinghua University, Beijing 100084, ChinaAbstract Dispersed multiphase flows, including gas-particle (gas-solid), gas-spray, liquid-particle (liquid-solid), liquid-bubble, and bubble-liquid-particle flows, are widely encountered in power, chemical and metallurgical, aeronautical and astronautical, transportation, hydraulic and nuclear engineering. In this paper, advances and re-search needs in fundamental studies of dispersed multiphase flows, including the particle/droplet/bubble dynamics, particle-particle, droplet-droplet and bubble-bubble interactions, gas-particle and bubble-liquid turbulence interac-tions, particle-wall interaction, numerical simulation of dispersed multiphase flows, including Reynolds-averaged modeling (RANS modeling), large-eddy simulation (LES) and direct numerical simulation (DNS) are reviewed.The research results obtained by the present author are also included in this review.Keywords dispersed flows, multiphase flows, turbulent flows, fundamentals, numerical simulation1 INTRODUCTIONDispersed multiphase flows denote gas-particle (gas-solid), gas-spray, liquid-particle (liquid-solid), liquid-bubble, and bubble-liquid-particle flows, where the continuous phase is fluid (gas or liquid) and the dispersed phase is particles (including droplets and bubbles). Unlike these kinds of multiphase flows there are gas-liquid stratified flows, annular flows, plug flows and bullet flows. Dispersed multiphase flows are widely encountered in natural environment and biological bodies. Examples are dust in air, sedimen-tation in river, cosmic dust, cloud and fog, air-sand flows, and blood flows. There is a variety of dispersed multiphase flows in engineering, such as pneumatic and hydraulic conveying, dust/droplet separation and collection, spray/pulverized-coal combustion, fluid-ized beds, spray cooling/drying/coating, plasma chem-istry, bubble-particle-liquid flows in steel making fur-naces, gas-particle flows in solid rockets and gun bar-rels, gas-fiber flows in textile engineering, bubbling steam-water flows in boilers, nuclear reactors and pe-troleum pipes. In most engineering facilities due to large geometrical sizes, higher flow velocity and the existence of various barriers, sudden expansions or swirlers, the flows are complex turbulent flows.In order to understand the physical phenomena of dispersed multiphase flows, fundamental studies, nu-merical simulation and measurements were carried out for many years. Fundamental studies cover particle/ droplet/bubble dynamics, particle/droplet/bubble-fluid turbulence interactions, particle-particle, droplet-droplet and bubble-bubble collisions and particle/droplet/bubble- wall interactions.For numerical modeling, there are two ap-proaches: Eulerian-Eulerian (or two-fluid) modeling and Eulerian-Lagrangian modeling. In E-E modeling, besides the modeling of fluid flows the dispersed phase is regarded as a pseudo fluid. The continuous and dispersed phases coexist in the same space and interpenetrate with each other; both of them are de-scribed in Eulerian coordinates. On the other hand, in E-L modeling, only the fluid is regarded as a continu-ous phase and described in Eulerian coordinates, whereas particles are treated as a discrete system and are described in Lagrangian coordinates. The Lagran-gian approach is also called particle trajectory ap-proach, which is equivalent to a direct numerical simulation of the dispersed phase. In the 1950s to 1960s, the particle motion was simulated using the single-particle dynamics model [1], where the parti-cle/droplet trajectories in a known flow field (e.g. uniform velocity and temperature fields) were consid-ered and the effect of particles on the fluid flows is neglected (one-way coupling). Also, the particle fluc-tuation was not considered (diffusion frozen). This analytical method is too simple, far from the practical situation, and nowadays is no more used as a simula-tion method, but it is helpful for understanding the basic phenomena of particle motion, such as the “par-ticle relaxation time” and “particle terminal velocity”. Near the end of 60s years of the last century the con-cept of pseudo fluid of particles was proposed, where the velocity slip between fluid and particles is consid-ered as a result of particle diffusion drift, i.e., slip is a result of diffusion. It is called by the present author a “small-slip model”. The particles were treated in Eul-erian coordinates and the effect of particles on fluid motion was also neglected. Till the beginning of 70s of the last century, when the method of computational fluid dynamics for single-phase flows was used to simulate gas-particle flows, the single-fluid model or no-slip model was proposed, where particles are treated as a pseudo fluid in Eulerian coordinates, but no velocity slip and temperature slip between fluid and particles are taken into account, i.e., the particle velocity and temperature are considered to be equal toReceived 2010-11-02, accepted 2010-11-18.* Supported by the Key Projects of National Natural Science Foundation of China (50736006, 9587003-13), the State Key De-velopment Program for Basic Research of China (G1999-0222-08) and the National Pandeng Project of China (85-06-1-2).** To whom correspondence should be addressed. E-mail: zhoulx@Chin. J. Chem. Eng., Vol. 18, No. 6, December 2010 890the fluid velocity and temperature everywhere; the continuous and dispersed phases are in dynamic and thermodynamic equilibrium. Also, the particle fluc-tuation is assumed to be equal to the fluid fluctuation (diffusion equilibrium). Hence this model is called single-fluid model or no-slip model. It is another kind of simplified models, and in many cases it is far from the practical situation. Since the 80s years of the 20th century, the full particle trajectory models and two-fluid models were proposed.In the full particle trajectory model, the particles are treated as a discrete system and the particle motion is described in Lagrangian coordinates, with both ve-locity and temperature slip considered. Unlike the single- particle dynamics model, in the modern particle tra-jectory models, the mass, momentum and energy cou-pling between the fluid and particle phases are taken into account, i.e. it is a two-way coupling model. The particle trajectory models are divided into “determi-nistic trajectory models”, in which the particle diffu-sion (dispersion) due to fluctuation is not taken into account, and “stochastic trajectory models” account-ing for the particle fluctuation. For dense fluid- parti-cle flows, it is needed to introduce inter-particle colli-sion or particle-particle interaction models, so some-times it is called four-way coupling models.In modern Eulerian-Eulerian models or two-fluid models, particles are treated as a pseudo fluid; the par-ticle motion is described in Eulerian coordinates. Unlike the single-fluid model and the small-slip model, not only the velocity and temperature slips are taken into account, but also they are not related to particle diffusion. The particle diffusion is a result of particle fluctuation. The E-E models are also two-way cou-pling or four-way coupling models. For E-E models, it is necessary to develop particle turbulence models such as particle turbulent kinetic energy or particle Reynolds stress equation models.The above-stated simulation is based on Reynolds-averaged Navier-Stokes simulation, and it is now called RANS modeling. In recent years, due to the development of computer hardware and CFD software, more refined simulation, called large-eddy simulation (LES) and direct numerical simulation (DNS) for single-phase flows are introduced to the simulation of dispersed multiphase flows. DNS needs not any closure models, it can give the detailed struc-ture of all scales, but it needs huge computation re-quirement and cannot be directly used to solve engi-neering problems. It can be used to validate the LES or RANS modeling. Comparing to RANS modeling, LES can give the detailed instantaneous flow struc-tures and more accurate statistical results than those given by RANS modeling, but it needs much less computation requirement than DNS. So, LES is just under its fast development, and is by and by becoming a new generation of CFD tools.In the following sections a brief review of the advances in fundamental studies and numerical simu-lation of dispersed multiphase flows will be stated. 2 ADV ANCES IN FUNDAMENTAL STUDIES 2.1 Single particle/droplet/bubble dynamicsRecent studies on dispersed phase dynamics are concentrated on exerted forces and motion of particles with mass change, deformable droplets and bubbles and non-spherical (cylindrical or irregular shapes) particles. Deformation of droplets or bubbles during their motion leads to the change of exerted forces. Besides, the motion of bubbles with surfactants is dif-ferent from that of bubbles without surfactants. For the exerted forces on particles of irregular shapes, the results of some studies show the increase of Magnus force due to particle rotation, but other studies indicate that this effect is not remarkable. Sommerfeld and Kussin [2] reported their studies on the dispersion of non-spherical particles, and it was found that spherical glass beads are more homogeneously distributed across the channel than non-spherical quartz and non-spherical duroplast particles, as shown in Fig. 1.Figure 1 Particle number density profiles●glass beads 195 μm;◆Duroplast irregular 240 μm;★quartz particle 185 μmZhang and Lin [3] systematically studied the ori-entation, motion and exerted forces of cylindrical par-ticles. The forces acting on particles are studied using direct numerical simulation of turbulent flow passing a single particle by Lee and Balachandar [4] and using Lattice-Boltzmann simulation of motion of finite-size particles in turbulent flow by Sundaresan and Cate [5]. From the results of these studies the detailed flow field around a particle is obtained and by integration of the friction and pressure forces on the surface of a particle, various forces, including the drag force, lift force and added mass force are obtained. The results indicate that the relative importance of the added mass force depends on the ratio of particle/bubble material density to the fluid density. When this ratio is very small, the effect of added mass force can be neglected. The effect of small-scale turbulence on the particle drag force is also studied. Mechaelides [6] systemati-cally studied the exerted forces, heat and mass transfer of a particle/droplet/bubble. A comparison is made among the results of classical analytical solution, direct numerical simulation and Lattice-Boltzmann simulation.Chin. J. Chem. Eng., Vol. 18, No. 6, December 2010 891The effect of particle concentration on the particle drag force, and the effect of added mass force are also discussed. Based on numerical studies he suggested a drag force expression as()()()D s D s D s 24,,0,226c Re c Re c Re λλλλ−=++for 02λ≤≤, and s 51000Re <≤ (1) where Re s is the particle Reynolds number and λ is the ratio of particle material density to fluid density.In general, the exerted forces and motion of de-formable and irregular-shaped particles remain to be further studied in details.2.2 Particle-particle, droplet-droplet, bubble-bubble interactions and their collision with wallFor particle-particle interactions, hard-sphere and soft-sphere models were proposed [7]. A collision fre-quency model was proposed by Sommerfeld [8]. You et al . [9] measured the particle collision frequency using PIV and modified Sommerfeld’s formula. Zhang et al . [10] studied various forces for particle-particle elastic and plastic collisions, including van de Waals force, and proposed a particle clustering model. The bubble-bubble collisions and agglomerations are still complex, and were studied using volume of fluid (VOF) [11] and level-set methods [12]. For parti-cle-wall interaction, Zhang and Zhou [13] introduced the particle collision dynamics into the two-fluid models by using the integral over probability density distribution function (PDF), taking into account the friction, restitution and wall roughness. For example, the axial component of the particle normal Reynolds stresses at the wall is obtained as(){}()()()22b 112221122211112221121113213113123213(23)(1)33131232(12)3uu u u f e v v e f f u u f e u u f e v v ef e ef v v f e αααααα⎡⎤′′′′′=−−++⎣⎦⎡⎤′′′′′++−+⎣⎦⎡⎤′′′′′′−++++⎣⎦⎡⎤′++−−⎣⎦′+ (2)where f , e and α denote the friction coefficient, restitu-tion coefficient and wall roughness respectively, and the subscripts b and 1 denote the values at the wall and at the near-wall grid nodes respectively.2.3 Particle/bubble-fluid turbulence interactionsThis is an important aspect of fundamental stud-ies. For a long time period there was less understand-ing to particle/bubble fluctuations. Till 1986 it wasconsidered that the particle fluctuation is determined only by the local fluid fluctuation, the particle fluctua-tion, following the fluid fluctuation, is always weaker than the fluid fluctuation, and the larger the particle size, the weaker the particle fluctuation. This is the Hinze- Tchen model of particle fluctuation [14], given by21p T p T p r1T //(/)(1/)D D k k ννττ−===+ (3)where ν, D and k express the viscosity, diffusivity and turbulent kinetic energy respectively, and the subscripts p and T denote the values for particle and gas, r1T ,ττ are the particle relaxation time and gas fluctuation time respectively. However, in the 1980s to 1990s it was discovered by Zhou et al . [15] that for gas-particle jet and separating flows and in a certain range of par-ticle sizes the particle fluctuation is stronger than the fluid fluctuation, and the larger the particle size, the stronger the particle fluctuation. In contrast to previ-ous understandings, larger particles diffuse not slower but faster than smaller particles. A transport equation of particle turbulent kinetic energy was proposed by Zhou and Huang [15] as()()p p p p,p p p p pp p p j j jj N k N V k t x N k P N x x νεσ∂∂+∂∂∂⎛⎞∂=+−⎜⎟⎜⎟∂∂⎝⎠(4) Further studies indicate that the anisotropy of particle fluctuation is stronger than that of fluid. Hence, Zhou et al . subsequently proposed a unified second-order moment (USM )two-phase turbulence theory, or a theory of two-phase Reynolds stress equa-tions [16, 17] given by the following equations()()p,R,i j m i j mij ij ij ij ij ij ij v v V v v t x D P G G G ρρΠε∂∂+∂∂=+++−++ (5) ()()p p,p,p p,p,p,p,p,p,i j k i j kji ij ijN v v N V v v t x D P ε∂∂+∂∂=++ (6)It is seen that the particle turbulent kinetic energyor particle Reynolds stress depends on not only the local fluid turbulence, but also its own convection, shear production and diffusion. Hence, in some cases or in some regions of the flow field, the particle fluc-tuation may be stronger than the fluid fluctuation. This is a result of the inertia of particle fluctuation. Subse-qunt discrete-vortex and experimental studies show that small particles follow the fluid vortex motion, and medium-size particles locate at the periphery of fluid vortices, and their dispersion is stronger than that of small particles [18].Numerical simulation and experimental results validate that the k p -equation and USM model theory are more reasonable than the Hinze-Tchen theory. ForChin. J. Chem. Eng., Vol. 18, No. 6, December 2010 892bubble-liquid flows it was argued whether bubbles re-duce or induce liquid turbulence. The studies made by Zhou et al. show that under certain conditions the bub-ble fluctuation is stronger than the liquid fluctuation [19], and under different velocities and void fractions bubbles may enhance or reduce liquid turbulence [20].The interaction between inter-particle collisions and particle turbulence for dense gas-particle flows remains to be studied. Zhou et al. reports that particle- particle collision leads to redistribution of particle Rey-nolds stresses in different directions, i.e., reduction of particle fluctuation in a certain direction and enhance-ment of particle fluctuation in other directions [21].The effect of particles on fluid turbulence, i.e. the so-called turbulence modification or turbulence modu-lation is a hot point of international studies. In the 1990s, Crowe summarized the experimental results and pointed that small particles reduce fluid turbulence due to their dissipation of fluid turbulent kinetic en-ergy and larger particles enhance fluid turbulence due to their wake effect. Different investigators used laser Doppler velocimeter (LDV), phase Doppler particle anemometer (PDPA), and particle image velocimeter (PIV) to measure the turbulence modulation. Various semi-empirical expressions were proposed [22-24]. However, these semi-empirical models are insuffi-ciently used and validated in numerical simulation of turbulent gas-particle flows. In present RANS model-ing (Reynolds-Averaged Navier-Stokes modeling), LES (large-eddy simulation) and DNS (direct nu-merical simulation), the particles are treated as point sources, only models of particle reducing gas turbu-lence can be taken into account, and the particle wake effect is difficult to be taken into account. It was dis-covered in experiments that for a certain range of par-ticle sizes particles may reduce and enhance fluid tur-bulence in different locations of the same flow field. This particle size range may depend on different flow types. Based on LES of turbulent flows passing a sin-gle particle, Zeng et al. proposed a model of gas tur-bulence enhancement by the particle wake effect [25]. The additional source term due to particle wake effect in the gas Reynolds stress equation is proposed. It is shown that the production of particle turbulence due to the particle wake effect is proportional to the particle diameter and the square of relative velocity. By in-corporating this sub-model into the USM two-phase turbulence model for turbulent gas-particle flows, the effects of both reduction and enhancement of fluid turbulence by particles of different sizes in vertical and horizontal pipe flows can be properly predicted, and the modeling results are in good agreement with ex-perimental results. Hence the mechanism of the effect of solid particles on fluid turbulence is well clarified.Obviously, it still needs to further study: (1) the interaction between inter-particle collision and particle turbulence; (2) in what situations (flow types, particle Reynolds number and particle size) or in what regions of the flow field, particles reduce or enhance fluid turbulence; (3) the interaction between inter-particle collision and fluid turbulence modification. 3 ADV ANCES IN NUMERICAL SIMULATION 3.1 RANS modelingIn the framework of Eulerian-Lagrangian model-ing, the stochastic particle trajectory model is widely used in simulating practical gas-particle/droplet flows, in particular liquid spray and pulverized-coal combus-tion, because it can give the detailed particle behavior and particle mass and temperature history during reac-tions. It is a direct simulation of particle motion and needs not closure models. However, for the fluid phase, due to adopting turbulence models in RANS modeling, a model for the instantaneous velocity or fluctuation velocity should be developed. In the early stage of development Gosman and Ioannides proposed an isotropic Gaussian distribution for the random fluctuation velocity [26]. In the 1980s Cen and Fan proposed a Fourier stochastic series model of fluctua-tion frequency [27].Subsequently, Sommerfeld et al. introduced Langevin equation model [28], which is now being applied in many cases. Due to the large computation requirement of the particle trajectory model, Smith and Baxter [29] and Chen and Pereira [30] proposed the methods of most probable trajectories plus empirical PDF, in order to not use too many tra-jectories for obtaining the information of particle Eul-erian flow field. Starting from the 1990s, more atten-tion was paid to dispersed particle trajectory models for dense gas-particle flows, such as in pneumatic con-veying, dense-phase gas-solid cyclones, hydrocyc-lones, fluidized beds, etc. Tsuji et al. [31] at first con-ducted these studies, called DEM (discrete element method), using hard-sphere and soft-sphere models to simulate inter-particle collision. By using the soft-sphere model it is possible to predict the particle clusters and core-annulus flows, experimentally observed in circu-lating fluidized beds. These kinds of simulations in-clude discrete particle simulation (DPS) of dual-body collision and discrete-particle simulation Monte-Carlo (DSMC) of multiple-body random collisions. In recent years, Yu and co-workers [32-34] made tremendous strides in developing and using DEM models to suc-cessfully simulate complex gas-particle flows in prac-tical engineering equipments, as in pneumatic con-veying, gas-solid cyclones, circulating fluidized beds and iron-making blast furnaces. Nevertheless, the dis-crete particle simulation is a direct simulation of parti-cle motion, and computationally very expensive for predicting large-size engineering facilities.The existing problem for application of DEM models in engineering is that the simulation results have not yet been extensively validated by detailed measurement results.On the other hand, the Eulerian-Eulerian or two- fluid modeling has obtained remarkable development in recent years, in particular for predicting dense gas- particle flows, since its computation requirement is much less than that for discrete particle simulation. The key problem in two-fluid modeling is to develop the closure models for dispersed-phase (particles, droplets,Chin. J. Chem. Eng., Vol. 18, No. 6, December 2010893bubbles) turbulence and inter-particle collisions. As already mentioned above, different gas-particle two- phase turbulence models were developed, including k-ε-Ap model, based on Hinze-Tchen’s algebraic model (Ap model), k-ε-k p and USM models by Zhou et al., which obtained wide application and were de-veloped into a bubble-liquid-particle three-phase tur-bulence model at the beginning of this century [35]. On the other hand, many authors [36-41] developed two-fluid models based on PDF transport equations, including finite-difference and Monte-Carlo methods for solving PDF equations. For simulating inter-particle collisions in dense gas-particle flows, Gidaspow et al. proposed a kinetic theory [42], using particle pseudo- temperature equation to simulate particle collision energy, particle collisional pressure and viscosity. This model gives good results for bubbling fluidized beds. However, in cases of circulating fluidized beds, riser and downer flows, both particle turbulence and in-ter-particle collisions play important role in particle mixing. Zhou et al. [43] simulated dense gas-particle flows by using LES for gas flows and the kinetic the-ory for particle flows. It should be noted that the grid size is too large that the simulation looks like an un-steady RANS modeling using a very coarse turbulence model. Xiao et al. [44] improved the two-fluid model with the kinetic theory by introducing a three-region (dilute, dense and intermediate regions) drag-force law based on the minimum energy principle. Cheng et al. [45, 46] combined the k-ε-k p model with the kinetic theory model to propose a k-ε-k p-Θ model and a k-ε-k p-εp-Θ model, and found that these models are better than the k-ε-Θ model not accounting for the particle turbulence and the k-ε-k p model not account-ing for the inter-particle collision. Recently, Yu et al.[22] proposed a USM-Θ model and Zeng and Zhou [47] proposed a two-scale SOM (second-order moment) particle turbulence model. These models are better than the k-ε-k p-Θ and a k-ε-k p-εp-Θ models. The superiority of the USM-Θ model over other models is shown in Fig. 2Figure 2 Particle volume fraction●experiment; USM-Θ; k-ε-k p-Θ;○DSM (differ-ential Reynolds stress model)-Θ; × USMIn general, the E-E two-fluid models have the potential to well solve the engineering problems, but the closure models remain to be further studied. One of the important research needs is using DNS/LES plus dispersed particle models and measurement results to extensively validate the particle turbulence models or two-phase turbulence models in E-E modeling.3.2 Direct numerical simulation (DNS) and large- eddy simulation (LES)The direct numerical simulation (DNS) and large-eddy simulation (LES) of dispersed multiphase flows have been developed for more than 20 years. The point-particle DNS is directly to solve the N-S equation and point-particle motion equation on fine grids of Kolmogorov scales. It needs not any closure models but requires high-accuracy numerical methods, such as spectral methods and compact difference schemes, and also periodic boundary conditions. DNS of channel, mixing layer and jet gas-particle flows exhibit the instantaneous structures of turbulence, i.e., its production and development processes, the details of particle motion in turbulence eddies and particle dispersion, and also the effect of particles on gas tur-bulence. LES is using a white-noise filtration to di-rectly solve the instantaneous N-S equation and point-particle motion in resolved large scales, whereas for the unresolved small scales using a SGS (sub-grid scale) stress model. The frequently used SGS models are the Smagorinsky eddy-viscosity mode, Smagorin-sky-Lilly model, Germano dynamic eddy-viscosity model and SGS energy equation model.In recent DNS studies of dispersed multiphase flows the special attention is paid to FDNS (Fully re-solved DNS) or TDNS (True DNS). This is using the Lattice-Boltzmann or finite-difference methods to solve 3-D instantaneous N-S equation with finite-size particles and using VOF, front-tracking, level-set or immerse-boundary methods to treat the moving inter-face. It can give the particle wake structure and the effect of particle wake on gas turbulence, and the par-ticle drag, lift and added-mass forces. Bagchi and Balachandar simulated steady and unsteady turbulent flows passing a stagnant and a moving particle with Re P=10-300 using FDNS [48]. The results give the instantaneous vorticity isolines. The DNS database is used to obtain the drag, lift and other forces. DNS of flow passing a single particle with sizes of double Kolmogorov scales was reported in [49]. The gas vor-ticity isolines for cases with and without the particle were obtained. The result is that the turbulence is en-hanced near the particle, but generally is reduced. The velocity vectors of flows around two interacting cyl-inders are given by DNS in [50]. The instantaneous bubble position and fluid velocity isolines for fluid flows around several bubbles made by DNS [51] are shown in Figs. 3 and 4 respectively. From these results the bubble rising velocity, bubble drag and fluid sub-grid scale stress are obtained. The vorticity tubes be-hind 78 particles in isotropic homogeneous turbulent flows made by DNS [52] show an enhancement of fluid turbulence by particles.Chin. J. Chem. Eng., Vol. 18, No. 6, December 2010894Figure 3Instantaneous bubble positionsFigure 4 Instantaneous fluid velocity isolinesThe fluid flows around 45 bubbles of different sizes are reported in [53]. The instantaneous velocity vectors (Fig. 5) and bubble fluctuation velocities (Fig. 6) are obtained. It is seen that the fluctuation velocities (in terms of particle Reynolds number) of larger parti-cles are stronger than those of smaller particles.Figure 5Instantaneous velocity vectorsFigure 6 Fluctuation velocities of particlesThe point-particle DNS was studied from about 1994 [54]. The instantaneous gas velocity vectors and particle position in isotropic homogeneous turbulent flows given by point-particle DNS made in [55] are shown in Fig. 7, indicating that particles are located in the periphery of vortex structures.(a)(b)Figure 7 Instantaneous velocity vectors and particle positionThe point-particle DNS of a gas-particle jet [56] gives the instantaneous particle position for particles of (a) St =0.01, (b) St =1, and (c) St =50, as shown in Fig. 8. These results show the dispersion of particles of different sizes under the effect of gas turbulence, similar to the results obtained by other investigators using large-eddy simulation and discrete vortex simu-lation. However, the modeling results for particles have not been validated by experiments and the results show only the reduction of gas turbulence even for large particles with St =50, indicating the limitation of point-particle DNS.All LES of gas-particle and bubble-liquid flows are based on the point-particle approach. These studies are focused on particle dispersion under the effect of gas turbulence and the effect of particles on gas tur-bulence. Also, the LES statistical results are used to validate the two-phase turbulence models. The two-way coupled Eulerian-Lagrangian large-eddy simulation of bubble-liquid jets were made in [57] using a Sma-gorinsky-Lilly SGS stress model and the bubble tra-jectory model accounting for the drag force, buoyancy force and added-mass force. The results show the in-duced liquid turbulence by bubbles.The large-eddy simulation of backward-facing step gas-particle flows is made in [58], using the Smagorinsky。
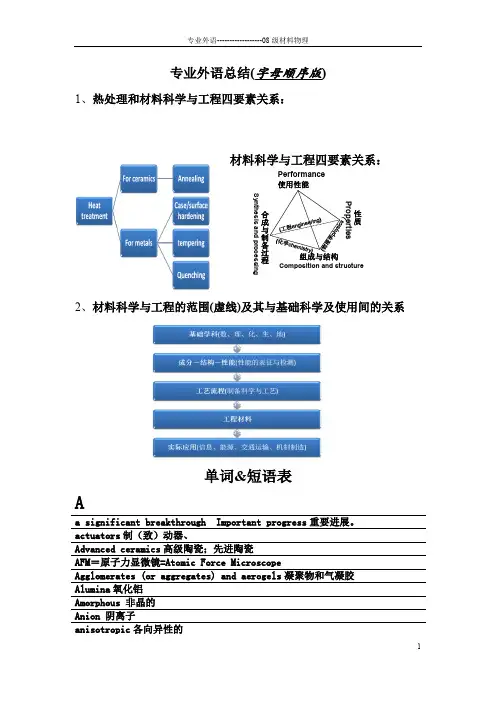
专业外语总结(字母顺序版)1、热处理和材料科学与工程四要素关系:材料科学与工程四要素关系:Performance 使用性能组成与结构合成与制备过程Synthesis and processingComposition and structure性质Properties2、材料科学与工程的范围(虚线)及其与基础科学及使用间的关系单词&短语表Aa significant breakthrough Important progress 重要进展。
actuators 制(致)动器、Advanced ceramics 高级陶瓷;先进陶瓷 AFM =原子力显微镜=Atomic Force MicroscopeAgglomerates (or aggregates) and aerogels 凝聚物和气凝胶 Alumina 氧化铝Amorphous 非晶的 Anion 阴离子anisotropic 各向异性的anode阳极axial projection轴投影BBCC=body-centered cubic体心立方Bioceramics生物陶瓷biodegradable adj. 生物所能分解的Biodegradable systems生物可降解系统biodegradable可生物降解的bio-inspired medical prostheses仿生医学人工器官。
biological tagging生物标记biomedical applications生物医学应用。
biomimetic adj. 仿生的biomolecular single-electron devices生物分子的单电子器件Biotechnology生物技术bivalent/divalent二价的。
bulk acoustic waves BAWs体声波Bulk material 体材料CCapacitor电容器carbon Nanotube碳纳米管Catalyst催化剂Cathode 阴极Cation 阳离子Cement水泥; 接合剂ceramic based composites陶瓷基复合材料Ceramic coating 陶瓷涂层Chemical Composition化学成分Chemical reagent化学试剂civil engineering土木工程Cold isostatic pressing(CIPing) 冷等静压compacting equipment压实设备。
第 62 卷第 6 期2023 年11 月Vol.62 No.6Nov.2023中山大学学报(自然科学版)(中英文)ACTA SCIENTIARUM NATURALIUM UNIVERSITATIS SUNYATSENI颗粒摩擦对散粒堆积体拱效应的影响*戴北冰1,2,邓林杰1,陈智刚31. 中山大学土木工程学院,广东珠海 5190822. 南方海洋科学与工程广东省实验室(珠海),广东珠海 5190823. 重庆建工第一市政工程有限责任公司,重庆 400020摘要:通过开展三维离散元数值模拟,研究了颗粒摩擦系数对散粒堆积体自然休止角、堆积体底部应力分布、堆积体内部接触力投影分布、强弱力链数量等宏细观特征的影响规律。
研究表明:随颗粒摩擦系数的增大,自然休止角增大并逐步趋于一个饱和值,堆积体底部应力峰值位置则从堆积体底部中心逐渐往外迁移,堆积体底部中心接触力相对于底部峰值的减小程度逐步增加,应力凹陷现象与拱效应越明显;随着颗粒间摩擦系数增大,颗粒间接触力沿锥面方向投影的最大值方位(锥)角逐渐增大并趋于稳定,堆积体内部拱效应的优势发挥方位出现在偏离竖直轴15°~25°的方位。
关键词:颗粒堆积体;离散单元法;摩擦系数;休止角;拱效应中图分类号:TU43 文献标志码:A 文章编号:2097 - 0137(2023)06 - 0089 - 09The influence of inter-particle friction on the arching effect in granular heapsDAI Beibing1,2, DENG Linjie1, CHEN Zhigang31. School of Civil Engineering, Sun Yat-sen University, Zhuhai 519082, China2. Southern Marine Science and Engineering Guangdong Laboratory(Zhuhai), Zhuhai 519082, China3. Chongqing Construction Engineering First Municipal Engineering Company Limited,Chongqing400020, ChinaAbstract:In this study, 3D DEM simulations have been conducted to investigate the effect of inter-particle friction on the macro and micro properties of granular heaps such as the angle of repose, stress distribution at the bottom, distribution of projected contact force, and number of strong and weak force chains, etc. The results indicate that increasing the inter-particle friction coefficient leads to an increase in the angle of repose, which eventually reaches a stable value. Additionally, the peak stress at the bot‐tom migrates from the center outward, and the degree of reduction in contact force at the bottom center relative to the peak value increases. This results in a more pronounced stress dip and arching effect. The orientation angle of the conical surface, along which the maximum projection of contact forces occurs, increases with the increasing inter-particle friction coefficient and eventually stabilizes. The preferential direction for the mobilization of arching effect is oriented at 15°~25° relative to the vertical direction. Key words:granular heaps; discrete element method; friction coefficient; angle of repose; arching effect散粒材料在自然界和人类生产生活中普遍存在(Terzaghi,1936;Karl,1943)。
表面技术第52卷第5期具有仿生内表面结构的弯管抗冲蚀特性数值分析郭姿含1,2,张军1,2,黄金满3,李晖1,2(1.集美大学 海洋装备与机械工程学院,福建 厦门 361021;2.福建省能源清洁利用与开发重点实验室,福建 厦门361021;3.厦门安麦信自动化科技有限公司,福建 厦门 361021)摘要:目的管道冲蚀是气固两相流动中不可忽视的重要问题,直接影响管路系统的安全运行及管道的使用寿命。
针对这一问题,从仿生学角度,参照沙漠红柳、沙漠蝎子等的体表形态,设计三角形槽、矩形槽、等腰梯形槽3种抗冲蚀特性的弯管仿生表面结构。
方法运用CFD–DPM方法,采用Finnie冲蚀模型,考虑颗粒与流体的双向耦合作用,对所设计的具有仿生表面结构的弯管抗冲蚀特性进行模拟,并考虑不同流速、颗粒质量流量对冲蚀的影响。
在数值模拟基础上,采用正交试验法分析三角形槽仿生结构的3个主要参数对抗冲蚀特性的影响。
结果数值模拟结果表明,具有仿生表面结构的弯管冲蚀主要出现在弯头35°~60°区域槽的底部。
3种槽表面仿生结构均可提高弯管的耐磨性,三角形槽的抗冲蚀特性最佳,提高了约38.33%,矩形槽次之,提高了约28%,等腰梯形槽最差,仅提高了约8.33%,且3种仿生表面结构的抗冲蚀性能优劣次序不随流速和颗粒质量流量的变化而变化;正交试验结果表明,在三角形槽中影响冲蚀的因素依次为槽间距、槽宽、槽深,最佳组合结构的抗冲蚀性能相较于普通弯管提升了约41.5%。
结论槽形仿生表面结构减小了颗粒与壁面的碰撞,降低了碰撞速度,从而减小了冲蚀。
抗冲蚀性能最优的表面仿生结构为三角形槽,矩形槽次之,等腰梯形槽最差。
在三角形槽中影响冲蚀的因素依次为槽间距、槽宽、槽深。
该研究可对弯管的抗冲蚀特性设计提供新的思路。
关键词:弯管;CFD–DPM;冲蚀;气固两相流;仿生表面;数值模拟;三角形槽中图分类号:TH117 文献标识码:A 文章编号:1001-3660(2023)05-0090-11DOI:10.16490/ki.issn.1001-3660.2023.05.009Numerical Analysis of Erosion Resistance of Elbow withBionic Inner Surface StructureGUO Zi-han1,2, ZHANG Jun1,2, HUANG Jin-man3, LI Hui1,2(1. School of Marine Equipment and Mechanical Engineering, Jimei University, Fujian Xiamen 361021, China;2. Fujian Provincial Key Laboratory of Energy Cleaning Utilization and Development, Fujian Xiamen 361021, China;3. Xiamen Anmaixin Automation Technology Co., Ltd., Fujian Xiamen 361021, China)ABSTRACT: Pipeline erosion is an important problem that cannot be ignored in gas-solid two-phase flow. Erosion damages not收稿日期:2022–04–16;修订日期:2022–08–16Received:2022-04-16;Revised:2022-08-16基金项目:福建省自然科学基金(2022J01334,2020J01694)Fund:Natural Science Foundation of Fujian Province (2022J01334, 2020J01694)作者简介:郭姿含(1997—),女,硕士生,主要研究方向为多相流数值模拟。

有关量子力学的英语作文Quantum Mechanics: The Mysterious World of Particles。
Quantum mechanics is a branch of physics that studies the behavior of particles on a microscopic level. It is a theory that explains the nature of matter and energy at the smallest scale, where classical physics fails to provide an accurate description. The principles of quantum mechanics have revolutionized our understanding of the universe, and have led to the development of many technological advancements.One of the most fundamental principles of quantum mechanics is the wave-particle duality. This principlestates that particles can exhibit both wave-like andparticle-like behavior, depending on the experimental setup. For example, electrons can behave like particles when they are detected by a screen, but like waves when they pass through a double-slit experiment. This duality is not intuitive, and it challenges our classical understanding ofphysics.Another important principle of quantum mechanics is superposition. This principle states that particles can exist in multiple states at the same time until they are observed or measured. For example, an electron can exist in multiple energy states simultaneously until it is measured, and then it collapses into a single state. This concept is central to the idea of quantum computing, which promises to revolutionize computing technology by exploiting the power of superposition and entanglement.Entanglement is another fascinating concept of quantum mechanics. It refers to the phenomenon where two particles can become correlated in such a way that their states are dependent on each other, even when they are separated by vast distances. This concept has been demonstrated in experiments, and it has led to the development of quantum teleportation, which allows the transfer of quantum information between two entangled particles.The principles of quantum mechanics have led to manytechnological advancements, such as transistors, lasers, and MRI machines. Quantum mechanics has also led to the development of new materials, such as superconductors, which have zero resistance to electrical current. Furthermore, quantum mechanics has the potential to revolutionize cryptography, by enabling the creation of unbreakable codes using the principles of entanglement.In conclusion, quantum mechanics is a fascinating and mysterious world that challenges our classical understanding of physics. Its principles have revolutionized our understanding of the universe, and have led to the development of many technological advancements. As we continue to explore the world of quantum mechanics, we are sure to discover new and exciting phenomena that will change our understanding of the universe.。
Numerical Study of the Effect of Foundation Sizefor a Wide Range of SandsNobutaka Yamamoto1;Mark F.Randolph2;and Itai Einav3Abstract:This paper presents a numerical investigation of the effect of foundation size on the response of shallow circular foundations on siliceous and calcareous sands.The study is based on the predictive capabilities of the MIT-S1soil model for simulating both the compression and shear behaviors of natural sands over a wide range of densities,K0values and confining pressures.The paper highlights the variations in the deformation mechanisms for the siliceous and calcareous sands cases.The assessment of the bearing capacity factor, N␥,is examined,showing a dramatic decrease in the values with increasing foundation size for the case of footings on calcareous sands, eventually converging to a terminal N␥value.At this stage the sand resistance is insensitive to variations in initial density and foundation size because the sand tends to loose its initial characteristics due to grain crushing,leading the material rapidly toward ultimate conditions. In the silicious sand case,it is found that,eventually,for extremely large footing diameters,the deformation mechanism progresses toward a punching shear mechanism,rather than the classical rapture pattern accompanied by surface heave as employed in current bearing capacity equations.A dimensional transition between the failure mechanisms can clearly be defined,referred to as a“critical size”in the N␥–D relationship.DOI:10.1061/͑ASCE͒1090-0241͑2009͒135:1͑37͒CE Database subject headings:Sand;Calcareous soils;Silica;Shallow foundations;Size effect;Finite element method;Numerical analysis.IntroductionThe bearing capacity of foundations on granular materials has been studied extensively as one of the fundamental problems of geotechnical engineering.The most common method to estimate the bearing capacity is the classical Terzaghi equation that in-cludes three factors:the N c factor for cohesion,the N q for embed-ment depth,and the N␥for the self-weight component.These different factors are modified for the particular loading condition and material case in hand.The N␥factor is of primary importance for shallow foundations on sands but it is extremely sensitive to variations in the material properties.Early experimental studies of this factor in sand were mainly concerned with relatively small model foundations,tested in natural1g conditions.It was real-ized that N␥decreases with increasing footing width or diameter, and this is now widely recognized as the“foundation size effect”͑De Beer1963͒.De Beer reasoned that the foundation size ef-fect results from the fact that the strength criterion of sands should be nonlinear,with the friction angle decreasing with in-creasing stress level,rather than linear as in the conventional linear Mohr–Coulomb criterion.The nonlinear failure envelope arises from the stress dependency of dilation,which by itself arises from particle rearrangement and crushing͑Lee and Seed 1967;Bolton1986͒.There are several numerical approaches for assessing the in-fluence of N␥using nonassociated constitutive models͑i.e.,mod-els that incorporate a dilation angle that is not equal to the friction angle͒.Frydman and Burd͑1997͒and Erickson and Drescher ͑2002͒studied the effect of the dilation angle on N␥for strip and circular footings,respectively,using a nonassociated Mohr–Coulomb model.They found that the effect of dilation angle is negligible at low friction angles,but quite important for friction angles greater than35°,especially for the case of rough circular footings.However,these previous numerical studies are limited by the fact that the Mohr–Coulomb model cannot capture suffi-ciently well the stress and density state dependency of sand be-havior or the compressibility of sands.The intention of the work reported here was to perform a more comprehensive numerical study that accounts for many more be-havioral aspects of sand.For that purpose the MIT-S1constitutive model͑Pestana and Whittle1999͒was adopted as that model has sufficient complexity to simulate both compression and shear be-haviors of natural sands over a wide range of densities,K0values, and confining pressures using a single set of model parameters of a given sand type.In summary,this paper presents a numerical investigation of the foundation size effect in the case of shallow circular footings on siliceous and calcareous sands using the MIT-S1model.Fol-lowing a brief description on the MIT-S1model,the strength characteristics of siliceous and calcareous sands are discussed in the context of drained triaxial shear test results.The effects are1Engineer,Advanced Geomechanics,4Leura St.,Nedlands,WA, 6009,Australia;formerly,Ph.D.Student,Centre of Offshore Foundation Systems,Univ.of Western Australia,Crawley,WA6009,Australia. E-mail:nobutakay@.au2Professor,Centre for Offshore Foundation Systems,Univ.of Western Australia,35Stirling Highway,Crawley,WA6009,Australia.E-mail: randolph@.au3Senior Lecturer,School of Civil Engineering J05,Univ.of Sydney, Sydney,NSW2006,Australia.E-mail:I.Einav@.au Note.Discussion open until June1,2009.Separate discussions must be submitted for individual papers.The manuscript for this paper was submitted for review and possible publication on March15,2007;ap-proved on April30,2008.This paper is part of the Journal of Geotech-nical and Geoenvironmental Engineering,V ol.135,No.1,January1, 2009.©ASCE,ISSN1090-0241/2009/1-37–45/$25.00.then translated to explain the foundation problem for both typesof sand,followed by a discussion of the foundation size effect interms of the N␥factor.Modeling Sands Using the MIT-S1ModelFull details of the MIT-S1model can be found in Pestana andWhittle͑1999͒.According to Pestana et al.͑2002͒,the model iscapable of simulating many behavioral characteristics of sandbehavior,including nonlinearity of the compression curves andcritical state lines on e–ln pЈplots,the dilatancy behavior of sands,and the variation of peak friction angle as a functionof stress level and density.The model can capture a range ofdifferent characteristics of both compressible and incompressiblegranular materials through appropriate adjustment of the modelparameters.The MIT-S1model requires13input parameters to model thebehavior of freshly deposited sand͑which is the type of sand thispaper is concerned with͒.According to Pestana and Whittle ͑1999,2002͒these parameters can be determined from standard laboratory tests.This paper focuses on two different types of sands,Toyourasiliceous sand͑from Japan͒,and Goodwyn calcareous sand͑fromthe North West Shelf of Australia͒.The model parametersfor these sands were determined in Pestana et al.͑2002͒andYamamoto et al.͑2008͒.The model parameters for Dogs Bay calcareous sand and Goodwyn calcareous silt are also provided to enable a complete discussion on the foundation size effect.The physical properties of the sands and the silt are summarized in Table1,and the model input parameters are given in Table2.The particle size distributions for Toyoura siliceous sand͑Ishihara 1993͒,Dogs Bay calcareous sand͑Coop1990͒,Goodwyn calcar-eous sand͑Ismail2000͒,and Goodwyn calcareous silt͑Finnie 1993͒are shown in Fig.1.As may be seen,the Dogs Bay calcar-eous sand has larger particles than the Toyoura siliceous sand. Further,it is noted that the Goodwyn sand is relatively well graded with30%fines content.Compression BehaviorFig.2shows the MIT-S1predictions of the compression curves of both siliceous and calcareous sands.The initial densities and cur-vature of the compression curves vary significantly,but the model captures these variations well.Calcareous sands have higher ini-tial void ratios and greater reduction of volume than siliceous sands.The critical state lines of the sands are also significantly different,but again the model predicts them nicely.Shear BehaviorFig.3shows the MIT-S1predictions for drained isotropically consolidated shear tests on siliceous and calcareous sands with different initial densities but the same confining stress͑100kPa͒.Table1.Index Properties of SoilsPropertySiliceous CalcareousToyoura sand Goodwyn sand Dogs Bay sand a Goodwyn siltMineralogy Quartz,feldspar,magnetite Calcium carbonate͑94%͒Calcium carbonate͑98%͒Calcium carbonate͑94%͒Grain shape Subangular Skeletal grain Skeletal grain Skeletal grain Specific gravity,G s 2.65 2.72 2.75 2.77Mean particle size,D50͑mm͒0.16–0.200.1–0.20.20.03Coefficient of uniformity,C u 1.3–1.710–15 2.0645Maximum void ratio,e max0.98 2.32–1.97 2.21–1.83 2.40 Minimum void ratio,e min0.61–0.58 1.41–0.94 1.48–0.98 1.21a Properties of Dogs Bay sand were reassessed and different from the value provided by Pestana͑1994͒.Table2.MIT-S1Model Parameters for Various SoilsTest type Symbol Physical meaningSiliceous Calcareous b Toyoura sand a GW sand b DB sand b GW silt bCompression testc Compressibility at large stresses͑LCC regime͒0.3700.3500.3500.250 p refЈReference stress at unity void ratio for the H-LCC͑kPa͒5,5002,5004,0002,000First loading curve transition parameter0.2000.9000.4000.900 K0consolidation test K0NC K0in the LCC regime0.4900.4900.5100.4500ЈPoisson’s ratio0.2330.1500.2000.200Parameter for nonlinear Poisson’s ratio 1.00 2.00 1.00 2.00 Shear testcs Critical state friction angle͑°͒31.039.646.040.0mrЈPeak friction angle as a function of void ratio͑°͒28.560.080.072.0np Constant of peak friction angle 2.45 2.00 2.00 2.00m Geometry of bounding surface0.550.350.550.30Rate of evolution of anisotropy50.050.050.050.0Shear test with local measurement systems C b Small strain stiffness parameter750450750450s Small strain nonlinearity parameter 2.50 3.00 2.50 3.0a Pestana͑1994͒.b GW=Goodwyn;DB=Dogs Bay.In siliceous sand,denser samples exhibit a clear peak stress at relatively small strain levels,whereas no peak stress is found for looser samples.On the other hand,all calcareous samples show contractive behavior,although the experimental response from Finnie ͑1993͒for relative dense Goodwyn sand shows a slight peak at small strain levels.Sensitivity Study of the MIT-S1ParametersAs mentioned earlier,the MIT-S1model requires 13model pa-rameters to define the behavior of sand.Although the parameters should be specified precisely,the particular shallow footing prob-lem in this paper tends to be dominated by only a few parameters.Yamamoto ͑2006͒carefully investigated the effect of the different model parameters on the response of shallow circular footings on siliceous and calcareous sands.A summary of these sensitivityanalyses is given in Table 3.The compression parameters,p ref Јand ,and the shear parameter,m ,are the most significant,whereas the remaining parameters have less effect.It is found that the shear parameters ͑apart from m ͒have little effect on the results for calcareous sand,implying that the bearing response on calcar-eous sand is dominated more by the compression component than by shear.Hence,for the shallow footing problem the relatively large number of 13parameters was reduced to a more manageable study involving three significant parameters.Effects of Stress Level,Density,andCompressibility on the Strength Characteristics of SandsThe effects of stress level,density,and compressibility are of great importance for assessing the behavior of sands.The effects can be captured through a relationship between the peak friction angle,p Ј,the initial mean effective stress at failure,p 0Ј,and void ratio,e .Fig.4illustrates the relationship between p Ј,p 0Јand e for theP e r c e n t a g e f i n e rFig.1.Particle size distributions forsandsV o i d R a t i o ,eMean Effective Stress,p'(kPa)Fig.2.Consolidation curves and critical state lines for siliceous andcalcareous sands510152025300100200300400500Linee 00.950.900.800.700.60CID testsToyoura siliceous sand p'0=100kPaD e v i a t o r i c s t r e s s ,q (k P a )Shear strain,H s (%)(a)0100200300400500D e v i a t o r i c s t r e s s ,q (k P a )Shear strain,H s (%)(b)Fig. 3.Triaxial drained shear tests results for siliceous and calcareous sands:͑a ͒siliceous sand;͑b ͒calcareous sandToyoura siliceous and Goodwyn calcareous sands.The peak fric-tion angles at lower stress levels for Toyoura siliceous sand are initially only weakly dependent on the increase in pressure,but this dependency then strengthens to a rapid reduction with in-creasing confining pressure.At higher stress levels,the peak fric-tion angles eventually converge to the critical state values͑i.e.,pЈ=csЈ͒at“critical stresses,”as suggested by Vesic and Clough ͑1968͒.It is noticed that the critical stress decreases as the densitydecreases.The peak friction angles for calcareous sands also de-pend on the combined influence of e and p0Ј.However,they re-duce rapidly with increasing p0Ј,even at low stress level.The critical stresses for calcareous sands are significantly lower than for siliceous sands.Three triaxial compression test results using Goodwyn sand are plotted in Fig.4,one for e0=1.1͓from Finnie ͑1993͔͒and two others for e0=1.4͓from Sharma͑2004͔͒.The MIT-S1predictions underestimate the peak friction angles for these data,which is consistent with the slight peak in deviator stress observed in triaxial tests͑Fig.3͒.The variation of peak friction angle raises questions on the applicability of conventional bearing capacity theories,which are based on constant friction angle with depth͑normalized by foun-dation size͒.For example,an analysis of a10m diameter foun-dation with practical settlement limits of5–10%of foundation diameter͑or width͒may be based on initial stresses of40kPa ͑multiplying half of the diameter,5m,by a soil effective unit weight of8kN/m3͒.However,when the same settlement level is applied to a100m diameter foundation,the corresponding stress level is simply ten times͑400kPa͒that for the10m diameter footing.At that stress level,the peak friction angles are no longer constant with depth.The peak friction angles for calcareous sands are obviously not constant at40kPa,thus for this sand the con-ventional bearing capacity formulas do notfit even for a moderate foundation size.Responses of Shallow Foundations on SandsThe following describes numerical results for the response of10 and100m diameter footings on siliceous and calcareous sands. Initial void ratios at the ground surface,e0,and effective unit weights,␥Ј,are0.8͑dense͒and8kN/m3for the siliceous sand, and1.3͑medium dense͒and7kN/m3for the calcareous sand.To carry out the100m diameter analyses,the effective unit weight has been taken ten times higher,avoiding the need to modify the finite-element meshes.Thus the increase in the foundation size is simulated simply by increasing the initial stress gradient. Pressure–Displacement CurvesFig.5͑a͒shows N␥and␦/D relationships for100m diameter smooth and rough footings on siliceous sand,with the10m di-ameter results also plotted for comparison.The bearing response of the large scale rough footing shows no peak value but rather increases continuously with increasing penetration depth.This is because the compression component of the material dominates the bearing response as the foundation size increases.For the 100m diameter smooth footing case,however,an ultimate bear-ing capacity is still observed although it needs much larger verti-cal displacement than for the small footing.This appears to be because the deformation mechanism for siliceous sand progres-sively shifts toward punching shear with increasing size of foun-dation.It is worth noting that the effect of roughness for larger foundations is much smaller.The bearing responses on calcareous sand with different foun-dation sizes show similar trends but the100m diameter founda-tion shows a more linear response͓Fig.5͑b͔͒,and the mobilized N␥for the100m case is smaller.Deformation MechanismsAs described earlier,a transformation in the mechanisms from small to large foundations may be seen,in particular for rough footings on siliceous sand.Fig.6͑a͒shows that at a penetration of 10%of the diameter the amount of surface heave reduces signifi-cantly with increasing diameter.However,for the smooth footing analysis͓Fig.6͑b͔͒,a classical rupture failure pattern with surface heave is still evident for the100m diameter calculations although more obvious downward deformations are exhibited at shallower penetration.The incremental displacement vectors for10and100m diam-eter footings on calcareous sand show almost identical defor-Initial mean effective stress,p'(kPa)Fig.4.Peak friction angle and initial state relationships for siliceous and calcareous sandsmation patterns at all penetration levels ͓Fig.6͑c ͔͒.The soil be-neath the footings compress almost in a one-dimensional vertical manner.Effect of Foundation Size on Bearing Capacity Factor,N ␥The following explores the effect of foundation size on the mo-bilized bearing resistance factor,N ␥.This effect of foundation size has been explained previously as due to the stress dependency of granular materials ͑De Beer 1963;Hettler and Gudehus 1988;Kusakabe et al.1991͒,or more precisely on the stress dependency of the peak friction angles.The numerical investigation using the MIT-S1model provides further explanations of this effect andalso allows a possible deduction of the dimensional transition between dilative and contractive responses of the soil.Siliceous SandFig.7summarizes the bearing response from analyses with dif-ferent footing sizes of fully smooth shallow circular footings on siliceous sand,by plotting the N ␥–␦/D relationships for e 0=0.8͑loose ͒,and N ␥-␦/D for e 0=0.65͑dense ͒,where ␦denotes the footing downward displacement.The effect of the foundation size has been recognized experimentally with the mobilized N ␥de-creasing with increasing diameter ͑e.g.,De Beer 1963͒,but with experimental evidence only over a relatively small diameter range.The numerical predictions using the MIT-S1model suggest that the foundation size effect exists for larger foundations as well.Moreover,as expected,a transition from dilative to contractive deformations can be seen as the foundation size increases.The smaller footings tend to show dilative behavior with clear peak stress,whereas the larger foundations present contractive re-sponse and exhibit lower mobilized N ␥values.This is also re-flected from the results of drained triaxial tests with different initial void ratios as shown in Fig.3.Fig.8shows N ␥–D rela-tionships for loose and dense siliceous sands.Two N ␥values are shown,one corresponding to the peak bearing resistance ͑if one exists ͒and the other corresponding to ␦/D =10%͑shown only if N ␥keeps increasing for ␦/D greater than 10%͒.The two020406080100M o b i l i z e d B e a r i n g R e s i s t a n c e ,N J =2q b /J 'DDisplacement/Diameter,G /D (%)(a)020406080100M o b i l i z e d B e a r i n g R e s i s t a n c e ,N J =2q b /J 'DDisplacement/Diameter,G /D (%)(b)Fig.5.Shallow foundation responses for siliceous and calcareous sands:͑a ͒siliceous sand;͑b ͒calcareous sandFig.6.Incremental displacement vectors after a penetration of 10%of the diameter:͑a ͒siliceous sand,rough,D =10m ͑left ͒,100m ͑right ͒;͑b ͒siliceous sand,smooth,D =10m ͑left ͒,100m ͑right ͒;and ͑c ͒calcareous sand,smooth,D =10m ͑left ͒,100m ͑right ͒N ␥values merge at about 20m diameter for loose ͑e 0=0.8͒samples and 60m diameter for dense ͑e 0=0.65͒samples ͑indi-cated by arrows ͒and this will be defined as the transition diam-eter point from dilative to contractive response.This diameter may be referred to as a “critical size,”D cr ,which basically fol-lows the same concept behind the definition of the ‘critical stress’by Vesic and Clough ͑1968͒,as described before.Kimura et al.͑1985͒suggested that the N ␥value reduces with reduction in density.Fig.8shows the great variation with density over a wide range of foundation size.The factor diminishes rap-idly with increasing foundation diameter for small diameters,but the effect reduces at larger diameters ͑noting the logarithmic scale of the plot ͒.Fig.8also compares the numerical results with centrifuge model tests for circular footings ͑D =1.5–3m ͒on Toyoura sili-ceous sand performed by Okamura et al.͑1997͒.Unfortunately,the finite-element results could not be obtained for small diam-eters owing to numerical instability for the high dilation rates associated with shearing at low stress levels.However,both re-sults show the reduction of N ␥with increasing diameter.Calcareous SandFig.9shows bearing responses of fully smooth shallow circular footings on calcareous sand with K 0=1for two representative densities ͑e 0=1.3for dense or e 0=1.9for loose ͒,applied over a wide range of diameters ͑1–100m ͒.It is noticed that the effect of foundation size and density are very strong for smaller diameters.Fig.10plots N ␥–D relationships for calcareous sand.Additional analyses to those in Fig.9were undertaken with identical soil parameters apart from taking K 0=0.49,and those results are shown in Fig.10alongside those for K 0=1.The rate of decrease of N ␥with increasing foundation size becomes gradually lower for larger foundation sizes and for loose samples the N ␥values become nearly constant for diameters of more than 30m.Physi-cal model results from Finnie and Randolph ͑1994͒are also shown,and though these show some decrease in N ␥with increas-ing foundation size,the rate of decrease is not as dramatic as for the numerical results.It may also be seen that the numerical re-sults give higher N ␥values,for a given void ratio,than those reported by Finnie and Randolph,in spite of giving lower peak friction angles for triaxial tests ͑see Figs.3and 4earlier ͒.Again,this emphasizes the importance of the soil compressibility in the bearing response.In Fig.9,none of the analyses exhibits a clear ultimate state.The calculation for a 1m diameter foundation on dense calcare-ous sand was terminated at about 15.5%normalized displace-ment,at which stage the incremental displacement vectors were as shown in Fig.11.These indicate a significant component of surface heave adjacent to the footing,as in a classical rupture failure pattern.It may be concluded that the critical foundation size for the dense calcareous sand may be estimated as about 1m.020406080100M o b i l i z e d B e a r i n g R e s i s t a n c e ,N J =2q b /J 'DDisplacement /Diameter,G /D (%)(a)020406080100M o b i l i z e d B e a r i n g R e s i s t a n c e ,N J =2q b /J 'DDisplacement /Diameter,G /D (%)(b)Fig.7.Effect of foundation size for shallow circular footings on siliceous sand:͑a ͒dense;͑b ͒loose020406080100120140160180200M o b i l i z e d B e a r i n g R e s i s t a n c e ,N J =2q b /J 'DDiameter,D (m)Fig.8.N ␥and D relationships for siliceous sandN ␥–D Relationship for Various SandsThe investigation of the effect of foundation size has also been conducted with respect to two other types of calcareous soils,namely Dogs Bay calcareous sand and Goodwyn calcareous silt.The MIT-S1model parameters for the sand and silt are tabulated in Table 1.Effective unit weights were set to 7kN /m 3for the Dogs Bay sand and 6kN /m 3for the Goodwyn silt.The N ␥values from the analyses for Dogs Bay sand are shown in Fig.12.The computed factor is high for small diameters,even in comparison with those for siliceous sand shown in Fig.8.This appears related to the higher values of mr Јand np ͑i.e.,higher friction angles ͒and higher p ref Ј͑i.e.,higher stiffness ͒.The com-puted results are still much lower than the experimental results from Klotz and Coop ͑2001͒,although these are taken from the end-bearing resistance of jacked piles,extrapolated back to thesurface.The values reduce strongly with increasing diameter,but still lie above the computed values for the overlapping diameter range of 2–3m.Thus,although the general trends are similar for the experimental and numerical results,it is difficult to demon-strate complete consistency.The calcareous silt analyses are based on extremely low p ref Јand values and lead to very low N ␥values even for small foundation sizes ͑see Fig.13͒.The N ␥values for loose samples ͑e 0=2.7͒,in particular,are essentially independent of the founda-tion size.Physical model results ͑Finnie and Randolph 1994͒lie between the numerical predictions of loose and dense states.The experimental data also revealed that the N ␥values for calcareous silt are insensitive to the foundation size.The N ␥–D curves for all the above-presented materials are compared in Fig.13.For small diameters,Dogs Bay sand has the highest bearing capacity,whereas the Goodwyn silt gives the low-est,although it should be noted that results for Toyoura sand are050100150M o b i l i z e d B e a r i n g R e s i s t a n c e ,N J =2q b /J 'DDisplacement/Diameter,G /D (%)(a)050100150M o b i l i z e d B e a r i n g R e s i s t a n c e ,N J =2q b /J 'DDisplacement/Diameter,G /D (%)(b)Fig.9.Effect of foundation size for shallow circular footings on calcareous sand:͑a ͒dense;͑b ͒loose020406080100M o b i l i z e d B e a r i n g R e s i s t a n c e ,N J =2q b /J 'DDiameter,D (m)Fig.10.N ␥and D relationships for calcareous sandFig.11.Incremental displacement vectors for 1m diameter footing on dense calcareous sand ͑␦/D =15.5%͒not available at smaller diameters.The different trends of the calcareous materials are evident and result from changes in the compression parameters,p ref Јand ,which primarily control the bearing response for calcareous materials ͑see Table 3͒.It is also found that the N ␥values for different calcareous materials and densities reduce with increasing diameter and merge to a some-what uniform N ␥͑in the range 5–10͒,independent of the density,foundation size,and material type.On the other hand,the N ␥values for large foundations on siliceous sand are significantly larger than those for calcareous soils ͑Fig.14͒.LimitationsThe principal limitation of the analyses conducted is that the finite-element results for smaller diameter foundations on sili-ceous sand could not be obtained due to calculation instability.One possible reason is the highly dilative response of silica sand at low effective stress levels,in conjunction with extremely large deformations at the edge of footings during loading.Due to the rupture type of failure pattern,neighboring element immediately inside and outside the footing show downward and upward defor-mations,respectively,which led to termination of the solution due to the extremely high displacement gradient.The smaller the foundation size ͑so low effective stresses ͒,the more significant this issue became.By contrast,the failure mechanism for calcar-eous sands gave downward deformations just beyond the edge of the footings.0200400600800M o b i l i z e d B e a r i n g R e s i s t a n c e ,NJ =2q b /J 'DDiameter,D (m)Fig.12.N ␥and D relationships for Dogs Bay calcareous sand020406080100M ob i l i z e d B e a r i n g R e s i s t a nc e ,N J =2q b /J 'DDiameter,D (m)Fig.13.N ␥and D relationships for Goodwyn calcareous silt020406080100M o b i l i z e d B e a r i n g R e s i s t a n c e ,N J =2q b /J 'DDiameter,D (m)(a)020406080100M o b i l i z e d B e a r i n g R e s i s t a n c e ,N J =2q b /J 'DDiameter,D (m)(b)Fig.14.N ␥and D relationships for different types of soils:͑a ͒dense;͑b ͒loose。
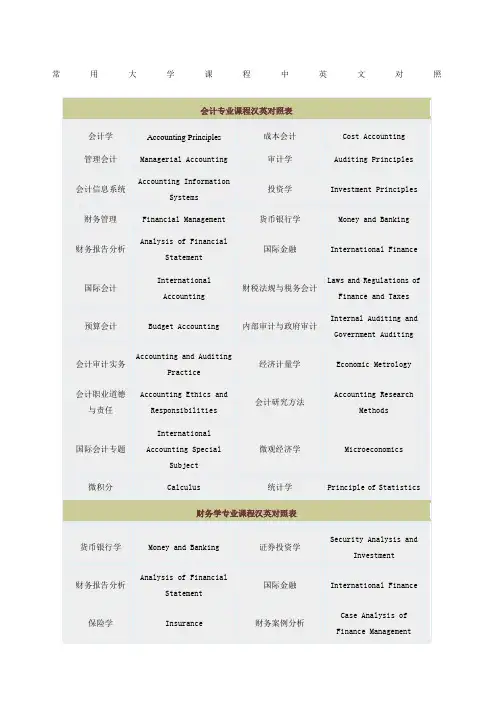
常用大学课程中英文对照大学课程中英文对照大汇集英文字母开头的课程ALGOL语言 ALGOL LanguageBASIC & FORTRAN 语言 BASIC Language & FORTRAN Language BASIC 语言 BASIC LanguageBASIC 语言及应用 BASIC Language & ApplicationC 语言 C LanguageC++程序设计 C++ Program DesigningCAD 概论 Introduction to CADCAD/CAM CAD/CAMCET-4 College English Test (Band 4)CET-6 College English Test (Band 6)COBOL语言 COBOL LanguageCOBOL语言程序设计 COBOL Language Program DesigningC与UNIX环境 C Language & Unix EnvironmentC语言科学计算方法 Scientific Computation Method in CC语言与生物医学信息处理 C Language & Biomedical Information ProcessingdBASE Ⅲ课程设计 Course Exercise in dBASE ⅢFORTRAN 77 语言 FORTRAN 77 LanguageFORTRAN语言 FORTRAN LanguageFoxBase程序设计 FoxBase ProgrammingHopf代数 Hopf AlgebraHopf代数与代数群量子群 Hopf Algebra , Algebraic Group and Qua ntum GroupIBM-PC/XT Fundamentals of Microcomputer IBM-PC/XTIBM-PC微机原理 Fundamentals of Microcomputer IBM-PCIBM汇编及高级语言的接口 IBM Assembly & its Interfaces with Advanced Programming Languages Internet与Intranet技术 Internet and Intranet TechnologyLSI设计基础 Basic of LSI DesigningOS/2操作系统 OS/2 Operation SystemPASCAL大型作业 PASCAL Wide Range WorkingPASCAL课程设计 Course Exercise in PASCALPASCAL语言 PASCAL LanguagePC机原理 Principle of PCUnix编程环境 Unix Programming EnvironmentUnix操作系统分析 Analysis of Unix SystemVLSI的EDA技术 EDA Techniques for VLSIVLSI技术与检测方法 VLSI Techniques & Its ExaminationVLSI设计基础 Basis of VLSI DesignWindows系统 Windows Operation SystemX光分析 X-ray AnalysisX射线金属学 X-Ray & MetallographyX射线与电镜 X-ray & Electric MicroscopeZ-80汇编语言程序设计 Z-80 Pragramming in Assembly LanguagesB开头的课程板壳非线性力学 Nonlinear Mechanics of Plate and Shell板壳理论 Plate Theory , Theory of Plate and Shell板壳力学 Plate Mechanics办公自动化 Office Automatization办公自动化系统毕业设计 Office Automatization Thesis办公自动化系统设计 Office Automatization Design半波实验 Semiwave Experiment半导体变流技术 Semiconductor Converting Technology半导体材料 Semiconductor Materials半导体测量 Measurement of Semiconductors半导体瓷敏元件 Semiconductor Porcelain-Sensitive Elements半导体光电子学 Semiconductor Optic Electronics半导体化学 Semiconductor Chemistry半导体激光器 Semiconductor Laser Unit半导体集成电路 Semiconductor Integrated Circuitry半导体理论 Semi-conductive Theory半导体器件 Semiconductor Devices半导体器件工艺原理 Technological Fundamentals of Semiconductor Device半导体器件课程设计 Course Design of Semiconductor Devices半导体物理 Semiconductor Physics半导体专业 Semi-conduction Specialty半导体专业实验 Specialty Experiment of Semiconductor半群理论 Semi-group Theory保健食品监督评价 Evaluation and Supervision on Health Food s保险学 Insurance保险学 Insurance报告文学专题 Special Subject On Reportage报刊编辑学 Newspaper & Magazine Editing报刊选读 Selected Readings of Newspaper & Magazine报纸编辑学 Newspaper Editing泵与风机 Pumps and Fans泵与水机 Pumps & Water Turbines毕业论文 Graduation Thesis毕业设计 Graduation Thesis毕业实习 Graduation Practice编译方法 Compilation Method编译方法 Methods of Compiling编译技术 Technique of Compiling编译原理 Fundamentals of Compiling, Principles of Compiler编译原理课程设计 Course Design of Compiling变电站的微机检测 Computer Testing in Transformer Substation变电站的微机检测与控制 Computer Testing & Control in Transformer Substation变分法与张量 Calculus of Variations & Tensor变分学 Calculus of Variations变流技术 Semiconductor Converting Technology变质量系统热力学与新型回转压 Variable Quality System Thermal Mechanics & NeoRo 表面活性剂化学及应用 Chemistry and Application of Surfactant表面活性物质 Surface Reactive Materials并行处理 Parallel Processing并行处理与并行程序设计 Parallel Processing and Parallel Programming并行算法 Parallel Algorithmic波谱学 Spectroscopy, Wave Spectrum波谱学实验 Spectroscopic Experiment薄膜光学 Film Optics薄膜物理 Thin Film Physics不育症的病因学 Etiology of InfertilityC开头的课程材料的力学性能测试 Measurement of Material Mechanical Performance材料化学 Material Chemistry材料力学 Mechanics of Materials财税法规与税务会计 Laws and Regulations of Finance and Taxes财务案例分析 Case Analysis of Finance Management财务案例分析 Case Analysis of Financial Management财务报告分析 Analysis of Financial Statement财务成本管理 Financial Cost Management财务管理 Financial Management, Financial Cost Management财务管理与分析 Financial Management and Analysis财务会计 Financial Accountancy财政学 Public Finance财政与金融 Finance & Banking财政与税收 Finance & Revenue财政与税收理论 Theories on Public Finance and Tax Revenue财政与信贷 Finance & Credit操作系统 Disk Operating System (DOS)操作系统课程设计 Course Design in Disk Operating System操作系统与编译原理 Disk Operating System & Fundamentals of Compiling操作系统原理 Fundamentals of Disk Operating System, Principles of Operating System 测量技术基础 Foundation of Measurement Technology测量原理与仪器设计 Measurement Fundamentals & Meter Design测试技术 Testing Technology测试与信号变换处理 Testing & Signal Transformation Processing策波测量技术 Technique of Whip Wave Measurement策略管理 Strategic Management产品学 Production产业经济学 Industrial Economy产业组织 Industrial Organization产业组织学 Industrial Organization Technology常微分方程 Ordinary Differential Equations场论 Field Theory超导磁体及应用 Superconductive Magnet & Application超导及应用 Superconductive & Application超高真空科学与技术 Science and Technology of Ultrahigh Vacuum 60超精密加工和微细加工 Super-Precision & Minuteness Processing超精微细加工 Super-Precision & Minuteness Processing超声及应用 Supersonics Application成本会计 Cost Accounting成像原理与技术 Principles & Technique of Imaging成组技术 Grouping Technique城市规划原理 Fundamentals of City Planning城市社会学 Urban Sociology程控数字交换 Program Controlling of Digital Exchange程序设计 Program Designing程序设计方法学 Methodology of Programming, Methods of Programming程序设计及算法语言 Program Designing & Algorithmic Language程序设计语言 Programming Language齿轮啮合原理 Principles of Gear Connection冲击测量及误差 Punching Measurement & Error冲压工艺 Sheet Metal Forming Technology抽象代数 Abstract Algebra初等数学 Primary Mathematics传坳概论 Introduction to Pass Col传动概论 Introduction to Transmission传感技术 Sensor Technique传感技术及应用 Sensor Technique & Application传感器及应用 Sensors & Application传感器与检测技术 Sensors & Testing Technology传感器原理 Fundamentals of Sensors传感器原理及应用 Fundamentals of Sensors & Application传热学 Heat Transfer船舶操纵 Ship Controlling船舶电力系统 Ship Electrical Power System船舶电力系统课程设计 Course Exercise in Ship Electrical Power System 船舶电气传动自动化 Ship Electrified Transmission Automation船舶电站 Ship Power Station船舶动力装置 Ship Power Equipment船舶概论 Introduction to Ships船舶焊接与材料 Welding & Materials on Ship船舶机械控制技术 Mechanic Control Technology for Ships船舶机械拖动 Ship Mechanic Towage船舶建筑美学 Artistic Designing of Ships船舶结构 Ship Structure船舶结构力学 Structural Mechanics for Ships船舶结构与制图 Ship Structure & Graphing船舶静力学 Ship Statics船舶强度与结构设计 Designing Ship Intensity & Structure船舶设计原理 Principles of Ship Designing船舶推进 Ship Propelling船舶摇摆 Ship Swaying船舶摇摆与操纵 Ship Swaying & Manipulating船舶振动 Ship Vibration船舶阻力 Ship Resistance船体建造工艺 Ship-Building Technology船体结构 Ship Structure船体结构图 Ship Structure Graphing船体结构与制图 Ship Structure & Graphing船体振动学 Ship Vibration船体制图 Ship Graphing船用电器设备 Marine Electrical Equipment创造心理学 Creativity Psychology词汇学 Lexicology磁测量技术 Magnetic Measurement Technology磁传感器 Magnetic Sensor磁存储设备设计原理 Fundamental Design of Magnetic Memory Equipment磁记录 Magnetographic磁记录技术 Magnetographic Technology磁记录物理 Magnetographic Physics磁路设计与场计算 Magnetic Path Designing & Magnetic Field Calculati磁盘控制器 Magnetic Disk Controler磁性材料 Magnetic Materials磁性测量 Magnetic Measurement磁性物理 Magnetophysics磁原理及应用 Principles of Catalyzation & Application催化原理 Principles of CatalysisD开头的课程大电流测量 Super-Current Measurement大电源测量 Super-Power Measurement大机组协调控制 Coordination & Control of Generator Networks大跨度房屋结构 Large-Span House structure大型锅炉概况 Introduction to Large-Volume Boilers大型火电机组控制 Control of Large Thermal Power Generator Networks大型数据库原理与高级开发技术 Principles of Large-Scale Data-Bas e and Advanced Development Technology大学德语 College German大学俄语 College Russian大学法语 College French大学日语 College Japanese大学生心理学 Psychology Introduction大学物理 College Physics大学物理实验 Experiment of College Physics大学英语 College English大学语文 College Chinese大众传播学 Mass Media代数几何 Algebraic Geometry代数几何Algebraic Geometry代数曲面 Algebraic Surfaces代数图论 Algebraic Graph Theory代数拓扑 Algebraic Topology代数学 Algebra代用燃料 Substitute Fuel代用运放电路 Simulated Transmittal Circuit单片机与接口技术 Mono-Chip Computers & Interface Technique单片机原理 Fundamentals of Mono-Chip Computers单片机原理及应用 Fundamentals of Mono-Chip Computers & Applications弹塑性力学 Elastic-Plastic Mechanics弹性波 Elastic Waves弹性力学 Elastic Mechanics, Theory of Elastic Mechanics弹性元件的理论及设计 Theory and Design of Elastic Element蛋白质结构基础 Principle of Protein Structure蛋白质生物化学技术 Biochemical Technology of Protein当代国际关系 Contemporary International Relationship当代国外社会思维评价 Evaluation of Contemporary Foreign Social Thought 当代文学 Contemporary Literature当代文学专题 Topics on Contemporary Literature当代西方哲学 Contemporary Western Philosophy当代戏剧与电影 Contemporary Drama & Films当代资本主义经济 Contemporary Capitalist Economy党史 History of the Party导波光学 Wave Guiding Optics德育 Moral Education等离子体工程 Plasma Engineering低频电子线路 Low Frequency Electric Circuit低温测试技术 Cryo Testing Technique低温传热学 Cryo Conduction低温固体物理 Cryo Solid Physics低温技术原理与装置 Fundamentals of Cryo Technology & Equipment低温技术中的微机原理 Priciples of Microcomputer in Cryo Technology低温绝热 Cryo Heat Insulation低温气体制冷机 Cryo Gas Refrigerator低温热管 Cryo Heat Tube低温设备 Cryo Equipment低温生物冻干技术 Biological Cryo Freezing Drying Technology低温生物学原理与应用 Principle & Application of Cryobiology低温实验技术 Cryo Experimentation Technology低温物理导论 Cryo Physic Concepts低温物理概论 Cryo Physic Concepts低温仪表及测试 Cryo Meters & Measurement低温原理 Cryo Fundamentals低温原理与设备 Cryo Fundamentals & Equipment低温制冷机 Cryo Refrigerator低温中的微机应用 Application of Microcomputer in Cryo Technology低温装置 Cryo Equipment低噪声电子电路 Low-Noise Electric Circuit低噪声电子设计 Low-Noise Electronic Designing低噪声放大与弱检 Low-Noise Increasing & Decreasing低噪声与弱信号检测 Detection of Low Noise & Weak Signals地基基础课程设计 Course Design of Groundsill Basis地理 Geography第二次世界大战史 History of World War II典型计算机分析 Classical Computer Analysis电测量技术 Electric Measurement Technology电厂计算机控制系统 Computer Control System in Power Plants电磁测量实验技术 Electromagnetic Measurement Experiment & Technology电磁场计算机 Electromagnetic Field Computers电磁场理论 Theory of Electromagnetic Fields电磁场数值计算 Numerical Calculation of Electromagnetic Fields电磁场与电磁波 Electromagnetic Fields & Magnetic Waves电磁场与微波技术 Electromagnetic Fields & Micro-Wave Technology电磁场中的数值方法 Numerical Methods in Electromagnetic Fields电磁场中的数值计算 Numerical Calculation in Electromagnetic Fields电磁学 Electromagnetics电动力学 Electrodynamics电镀 Plating电分析化学 Electro-Analytical Chemistry电工材料 Electrical Materials电工测量技术基础 Measurement Technology of Electrical Engineering电工测试技术基础 Testing Technology of Electrical Engineering电工产品学 Electrotechnical Products电工电子技术基础 Electrical Technology & Electrical Engineering电工电子学 Electronics in Electrical Engineering电工基础 Fundamental Theory of Electrical Engineering电工基础理论 Fundamental Theory of Electrical Engineering电工基础实验 Basic Experiment in Electrical Engineering电工技术 Electrotechnics电工技术基础 Fundamentals of Electrotechnics电工实习 Electrical Engineering Practice电工实验 Experiment of Electrical Engineering电工实验技术基础 Experiment Technology of Electrical Engineering电工学 Electrical Engineering电工与电机控制 Electrical Engineering & Motor Control电弧电接触 Electrical Arc Contact电弧焊及电渣焊 Electric Arc Welding & Electroslag Welding电化学测试技术 Electrochemical Measurement Technology电化学工程 Electrochemical Engineering电化学工艺学 Electrochemical Technology电机 Motor电机测试技术 Motor Measuring Technology电机电磁场的分析与计算 Analysis & Calculation of Electrical Motor &电机电磁场的数值计算 Calculation of Electrical Motor & Electromagnetic Fields电机电磁场理论 Theory of Electrical Moto & Electromagnetic Fields电机电器与供电 Motor Elements and Power Supply电机矩阵分析法 Analysis of Electrical Motor Matrix电机课程设计 Course Exercise in Electric Engine电机绕组理论 Theory of Motor Winding电机绕组理论及应用 Theory & Application of Motor Winding电机设计 Design of Electrical Motor电机瞬变过程 Electrical Motor Change Processes电机统一理论 Theory of Electrical Motor Integration电机学 Electrical Motor电机学及控制电机 Electrical Machinery Control & Technology电机与拖动 Electrical Machinery & Towage电机原理 Principle of Electric Engine电机原理与拖动 Principles of Electrical Machinery & Towage电机专题 Lectures on Electric Engine电接触与电弧 Electrical Contact & Electrical Arc电介质物理 Dielectric Physics电镜 Electronic Speculum电力电子电路 Power Electronic Circuit电力电子电器 Power Electronic Equipment电力电子器件 Power Electronic Devices电力电子学 Power Electronics电力工程 Electrical Power Engineering电力企业管理 Management of Electrical Enterprise电力生产技术 Technology of Electrical Power Generation电力生产优化管理 Optimal Management of Electrical Power Generation电力拖动 Electric Traction电力拖动基础 Fundamentals for Electrical Towage电力拖动控制系统 Electrical Towage Control Systems电力拖动与电气控制 Electrical Towage & Electrical Control电力系统 Power Systems电力系统电源最优化规划 Optimal Planning of Power Source in a Power System 电力系统短路 Power System Shortcuts电力系统分析 Power System Analysis电力系统规划 Power System Planning电力系统过电压 Hyper-Voltage of Power Systems电力系统继电保护原理 Power System Relay Protection电力系统经济分析 Economical Analysis of Power Systems电力系统经济运行 Economical Operation of Power Systems电力系统可靠性 Power System Reliability电力系统可靠性分析 Power System Reliability Analysis电力系统课程设计 Course Design of Power Systems电力系统无功补偿及应用 Non-Work Compensation in Power Systems & Applicati 电力系统谐波 Harmonious Waves in Power Systems电力系统优化设计 Optimal Designing of Power Systems电力系统远动 Operation of Electric Systems电力系统远动技术 Operation Technique of Electric Systems电力系统运行 Operation of Electric Systems电力系统自动化 Automation of Electric Systems电力系统自动装置 Power System Automation Equipment电力系统最优规划 Optimal Planning in Power System电力装置课程设计 Course Design of Power Equipment电力装置与系统 Power Equipment & System电路测量与实验 Circuit Measurement & Experiment电路测试技术 Circuit Measurement Technology电路测试技术基础 Fundamentals of Circuit Measurement Technology电路测试技术及实验 Circuit Measurement Technology & Experiments电路分析基础 Basis of Circuit Analysis电路分析基础实验 Basic Experiment on Circuit Analysis电路分析实验 Experiment on Circuit Analysis电路和电子技术 Circuit and Electronic Technique电路基本理论 Basis Theory of Circuitry电路及电子线路CAD Circuitry CAD电路理论 Theory of Circuit电路理论基础 Fundamental Theory of Circuit电路理论实验 Experiments in Theory of Circuct电路设计与测试技术 Circuit Designing & Measurement Technology电气测量技术 Electrical Measurement Technology电气传动 Electrified Transmission电气控制技术 Electrical Control Technology电器设计 Electrical Appliances Designing电器学 Electrical Appliances电器与控制 Electrical Appliances & Control电生理技术基础 Basics of Electricphysiological Technology电视传感器图象显示 Television Sensor Graphic Display电视接收技术 Television Reception Technology电视节目 Television Programs电视节目制作 Television Program Designing电视新技术 New Television Technology电视新闻 Television News电视原理 Principles of Television电网调度自动化 Automation of Electric Network Management电学实验 Electrical Experiment电影艺术 Art of Film Making电站微机检测控制 Computerized Measurement & Control of Power Statio电子材料与元件测试技术 Measuring Technology of Electronic Material and Element 电子材料元件 Electronic Material and Element电子材料元件测量 Electronic Material and Element Measurement电子测量与实验技术 Technology of Electronic Measurement & Experiment电子测试 Electronic Testing电子测试技术 Electronic Testing Technology电子测试技术与实验 Electronic Testing Technology & Experiment电子测试实验 Electronic Testing Experiment电子测试与实验技术 Electronic Testing Technology & Experiment电子机械运动控制技术 Technology of Electronic Mechanic Movement Control电子技术 Technology of Electronics电子技术腐蚀测试中的应用 Application of Electronic Technology in Erosion Measurement 电子技术基础 Basic Electronic Technology电子技术基础与实验 Basic Electronic Technology & Experiment电子技术课程设计 Course Exercise in Electronic Technology电子技术实验 Experiment in Electronic Technology电子技术综合性设计实验 Experiment in Electronic Technology电子理论实验 Experiment in Electronic Theory电子商务 Electronic Commerce电子系统的ASIC技术 ASIC Design Technologies电子显微分析 Electronic Micro-Analysis电子显微镜 Electronic Microscope电子线路 Electronic Circuit电子线路的计算机辅助设计 Computer Associate Design of Electronic Circuit电子线路课程设计 Course Design of Electronic Circuit电子线路设计与测试技术 Electronic Circuit Design & Measurement Technology电子线路设计与测试实验 Electronic Circuit Design & Measurement Experiment电子线路实验 Experiment in Electronic Circuit电子学 Electronics电子学课程设计 Course Design of Electronics电子照相技术 Electronic Photographing Technology雕塑艺术欣赏 Appreciation of Sculptural Art调节原理 Principles of Regulation调节装置 Regulation Equipment动力机械CAD Dynamical Machine CAD动力学 Dynamics动态规划 Dynamic Programming动态无损检测 Dynamic Non-Destruction Measurement动态信号 Dynamic Signal动态信号分析与仪器 Dynamic Signal Analysis & Apparatus动物病害学基础 Basis of Animal Disease动物免疫学 Animal Immunology动物生理与分子生物学 Animal Physiology and Molecular Biochemistry动物学 Zoology动物遗传工程 Animal Genetic Engineering毒理遗传学 Toxicological Genetics断裂力学 Fracture Mechanics断裂疲劳力学 Fatigue Fracture Mechanics锻压测试技术 Forging Testing Technique锻压工艺 Forging Technology锻压机械液压传动 Hydraulic Transmission in Forging Machinery锻压加热设备 Forging Heating Equipment锻压设备专题 Lectures on Forging Press Equipments锻压系统动力学 Dynamics of Forging System锻造工艺 Forging Technology锻造加热设备 Forging Heat Equipment对外贸易保险 International Trade Insurance对外贸易地理 International Marketing Geography对外贸易概论 Introduction to International Trade对外贸易运输 International Trade Transportation多层网络方法 Multi-Layer Network Technology多复变函数 Analytic Functions of Several Complex Variables多媒体计算机技术 Multimedia Computer Technology多媒体技术 Multimedia Technology多目标优化方法 Multipurpose Optimal Method多项距阵 Multi-Nominal Matrix多元统计分析 Multivariable StatisticsF开头的课程发电厂 Power Plant发电厂电气部分 Electric Elements of Power Plants发电厂电气部分与动力部分 Electric Elements & Dynamics of Power Plants发电厂电气部分与热力设备 Electric Elements & Thermodynamics Equipment of Power Plants 发电厂计算机控制 Computer Control in Power Plant发酵工程 Zymolysis Engineering发育生物学原理与实验技术 Principle and Experimental Technology of Development发展经济学 Evolutive Economics法理学 Nomology法律基础 Fundamentals of Law法学概论 An Introduction to Science of Law法学基础 Fundamentals of Science of Law翻译 Translation翻译理论与技巧 Theory & Skills of Translation反不正当经济法 Anti-malfeasance Economic Law泛读 Extensive Reading泛函分析 Functional Analysis泛函分析 Functional Analysis房屋建筑学 Architectural Design & Construction房屋建筑学课程设计 Course Design of House Architecture仿真与辅助设计 Simulation & Computer Aided Design放射生物学 Radiation Biology放射学 Radiology非电量测量 Non-Electricity Measurement非金属材料 Non-Metal Materials非线性采样系统 Non-Linear Sampling System非线性方程组的数值解法 Numerical Methods for No-linear System s of Equations非线性光学 Nonlinear Optics非线性规划 Non-Linear Programming非线性控制理论 Non-Linear Control Theory非线性双曲型守恒律解的存在性 The Existence of Solutions for Non -linear Hyperbolic Conservation Laws非线性物理导论 Introduction to Nonlinear Physics非线性振荡 Non-Linear Oscillation非线性振动 Nonlinear Vibration废水处理工程 Technology of Wastewater Treatment废水处理与回用 Sewage Disposal and Re-use沸腾燃烧 Boiling Combustion分布式计算机系统 Distributed Computer System / Distributed System分布式系统与分布式处理 Distributed Systems and Distributed Processing分离科学 Separation Science分析化学 Analytical Chemistry分析化学实验 Analytical Chemistry Experiment分析力学 Analytic Mechanics分析生物化学 Analytical Biochemistry分析生物化学 Analytical Biochemistry分子病毒学 Molecular Virology分子进化工程 Engineering of Molecular Evolution分子生物学 Molecular Biology分子生物学技术 Protocols in Molecular Biology分子遗传学 Molecular Genetics风机调节 Fan Regulation风机调节.使用.运转 Regulation, Application & Operation of Fans风机三元流动理论与设计 Tri-Variant Movement Theory & Design of Fans风能利用 Wind Power Utilization风险投资分析 Analysis of Risk Investment服务业营销 Service Industry Marketing辅助机械 Aided Machine腐蚀电化学实验 Experiment in Erosive Electrochemistry复变函数 Complex Variables Functions复变函数与积分变换 Functions of Complex Variables & Integral Transformation复合材料结构力学 Structural Mechanics of Composite Material复合材料力学 Compound Material Mechanics傅里叶光学 Fourier OpticsG开头的课程概率论 Probability Theory概率论与数理统计 Probability Theory & Mathematical Statistics概率论与随机过程 Probability Theory & Stochastic Process概率与统计 Probability & Statistics钢笔画 Pen Drawing钢的热处理 Heat-Treatment of Steel钢结构 Steel Structure钢筋混凝土 Reinforced Concrete钢筋混凝土及砖石结构 Reinforced Concrete & Brick Structure钢砼结构 Reinforced Concrete Structure钢砼结构与砌体结构 Reinforces Structure and Monsary Structure钢砼课程设计 Reinforced Concrete Course Design钢砼设计 Experiment of Reinforced Concrete Structure高层建筑基础 Tall Building Foundation高层建筑基础设计 Designing bases of High Rising Buildings高层建筑结构设计 Designing Structures of High Rising Buildings高等材料力学 Advanced Material Mechanics高等代数 Advanced Algebra高等发光分析 Advanced Luminescence Analysis高等分析化学 Advanced Analytical Chemistry高等工程力学 Advanced Engineering Mechanics高等光学 Advanced Optics高等环境微生物 Advanced Environmental Microorganism高等教育管理 Higher Education Management高等教育史 History of Higher Education高等教育学 Higher Education高等量子力学 Advanced Quantum Mechanics高等生物化学 Advanced Biochemistry高等数理方法 Advanced Mathematical Method高等数学 Advanced Mathematics高等数值分析 Advanced Numeric Analysis高等土力学 Advanced Soil Mechanics高等无机化学 Advanced Inorganic Chemistry高等有机化学 Advanced Organic Chemistry高电压测试技术 High-Voltage Test Technology高电压技术 High-Voltage Technology高电压技术与设备 High-Voltage Technology and Device高电压绝缘 High-Voltage Insulation高电压实验 High-Voltage Experiment高分子材料 High Polymer Material高分子材料及加工 High Polymer Material & Porcessing高分子化学 High Polymer Chemistry高分子化学实验 High Polymer Chemistry Experiment高分子化学与物理 Polymeric Chemistry and Physics高分子物理 High Polymer Physics高分子物理实验 High Polymer Physics Experiment高级程序设计语言的设计与实现 Advanced Programming Language's Design & Implementation 高级管理信息系统 Advanced Management Information Systems高级计算机体系结构 Advanced Computer Architecture高级计算机网络 Advanced Computer Networks高级计算机网络与集成技术 Advanced Computer Networks and Integration Technology高级经济计量 Advanced Economic Metrology高级软件工程 Advanced Software Engineering高级生化技术 Advanced Biochemical Technique高级生物化学 Advanced Biochemistry高级食品化学 Advanced Food Chemistry高级视听 Advanced Videos高级数据库 Advanced Database高级数理逻辑 Advanced Numerical Logic高级水生生物学 Advanced Aquatic Biology高级英语听说 Advanced English Listening & Speaking高级植物生理生化 Advanced Plant Physiology and Biochemistry高能密束焊 High Energy-Dense Beam Welding高频电路 High-Frequency Circuit高频电子技术 High-Frequency Electronic Technology高频电子线路 High-Frequency Electronic Circuit高维代数簇 Algebraic Varieties of Higher Dimension高压测量技术 High-Voltage Measurement Technology高压测试技术 High-Voltage Testing Technology高压电场的数值计算 Numerical Calculation in High-Voltage Electronic Field 高压电工程 High-Voltage Engineering高压电技术 High-Voltage Technology高压电器 High-Voltage Electrical Appliances高压绝缘 High-Voltage Insulation高压实验 High-Voltage Experimentation高压实验设备测量 High-Voltage Experimentation Equipment Measurement高压试验技术 High-Voltage Experimentation Technology工厂电气设备 Electric Equipment of Plants工厂供电 Factory Electricity Supply工程材料的力学性能测试 Mechanic Testing of Engineering Materials工程材料及热处理 Engineering Material and Heat Treatment工程材料学 Engineering Materials工程测量 Engineering Surveying工程测量实习 Engineering Measuring Practice工程测试技术 Engineering Testing Technique工程测试实验 Experiment on Engineering Testing工程测试信息 Information of Engineering Testing工程测试与信号处理 Engineering Testing & Signal Processing工程地质 Engineering Geology工程动力学 Engineering Dynamics工程概论 Introduction to Engineering工程概预算 Project Budget工程经济学 Engineering Economics工程静力学 Engineering Statics工程力学 Engineering Mechanics工程热力学 Engineering Thermodynamics工程数学 Engineering Mathematics工程项目概预算 Engineering Project Estimate & Budget工程项目评估 Engineering Project Evaluation工程优化方法 Engineering Optimization Method工程运动学 Engineering Kinematics工程造价管理 Engineering Cost Management工程制图 Graphing of Engineering工业产品学 Industrial Products工业电子学 Industry Electronics工业分析 Industrial Analysis工业锅炉 Industrial Boiler工业会计学 Industrial Accounting工业机器人 Industrial Robot工业技术基础 Basic Industrial Technology工业技术经济 Industrial Technology Economics工业建筑设计原理 Principles of Industrial Building Design工业经济理论 Industrial Economic Theory工业经济学 Industrial Economics工业美术设计 Art Designing in Industry工业企业财务管理 Industrial Enterprise Financial Management工业企业财务会计 Accounting in Industrial Enterprises工业企业管理 Industrial Enterprise Management工业企业经营管理 Industrial Enterprise Administrative Management工业社会学 Industrial Sociology工业心理学 Industrial Psychology工业窑炉 Industrial Stoves工艺过程自动化 Technics Process Automation工艺设计 Technics Design工艺实习 Technics Practice工艺原理与研究方法 Principles & Research of Technics公差 Common Difference公差测试实验 Common Difference Testing Experiment公差技术测量 Technical Measurement with Common Difference公差与配合 Common Difference & Cooperation公共关系 Public Relationship公共关系学 Public Relations公司法 Corporation Law公司组织与管理 Organization and Management公司组织与管理 Organization and Management of Corporate公文写作 Document Writing功能材料原理与技术 Principle and Technology of Functional Materials 功能高分子 Functional Polymer功能性食品 Function Foods古代汉语 Ancient Chinese古典文学作品选读 Selected Readings in Classical Literature骨科医学 Osteopathic Medicine固体磁性理论 Theory of Magnetism in Solid固体激光 Solid State Laser固体激光器件 Solid Laser Elements固体激光与电源 Solid State Laser & Power Unit固体理论 Solid State Theory固体物理 Solid-State Physics故障诊断与容错技术 Malfunction Diagnoses & Tolerance Technology关税 Tariff管理概论 Introduction to Management管理沟通 Management Communication, Management Negotiation管理会计 Managerial Accounting管理经济学 Management Economics管理科学专题 Management Science Special Subject管理数学 Management Mathematics管理系统FOXBASE Management System of FOXBASE管理系统模拟 Management System Simulation管理心理学 Management Psychology管理信息系统 Management Information System管理学 Management Theory, Principles of Management管理学 Principles of Management光波导理论 Light Wave Guide Theory光电技术 Photoelectric Technology光电检测与信号处理 Optoelectronic Detection and Processing光电课程设计 Photoelectric Course Exercise光电摄像技术 Photoelectric Photographing Technique光电探测及信号处理 Photoelectric Inspect & Signal Processing光电系统课程设计 Photoelectric System Course Design光电信号处理 Photoelectric Signal Processing光电信号与系统分析 Photoelectric Signal & Systematic Analysis光电信息计算机处理 Computer Processing in Photoelectric Information光电子技术 Photoelectronic Technique光电子学与光电信息技术 Optoelectronics and Optoelectronic Information Technology 光辐射探测技术 Ray Radiation Detection Technology光接入网技术 Technology of Light Access Network光谱 Spectrum光谱分析 Spectral Analysis光谱学 Spectroscopy光纤传感 Fibre Optical Sensors光纤传感器 Fibre Optical Sensors光纤传感器基础 Fundamentals of Fibre Optical Sensors光纤传感器及应用 Fibre Optical Sensors & Applications光纤光学 Fiber Optics光纤光学课程设计 Course Design of Fibre Optical光纤技术实验 Experiments in Fibre Optical Technology光纤实验 Experiments in Fibre Optical。
The power plant is the heart of a ship. 动力装置是船舶的心脏。
The power unit for driving the machines is a 50-hp induction motor.驱动这些机器的动力装置是一台50马力的感应电动机。
Semiconductor devices, called transistors, are replacing tubes in many applications.半导体装置也称为晶体管,在许多场合替代电子管。
Cramped conditions means that passengers’legs cannot move around freely.空间狭窄,旅客的两腿就不能自由活动。
All bodies are known to possess weight and occupy space. 我们知道,所有的物体都有重量并占据空间。
The removal of minerals from water is called softening. 去除水中的矿物质叫做软化。
A typical foliage leaf of a plant belonging to the dicotyledons is composed of two principal parts: blade and petiole.Einstein’s relativity theory is the only one which can explain such phenomena.All four (outer planets) probably have cores of metals, silicates, and water.The designer must have access to stock lists of the materials he employs.设计师必须备有所使用材料的储备表。
第16卷第4期精密成形工程2024年4月JOURNAL OF NETSHAPE FORMING ENGINEERING53基于不同算法的Ti/SS316爆炸焊接数值模拟研究缪广红1*,朱志强2,周大鹏3,刘自伟2,陈龙2,张旭2,楚翔宇2(1.安徽理工大学力学与光电物理学院,安徽淮南 232001;2.安徽理工大学土木建筑学院,安徽淮南 232001;3.中煤科工集团淮北爆破技术研究院有限公司,安徽淮北 235000)摘要:目的研究不同基复板间隙对爆炸焊接质量的影响,对钛(Ti)/不锈钢(SS316)的爆炸焊接过程进行数值模拟研究。
方法利用ANSYS/LS-DYNA有限元软件,结合光滑粒子流体动力学-有限元耦合法(SPH-FEM耦合算法)和拉格朗日-欧拉耦合法(ALE算法),对钛(Ti)/不锈钢(SS316)爆炸焊接过程进行三维数值模拟,通过不同算法得到不同基复板间隙下的碰撞速度、碰撞压力及碰撞角,并将模拟结果与试验及理论计算结果进行对比。
结果当间隙为5、10、15 mm时,SPH-FEM耦合算法和ALE算法的复板碰撞速度均落在爆炸焊接窗口内,表明纯钛(Ti)和不锈钢(SS316)均能成功实现焊接,没有脱落与鼓包。
与SPH-FEM耦合算法相比,ALE算法下的碰撞速度、碰撞压力和碰撞角的模拟结果和理论计算结果更加吻合,可信度更高。
结论ALE算法的模拟结果与试验结果吻合,且与理论计算结果的误差更小,表明ALE算法用于纯钛(Ti)和不锈钢(SS316)爆炸焊接是有效的。
关键词:爆炸焊接;数值模拟;SPH-FEM耦合法;ALE算法;间隙DOI:10.3969/j.issn.1674-6457.2024.04.007中图分类号:TG456.6 文献标志码:A 文章编号:1674-6457(2024)04-0053-08Numerical Simulation of Ti/SS316 Explosive Welding Based on Different AlgorithmsMIAO Guanghong1*, ZHU Zhiqiang2, ZHOU Dapeng3, LIU Ziwei2, CHEN Long2, ZHANG Xu2, CHU Xiangyu2(1. School of Mechanics and Optoelectronics Physics, Anhui University of Science and Technology, Anhui Huainan 232001,China; 2. School of Civil Engineering and Architecture, Anhui University of Science and Technology, Anhui Huainan 232001, China; 3. CCTEG Huaibei Blasting Technology Research Institute Co., Ltd., Anhui Huaibei 235000, China)ABSTRACT: The work aims to study the effect of different base laminate clearance on the quality of explosive welding, and conduct numerical simulation on the explosive welding process of titanium (Ti)/stainless steel (SS316). A three-dimensional numerical simulation of the explosive welding process of titanium (Ti)/stainless steel (SS316) was carried out by using ANSYS/LS-DYNA Finite Element software combined with smooth particle hydrodynamics-finite element coupling method (SPH-FEM coupling algorithm) and Lagrangian-Euler coupling method (ALE algorithm). The collision velocity, collision pres-sure and collision angle under different base laminate clearance were obtained by different algorithms, and the simulation results收稿日期:2024-01-04Received:2024-01-04基金项目:国家自然科学基金(11902003);安徽省重点研究与开发计划(2022a05020021)Fund:The National Natural Science Foundation of China (11902003); Key Research and Development Program of Anhui Province (2022a05020021)引文格式:缪广红, 朱志强, 周大鹏, 等. 基于不同算法的Ti/SS316爆炸焊接数值模拟研究[J]. 精密成形工程, 2024, 16(4): 53-60.MIAO Guanghong, ZHU Zhiqiang, ZHOU Dapeng, et al. Numerical Simulation of Ti/SS316 Explosive Welding Based on Different Algorithms[J]. Journal of Netshape Forming Engineering, 2024, 16(4): 53-60.*通信作者(Corresponding author)54精密成形工程 2024年4月were compared with the experimental and theoretical calculation results. At the clearance of 5, 10 and 15 mm, the collision ve-locities of the SPH-FEM coupling algorithm and the ALE algorithm fell within the explosive welding window, indicating that both pure titanium (Ti) and stainless steel (SS316) could be successfully welded without falling off and bulging. Compared with the SPH-FEM coupling algorithm, the simulation results of collision velocity, collision pressure and collision angle under the ALE algorithm were more consistent with the theoretical calculation results, and the reliability was higher. The simulation re-sults of the ALE algorithm are in good agreement with the experimental results, and the error with the theoretical calculation re-sults is smaller. The effectiveness of the ALE algorithm for explosive welding of pure titanium (Ti) and stainless steel (SS316) is demonstrated.KEY WORDS: explosive welding; numerical simulation; SPH-FEM coupling method; ALE algorithm; clearance钛因其优异的耐腐蚀性和高拉伸强度而得到了广泛的应用[1-2]。
Kinetic modeling of calcium aluminate cement hydrationNeven Ukrainczyk nFaculty of Chemical Engineering and Technology,University of Zagreb,Marulic´ev trg20,HR-10000Zagreb,Croatiaa r t i c l e i n f oArticle history:Received27April2010Received in revised form7July2010Accepted5August2010Available online12August2010Keywords:HydrationCalcium aluminate cementKineticsMathematical modelingX-ray diffractiona b s t r a c tThe hydration of iron-rich calcium aluminate cement(CAC)has been investigated by differentialcalorimeter and quantitative powder X-ray diffraction(QXRD).A simplified stoichiometric model ofearly age CAC hydration based on reaction schemes of the principal mineral monocalcium aluminatewas employed.The CAC characteristic feature of retardation of nucleation and growth mechanism withtemperature requires employing more than one kinetic mechanism to describe the resulting complexhydration kinetics.This paper proposes a single equation kinetic model of CAC hydration whichcomprises simultaneously three main mechanisms:nucleation and growth,chemical interaction andmass transfer.A gradual change between kinetic mechanisms was grasped with a reasonable inter-dependency of the kinetic parameters.The overall hydration kinetics was described relative to theamount of the both reactants,cement and free water.&2010Elsevier Ltd.All rights reserved.1.IntroductionCalcium aluminate cement(CAC)is very versatile specialcement advantageously used in numerous specific applications(Bensted,2002;George,1983;Mangabhai,2001,1990;Scriveneret al.,1999).As the hydration of CAC is highly temperaturedependent,yielding structurally different hydration products thatcontinuously alter material properties,a good knowledge ofthermal properties at early stages of hydration is essential(Frydaet al.,2001;Ukrainczyk and Matusinovic´,2010;Ukrainczyk,2009;Ukrainczyk et al.,2007).Hydraulic hardening of CAC is primarilydue to the hydration of monocalcium aluminate(CA,cementnotation:C[CaO],A[Al2O3],H[H2O],F[Fe2O3]),but other com-pounds may also participate in the hardening process especiallyin long term strength development.The hydration of CAC istemperature dependent,yielding CAH10as main products attemperatures less than201C,C2AH8and AH3at about301C andC3AH6and AH3at temperatures greater than551C.CAH10and C2AH8are known to be metastable at ambient temperatureand convert to the more stable C3AH6and AH3with consequentmaterial porosity increase and loss of strength.The conversionis accelerated by temperature and moisture availability forthe dissolution and re-precipitation processes to take place(Mangabhai and Glasser,2001).Studies in thefield of calcium aluminate cement hydrationkinetics are scarce and insufficient in comparison to Portlandcement(PC)studies.In literature there is still not yet an adequateCAC hydration kinetic model.This is due to the complexity of theCAC hydration process which is highly temperature dependent incontrast to PC where this dependency is much less pronounced.For hydration of iron-rich CAC at temperature range from30to451C Banfill(1995)found the apparent activation energy tobe E a¼120kJ molÀ1.Bushnell-Watson(1987;Banfill,1995)obtained E a ranging from89to133kJ/mol for commercial high-purity CAC and128kJ/mol for pure CA.On the other handRashid and Turrillas(1997)described the hydration of CA attemperatures60–901C by Jander’s diffusion model and reportedE a¼84kJ molÀ1.However,there are no data on the activation energies for lowertemperature hydration reactions due to the difficulties arisingfrom the CAC characteristic feature of the retardation of nuclea-tion and growth mechanism with temperature.To investigate thiscomplex behavior the basic kinetic mechanisms of CAC hydrationmust be separated.There are models proposed for PC hydration that divide theprocess into separate mechanisms,which are governed by masstransfer,nucleation and growth,boundary reactions,and/ordiffusion,respectively(Dabic´et al.,2000;Park et al.,2005).Thedevelopment of numerical models has provided advancedmethods to describe the PC hydration based on the3D micro-structure evolution algorithms of which the most famous areCEMHYD3D(Bentz,2005,1997)and HYMOSTRUC(Breugel,1995)and the recently developed m ic(Bishnoi and Scrivener,2009).This paper proposes the kinetic model of CAC hydration whichcomprises simultaneously three main mechanisms:nucleationand growth,chemical interaction and mass transfer.Employingthe model a kinetic analysis of the influence of temperature andH/CAC ratio on the individual mechanisms was performed.Contents lists available at ScienceDirectjournal homepage:/locate/cesChemical Engineering Science0009-2509/$-see front matter&2010Elsevier Ltd.All rights reserved.doi:10.1016/j.ces.2010.08.012n Tel.:+38514597228.E-mail address:nukrainc@fkit.hrChemical Engineering Science65(2010)5605–56142.Hydration kineticsHydration process comprises numerous simultaneous chemi-cal reactions with individual mechanisms including dissolution of cement,nucleation and growth of hydration products,chemical reaction between solid and liquid phase and mass transfer through the cement paste matrix.Each of these mechanisms evolves according to individual kinetic law and the overall rate of hydration is primarily controlled by the slowest mechanism. However,the overall effect is the result of all interactions of the individual mechanisms.By means of the heat released,it is possible to determine the evolution of hydration degree relative to hydration age according to the equation:aðtÞ¼QðtÞ1ð1Þwhere Q(t)is the heat released by time t,and Q N represents the reference heat of a cement sample.The rate of hydration process, r in a closed system(no exchange of mass with an environment)is defined by the model of batch reactor:r¼d aðtÞdtð2ÞBy combining Eqs.(1)and(2)the evolution of the rate ofhydration can be calculated:d aðtÞdt ¼qðtÞQ1ð3Þwhere q is the specific generation of heat(J gÀ1hÀ1).As the CAC hydration kinetics is a complex process,a single mechanism models(namely chemical reaction of n th order (Bentz,2006),Avrami–Erofe’ev(Banfill,1995;Fryda,2001),Jander (Rashid and Turrillas,1997)or empirical autocatalytic model are not appropriate to describe the actual change of hydration rate during entire hydration.There are kinetic models which are derived from the geometric description of the reacting cement core(Dabic´et al.,2000;Park et al.,2005).However,such models with physical meaning are still much idealized,laying on an assumptions of mono-disperse and mono-mineral spherical cement grains that change the volume upon hydration.Evolving such a simplified model to describe the particle size distribution employs complex simula-tion programs(e.g.Bentz,1997;Breugel,1995).Still the influence of poly-mineral feature of cement grains(Mangabhai,1990)is not yet adequately considered in modeling methodologies although it should represent an important factor.The goal of this paper is to propose a relatively simple kinetic model,but alsoflexible enough to describe the influence of the main variables(temperature,H/CAC ratio,and even mineralogical composition).There are kinetic models of cement hydration proposed for PC based on detailed chemical reactions scheme of individual cement minerals(Bentz,1997;Park et al.,2005),but they are too complex for efficient practical engineering applica-tions.Over-parameterization of these complex,but still approx-imate models of hydration process does not satisfy the set goal of this paper.On the other hand,there are simple analytical empirical kinetic models(Banfill,1995;Bentz,2006;Rashid and Turrillas,1997;Wojcik et al.,2001)used to describe PC hydration with a single mechanisms.Employing the proposed model it is still possible to test the influence of mineralogical composition, particle size distribution and describe the microstructure evolu-tion(Bentz,1997;Jennings and Johnson,1986;Park et al.,2005) of cement paste during hydration.The hydration kinetics of CAC differs from that of the PC.general kinetic difference is that in CAC hydration theproducts do not form an initialfilm barrier on the surface anhydrous cement grains,as in calcium silicates hydration,but precipitate in water-filled porosity homogenously(Lamour et al., 2001).This through-solution(homogenized crystallization)me-chanism is responsible for the unhindered hydration process and the resulting rapid hydration evolution after the massive nuclea-tion process.To investigate the complex behavior of CAC hydration the basic kinetic mechanisms are separated as nucleation and growth,chemical interaction and mass transfer.The initial stage of cement wetting and dissolution process(during thefirst minutes of hydration)and the dormant period is not considered by the proposed model.This stage can be approximated as a constant reaction rate of low value(see further Section5.2).2.1.Nucleation and growth,NGDuring the dormant period there is a process of constant low reaction rate attributed to dissolution and difficult nucleation.The dormant period is followed by a period in which the reaction rate is proportional to the cement reaction degree which can be attributed to the nucleation and growth mechanism.A linear relationship of the rate of this mechanism with hydration degree can be assumed:r NG¼k NGðaÀa0Þð4Þwhere k NG is the constant for nucleation and growth of hydration products,hÀ1,a the degree of reacted CA,a0the initial NG parameter which approximately corresponds to the end of dormant period.2.2.Chemical interaction,IAfter the acceleration stage the hydration rate is slowing down according to a chemical reaction expression due to the consump-tion of reactants.This mechanism may be modeled by a general chemical reaction expression of water and cement consumption: r I¼k Ið1ÀaÞð1Àa HÞeð5Þwhere k I is the chemical reaction rate constant,hÀ1,a H the degree of reacted waterSimilar modeling approach is used for describing PC hydration kinetics(Bentz,2006;Wojcik et al.,2001).Wojcik et al.(2001) argued that a bimolecular reaction model is reasonable due to the similarity between hydration reactions and bimolecular nucleo-philic substitution reactions in the sol–gel process in producing ceramics.The hydration of CAC at temperatures below$251C exhibits high influence of water to cement ratio on hydration rate and obtained hydration degree due to the high stoichiometric water requirement.Theoretically,the cement hydration may be incom-plete if there is not enough water for stoichiometric hydration so the hydration rate decreases due to the free water consumption and reaches zero value upon water insufficiency(other reasons for incomplete hydration are discussed further in Sections2.3 and5.1).Furthermore,since all hydration products must form in the available water-filled porosity,the hydration rate is depen-dent on the space available for growth of hydration products (Bentz,2006).The relationship between reactants,cement(a)and water(a H) can be calculated bya H¼a=Zð6Þwhere Z¼aða H¼1Þis a theoretical hydration degree for complete reaction of free water(in closed,i.e.sealed conditions)that can berainczyk/Chemical Engineering Science65(2010)5605–5614 5606calculated according to the simplified stoichiometric model of lower temperature early age hydration based only on CA hydraulicity(see further Section5).2.3.Mass transfer,kIn the last stage of hydration the reaction rate is controlled by a mass transfer process through the cement paste matrix.The permeability can be directly linked to the percolation of the free water through the paste matrix.By considering that the percola-tion of the water is lowered with the growth of the hydration products,the permeability would have to decrease with the hydration degree.Mass transfer process is taken to be propor-tional to the hydration degree of the limiting reactant:r k¼k e1Àa Zð7ÞThe effective mass transfer coefficient,k e is taken to be a function of the hydration degree of limiting reactant to account for the cement matrix permeability decrease and is expressed by an empirical relation(Park et al.,2005;Tomosawa,1997):k e¼k k ln Z adð8Þwhere k k is a mass transfer coefficient(hÀ1).The most widely known empirical relationship between electrical conductivity (i.e.mass transfer)and material porosity and degree of saturation is the empirical Archie’s law that was derived on sedimentary rock(Archie,1942):G e¼G fÀn SÀmð9Þwhere G e is the effective conductivity,G the bulk water conductivity,f is the porosity,S is the water saturation degree. The m is the cementation exponent of the rock(usually in the range 1.5–2.0),and n is the saturation exponent(usually close to2). By considering the saturated condition,the conductivity as equivalent to the mass transfer coefficient,and the proportionality between the material porosity evolution and the hydration degree,the following equation may be investigated to test for the kinetic modeling:k e¼k k aÀnð10Þ2.4.Proposed kinetic modelThe overall hydration kinetics can be modeled as a single equation by combining the three rate determining mechanisms: nucleation and growth,chemical interaction and mass transfer:r¼1ð1=r NGÞþð1=r IÞþð1=r kÞð11Þwhere the governing rates of individual mechanisms are listed in Eqs.(4)–(8)and the degree of hydration is calculated according to Eq.(2).3.Parameter inter-dependencyThe uncertainty in each parameter is dependent on interaction with other parameters,so in order to quantify this,the dependency values can be calculated:Dependency i¼1Às2ii,fixð12Þwhere s i is the standard error of the estimated parameter i whenall parameters arefitted,while s i,fix is obtained byfitting only theparameter i with afixed values for all the other parameters totheir bestfit values corresponding to s i.Estimates of the standarderrors of parameters are calculated ass2¼covði,iÞRMS2ð13Þwhere RMS is the root of mean squared errors of thefit,andcov(i,i)is the diagonal element of the covariance matrix defined ascov¼ðJ T JÞÀ1ð14Þwhere J is the sensitivity matrix or Jacobian(O¨zisik and Orlande,2000),in explicit form:JðpÞ¼@rðpÞ¼@r1@p1@r1@p2ÁÁÁ@r2@p n@r2@p1@r2@p2ÁÁÁ@r2@p n^^^@r m1@r m2ÁÁÁ@r mn2666666666437777777775ð15ÞThe sensitivity matrix has a size mÂn,where m is the numberof data points and n is the number of parameters.The elements ofthe sensitivity matrix,called the sensitivity coefficients are thusdefined as thefirst derivative of the estimated hydration rate attime t m with respect to the unknown parameter p n,i.e.J n,m¼@r m@p nð16ÞWhen the parameters are entirely independent,or mathema-tically said orthogonal,a dependency value is zero.In this idealcase the increase in a RMS caused by varying the value of oneparameter cannot be reduced by also varying the values of otherparameters.The model Eq.(11)grasps all the three mechanismssimultaneously with different rates(Fig.5).In that way a gradualchange from one kinetic mechanism to the other can be describedbut with a reasonable inter-dependency of the kinetic parametersto keep the estimates to be precise.A dependency value equal toone indicates over-parameterization leading to very wide con-fidence intervals.In that case varying the value of one parameter,the modeled curve can be reconstructed by varying the values ofthe other parameters.4.ExperimentalThis paper examines the hydration of sample of commercialCAC ISTRA40taken from a regular production of Istra Cement,Croatia(CALUCEM Group).The cement has the oxide massfraction composition listed in Table1.Physical properties of usedcement are given in Table2.The major compounds are CA,ferritephase(C4AF)and pleochroite,with mayenite(C12A7),gehlenite(C2AS),belit(C2S)and perovskite as minor compounds.The influence of temperature(T¼5–201C)and water tocement mass ratio(H/CAC¼0.4,0.5and 1.0)onto the CAChydration has been investigated by differential calorimeter andquantitative powder X-ray diffraction(QXRD).Table1Chemical composition of investigated CAC.CaO Al2O3Fe2O3FeO SiO2TiO2MgO SO3Na2O K2O Sum37.1038.4714.39 2.90 4.43 1.050.900.200.140.1799.8rainczyk/Chemical Engineering Science65(2010)5605–561456074.1.Differential calorimeterThe rate of heat generation of the prepared CAC samples has been determined by the differential isoperibolic-conduction microcalorimeter developed at the Technical University ofBudapest (Krstulovic´et al.,1982).It is capable of giving information on heat evolution from the instant the water was injected in cement sample holder.As hydration heat evolves the small temperature difference across a thermopile between the sample cell and reference cell produces a voltage that is logged at regular time intervals (10s)by a microvoltmeter (Data logger Almemo-2390-8,with DC Millivolt Connectors,resolution 1m V).The calorimeter operates under isoperibolic conditions with small temperature difference.The rate of heat generation at time t ,is calculated applying Tian’s equation (Calvet and Prat,1963;Krstulovic ´et al.,1982):dQ ¼c p dUþb Uð17Þwhere U is the voltage difference (referenced to baseline),c p is effective heat capacity of calorimeter (J/1C),g is voltage to temperature conversion constant (m V/1C),b is calorimeter cooling constant (s À1),and m is cement mass.Small samples,4g of cement,were used to avoid undesirable temperature rise in the cell.More detailed operation and calibration of the calorimeter isdescribed elsewhere (Krstulovic´et al.,1982).To assure good wetting of the cement a hole through the cement sample in a sample holder was created by a glass stick (2mm thick)and a relatively high H/CAC ratios were used.The cement and appro-priate amount of water was left to reach thermal equilibrium (overnight)in an ultra thermostat before the water was injected into the cement sample holder to start the hydration.Results are presented as an average of at least two measured curves.Uncertainty of the microcalorimetric measurement of heat evolved (Q (J g À1,with 95%confidence)is evaluated to be 73%.4.2.Powder X-ray diffractionPhillips diffractometer PW1830with a CuK a radiation (40kV,30mA)was used,the scan step was 0.011with collection time of 10s.For quantitative X-ray analysis (QXRD),the prepared hydrated samples were additionally fired at 5001C to decompose the hydrates to amorphous calcium aluminium oxides and water vapour (Fig.1).By the method proposed in this paper,the inter-ferences of the hydration products are excluded from the diffractograms.This enables a direct determination of the degree of hydration of individual minerals upon comparing the quantities in hydrated and initial (non-hydrated)cement samples.The temperature for decomposition was chosen by inference to thermo-gravimetry and XRD analysis of hydrated samples (Ukrainczyk et al.,2007).CAC quantitative X-ray diffraction using the adiabatic principle with auto flushing (Bezjak,1961;Chung,1974)is proven to be a suitable method (Midgley,1976).In such method the relationship between the intensity of the characteristic X-ray reflection I i is directly proportional to the weight fraction of the component bythe factor k i which contains the mass absorption coefficient of the total sample.Experimentally determined k i values hold only for the detecting system and for no other.Reasonable standard materials for such a study are rutile (TiO 2)(Mohamed and Sharp,2002)or corundum (Al 2O 3)(Midgley,1976).The rutile used in this study had a narrow particle size distribution around approximately 0.4m m,which would reduce microabsorption effect.XRD analysis of chosen standard rutile showed no traces of anatase.In this work,CA and C 12A 7in CAC and fired hydrated samples are quantified based on Chung method.The k i values were determined by mixing of pure phase and standard mineral rutile (TiO 2)in a 50:50weigh ratio.For the syntheses of CA and C 12A 7,precipitated calcite (CaCO 3analytical grade purity,Kemika)and gibbsite (Al(OH)3,Sigma-Aldrich)have been wet homoge-nized in planetary mill (FRITSCH,Pulverisette 5,a -alumina pot and grinding balls)in the required stoichiometric mole propor-tion,dried at 1051C and fired twice at 1350and 13001C,respectively,for 4h in an air atmosphere electric furnace.Pure CA and C 12A 7were milled in a ring agate mortar and sieved below 40m m to maximize the number of particles analyzed,to improve powder homogeneity and packing characteristics,and to mini-mize microabsorption-related problems.Each sample prepared for QXRD was mixed with 20mass%of rutile,followed by grinding and homogenization in an agate mortar under acetone.Appropriate corrections for peak overlap were meticulously applied by inference to the (measured)intensities of the pattern due to the pure phases.Measurement uncertainty of the QXRD analysis is evaluated to be 72%(with 95%confidence level).5.Results and discussionThe XRD analysis on specimens hydrated at appropriate temperature for 30h confirmed the hydrate compositions expected from the literature.At 51C only CAH 10was observed,Table 2Physical properties of investigated CAC.490m m (%)o 40m m (%)Blaine (cm 2/g)Specific gravity (g/cm 3)Setting time (min)Standard consistency (%)InitialFinal 3.7680.5035083.2029832924.0Fig.1.Example of quantitaive X-ray analysis of CAC hydration.rainczyk /Chemical Engineering Science 65(2010)5605–56145608while at201C a small quantity of C2AH8and AH3could be detected.The formation of this small amount of C2AH8and AH3 was neglected in the modeling work and the likely impact on the overall hydration heat and reaction stoichiometry is discussed in this section.The C2AH8and AH3phase formation may be attributed to the hydration of both CA and C12A7.The QXRD analysis of investigated CAC gave the mass proportions of CA and C12A7to be41%and4%,respectively.The rest of the CAC is comprised of ferrite phase(C4AF)and pleochroite as major compounds and C2AS,C2S and perovskite as minor compounds.The QXRD on hydrated samples was done by the proposed method as detailed in Section4.2.Degrees of hydration after30h are estimated based on the results of reacted CA from the QXRD analysis(Fig.1).The degree of CAC hydration is approximated as a degree of reacted CA.In the case of iron-rich CAC,the most hydraulic phases are CA and C12A7,while the rest of the phases (C2S,C2AS,C4AF,perovskite and pleocroite)may be considered to have no significant reactivity at early ages(first48h)(Bensted, 2002).As C12A7is generally present in much smaller quantities ($2–5%)than CA(40–60%)(Bensted,2002;Mangabhai,1990)in iron-rich CAC and typically70–90%of the heat evolved is liberated in thefirst24h(George,1983),estimation of a degree of hydration of early age hydration process based only on CA hydraulicity seems reasonable for the intended purpose.By this a constant ratio of amount of reacting CA and amount of other mineral components is assumed during thefirst30h of hydration.The simplified stoichiometric model which considers only CA hydraulicity is justified only for the lower temperature early age hydration:Z¼H=CACxð18Þx¼ðH=CAÞsteh w CAð19Þwhere x is the CAC approximate stoichiometric water requirement, (H/CA)steh is the stoichiometric water requirement for CA reaction, and w CA is the amount of CA mineral in CAC.The reactivity of other phases but CA(and C12A7)have been disregarded in the simplified stoichiometric model of CAC hydration.The hydration of C12A7was treated together with CA hydration by simply increasing the CA quantity by the amount of C12A7in CAC.The assumption of their congruent hydration and similar reaction stoichiometry is justifiedby the small amount of the C12A7in the CAC.The relationship of Q vs.a CA for a30h hydration at given temperature and H/CAC ratio is presented in Fig.2.A linear regression by constraining the intercept to be0(no heat output at a CA¼0)resulted in a R2¼0.955.Higher positive deviation from the linear model for both the higher temperatures of hydration and higher H/CAC ratios can be attributed to the temperature sensitivity of CA hydration scheme(at higher temperature small quantities of C2AH8and AH3are observed by XRD)and reactivity of other phases beside CA and C12A7(mainly C4AF and C2S).The theoretical heats for the complete hydration of the minerals are calculated using the available thermodynamic data for cement substances(Babushkin et al.,1985).At201C the CA reaction heats for the CAH10and the C2AH8+AH3formation are708and578J/g, respectively.At201C the C12A7reaction heat for the CAH10+ C2AH8formation is765J/g.Thus,the experimental results show that the effect of the C12A7and C4AF hydration overrides the effect of the endothermic transformation(CAH10to C2AH8+AH3).The obtained proportionality constant,a¼3127J/g in Fig.2is in reasonable accord with the reaction heat calculated by the proposed simplified reaction model(45%of the reactive CA phase),Q¼318J/g.It must be noted that for long term hydration and higher temperatures(T4201C)Q vs.a relationship may be expected to be non-linear due to the numerous different reactions taking place at different hydration age and temperature(primar-ily attributed to the temperature sensitivity of hydration reactions of CA and C4AF minerals).Based on the calorimetric and QXRD results the degree of hydration,a and the corresponding rate of hydration,d a/d t was calculated by Eqs.(1)and(3),respectively,and examples plotted as shown in Figs.3–5.Reference heat,Q N is obtained from the experimental value of heat(Q(t end))released at the end of the calorimetric measurement,t end and the corresponding hydration degree,a(t end):Q1¼Qðt endÞa endð20ÞThe influence of temperature on the rate of hydration is presented in Fig.3.Increasing temperature from5to101C (a)decreases the rate of nucleation and growth of CAH10and retards the setting time,which is in accord with previous literature(Banfill,1995;Bushnell-Watson and Sharp,1986, 1990;Damidot et al.,1997),(b)increases the main maximal rate of heat evolution due to higher rates of chemical interaction mechanism,and(c)increases thefinal experimentally obtained hydration degree.Applying Avrami–Erofe’ev equation Banfill (1995)concluded that the maximum rate of heat evolutionand Fig.2.The evolved heat after30h of hydration and the corresponding degree of reacted CA(the numbers designate the specimens according to Table3).Fig. 3.Example of the influence of temperature on hydration kinetics at H/CAC¼0.4.rainczyk/Chemical Engineering Science65(2010)5605–56145609。
文章编号:1671-7872(2023)03-0261-08吴永全,钢铁冶金专业工学博士,上海大学材料科学与工程学院教授、博士生导师。
主要从事高温冶金熔体(包括熔渣和金属熔体)和固体材料微观结构及其与宏观物性之间关系的基础理论研究,尤其是计算机模拟和光谱理论和实验方面的研究。
主持国家自然科学基金项目6项、教育部及上海市科委基金项目6项、宝钢集团横向课题8项,主要参与973等国家重点项目5项。
出版中文学术专著2部:《冶金/陶瓷/地质熔体离子簇理论研究》(科学出版社,2007年)和《熔融金属物理初步》(冶金工业出版社,2012年)。
出版英文学术专著1部:“A study of Ion ClusterTheory of Molten Silicates and Some Inorganic Substances”(Trans Tech PublicationsInc, Switzerland, UK, USA, 2009)。
在Physical Chemistry Chemical Physics, ScriptaMaterialia, Applied Surface Science, The Journal of Chemical Physics,Journal of Raman Spectroscopy, Journal of Alloys and Compounds, Chemical Physics Letters,Modelling and Simulation in Materials Science and Engineering, Journal of Molecular Modeling, Computational Materials Science, Journal of Crystal Growth, Chinese Physical Letters, Steel Research International,《物理化学学报》《物理学报》《金属学报》等期刊及国内外学术会议论文集上发表论文80余篇,其中SCI收录50余篇,SCI总引频次数700多次、他引500多次。
Engineering 3 (2017) 675–684ResearchAdditive Manufacturing—ArticleA Multiscale Understanding of the Thermodynamic and Kinetic Mechanisms of Laser Additive ManufacturingDongdong Gu a ,b ,*, Chenglong Ma a ,b , Mujian Xia a ,b , Donghua Dai a ,b , Qimin Shi a ,ba College of Material Science and Technology, Nanjing University of Aeronautics and Astronautics, Nanjing 210016, ChinabInstitute of Additive Manufacturing (3D Printing), Nanjing University of Aeronautics and Astronautics, Nanjing 210016, Chinaa r t i c l e i n f oa b s t r a c tArticle history:Received 26 March 2017Revised 15 July 2017Accepted 28 August 2017Available online 25 October 2017Selective laser melting (SLM) additive manufacturing (AM) technology has become an important option for the precise manufacturing of complex-shaped metallic parts with high performance. The SLM AM process involves complicated physicochemical phenomena, thermodynamic behavior, and phase transformation as a high-energy laser beam melts loose powder particles. This paper provides multiscale modeling and coordinated control for the SLM of metallic materials including an aluminum (Al)-based alloy (AlSi10Mg), a nickel (Ni)-based super-alloy (Inconel 718), and ceramic particle-reinforced Al-based and Ni-based compos-ites. The migration and distribution mechanisms of aluminium nitride (AlN) particles in SLM-processed Al-based nanocomposites and the in situ formation of a gradient interface between the reinforcement and the matrix in SLM-processed tungsten carbide (WC)/Inconel 718 composites were studied in the microscale. The laser absorption and melting/densification behaviors of AlSi10Mg and Inconel 718 alloy powder were dis-closed in the mesoscale. Finally, the stress development during line-by-line localized laser scanning and the parameter-dependent control methods for the deformation of SLM-processed composites were proposed in the macroscale. Multiscale numerical simulation and experimental verification methods are beneficial in monitoring the complicated powder-laser interaction, heat and mass transfer behavior, and microstructural and mechanical properties development during the SLM AM process.© 2017 THE AUTHORS. Published by Elsevier LTD on behalf of the Chinese Academy of Engineering andHigher Education Press Limited Company. This is an open access article under the CC BY-NC-NDlicense (/licenses/by-nc-nd/4.0/).Keywords:Additive manufacturing Selective laser melting Multiscale modeling Thermodynamics Kinetics1. IntroductionAdditive manufacturing (AM), also widely referred to as three- dimensional (3D) printing (3DP) technology, is based on the philoso-phy of near-net shaping and freeform fabrication [1–3]. Laser-based AM/3DP technologies, including powder-bed-based selective laser melting (SLM) and powder-feeding-based laser metal deposition (LMD), have been widely applied to manufacture complex-shaped structural/functional metallic parts such as aerospace and gas tur-bine components [4], biomedical implant components [5], and molds and tools [6]. Due to its application of a fine-focused laser beam and a thin powder layer thickness, SLM is one of the most prevailing AM/3DP technologies and demonstrates a high capability to produce parts with elaborate structures including thin walls, fine features, and small internal channels. With its combination of direct rapid production and high-precision manufacturing characteristics, SLM has received considerable research and application interest around the world [7,8].Nevertheless, SLM processing of metallic parts involves compli-cated heat, mass, and momentum transfer within a laser-induced molten pool, resulting in a significant challenge for the fabrication of high-performance SLM-processed components [9–11]. Strict quality-control measures are therefore required in order to ensure the processability, integrity, and performance of SLM-processed components; such measures rely on advanced characterization methods and on a large quantity of processing experiments [12–14]. Matthews et al. [15] disclosed the melt track progression and pow-der movement under the influence of the hot vapor Bernoulli effect* Corresponding author.E-mail address: dongdonggu@/10.1016/J.ENG.2017.05.0112095-8099/© 2017 THE AUTHORS. Published by Elsevier LTD on behalf of the Chinese Academy of Engineering and Higher Education Press Limited Company.This is an open access article under the CC BY-NC-ND license (/licenses/by-nc-nd/4.0/).Contents lists available at ScienceDirectj our na l h om epa ge: w w /locate/engEngineering676 D. Gu et al. / Engineering 3 (2017) 675–684by high-speed imaging, thus providing a process control method to control the powder-laser interaction and the resultant melting behavior of the powder. Zhou et al. [16] achieved accurate 3D im-ages of defects inside SLM-fabricated cobalt-chromium-molybde-num (Co-Cr-Mo) samples by using synchrotron radiation micro- computed tomography (CT) imaging, thus expanding the current understanding of the formation mechanisms of metallurgical de-fects. Zaeh and Branner [17] developed a specific method to evaluate and quantify the residual stresses and deformation due to the tem-perature gradient mechanism during SLM of tool steel, using finite element (FE) analysis. In order to evaluate structural effects and simultaneously validate a simulation, an analysis of residual stresses based on neutron diffractometry was presented. The monitoring of thermodynamics, kinetics, and thermal stress history during the laser-based AM/3DP process plays an important role in obtaining a tailored process and performance control for layer-by-layer additive manufactured parts. However, as the molten pool during the current SLM process is small and moves quickly on the powder bed, it is difficult to study and monitor the real-time configuration and met-allurgical behavior of the molten pool accurately using experimental measures.In recent years, computational numerical modeling has experi-enced explosive development as an important tool to deeply under-stand the underlying physical metallurgical mechanisms during the SLM process for the purpose of quality control [18–20]. In contrast to the computational technologies that have been developed from advanced laser-based welding models, the SLM AM/3DP process in-volves more complicated physicochemical phenomena (e.g., metal vaporization), thermodynamic behavior, and phase transformation as a high-energy laser beam interacts with loose powder particles. SLM of metals typically involves multiscale coordinated control principles, including microstructure development during SLM processing (the microscale), the laser absorption and melting behavior of powder particles (the mesoscale), and the stress and deformation of SLM- processed structures (the macroscale). In this paper, we provide mul-tiscale modeling and corresponding experimental verification of the SLM processing of metals, alloys, and metal matrix composites, based on a series of previously studied materials in our group, including an aluminum (Al)-based alloy (AlSi10Mg), a nickel (Ni)-based super-alloy (Inconel 718), and ceramic particle-reinforced Al-based and Ni-based composites. The development of multiscale computational numerical simulation and experimental verification methods is beneficial in understanding and monitoring the complicated powder-laser inter-action, heat and mass transfer behavior, and development of micro-structural and mechanical properties during the SLM AM process.2. Mesoscale understanding of powder-laser interaction and melting thermodynamic behavior of alloys2.1. Laser-melting thermodynamics and balling effect control of Al-alloy powderComputational modeling can provide an important tool for bet-ter understanding physical metallurgical phenomena (e.g., melting, evaporation, and solidification) during the SLM of metallic powder, and can act as a precursor when tailoring experimental procedures. However, previously developed modeling has relied on a number of assumptions and thermodynamic behaviors associated with SLM (e.g., balling, porosity) that were impossible to investigate and understand. Fortunately, mesoscale modeling and simulation have recently been considered as a new, highly flexible method of accu-rately investigating the thermodynamics of the molten pool, based on the powder scale, by eliminating a majority of the physical as-sumptions that are prevalent in the previous literature [21,22].Al-alloys are typically difficult-to-process metals for laser-based AM/3DP, due to the special physical properties of Al, including the considerably low absorptivity of Al to lasers, the high affinity of Al melt to oxygen, and the resultant formation of balling defects during SLM. For the SLM processing of AlSi10Mg Al-alloy powder, a novel mesoscale powder-bed model with the dimensions of 400 μm× 300 μm × 60 μm was established, consisting of randomly packed powder particles, as shown in Fig. 1(a). The powder bed consisted of two phases: The first phase comprised randomly packed metallic powder, and the second phase (i.e., the residual regions within the powder bed) was filled with protecting argon gas. To study the ther-mal melt flow within the molten pool during SLM, the effects of re-coil pressure, the Marangoni effect, and evaporative surface cooling were considered. The improved volume of fluid (VOF) methodology was used to solve the coupling effect of the Navier-Stokes equation, energy conservation equation, continuity equation, and VOF equa-tion, and to trace the evolution of the liquid/gas free interface. The SLM apparatus was independently developed, and mainly consisted of a ytterbium fiber laser with a maximum laser power of 500 W, a spot size of ~70 μm, and a wavelength of (1070 ± 10) nm; an auto-matic powder deposition device; an inert argon gas protection sys-tem; and a process control system. All the verified experiments were conducted using the same apparatus. At a relatively low laser energy density caused by a low laser power and a high scanning speed, the sharply variable temperature distribution and surface tension tended to significantly enhance the capillary instability effect within the molten pool (Fig. 1(b)). The molten liquid under the localized laser beam irradiation thus collected and shrank in the neighboring areas, due to the significant melt flow within the pool (Fig. 1(c)), thereby forming small individual balls after solidification. The ball-ing phenomenon eventually occurred on irregularly shaped tracks at a higher scan speed (Fig. 1(d)) due to excessive shrinkage of the liquid track in both the transverse and radial directions, which was normally termed as “shrinkage-induced balling” [23]. In contrast, when a relatively high laser energy density with a high laser power and a low scanning speed was used, the resultant high operating temperature tended to decrease the surface tension of the molten liquid, thus accelerating the liquid to efficiently spread in neigh-boring areas (Fig. 1(e)). The molten pool was accordingly presented with a stable configuration, free of any evident defects (Fig. 1(e) and Fig. 1(f)), leading to the formation of a regularly shaped track with-out significant occurrence of the balling effect (Fig. 1(g)). In general, considerable balling of the Al-alloy powder occurred up to an appro-priate size of 183.5 μm under a relative energy density of 125 J·m–1; it was subsequently reduced significantly as the applied energy den-sity increased, and finally disappeared at a considerably high energy density of 416.6 J·m–1. Therefore, it is reasonable to conclude that the laser processing parameters play a crucial role in controlling the balling effect and surface smoothness during the SLM processing of Al-alloy powder.2.2. Porosity formation mechanism and SLM densification behavior of Ni-alloy powderA mesoscale simulation, which is typically in the particle-size scale, provides an opportunity to enhance the laser processability (e.g., high densification level, smooth surface quality), which sig-nificantly influences the final performance of SLM-processed com-posites. The SLM AM/3DP of Inconel 718, which is well known as a promising candidate material for various industrial applications, such as aircraft turbine engines, high-speed airframe parts, and high-temperature bolts for nuclear engineering [24,25], generally requires excellent surface integrity and mechanical performance, and can be realized with the aid of a mesoscale simulation. For SLM at a relatively low laser power, a limited amount of energy penetrated into the powder bed and a low operating temperature677D. Gu et al. / Engineering 3 (2017) 675–684etc.) were observed at that time in the neighboring tracks (Fig. 2(g)). According to the results, under the activity of a relatively low power of 90 W, a considerable amount of irregularly shaped porosity with a maximum size of 275.2 μm formed within the neighboring tracks, where limited mass and heat transfer occurred. When the applied power was increased, less porosity exhibiting with the dimension of several microns was generated and was randomly distributed over the surface. Therefore, high-quality Inconel 718 parts with a high surface integrity and densification response are achievable by SLM using reasonable laser processing parameters that can be optimally determined using mesoscale simulation and analysis.3. Microscale analysis of microstructural development during the SLM of metal matrix composites3.1. Migration behavior of reinforcing particles within the molten pool during the SLM of Al-matrix nanocompositesCeramic particle-reinforced aluminum matrix composites (AMCs), which are one category of high-performance lightweightwas correspondingly generated, resulting in the formation of small molten pools with obvious residual porosity between neighboring pools (Fig. 2(a)). Moreover, the low temperature gradient within the molten pool normally decreased the surface tension of the liq-uid, which was the primary driving force for the flow of the melt. Under these conditions, the convection within the pool decreased remarkably and, simultaneously, the migration of the melt between the current track and the neighboring solidified track was weak-ened. As a result, porosity was presented distinctly, both on the cross-section and on the top surface of the SLM-processed compos-ites (Fig. 2(b) and Fig. 2(c)). Conversely, the molten pool exhibited a larger size and was accompanied by a longer liquid lifetime when the applied laser power was increased, due to the considerable laser energy input. The cross-section and top surface of the SLM- processed composites appeared to have a high quality and were free of any obvious defects, due to the intensified convection within the pool and sufficient migration of the melt between the neighboring tracks under the action of a high laser power (Fig. 2(d)–Fig. 2(f)). Moreover, the microstructure surrounding the tracks presentedcellular morphology, and no evident defects (e.g., porosity, cracks,Fig. 1. Thermodynamic behavior of Al-alloy powder during SLM process based on mesoscale analysis. (a) Physical model and scanning strategy used in simulation and experiment;(b) the temperature counters (150 W, 1200 mm·s –1); (c) the velocity counters within the molten pool (150 W, 1200 mm·s –1); (d) the surface morphology of as-built track (150 W,1200 mm·s –1); (e) the temperature counters (250 W, 600 mm·s –1); (f) the velocity counters within the molten pool (250 W, 600 mm·s –1); (g) the surface morphology of as-built track (250 W, 600 mm·s –1).678 D. Gu et al. / Engineering 3 (2017) 675–684materials, are widely used in aerospace, aircraft, and automotive ap-plications because of their excellent properties, such as high specific stiffness, high specific strength, and excellent wear resistance [26]. Nevertheless, due to the incorporation of hard and brittle ceramic particles with a limited wettability within the Al matrix, simultane-ous enhancement of the strength and ductility of AMCs is difficult to achieve. Recent research efforts have revealed that mechanical properties of the AMCs are significantly affected by the particle size of the reinforcement and by the preparation of Al-based nanocom-posites; decreasing the size of the ceramic particles to the nano-meter level will hopefully lead to a comprehensive improvement of the mechanical properties of AMCs [27]. During the laser-based AM/3DP of nanoparticle-reinforced AMCs, the interaction of the reinforcing particles and the melt within the molten pool play a key role in determining the microstructure evolution of laser-processed composites. Due to the remarkable difference in physical properties between the metal matrix and the reinforcing particles, the particles tend to be pushed by the liquid-solid interface during the laser rapid solidification process, resulting in a non-uniform distribution of re-inforcement and in subsequent heterogeneous microstructural and mechanical properties of laser-processed composites. In this section, a 3D transient computational fluid dynamics model is established in order to investigate the influence of processing parameters on the thermal evolution, fluid dynamics, and pressure distribution in the vicinity of the reinforcing particles during the SLM of aluminium nitride (AlN)/AlSi10Mg nanocomposites. The solid-melt coupling mechanism and temperature-dependent thermal physical properties of as-used materials are considered in the numerical model by ap-plying the Gaussian distributed volumetric heat source. The migra-tion behavior of the reinforcing particles within the molten pool is disclosed, in order to achieve a regular distribution of reinforcement in laser-processed AMCs.Fig. 3 reveals that the melt flow velocity vector near the rein-forcement in the melted matrix is highly sensitive to the SLM pro-cessing parameters. The surface tension of the Al melt is negatively positive to the operating temperature, meaning that the higher the operating temperature of the irradiation region, the greater the response of the lower surface tension of the Al melt. The thermo-dynamics and transportation of the AlN reinforcing particles are highly dependent on the melt velocity and operating temperature of the molten pool; the equation of motion and heat transforma-tion is expressed in Ref. [11]. For the AlN/AlSi10Mg composites, the coefficients of the heat conductivity of AlN and AlSi10Mg were ~285 W·(m·K)–1 and ~90 W·(m·K)–1, respectively, when the operating temperature was above 1000 K. The ratio of the divided thermal conductivities of the reinforcement and metal matrix was equal to 0.3 and, as a result, a concave pattern of the melt convection was generally generated in the neighboring region of the reinforcement. The velocity of the melt convection tended to be significantly en-hanced as the melt flowed through the reinforcement (Fig. 3(a) and Fig. 3(b)). Meanwhile, a convection vortex located on one side of the reinforcement was produced as the maximum velocity reached 1.8 m·s–1 for a laser energy density of 830 J·mm–3 (Fig. 3(c)). As the applied laser energy density further increased to 1000 J·mm–3, a convection vortex with an average velocity of 1.2 m·s–1 apparent-ly formed in a symmetrical pattern near the reinforcing particlesFig. 2. Tailoring laser processability of Inconel 718 by mesoscale analysis. (a) The temperature counters (90 W, 400 mm·s–1); (b) the cross-sectional quality of as-built layer (90 W, 400 mm·s–1); (c) the top surface morphology of as-built track (90 W, 400 mm·s–1); (d) the temperature counters (120 W, 400 mm·s–1); (e) the cross-sectional quality of as-built layer (120 W, 400 mm·s–1); (f) the top surface morphology of as-built track (120 W, 400 mm·s–1); (g) the high-magnitude microstructure morphology of top surface of as-built tracks (120 W, 400 mm·s–1).679D. Gu et al. / Engineering 3 (2017) 675–684(Fig. 3(d)). The convection vortex played a crucial role in the pres-sure distribution and attendant pressure difference near the rein-forcing particles, giving rise to the force acting on the reinforcing particles and the rearrangement of particles. As the applied laser energy density was relatively limited (e.g., η = 550 J·mm –3), the pressure was comparatively uniformly distributed around the re-inforcing particles (Fig. 4(a)), and the rearrangement behavior ofthe reinforcing particles was driven by the combined effect of theFig. 3. Characteristics of velocity vector obtained around AlN reinforcing particles using various SLM processing parameters. (a) Laser power P = 100 W, laser energy densityη = 550 J·mm –3; (b) P = 130 W, η = 660 J·mm –3; (c) P = 150 W, η = 830 J·mm –3; (d) P = 180 W, η = 1000 J·mm –3.Fig. 4. (a), (c) Pressure distribution in the neighboring region of AlN reinforcing particles and (b), (d) the corresponding distribution state of AlN reinforcing particles within the solidified matrix. (a), (b) Laser power P = 100 W, laser energy density η = 550 J·mm –3; (c), (d) P = 180 W, η = 1000 J·mm –3.680 D. Gu et al. / Engineering 3 (2017) 675–684melt convection, capillary force, and gravity force. Therefore, the reinforcing particles have a tendency to be distributed in a random pattern in the solidified matrix (Fig. 4(b)). In contrast, for a high laser energy density of 1000 J·mm –3, the AlN reinforcing particles, driven by the convection vortex and by the forces derived from the pressure difference, tended to migrate in a nearly circular motion, compelled by the centripetal force, F 1 (Fig. 4(c)). As a result, a novel regular distribution of the AlN reinforcing particles in a ring-like shape was obtained within the finally solidified composites (Fig. 4(d)). There-fore, the microscale simulation and understanding of the migration and distribution behavior of reinforcing particles within the laser- induced molten pool are regarded as an efficient way of tailoring the laser processing parameters and realizing a regular distribution of reinforcement in laser-based AM/3DP composite parts.3.2. Microscale heat transfer behavior of the gradient interface during the SLM of particle-reinforced Ni-based compositesThe incorporation of ceramic reinforcing particles into Inconel 718 is an efficient method of improving its high-temperature me-chanical performance. However, due to the limited wettability between ceramics and metals and the significant difference in coef-ficients of thermal expansion, interfacial residual stress and micro- cracks are prone to present themselves. To solve this problem, the gradient interface is tailored between the ceramic reinforcement and the matrix via control of the laser processing parameters and of the in situ chemical reaction along the reinforcing particle/matrix interface. The interfacial residual stress, interfacial micropores, and micro-cracks can be controlled and eliminated, hopefully increasing the strength and ductility of laser-formed composites by means of interfacial strengthening.In order to quantitatively investigate the forming mechanism of the gradient interface within tungsten carbide (WC)/Inconel 718 composites, a 3D numerical model was established [28] that focused on the local thermal performance around the WC reinforcement. Due to the relatively weak capacity of heat transmission of WC in a high-temperature area, the isotherm curves through the reinforc-ing particle were more intensive than those of the matrix, and the heat flow from the top surface was blocked significantly by the WC particles (Fig. 5(a) and Fig. 5(b)). As a result, annular heat flow was generated around the reinforcing particle and the temperature gra-dient formed in a radiative fashion from the particle to the matrix (Fig. 5(b)). This accordingly led to the development of a number of dendrites arranged in a radiative fashion around the WC particles (Fig. 5(c)). Furthermore, the formation of an in situ gradient inter-face between the reinforcing particles and the matrix was clearly observable (Fig. 5(d)). The reinforcing particles had spherical mor-phology and the corners of the particles melted during SLM process-ing, which was attributed to the local heat accumulation of the WC particles (Fig. 5(b)). A gradient interface with a mean thickness of 0.26 μm formed between the WC particles and the matrix (Fig. 5(d)), preventing the formation of interfacial micro-cracks or micropores. In order to study the chemical composition of the in situ gradient in-terface, an energy dispersive X-ray (EDX) spectroscope analysis was performed at Point A in Fig. 5(d), showing that 73.49 atom% carbon (C) and 11.67 atom% tungsten (W) from the WC particles and 6.66 atom% Ni, 4.81 atom% Cr, and 3.37 atom% iron (Fe) from the Inconel 718 matrix were detected in the gradient interface. The atomic ratio of C and metallic elements was close to 3:1 (73.49 atom% vs. 26.51 atom%). Therefore, it was reasonable to conclude that there was an in situ chemical reaction between the reinforcing particles and the matrix, producing a gradient interface with (W, M)C 3 (M = Ni, Cr, Fe) carbide. It was believed that the annular heat flow and radiated temperature gradient around the particle played a key role in pro-moting the in situ interfacial reaction within the molten pool during the SLM of WC/Inconel 718 composites.Fig. 6(a) and Fig. 6(b) further illustrate the temperature, tempera-ture gradient, and cooling rate at the interface between the reinforc-Fig. 5. Numerical simulation results showing the (a) temperature field and (b) heat flow around the reinforcing particle (the bottom-left illustration in Fig. 5(b) showing local heat accumulation of particle); scanning electron microscope (SEM) images showing microstructure of (c) a radiative fashion around the WC particles and (d) tailored gradient inter-face of SLM-processed WC/Inconel 718 composites at laser power P = 125 W and scanning speed v = 100 mm·s –1.681D. Gu et al. / Engineering 3 (2017) 675–684ing particles and the matrix. A relatively high temperature gradient of 6 × 10³ °C·mm –1 and a rapid-transition cooling rate of 9.26% were found at the interface. The formation of the gradient interface sig-nificantly reduced the tendency of crack and pore formation and improved the bonding coherence at the interface. EDX line-scanning results showed the metallic element distribution along the arrow in Fig. 6(c). It was apparent that from the matrix to the particle, the content of the W element increased, while the contents of the Ni, Cr, and Fe elements decreased. This decreasing tendency was most apparent at the interface (Fig. 6(d)). Fig. 6(e) describes the forma-tion mechanism of the tailored gradient interface in SLM-processed WC/Inconel 718 composites. During the SLM process, the WC and Inconel 718 powder suffered irradiation from the high-energy laser beam, which produced a mobile molten pool (with a width of 112.0 μm and a depth of 68.5 μm, as shown in Fig. 5(a)). Under the impact of local heat accumulation, the WC particles underwent a localized surface melting due to a relatively high melting point, and some W and C atoms were released from the surface into the molten pool (Fig. 5(b)). The Inconel 718 powder melted completely because of its lower melting point, causing the Ni, Cr, and Fe atoms to diffuse into the molten pool. Both the released C and metallic atoms and the laser energy provided the material and energy con-ditions for the formation of a gradient interface. With the rapid migration of the high-energy laser beam, a very large undercooling promoted the nucleation and growth of the (W, M)C 3 (M = Ni, Cr, Fe) carbide to form the gradient interface, especially under the impact of local heat accumulation and the intense temperature gradient of6 × 103 °C·mm –1at the interface. Therefore, the tailored formation of a novel gradient interface between the reinforcing particles and the matrix depends on a microscale understanding of the heat transfer behavior within the molten pool and on the dedicated control of material combinations and laser-based AM/3DP processing param-eters. On the other hand, the applied laser power played an impor-tant role in determining the mean thickness of the gradient inter-face that was tailored between the WC particles and the Inconel 718matrix. With the increase of applied laser power, more energy wasFig. 6. (a) Temperature and temperature gradient and (b) cooling rate at the interface between the reinforcing particles and the matrix; (c) and (d) EDX line-scanning results showing the metallic element distribution in SLM-processed WC/Inconel 718 composites; (e) the formation mechanism of the tailored gradient interface in SLM-processed WC/Inconel 718 composites; (f) typical X-ray diffraction (XRD) patterns of the primary powder and the SLM-processed WC/Inconel 718 composites obtained in a small range of2θ = 42°–45°.。
中图分类号:V211.3 论文编号:1028701 18-B061 学科分类号:080103博士学位论文叶轮机械非定常流动及气动弹性计算研究生姓名周迪学科、专业流体力学研究方向气动弹性力学指导教师陆志良教授南京航空航天大学研究生院航空宇航学院二О一八年十月Nanjing University of Aeronautics and AstronauticsThe Graduate SchoolCollege of Aerospace EngineeringNumerical investigations of unsteady aerodynamics and aeroelasticity ofturbomachinesA Thesis inFluid MechanicsbyZhou DiAdvised byProf. Lu ZhiliangSubmitted in Partial Fulfillmentof the Requirementsfor the Degree ofDoctor of PhilosophyOctober, 2018南京航空航天大学博士学位论文摘要气动弹性问题是影响叶轮机械特别是航空发动机性能和安全的一个重要因素。
作为一个交叉学科,叶轮机械气动弹性力学涉及与叶片变形和振动相关联的定常/非定常流动特性、颤振机理以及各种气弹现象的数学模型等的研究。
本文基于计算流体力学(CFD)技术自主建立了一个适用于叶轮机械定常/非定常流动、静气动弹性和颤振问题的综合计算分析平台,并针对多种气动弹性问题进行了数值模拟研究。
主要研究内容和学术贡献如下:由于叶轮机械气动弹性与内流空气动力特性密切相关,真实模拟其内部流场是研究的重点之一。
基于数值求解旋转坐标系下的雷诺平均N–S(RANS)方程,首先构造了适合于旋转机械流动的CFD模拟方法。
特别的,针对叶片振动引起的非定常流动问题,采用动网格方法进行模拟,通过一种高效的RBF–TFI方法实现网格动态变形;针对动静叶排干扰引起的非定常流动问题,采用一种叶片约化模拟方法,通过一种基于通量形式的交界面参数传递方法实现转静子通道之间流场信息的交换。
Numerical studies on the inter-particle breakage of a confined particle assembly in rock crushingH.Y.Liu *,S.Q.Kou,P.-A.LindqvistDepartment of Civil and Environmental Engineering,Lulea˚University of Technology,SE-97187Lulea ˚,Sweden Received 9June 2003;received in revised form 17August 2004AbstractUnderstanding rock crushing mechanisms may provide an efficient key to better fragmentation efficiency.In thispaper,firstly the fracture processes of a rock specimen under uniaxial and triaxial compressions are simulated using the rock and tool interaction (R–T 2D )code and compared with the results from experimental observations in litera-tures.It is found that,with increasing confinement,the fracture process is more progressive and the failure mechanism gradually changes from axial splitting to shear fracture.Then the inter-particle breakage process in a particle bed under confined conditions is numerically investigated from a mechanics point of view.The results show that when the particle breaks depends on the strength criterion,how it is broken depends on the stress distribution and redistribution,and where it is broken depends on the heterogeneous distribution in the particle.It is found that,irrespective of the particle shape or particle bed arrangement,the fragmentation starts from the particles which are loaded in quasi-uniaxial com-pression.The resulting fragmentation is usually axial splitting between the two highest stressed loading points.After that,the particles which are loaded at first in quasi-triaxial compression,because of the confinement from the neigh-bouring particles,the loading plate or the container wall,fail progressively.Depending on the location of the loading points,small fragments are torn offat the loading points with a large piece preserved.In the final stage,the local crush-ing at the highest stressed contact points becomes an important failure mechanism.Through this study,it is concluded that the R–T 2D code can capture the features of the inter-particle breakage process,and a better qualitative understand-ing of the physics and mechanics of deformation and breakage is gained.Ó2004Elsevier Ltd.All rights reserved.Keywords:Particle breakage;Numerical study;Rock crushing;Fracture;Fragmentation;Uniaxial compression;Triaxial compression1.IntroductionIn mining and in the production of ballast materials and pavement aggregates,mechanical0167-6636/$-see front matter Ó2004Elsevier Ltd.All rights reserved.doi:10.1016/j.mechmat.2004.10.002*Corresponding author.Tel.:+46920491440;fax:+46920491935.E-mail address:hong-yuan.liu@ce.luth.se (H.Y.Liu).Mechanics of Materials 37(2005)935–954crushing is a method widely used to liberate valu-able minerals from ores or to reduce the particle size of rock materials.However,it is energetically very expensive,with a cost close to2%of the world energy production(Tsoungui et al.,1999).Facing this cost,understanding the crushing mechanisms inside rock particles under compression may pro-vide an effective key to better fragmentation efficiency.On the basis of previous research(Evertsson and Bearman,1997;Tang et al.,2001;Kou et al.,2001),two breakage modes have been iden-tified in mechanical crushing:single-particle and inter-particle breakage.Single-particle breakage occurs when the distance between the chamber walls is equal to or smaller than the particle size, which is relatively simple.Inter-particle breakage occurs when a particle has contact points shared with other surrounding particles,and this is be-lieved to be an important breakage mode in mechanical crushing.It is obvious that the inter-particle breakage process is very complex.To facil-itate an in-depth study of this process,theoretical models have been developed.An ideal particle bed model is characterized by Scho¨nert(1996)as follows:(1)it possesses a homogeneous structure(stochastic homogeneity);(2)homogeneous compaction is possible;(3)the volume or mass of the stressed particles is known; and(4)the wall effect is negligible in respect of the overall size-reduction effect.Previously,the ideal particle bed model was widely used for fundamen-tal research on inter-particle breakage and to deli-ver basic information for comminution(Scho¨nert, 1996;Fandrich et al.,1997).In those researches, comminution within the particle bed is character-ized by the breakage probability and the breakage function.The breakage probability is defined as the mass fraction of the progeny smaller than the lower bound of the initial size fraction,and the breakage function describes the particle size distri-bution of the broken progeny.However,most of those researches have not been carried out from the mechanics point of view.It is desirable that, from a mechanics point of view,models developed for understanding the inter-particle breakage mechanisms should take into account the growth and interaction of microcracks,which culminate in the formation of progeny particles under typical loading conditions.This will require the consider-ation of the material properties,particle shape and particle size.With such complex requirements,for many years it has been thought that a general the-oretical approach from a mechanics point of view for calculating the stressing intensity,breakage probability and breakage function seems to be al-most impossible,or at least very difficult(Liu and Scho¨nert,1996).During the past few years,with the rapid devel-opment of computing power,interactive computer graphics and topological data structure,the use of computer simulations seems to be the appropriate tool to obtain some clarifications of the inter-par-ticle breakage process.Most of the numerical models developed to investigate the inter-particle problems inside particle packings from a mechan-ics point of view(Cundall and Strack,1979; Ghaboussi and Barbosa,1990;Rothenburg and Bathurst,1992)are based on the granular material model.In these numerical simulations,the parti-cles are assumed to be completely rigid,and the overall deformation is caused only by relative dis-placements at the contact points(Satake,1992). However,it is not adequate to use the rigid gran-ular material model to study the particle break-age problem in crushing,in which the process of particle breakage is involved.Recently,a granular material model based on the molecular dynamics method with elastic interactions between grains has been implemented by Tsoungui et al.(1999) into a two-dimensional computer simulation code to study the crushing mechanisms of grains inside a granular material under diametric compression. Compared with the previous granular material models,a big step forward has been made,since the model has defined well the breakage conditions of a single grain subjected to multiple loads from neighbouring grains and the grains are represented by elastic disks.However,in their model,when a particle fulfils the fracture criterion,it is replaced with a set of twelve smaller disks of four different sizes,and the particle breakage is not based on mechanical principles.More recently,Kou et al. (2001)used the RFPA(rock failure process analy-sis)model(Tang,1997)to investigate the inter-particle breakage process of a particle assembly936H.Y.Liu et al./Mechanics of Materials37(2005)935–954in a container.However,since the post-failure pro-cess is not related to confining conditions,they have difficulty in modelling the confinement from the neighbouring particles and the chamber walls after some particles fail.The present paper is a con-tinued development of Kou et al.Õs(2001)research and will mainly concentrate on the inter-particle breakage process under confined compression in mechanical crushing.In the present paper,firstly the fracture process of a rock specimen under uniaxial and triaxial con-ditions is simulated to investigate the influence of confinement on the fracture process and compared with the experimental studies conducted by Horii and Nemat-Nasser(1985).Then the inter-particle breakage process under confined conditions in mechanical crushing is numerically investigated and is discussed in terms of the two loading geo-metries:quasi-uniaxial compression and quasi-tri-axial compression.The work presented herein forms part of an on-going investigation into the fundamental aspects of rock breakage,in order to improve the design of rock fragmentation equipment from the mechanics point of view.2.Rock and tool interaction code(R–T2D)In order to improve the understanding of rock behaviour under mechanical tools and then opti-mise the design of fragmentation equipment,the rock and tool interaction(R–T2D)code has been developed on the basis of the rock failure process analysis(RFPA)model(Tang,1997)and thefinite element method(FEM).The main contents of the R–T2D code include the heterogeneous material model(Liu et al.,2002),the Mohr–Coulomb or the double elliptic strength criterion(Liu et al., 2002)and the mesoscopic elemental mechanical model for elastic damage(Liu,2003).Several pub-lished papers(Tang,1997;Tang et al.,2000;Liu et al.,2002;Liu,2003)have introduced the RFPA model and the R–T2D code in detail.Herein just a brief description is given.In the R–T2D code,the numerical simulation model is constructed on the basis of the heteroge-neous material model with a homogeneous index (m)and elemental seed parameters(the compres-sive strength r0,the elastic modulus E0,etc.). Thefinite element method is used to compute the stress and deformation in each element of the built numerical model.The Mohr–Coulomb or the dou-ble elliptic strength criterion is used to examine whether or not the elements undergo a phase tran-sition.In the loading process,an external load is slowly applied on the constructed numerical model step by step.When in a certain step the stresses in some elements satisfy the strength criterion,the elements are damaged and become weak according to the rules specified by the mesoscopic elemental mechanical model for elastic damage(Liu,2003). The stress and deformation distributions through-out the model are then adjusted instantaneously after each rupture to reach the equilibrium state. At positions with an increased stress due to stress redistribution,the stress may exceed the critical value and further ruptures may be caused.The process is repeated until no failure elements are present.The external load is then increased fur-ther.In this way the system develops a macro-scopic fracture.Thus the code links the mesoscopic mechanical model to the continuum damage model and ultimately to the macrostruc-ture failure(Liu et al.,2002).Energy is stored in the element during the loading process and is re-leased as elastic strain energy through the onset of elemental failure.3.Fracture process of a rock specimen under uniaxial and triaxial compressionBrittle materials are comminuted with grinding media mills and roller mills,in which a particle or a particle assemblage is stressed between two hard surfaces approaching each other.Traditionally, the breakage of material in crushing is regarded as relying upon single-particle breakage without considering the confinement condition.However, the breakage behaviour of a single-particle without confinement cannot adequately represent the ef-fects of stressing a large number of particles,which induces much more complicated loading condi-tions for particle surfaces.For this reason,con-fined conditions are required in simulating particle breakage for the understanding of theH.Y.Liu et al./Mechanics of Materials37(2005)935–954937inter-particle breakage behaviour.In this paper,firstly the fracture of a heterogeneous rock speci-men under uniaxial and triaxial conditions is explored to investigate the influence of confine-ment on the fracture process and compared with the experimental studies conducted by Horii and Nemat-Nasser (1985).The reason for using a triax-ial test instead of using a single-particle breakage test is that the triaxial test is better documented than the single-particle breakage test on the basis of laboratory experiments.Accordingly,the in-ter-particle fragmentation process of particles subjected to multiple loads from neighbouring par-ticles or machine walls in a rock assembly will be investigated in Section 4.In the numerical simulation,the triaxial test is simplified as a plane stress problem and a vertical section of the cylindrical sample is considered.The numerical model is constructed following the heterogeneous material model (Liu et al.,2002)with the homogeneous index m =2,which is one of the typical values for the heterogeneous rock.During the loading process,an axial loading dis-placement increment (0.005mm/step)is applied on the loading platens and confining pressures of 0and 20MPa are applied on both lateral sides.Fig.1shows the simulated initiation,propaga-tion and coalescence of the fractures in the rock specimen under uniaxial compression.The letters in the figure indicate the different loading levels,which are labelled in Fig.2,where the correspond-ing stress–displacement curve and associated fail-ure event rate are depicted.As shown in Fig.1A,at first there is almost no failure,which corre-sponds to the linear elastic deformation stage (the line before point A in Fig.2).As the axial loading displacement increases,local isolated fail-ures are initiated at a few random sites depending on the heterogeneity of the rock specimen (Fig.1B),which results in the formation of the nonlin-ear deformation stage (curve AB in Fig.2)in the stress–displacement curve.With a small increase in the axial loading displacement after the peak load,the microfractures begin to cluster and be-come clearly localized in Fig.1C,where a macro-scopic crack comes into being.Correspondingly,there is a large stress drop and a big failure event rate (point C in Fig.2).As the loading displace-ment increases,the formed macroscopic crack propagates in a direction sub-parallel to themaxi-Fig.1.Simulated fracture process of a rock specimen under uniaxial compression.938H.Y.Liu et al./Mechanics of Materials 37(2005)935–954mum compressive axis and therefore a fault plane is formed (Fig.1D),which results in a rapid in-crease in the failure events and a further fall in the stress–strain curve (point D in Fig.2).Hence,mode I cracking is the dominant mechanism.The fault plane is prevented from developing when it comes close to the upper end piece,due to the con-trast between the elastic moduli of the sample and the loading platen.Strain energy is then stored again,and another main macroscopic crack begins to grow (Fig.1E)and a stress drop is induced (point E in Fig.2).Finally,the eventual failure of the specimen is induced by a combination of ax-ial splitting and local shearing (Fig.1F),and the stress–displacement curve attains a residual strength (point F in Fig.2).Fig.3shows the simulated fracture process of the specimen under triaxial compression,with the corresponding stress–displacement curve and fail-ure event rate illustrated in Fig.4.The confining pressure is applied on the rock specimen in the first loading step,and correspondingly an axial loading displacement (0.09mm)is applied on the loading platen to achieve a hydrostatic stress state.Again it can be seen that at first there is almost no failure event (Fig.3A)and the stress–displacement curve has a linear profile (the curve before point A in Fig.4).Then the onset of nonlinear deformation (point B in Fig.4)is indicated by the formation of a large number of isolated microfractures (Fig.3B).With the loading displacement increasing,more diffused failed sites develop (Fig.3C)and the stress attains its maximum value (point C inFig.4).As the loading displacement increases,in contrast to the uniaxial compression case,where the failure sites propagate parallel to the major principal stress,more and more individual failure sites tend to develop in the confined condition,and it is only when the diffused failed sites become dense that extensile cracks begin to propagate from failed sites and link with each other (Fig.3D).Correspondingly,the stress–displacement curve descends rapidly,at the same time as the fail-ure event rate reaches a maximum (point D in Fig.4).A subsequent increase in the loading displace-ment enhances the linkage between the failed sites to form a macroscopic shear fracture plane (Fig.3E),and another big stress drop is induced (point E in Fig.4).The shear fracture plane continues to grow,until finally the formation of the macro-scopic through-going shear fracture plane is com-plete and the specimen fails completely ontheFig.3.Simulated fracture process of a rock specimen under triaxial compression (the confining pressure is 20MPa).H.Y.Liu et al./Mechanics of Materials 37(2005)935–954939macroscopic scale with a single shear fracture plane(Fig.3F).Our numerically simulated results are consistent with previous analytical and experimental research (Nemat-Nasser and Horii,1982;Horii and Nemat-Nasser,1985and Horii and Nemat-Nasser,1986), as well as numerical research(Tang et al.,2000; Fang and Harrison,2002)on rock fracture under uniaxial and triaxial compression.Fig.5compares the fracture patterns obtained in uniaxial and con-fined compressions using the R–T2D code and the experimental method(Horii and Nemat-Nasser, 1985).It should be noted that in the numerical simulation,the specimen is heterogeneous.In the experimental observations conducted by Horii and Nemat-Nasser(1985),the specimen is homo-geneous but there are macroscopic defects(hetero-geneities),i.e.the multiple pre-existingflaws.The comparison reveals that the R–T2D code captures the micromechanics of rock failure under uniaxial and triaxial compressions.Under uniaxial com-pression,local failure development is mainly man-ifested by the extension of failed sites in the direction of the major principal stress.In other words,axial splitting in the loading direction is the important failure mode.Under triaxial com-pression,the extension of the failed sites is sup-pressed,but the individual failure sites become dense and link with each other to form a shear plane.Moreover,a comparison between the stress–displacement curves reveals that both the peak strength and residual strength noticeably in-crease in triaxial compression,which means that the specimen under triaxial compression is less prone to failure and fails more progressively than does the unconfined specimen.4.Fragmentation process of a rock particle assembly in a containerThe calculation of the stress distribution inside particles with multiple contact forces and the pre-diction of the inter-particle fracture process in a particle bed have been the biggest challenges in the mechanical crushing industry.So far a limited amount of research has been carried out in the field of numerical analysis of these problems from the mechanics point of view.The fragmentation process of particles subjected to multiple loads from neighbouring particles or machine walls in a rock particle assembly will be investigated in this section.4.1.Numerical modelFandrich et al.(1997)developed the experimen-tal set-up for particle bed breakage shown inFig. parison between the fracture patterns obtained in(a)uniaxial and(b)confined compression using the R–T2D code and the experimental method(Horii and Nemat-Nasser,1985).940H.Y.Liu et al./Mechanics of Materials37(2005)935–9546a to imitate the operating principle of mechanical crushing equipment.The pot contains the sample (1),a cylinder (2),a piston (3)and a base (4),with a plate (5)on top to locate the three LVDTs (6)that are fixed to the cylinder.The entire pot is placed in a loading frame.The load and LVDT signals are logged by data acquisition software running on a PC (7).Evertsson and Bearman (1997)described the sample (1)in more detail to simulate the conditions to which a volume of material is subjected in a real crushing chamber,as shown in Fig.6b.Correspondingly,a similar numerical model,shown in Fig.7a,is constructed to investigate the inter-particle breakage process in a particle assembly.In practice,the shape of the working surface may be plane,cylindrical or spherical.Any combinations of these shapes are possible for investigating a particular configura-tion in a mill.Fundamental studies on the break-age behaviour should preferably use two parallel plane surfaces (Scho ¨nert,1996).Therefore,a par-allel plane surface is used in Fig.7a.The numerical test corresponds to the compressing part of the machine cycle of the crusher,when the linersmoveFig.7.Numerical model and quasi-photoelastic stress fringe pattern:(a)numerical model for a crushing chamber containing 27rock particles with the polydispersed size and (b)quasi-photoelastic stress fringe pattern in a crushingchamber.Fig.6.The principle of mechanical crushing:(a)Schematic diagram of the experimental set-up for particle bed breakage (Fandrich et al.,1997)and (b)crushing chamber (Evertsson and Bearman,1997).H.Y.Liu et al./Mechanics of Materials 37(2005)935–954941towards each other.The material is then locked between the chamber walls and can only deform elastically or break into smaller particles.Since the maximum radial velocity of the mantle relative to the concave in normal operating conditions is below0.5m/s,it is assumed that the breakage is independent of the strain rate at this level(Kou et al.,2001).In the present work we simply treat the breakage process as quasi-static.The numerical model(Fig.7a)consists of a crushing chamber and27randomly placed rock particles with radii following the Weibull distribu-tion within the chamber,where the individual particles are subjected to an arbitrary set of con-tact forces.The model consists of a steel con-tainer measuring180mm in width and height. The thickness of the container walls is5mm.A steel platen measuring170mm in width is used as a cover on the top for transferring a compres-sive load down to the rock particles from the ver-tical direction.The chamber contains27particles, which are numbered from1to27for convenience in the following discussion.The particle bed is loaded under form conditions with an assumption of plane strain.In the form-conditioned case,the size reduction and applied force are a function of the displacement.In the simulation,the axial load is increased by moving the upper loading platen downwards step by step in a displacement control fashion.In the model,the walls that have the same modulus as the loading platen impose a horizontal constraint against the particles inside. This provides the necessary confined condition for inter-particle breakage.Similar numerical models have also been used by other researchers (Tsoungui et al.,1999;Kou et al.,2001).Com-pared with Tsoungui et al.Õs(1999)model,the numerical model in the present paper regards the rock as breakable particles and can deal with irregularly shaped particles,even though circular particles are used here for comparison with Tsoungui et al.Õs(1999)experimental results. The influence of an irregular shape on the particle breakage process will be discussed in Section5.1. Compared with Kou et al.Õs(2001)model,the residual strength of the element after failure relat-ing to the confinement and the ability of the con-tact point to resist compressive stress but not tensile stress are the main features of the present numerical model.The R–T2D code randomly generates different circular particles by adjusting the overlapping ele-ments between neighbouring particles to satisfy the defined percentage(approximately85%).The different particles consist of different amounts of elements.The elements are defined according to the heterogeneous material model(Liu et al., 2002)with the homogeneous index m=2and the following elemental seed parameters:the elastic modulus E0=60GPa,the compressive strength r0=200MPa,etc.The steel container and the steel platen are simulated as homogeneous materi-als whose elastic modulus and strength arefive times higher than those of rock in order to prevent them from the permanent deformation.4.2.Quasi-photoelastic stress fringe patternIn a confined particle bed,no particles can es-cape stressing by moving sidewards.The general loading process is that contact forces act on a par-ticle,deform it,and may cause inelastic deforma-tion and breakage.A contact force in general is directed obliquely and generates always a pressure and a shear.A contact can arise between two neighbouring particles or between a hard surface and a particle.Both contact situations cause differ-ent effects on the deformation and the stress distri-bution in the contact volume and thus on the breakage.Therefore,knowledge of the deforma-tion and the stress distribution in the interior of the particle skeleton is helpful in understanding the breakage behaviour.Since stress or strain can-not be measured systematically in situ in the inte-rior of a particle assembly in the container, physical model tests,such as photoelastic tests, are often the only way to investigate a stressfield under idealized conditions.However,in applying the optical method,some demands have to be met concerning the test technique.One of them is that a transparent and optically sensitive mate-rial such as glass or epoxy resin has to be used (Oda and Iwashita,1999).Therefore,although optical stress measurements in photoelastic materi-als open new perspectives in research on stress fields,this method makes it impossible to investi-942H.Y.Liu et al./Mechanics of Materials37(2005)935–954gate stresses in materials,such as rocks,which are by no means transparent.To overcome such a difficulty,the R–T2D code is used to obtain the fullfield stress information for the particles.In order to obtain clear pictures that resemble the photoelastic test,i.e.quasi-photoelastic stress fringe pattern,a numerical model which is the same as that illustrated in Fig.7a is constructed,but the material in this model is considered to be homogeneous.Numeri-cally generated quasi-photoelastic stress fringe patterns in each particle and in the wall of the con-tainer are shown in Fig.7b.Thisfigure indicates that the overall load produces contact forces be-tween the particles.These contact forces create stress distribution in the particles.The stress distri-bution in the model will be visualized,and the interaction between the particles,as well as be-tween the particles and the container walls,will be examined in more detail in the following.4.3.Inter-particle breakage processFig.8records the total crushing force(F)and the displacement(S)curve obtained during the simulation of the inter-particle breakage process. The equilibrium states labelled by the alphabetical letters A,B,etc.are shown in Figs.9and10in terms of the distributions of the elastic modulus and the major principal stress,respectively.It can be seen that the force–displacement response has the general features common to many brittle materials.Initially,it is relatively stiffand nearly linear(curve AB in Fig.8).Most of particles de-form elastically except for a few failures in the par-ticle bed because of the rock heterogeneity as shown in Figs.9and10A and B.At a load of approximately1364N(point B in Fig.8),the re-sponse begins to soften,mainly due to the break-age of particles1,6,7,12,13,16and24(please refer to Fig.7a for the particle number)as re-corded in Figs.9and10B,and eventually a limit load develops at1858N(point C in Fig.8).The fracture is localized in particles1,4,6,7,12,13, 16,18,19,20,21,23,24and25(Figs.9and10C and D)beyond the limit load(point D in Fig.8). Careful observation reveals that until this stage, the grain fragmentations are mainly located on the grains with smaller sizes.In those grains,the splitting macroscopic cracks are initiated and propagate along the lines between the two highest stressed contact points.The reasons for this frag-mentation are purely geometric.As a matter of fact,with respect to the rest of the packing,the small grains have few contact points with the neighbouring grains or the walls of the crushing chamber,i.e.they are grains under an almost qua-si-uniaxial compression.In Section3,it has been shown that under uniaxial compression the frag-mentation processes develop very quickly and the particle collapses over a very small strain range. In this case,axial splitting between the loading points is the prominent characteristic.For the large grains,the fragmentation is more difficult, because their large number of surrounding con-tacts create a dominant hydrostatic effect around the grains,i.e.quasi-triaxial compression,for example the grains numbered as2,5,8,10,11 and15in Figs.9and10A–D.As the collapse of the particles with smaller size progresses,the failures spread to the neighbouring large particles.The spreading of the collapse from particle to particle continues,creating an undulat-ing load plateau,as shown in Fig.8after point D.One can observe the fragmentation regime, characterized by the irregular saw-toothed curve (point D,E,F and G in Fig.8)of the load,as a function of the loading displacement.During this stage,although the splitting cracks are still initiated and propagate along the lines between the two most highly stressed contact points(for example the grains numbered as8and15in Figs.9andH.Y.Liu et al./Mechanics of Materials37(2005)935–954943。