ABSTRACT Compositional Quality of Service Semantics
- 格式:pdf
- 大小:135.19 KB
- 文档页数:8
Beginningl In this paper, we focus on the need forl This paper proceeds as follow.l The structure of the paper is as follows.l In this paper, we shall first briefly introduce fuzzy sets and related conceptsl To begin with we will provide a brief background on theIntroductionl This will be followed by a description of the fuzzy nature of the problem and a detailed presentation of how the required membership functions are defined.l Details on xx and xx are discussed in later sections.l In the next section, after a statement of the basic problem, various situations involving possibility knowledge are investigated: first, an entirely possibility model is proposed; then the cases of a fuzzy service time with stochastic arrivals and non‑fuzzy service rule is studied; lastly, fuzzy service rule are considered. Reviewl This review is followed by an introduction.l A brief summary of some of the relevant concepts in xxx and xxx is presented in Section 2.l In the next section a brief view of the .... is given.l In the next section, a short review of ... is given with special regard to ...l Section 2 reviews relevant research related to xx.l Section 1.1 briefly surveys the motivation for a methodology of action, while 1.2 looks at the difficulties posed by the complexity of systems and outlines the need for development of possibility methods.Bodyl Section 1 defines the notion of robustness, and argues for its importance.l Section 1 devoted to the basic aspects of the FLC decision‑making logic.l Section 2 gives the background of the problem which includes xxxl Section 2 discusses some problems with and approaches to, natural language understanding.l Section 2 explains how flexibility which often ... can be expressed in terms of fuzzy time‑windowl Section 3 discusses the aspects of fuzzy set theory that are used in the ...l Section 3 describes the system itself in a general way, including the ..and also discusses how to evaluate system performance.l Section 3 describes a new measure of xx.l Section 3 demonstrates the use of fuzzy possibility theory in the analysis of xx. l Section 3 is a fine description of fuzzy formulation of human decision.l Section 3, is developed to the modeling and processing of fuzzy decision rulesl The main idea of the FLC is described in Section 3 while Section 4 describes the xx strategies.l Section 3 and 4 show experimental studies for verifying the proposed model. l Section 4 discusses a previous fuzzy set‑based approach to cost variance investigation.l Section 4 gives a specific example of xxx.l Section 4 is the experimental study to make a fuzzy model of memory process. l Section 4 contains a discussion of the implication of the results of Section 2 and 3.l Section 4 applies this fuzzy measure to the analysis of xx and illustrate its use on experimental data.l Section 5 presents the primary results of the paper: a fuzzy set model ..l Section 5 contains some conclusions plus some ideas for further work.l Section 6 illustrate the model with an example.l Various ways of fuzzification and the reasons for their choice are discussed very briefly in Section 2.l In Section 2 are presented the block diagram expression of a whole modelof human DM systeml In Section 2 we shall list a collection of basic assumptions which a ... scheme must satisfy.l In Section 2 of this paper, we present representation and uniqueness theorems for the fundamental measurement of fuzziness when the domain of discourse is order‑dense.l In Section 3, we describe the preliminary results of an empirical study currently in progress to verify the measurement model and to construct membership functions.l In Section 5 is analyzed the inference process through the two kinds of inference experiments...This Sectionl In this section, the characteristics and environment under which MRP is designed are described.l We will provide in this section basic terminologies and notations whichare necessary for the understanding of subsequent results.Next Sectionl The next section describes the mathematics that goes into the computer implementation of such fuzzy logic statements.l However, it is cumbersome for this purpose and in practical applications the formulae were rearranged and simplified as discussed in the next section.l The three components will be described in the next two section, and an example of xx analysis of a computer information system will then illustrate their use.l We can interpret the results of Experiments I and II as in the following sections.l The next section summarizes the method in a from that is useful for arguments based on xxSummaryl This paper concludes with a discussion of future research consideration in section 5.l Section 5 summarizes the results of this investigation.l Section 5 gives the conclusions and future directions of research.l Section 7 provides a summary and a discussion of some extensions of the paper.l Finally, conclusions and future work are summarizedl The basic questions posed above are then discussed and conclusions are drawn. l Section 7 is the conclusion of the paper.Chapter 0. Abstractl A basic problem in the design of xx is presented by the choice of a xx rate for the measurement of experimental variables.l This paper examines a new measure of xx in xx based on fuzzy mathematics which overcomes the difficulties found in other xx measures.l This paper describes a system for the analysis of the xx.l The method involves the construction of xx from fuzzy relations.l The procedure is useful in analyzing how groups reach a decision.l The technique used is to employ a newly developed and versatile xx algorithms.l The usefulness of xx is also considered.l A brief methodology used in xx is discussed.l The analysis is useful in xx and xx problem.l A model is developed for a xx analysis using fuzzy matrices.l Algorithms to combine these estimates and produce a xx are presented and justified.l The use of the method is discussed and an example is given.l Results of an experimental applications of this xx analysis procedure are given to illustrate the proposed technique.l This paper analyses problems inl This paper outlines the functions carried out by ...l This paper includes an illustration of the ...l This paper provides an overview and information useful for approachingl Emphasis is placed on the construction of a criterion function by which the xx in achieving a hierarchical system of objectives are evaluated.l The main emphasis is placed on the problem of xxl Our proposed model is verified through experimental study.l The experimental results reveal interesting examples of fuzzy phases of : xx,xxl The compatibility of a project in terms of cost, and xx are likewise represented by linguistic variables.l A didactic example is included to illustrate the computational procedure Chapter 1. IntroductionTimel Over the course of the past 30 years, .. has emerged form intuitivel Technological revolutions have recently hit the industrial worldl The advent of ... systems for has had a significant impact on thel The development of ... is exploredl During the past decade, the theory of fuzzy sets has developed in a variety of directions,l The concept of xx was investigated quite intensively in recent yearsl There has been a turning point in ... methodology in accordance with the advent of ...l A major concern in ... today is to continue to improve...l A xx is a latecomer in the part representation arena.l At the time of this writing, there is still no standard way of xxl Although a lot of effort is being spent on improving these weaknesses, the efficient and effective method has yet to be developed.l The pioneer work can be traced to xx [1965].l To date, none of the methods developed is perfect and all are far from ready to be used in commercial systems.Objective / Goal / Purposel The purpose of the inference engine can be outlined as follows:l The ultimate goal of the xx system is to allow the non‑experts to utilize the existing knowledge in the area of manual handling of loads, and to provide intelligent, computer‑aided instruction for xxx.l The paper concerns the development of a xxl The scope of this research lies inl The main theme of the paper is the application of rule‑based decision making.l These objectives are to be met with such thoroughness and confidence as to permit ...l The objectives of the ... operations study are as follows:l The primary purpose/consideration/objective ofl The ultimate goal of this concept is to providel The main objective of such a ... system is tol The aim of this paper is to provide methods to construct such probability distribution.l In order to achieve these objectives, an xx must meet the following requirements:l In order to take advantage of their similarityl more research is still required before final goal of ... can be completedl In this trial, the objective is to generate...l for the sake of concentrating on ... research issuesl A major goal of this report is to extend the utilization of a recently developed procedure for the xx.l For an illustrative purpose, four well‑known OR problems are studied in presence of fuzzy data: xx.l A major thrust of the paper is to discuss approaches and strategies for structuring ..methodsl This illustration points out the need to specifyl The ultimate goal is both descriptive and prescriptive.l Chapter 2. Literature Reviewl A wealth of information is to be found in the statistics literature, for example, regarding xxl A considerable amount of research has been done .. during the last decadel A great number of studies report on the treatment of uncertainties associated with xx.l There is considerable amount of literature on planningl However, these studies do not provide much attention to undertainty in xx.l Since then, the subject has been extensively explored and it is still under investigation as well in methodological aspects as in concrete applications.l Many research studies have been carried out on this topic.l Problem of xx draw recently more and more attention of system analysis.l Attempts to resolve this dilemma have resulted in the development ofl Many complex processes unfortunately, do not yield to this design procedure and have, therefore, not yet been automated.l Most of the methods developed so far are deterministic and /or probabilistic in nature.l The central issue in all these studies is tol The problem of xx has been studied by other investigators, however, these studies have been based upon classical statistical approaches.l Applied ... techniques tol Characterized the ... system asl Developed an algorithm tol Developed a system called ... whichl Uses an iterative algorithm to deducel Emphasized the need tol Identifies six key issues surrounding high technologyl A comprehensive study of the .. has been undertakenl Much work has been reported recently in these filedl Proposedl Presentedl State thatl Point out that the problem ofl Describedl Illustratedl Indicatedl Has shown / showedl Addressl Highlightsl A study on ...was done / developed by []l Previous work, such as [] and [], deal only withl The approach taken by [] isl The system developed by [] consistsl A paper relevant to this research was published by []l []'s model requires consideration of ..l []' model draws attention to evolution in human developmentl []'s model focuses on...l Little research has been conducted in applying ... tol The published information that is relevant to this research...l This study further shows thatl Their work is based on the principle ofl More history of ... can be found in xx et al. [1979].l Studies have been completed to establishedl The ...studies indicated thatl Though application of xx in the filed of xx has proliferated in recent years, effort in analyzing xx, especially xx, is lacking.Problem / Issue / Questionl Unfortunately, real-world engineering problems such as manufacturing planning do not fit well with this narrowly defined model. They tend to span broad activities and require consideration of multiple aspects.l Remedy / solve / alleviate these problemsl ... is a difficult problem, yet to be adequately resolvedl Two major problems have yet to be addressedl An unanswered questionl This problem in essence involves using x to obtain a solution.l An additional research issue to be tackled is ....l Some important issues in developing a ... system are discussedl The three prime issues can be summarized:l The situation leads to the problem of how to determine the ...l There have been many attempts tol It is expected to be serious barrier tol It offers a simple solution in a limited domain for a complex problem.l There are several ways to get around this problem.l As difficult as it seems to be, xx is by no means new.l The problem is to recognize xx from a design representation.l A xx problem can trace its roots to xx.l xx [1987] used a heuristic approach to simplify the complexity of the problem. l Several problems are associated with them.l Although some progress has been made in this area, at least two major obstacles must be overcome before a fully automated system can be realized.l Most problems in practice are complicatedl More problem surface here.l Hamper effort toward a xx systeml In order to overcome the limitations due to incomplete and imprecise xx knowledge, a xx program has been developed, which bases its knowledge upon the statistical analysis of a sample population of xxl The above difficulties are real challenges faced by researchers attempting to developl This type of mapping raises no controversy to the issue of membership function determination.l However, attempts to quantify the xx have met both theoretical and empirical problems.l It has become apparent that in order to apply this new methodological framework to real‑world problems and data, we have to pay attention to the problems of xx and xx.Chapter 3. Proposed methodologyAssumptionl In the case when the assumption of a xx seems to be too restrictive or inadequate, the formulation with Fuzzy termination time, i.e. given by a fuzzy set in the space of control stages, may be applied.l We assume here the fuzzy constraints to be state‑dependent, and the fuzzy goal to be the same for all the control states, xx, which stems from the problem's nature.l An approach to the solution of this problem is presented under the assumption that the sampling rate Decision can be made prior to the execution of the experiment, as opposed to being made while the experiment is in progress.l Another assumption made above is that there are precise odds at which the expert is indifferent.l Main simplifying assumptions are:l This, in our view, is a questionable assumption.Outline / Structure / Modulel An outline of the researchl Information is incorporated within the schemel Is built into ... structurel A nice modular structure.l The principles of ... are applied as modularized criteriaClassificationl A xx system comprises three main components:l Must decompose the original .. into a set of ..l Consists of the following steps:l This is summarized in the following steps:l Can be broadly classified into the following areas:l Can be characterized by its function of effectively processing thel Can allow further breadth of application of ...into morel The following steps should be followedl xx can be classified by a different ways.l Based on the xx, one may classify xx into the following:l This catalog may change due to wear, breakage, and purchasing.Systeml Unlike many conventional program, expert systems do not usually deal with problem for which there is clearly a right or wrong answer.l The system consists of both ... and ...l The system has a hierarchical modular architecture organized on three levels. l expert system domains are area of expertisel To develop a xx system for xx, the following factors must be considered:l The system has been developed / designed to determinel The system has proven to be able tol The domain in which an expert system operates is a particular domainl The system comprises a ... withl The system is [feature-oriented ] / based on the ... techniquel The system environment must be relatively stablel The system is utilized to generate, load, store, update and retrieve ...l The development of a xx system has two stages: xx stage and xx stage.l The most essential part of .. system is the ...l The successful developments in ESs have made them an important tool in the development ofl An automated system was developed forl In this case, the system can be considered to be generative.l An interactive automatic ... systeml A .. is commonly thought of as a truly integrated .. systeml Should be capable of being generated from a ... systeml xx is an important part of the integrated system.l The model consists of four rule bases, each of which addresses a separate problem in the hierarchy of scheduling decision.l The rule bases are linked to each other in a chin‑like manner in the sense that the consequent of one rule base constitutes a part of the antecedent of the next rule base.l The rule base consists of all possible combinations of the linguistic terms associated with the linguistic variable of the antecedent of a rule.Computer Systeml The system has been implemented using Prolog language in an MS‑DOS environment. Prolog was chosen because it offers a well known and flexible environment in which fuzzy reasoning may be easily implemented.l The current version of the xx program when compiled with WATFOR77 result s in an executable code of about 270K bytes. Typical run time, when run on aXX computer (an IBM compatible machine) operating at 4.77 Mhz with 640K RAM, ranges from 10 min to 2h, depending on the size (or complexity) of the problem.l Time consuming procedures have been implemented in C‑language and directly linked to the Prolog environment.l The xx process, once the xx's data has been entered, requires approximately 180 seconds.l It should be noted that the computation was done with a 20 Hhz, 80386 209;based microcomputer equipped with a 80387 math co‑processor.l The computer programs used for the analyses, one based on the xx method and the other based on the new method, were written in FORTRAN with a compiler that supports the math co‑processor.l Lisp, Prolog give maximum flexibility but also maximizes development time. l Internal representation is the way a model is represented in the computer.l An interactive menu-driven procedure is used in this studyl Shell can be develop very fast at the cost of time fairly severe limitations.l While there is no measurable saving of time for the case involving five criteria, the saving is dramatic for the case involving 10 criteria -- the computation time reduces from 10 hr 40 min to about 1 min.l This combination is being implemented in an objected‑oriented programming environment (Smalltalk‑80 system) to solve problems encountered in construction xxx.Method / Approach / Study / Process Model / Equation /Algorithm / Rule / Formula / Techniquel A discussion is presented of a problem-solving systeml To improve the efficiency of the method, the following approach may be applied.l In order to an investigation was made to find the causes of thel Although large collections of rules and equations have been complied, none are generally acceptedl This approach will be explained and discussed thoroughly in the body of the report.l This can be accomplished byl This algorithm to compute the total cost can be described step by step as follows:l The above preliminary analysis has provided important informationl Various methods have been proposed for selecting an optimum...l These concepts have been applied tol On the basis of the concept mentioned above,l This can be achieved byl This fact suggests that a new conceptl This was accomplished by taking ...l The preparatory stage is very time consuming process.l Test are performed for validity, completeness, and compatibilityl There is little hope of achieving successful ...l There has been an increasing awareness of the potential of using most ..so far made have not taken this approach, with the exception ofl Only a few studies can be found.l It is a very tedious process to go throughl It is only when .. has been completed that .. may be effectedl The entire interpretation process is conducted in one's head.l These approaches are sometimes very tedious.l Several techniques can be usedl A polynomial parametric model can be written as [the following]/[follows]:l A xx model is constructed/formulated using xx.l A xx model represents an xx by its xx.l A process decision model captures the logic essential tol From the equation above, xx is equal to the summation of xx times the ...l The validity of a xx model can be checked using Euler's formula.l Given a model, one can mathematically determine whether ... or ...l Equations for xx need to be derived and implemented in the system.l A number of heuristic rules have been developed forl Optimum .. techniques can be made more reliable by ... so thatl An algorithm based on the characteristic ... is used to determinel Euler's formula states the following:l The completed model should agree with the formula.l For manufacturing purposes, a detailed and precise model of the object is necessaryl Engineering design models are very well defined; therefore,l To keep the domain narrow enough to be implementable, yet wide enough to be useful.Point of Viewl from an implementation standpoint,l From the point of view of this application,l From this point of view, Zadeh suggested an inference rule named xxx (CRI for short).l Information is the meaningful interpretation and correlation of some aggregation of data in order to allow one to make decisions.l From a practical point of view, the computational aspects of an FLC require a simplification of the fuzzy control algorithm.l The use of a hammer to insert screws, although partly effective, tends to distort, destroy, and generally defeat the purpose of using a screw [Kusiak AI Implications for CIM p.129]Justificationl We choose the so called xx in our experiment because it has received wide acceptance and canl Prolog was chosen because it offers a well known and flexible environment in which fuzzy reasoning may be easily implemented.l The rationale behind this is that it can be much easier for an estimator to rate a cost as high than to attempt to place a dollar value on the estimate.l This strategy has been widely used in fuzzy control applications since it is natural and easy to implement.l A function definition expresses the membership function of a fuzzy set in a functional form, typically a bell‑shaped function, etc. Such functions are used in FLC because they lead themselves to manipulation through the use of fuzzy arithmetic.l It should be noted that in our daily life most of the information on which our decisions are based is linguistic rather than numerical in nature. Seen in this perspective, fuzzy control rules provide a natural framework for the characterization of human behavior and decisions analysis.l Many experts have found that fuzzy control rules provide a convenient way to express their domain knowledge. This explains why most FLCs are based on the knowledge and experience which are expressed in the language of fuzzy "if‑the" rule.Chapter 4. ExamplesExample/ Datal The data used in the following example was taken from an experiment in which xx was measured between x and x using a xx technique.l The data consists of over xx measurements.l An example of xx is discussed and the control rules of xx are compared with a xxl Examples of complex processes to which this technique may be applied are xx, xx, etc.l The following example is constructed only for the purpose of illustrating the computational procedure discussed.l This example clearly demonstrates that the profile of an individual xx, or a very small group of xx, with no enough data to be studied statistically, can be meaningfully analyzed by fuzzy possibilistic methods.l There is no space here to go into detail on all these methods, but deserve a mention and the bibliography will point to detailed references for those wishing this level of detail.l Note that the golf ball spotting example is used throughout the paper. Comparisonsl As well, the pros and cons of these representations from a process planning point of view will be discussed.l The method of using xx to implement xx described by Zadeh (1973) appeared more suitablel As discussed [in the previous section]/[preciously],Relationl We can not invert F' directly because it defines a many-to-one mapping.l The relationships appear very complicatel Lifting tasks involve complex and imprecise relationship between the task variables and the human operator's characteristics.l These methods are based on the relationship between ... and ...l The fundamental concept of a fuzzy rating language is that we can establish a relationship among terms such as high, medium, and low, and then modify these relationships.l This article will thus mention the latter as well as the former.l The former two bear a close relation to a fuzzy Cartesian product. Importancel The emphasis is on an implementation of a general approach to rule based decision making.Consideration / Attentionl Careful evaluation is necessary to ensurel Such a formulation does not change further considerations.l Considerable attention has been paid tol Attention should be paid to an important finding of this investigation.l Caution should be exercised in this process to avoid ...l Primary consideration is given to ... components, though others can be accommodatedl After ... has been defined by ..., a carefully analysis is carried out/performed to determinel A number of factors such as ...need to be taken into consideration before making the appropriate decision.l It should be noted thatl It is important to point out that ...l These considerations have heightened interest in the possibility of providing ... l We should stress the fundamental importance of the xxChapter 5. Results.Advantages / Disadvantagel One of the major advantages of this new measure of xx is that it can be applied to the experimental study ofl One advantage of using a .. is the ease of preparing it.l The xx system is versatilel It has a very fast decision making processl All the algorithms involve mostly logical operations.l It can be easily and without additional cost implemented in a microprocessor‑based environment.l It can reduce the waste of designing from scratch.l The advantages of using a xx to represent xx are the following:l However, xx is not without its shortcomings.l In most cases, the xxx shows an improvement over the existing xxx.l Compared to the existing xx, the impacts of the xx are generally reduced by 5% to 9%.l The "best case" results shows a savings of 6% to 9%.l Most of the existing works based on xx approach can only recognize a xx .l Most of the above methods are computational expansive and limited to xx.l Some other advantages of xx are the following:l The problem is the limitation of this method to a limited domain of parts.l It proved limited in application because it demanded precision in system modeling that was impossible in practice.l There are advantages to be gained in the structuring of costs and benefits, the use of xx,l The disadvantages of this method are also disadvantages of conventional xx approaches.l This combines the best features of both techniquesl Hopefully, this tool can be as the reference framework of for developing a xx platform, and helping the administration, marketing, and knowledge management activities in virtual communities.Resultsl An improvement on the result shown above can be made by based on the data providedl Discussion of these theories is beyond the scope of this reviewl Based on the information contained in thisl The result can be categorized into nine classesl The results are illustrated by an examplel The experimental results for each xx time are reported in Table 2.l From the results obtained so far, it seem thatl Because of the inaccuracy of the ..., a conclusion cannot be drawn asl Although much effort has been made to., this reality is far from completion.l The results indicate that the total benefits are higher than the total costs.。
2018年1月Journal on Communications January 2018 第39卷第1期通信学报V ol.39No.1基于强化学习的服务链映射算法魏亮,黄韬,张娇,王泽南,刘江,刘韵洁(北京邮电大学网络与交换技术国家重点实验室,北京 100876)摘要:提出基于人工智能技术的多智能体服务链资源调度架构,设计一种基于强化学习的服务链映射算法。
通过Q-learning的机制,根据系统状态、执行部署动作后的奖惩反馈来决定服务链中各虚拟网元的部署位置。
实验结果表明,与经典算法相比,该算法有效降低了业务的平均传输延时,提升了系统的负载均衡情况。
关键词:网络功能虚拟化;人工智能;服务链;强化学习中图分类号:TP302文献标识码:Adoi: 10.11959/j.issn.1000-436x.2018002Service chain mapping algorithm based onreinforcement learningWEI Liang, HUANG Tao, ZHANG Jiao, WANG Zenan, LIU Jiang, LIU Yunjie State Key Laboratory of Networking and Switching Technology, Beijing University of Posts and Telecommunications, Beijing 100876, ChinaAbstract: A service chain resource scheduling architecture of multi-agent based on artificial intelligence technology was proposed. Meanwhile, a service chain mapping algorithm based on reinforcement learning was designed. Through the Q-learning mechanism, the location of each virtual network element in the service chain was determined according to the system status and the reward and punishment feedback after the deployment. The experimental results show that com-pared with the classical algorithms, the algorithm effectively reduces the average transmission delay of the service and improves the load balance of the system.Key words: network function virtualization, artificial intelligence, service chain, reinforcement learning1引言网络功能虚拟化[1](NFV, network function virtualization)是未来网络领域的重要研究方向。
餐饮服务质量英文综述作文The quality of dining service is crucial for customer satisfaction. It includes various aspects such as food quality, presentation, cleanliness, and staff attitude. Customers expect a pleasant dining experience, and the service quality plays a significant role in meeting their expectations.When it comes to food quality, customers expect fresh and delicious dishes. The taste, texture, and aroma of the food should be top-notch. Customers also value the presentation of the dishes, as it adds to the overall dining experience. A visually appealing dish can enhance the perceived value of the meal.Cleanliness is another important aspect of dining service quality. Customers expect a clean and hygienic environment in the dining area, kitchen, and restrooms. A clean and well-maintained facility reflects positively on the overall impression of the restaurant.The attitude and behavior of the staff are crucial in determining the quality of dining service. Friendly, attentive, and knowledgeable staff can enhance the overall dining experience. Customers appreciate when the staff is accommodating and willing to cater to their needs.Efficiency and timeliness are also important factors in dining service quality. Customers expect their orders to be taken promptly and their food to be served in a reasonable amount of time. Slow service can lead to dissatisfaction and a negative impression of the restaurant.In conclusion, the quality of dining service encompasses various aspects such as food quality, presentation, cleanliness, staff attitude, and efficiency. Meeting customer expectations in these areas is essential for a positive dining experience and customer satisfaction.。
毕设附件外文文献翻译原文及译文(3500 字)原文Study of Service Quality Management in Hotel IndustryBorkar; SameerAbstractIt is an attempt to understand the role of quality improvement process in hospitality industry and effectiveness in making it sustainable business enterprise. It is a survey of the presently adopted quality management tools which are making the hotels operations better focused and reliable and meet the customer expectations. Descriptive research design is used to know the parameters of service quality management in hospitality industry. Exploratory research design is undertaken to dig out the service quality management practices and its effectiveness. Data analysis is done and presented; hypothesis is tested against the collected data. Since the industry continuously tries to improve upon their services to meet the levels of customer satisfaction; Study presents tools for continuous improvement process and how it benefits all the stake holders. It can be inferred from the study that the hotel implement continuous improvement process and quality management tools to remain competitive in the market. The study involves hotels of highly competitive market with limited number of respondents. This limits the study to hotel industry and has scope of including other hospitality service providers as well.Keywords: Customer Satisfaction, Perception, Performance Measurement, Continuous, Improvement Process.IntroductionIt has brought paradigm shifts in the operations of hospitality industry. The overall perspective of the industry is changed due to introduction of new techniques and methods of handling various processes. Awareness among the hoteliers and the guests has fuelled the inventions focused on operations. The increased sagacity of customer satisfaction led to the use of high standards of service in industry. The new service parameters made the hoteliers to implement quality management as an effective aid. It has significantly affected hotels' ability to control and adapt to changing environments. The use of new techniques began with the simple motive of sophistication and precise activities in the given field of operation which may result in high standards of service in global economy and has allowed the rise of a leisure class.Conceptual Framework This study of Service quality management in hospitality industry is an attempt to understand the presence of quality improvement process in hospitality industry and effectiveness in making it sustainable business enterprise. It is a survey of the presently adopted quality management tools which are making the hotels operations safer, focused and reliable and meet the customer expectations.As the hospitality industry becomes more competitive there is an obvious need to retain clientele as well as increasing profitability and hence management professionals strive to improve guest satisfaction and revenues. The management professionals whom are striving for these results however often have limited understanding of research surrounding the paradigms of guest satisfaction and loyalty and financial performance. This research paper shall enlighten some of the variables and important facts of service quality resulting into guest satisfaction.Review of LiteratureCustomers of hospitality often blame themselves when dissatisfied for their bad choice. Employees must be aware that dissatisfied customers may not complain and therefore the employees should seek out sources of dissatisfaction and resolve them. (Zeithaml V., 1981, p.186 -190)It is said that service quality is what differentiates hospitality sector, however there is not an agreed definition of what service quality is. There is however a few different suggestions of how to define service quality. Dividing it into technical, functional and image components; (Greenrooms C., 1982) another is that service quality is determined by its fitness for use by internal and external customers. It is accepted that service quality is depends upon guest's needs and expectations. A definition of service quality state that quality is simply conformance to specifications, which would mean that positive quality is when a product or service specific quality meet or exceed preset standards or promises. This however seems like an easy view within the hospitality industry. The alternative definitions read as follows: 1) quality is excellence; 2)quality is value for money; 3) quality is meeting or exceeding expectations. This appears better aligned with ideas which exist within hospitality management than the first mentioned simplistic approach. Service quality and value is rather difficult to calculate, companies must therefore rely on guest's quality perceptions and expectations to get consistent results which is best achieved by asking guest's questions related to expectations and their perceptions of the service quality, which can effectively be achieved through carefully designed surveys.A major problem with service quality is variability and limited capability and robustness of the service production process. (Gummesson E., 1991) Hotels consumers have well-conceived ideas about service quality and quality attributes are considered important for most types of services, the absence of certain attributes may lead consumers to perceive service quality as poor. The presence of these attributes may not substantially improve the perceived quality of the service. Most customers would be willing to trade some convenience for a price break, and that the behavior, skill level and performance of service employees are key determinants of perceived quality of services. This is a major challenge in improving or maintaining a high level of service quality. (Tigineh M. et al 1992)Studies focusing on service quality management suggest that service firms spend too little effort on planning for service quality. The resultant costs of poor service quality planning lead to lower profitability as part of the service failures. (Stuart F., et al 1996)When discussing satisfaction, it is important to understand that guest's evaluation of service comprise of two basic distinct dimensions:service delivery and service outcome (Mattila, 1999). Research indicates that how the service was delivered (perceived functional quality) is more important than the outcome of the service process (technical quality). This research clearly indicates that effort by staff have a strong effect on guest's satisfaction judgments.Companies delivering services must broaden their examination of productivity to help settle conflicts –the leverage synergies –between improving service quality and boosting service productivity. ( Parasuraman A. 2002)A key activity is to conduct regularly scheduled review of progress by quality council or working group and management must establish a system to identify areas for future improvement and to track performance with respect to internal and external customers. They must also track the changing preferences of customer. Continuous improvement means not only being satisfied with doing a good job or process. It is accomplished by incorporating process measurement and team problem solving an all work activities. Organization must continuously strive for excellence by reducing complexity, variation and out of control process. Plan-D-Study-Act (PDSA) developed by Shewhart and later on modified by Deming is an effective improvement technique. First Plan carefully, then carry out plan, study the results and check whether the plan worked exactly as intended and act on results by identifying what worked as planned and what didn't work. Continuous process improvement is the objective and these phases of PDSA are the framework to achieve those objectives. (Besterfield D. et al 2003)The 'servicescape' -is a general term to describe the physical surroundings ofa service environment (Reimer 2005, p. 786) such as a hotel or cruise ship. Guests are sometimes unconsciously trying to obtain as much information as possible through experiences to decrease information asymmetries This causes guests to look for quality signals or cues which would provide them with information about the service, which leads us to 'cue utilization theory'. Cue utilization theory states that products or services consist of several arrays of cues that serve as surrogate indicators of product or service quality. There are both intrinsic and extrinsic cues to help guests determine quality. Consequentially, due to the limited tangibility of services, guests are often left to accept the price of the experience and the physical appearance or environment of the hotel or cruise ship itself as quality indicators. Though there are many trade and academic papers discussing guest satisfaction has been published, one can note that limited attention has been paid to the value perception and expectations guests have towards product delivery and influence price guests pay for an experience has on satisfaction and future spending. Furthermore it is also known that the role of pricing in relation to guest determinants of perceived quality of services. This is a major challenge in improving or maintaining a high level of service quality. (Tigineh M. et al 1992) Studies focusing on service quality management suggest that service firms spend too little effort on planning for service quality.The resultant costs of poor service quality planning lead to lower profitability as part of the service failures. (Stuart F., et al 1996)When discussing satisfaction, it is important to understand that guest's evaluation of service comprise of two basicdistinct dimensions: service delivery and service outcome (Mattila, 1999). Research indicates that how the service was delivered (perceived functional quality) is more important than the outcome of the service process (technical quality). This research clearly indicates that effort by staff have a strong effect on guest's satisfaction judgments. Companies delivering services must broaden their examination of productivity to help settle conflicts –the leverage synergies –between improving service quality and boosting service productivity. ( Parasuraman A. 2002)Telephonic conversation with peers and friends in hospitality industry worked a wonder giving lots of inputs in drafting this paper. Secondary data sources- For this study, data sources such as hospitality journals, Books on service quality management, organization behavior, URL on internet of various hospitality majors. Referring hospitality publications were helpful in knowing the current inventions in industry.Research Tools: Descriptive research design is used to know the attributes of service quality management in hospitality industry. Exploratory research design is undertaken to dig out the service quality management practices and its effectiveness. Data analysis is done and presented in tables. The hypothesis is tested against the collected data.Hypotheses: The hypotheses framed for the subject areHypothesis 1: Implementing service quality management as a tool for improvement in Customer Satisfaction.Hypothesis 2: Practicing Continuous Improvement program has benefited hotel. Limitation & Scope of the Study: Though there was a specific questionnaire used for collecting information, the objective of the paper was well discussed with the every contributor and whatever the information was provided by these sources is arranged for further analysis. The analysis of the available data is done on the relevance to the topic. The effectiveness of the technology in conservation of resources was always a point of consideration. The data is sifted for making it as precise as possible.Analysis and DiscussionsThere is a significant relationship between service quality management and customer satisfaction. In hospitality industry, the customer satisfaction variables such as Availability, Access, Information, Time, delivery of service, availability of personal competence, Comfortable and safer atmosphere and pollution free environment are of prime concern to every hotelier. The industry continuously tries to improve upon their services to meet the levels of customer satisfaction.The intangible nature of the service as a product means that it could be very difficult to place quantifiable terms on the features that contribute to the quality and measurement of the quality of the product is a problem for Service quality management.The customer is frequently directly involved in the delivery of the service and as such introduces an unknown and unpredictable influence on the process. The customer variability in the process makes it difficult to determine the exactrequirements of the customer and what they regard as an acceptable standard of service.This problem is magnified as it is often judgmental, based on personal preferences or even mood, rather than on technical performance that can be measured. Every hotel has a target market to cater which has very specific requirement in terms of expected and perceived quality of service.The customers come with different perception of quality every time they come to hotel and this makes it quite difficult to define quality and set the level of it. It requires hotel to continuously compare their perception against customer perception in terms of satisfaction measurement with performance measurement. The study has shown that the effective tools which management of various hotels uses for continuous improvement process and how it is dissipated amongst all the stake holders.译文酒店业服务质量管理研究博卡;萨米尔摘要本文旨在研究酒店业中质量改进过程的作用以及如何有效地推动企业的可持续发展。
Towards a Quality of Service Aware Public Computing Utility Muthucumaru Maheswaran,Balasubramaneyam Maniymaran,Shah Asaduzzaman,and Arindam MitraMcGill UniversityMontreal,QC H3A2A7CanadaAbstractThis paper describes a design for a quality of service aware public computing utility(PCU).The goal of the PCU is to utilize the idle capacity of the shared public resources and augment the capacity with dedicated resources as nec-essary,to provide high quality of service to the clients at the least cost.Our PCU design combines peer-to-peer(P2P) and Grid computing ideas in a novel manner to construct a utility-based computing environment.In this paper,we present the overall architecture and describe two major components:a P2P overlay substrate for connecting the resources in a global network and a community-based de-centralized resource management system.1IntroductionComputing utilities(CUs)much like Grid computing[7] are based on the idea of constructing very large virtual sys-tems by pooling resources from a variety of sources.How-ever,unlike Grid computing,utility computing focuses on providing a utility like interface to the virtual pool similar to that provided by common public utilities such as elec-tricity or water.One of the defining feature of a utility is the commoditization of the resources that makes them provider-neutral and simplifies activities such as metering and billing.In a distributed computing system,commodi-tization means we categorize the computing resources into virtual resources that provide predefined sets of services. The benefits and challenges of a utility computing lie on efficiently realizing the commoditization process in dis-tributed computing systems.Typically,computing utilities are built using resources that are supplied by a single or few providers.These re-sources are installed for the exclusive use of the computing utility.This approach naturally limits the scalability and geographical scope of the computing utility.However,one of the advantages of this approach is that resource behavior is well managed resulting in predictable quality of service (QoS).Here,we consider an extended notion of computing utility called public computing utility(PCU)that opens up the membership to public resources much like the peer-to-peer(P2P)file sharing systems.This enables the PCU toleverage vast amounts of idle resources spread throughout the Internet.In addition to lowering the cost of participa-tion,the PCU prevents provider monopoly and creates a geographically distributed resource base that is capable of satisfying location specific resource requirements.This paper introduces a QoS aware PCU design called Galaxy.Delivering QoS while solely relying on public re-sources is hard to accomplish for the PCU because a public resource working for a client can defect from the PCU at any time.One way to compensate for this uncertainty is to employ redundant public resources.Another approach is to switch the client to dedicated resources once the public re-sources are determined to perform below the expected per-formance level.Our PCU design supplements the capacities harnessed from public resources with dedicated resources to meet the performance expectations of the clients.Section2introduces the overall architecture of Galaxy.The routing substrate of Galaxy called the resource address-able network(RAN)is discussed in Section3.The Galaxy resource management system(GRMS)is described in Sec-tion4.Section5briefly examines the services and appli-cations that can be supported by the Galaxy architecture, respectively.Other research works related to Galaxy are presented in Section6.2A Public Computing Utility Architecture The proposed architecture for the Galaxy PCU is shown in Figure1.The lowest layer of the architecture is the P2P overlay network called the resource addressable net-work(RAN).All the resources that participate in the PCU plug into the RAN.The RAN provides the resource naming, discovery,and access services to the PCU.The next upper layer is the Galaxy resource management system(GRMS).Similar to the RAN,the GRMS is also organized as a P2P overlay network of managerial entities called Resource Bro-kers(RBs).In the RAN,the peers are virtualized resources whereas in the GRMS the peers are RBs.The trust/incentive management is a collaborating module to the GRMS.It controls the behavior of resources,especially the public re-sources,in the system.The next upper layer is the Galaxy services.Although the architecture does not impose any re-striction on the organization of this layer,it could be orga-1nized as a P2P network.Example Galaxy services include application level QoS managers,shell interfaces,and net-work file systems.Security is a layer in this Galaxy mid-dleware that spans all the other layers in parallel to provide the system from malicious activities (external and internal to the system).G a l a x y M i d d l e w a r e Figure 1.The Galaxy Architecture.3Resource Addressable NetworkThe RAN is a decentralized,self-organizing overlay thatinterconnects all resources in Galaxy.When a resource joins the RAN,it is analyzed to obtain a description of the resource characteristics as a set of attribute-value tu-ples.This set is then profiled into a resource type which is used as its name.This profile-based naming differs from the generally used description-based naming [10]where the attribute-values are used uncompressed to “name”re-sources.Even though the description-based naming pro-vides flexibility in querying resources,it suffers from the overheads in managing databases of resource descriptions.On the other hand,profile-based naming labels the resource descriptions into unique names to avoid these overheads.However,labeling all the possible description can lead to an unmanageable name space.Therefore only the popular resource descriptions are considered for labeling.The nam-ing is such that the un-labeled descriptions are mapped onto closest matching labeled profiles.The concept of profile-based naming is supported by the argument that,in practical conditions,popularity of the resources are largely skewed towards a small number of resource descriptions.Profiling only these descriptions can satisfy a large portion of user queries while keeping the system overhead low.Thus,the profile-base naming trades-off the performance for reduced overhead.Once profiled,resources of the same types are collected into type rings (Figure 2).Rings are overlay structures cre-ated by at least two routing pointers in each node to its left and right neighbors.Type rings are connected by neighbor-hood rings .These rings are created as space-filling curves [11]that support a decentralized,scalable discovery mecha-nism that provides log n hop-complexity.The RAN routing tables are incrementally built and managed by each resource in the RAN.They are two layered,one for routing along the profile space to reach the required type ring and the other for routing along the type ring to reach the desired location.This location-based routing within the type rings provides a QoS-aware discovery substrate for the Galaxy.Figure 2.Ring arrangement of the RAN.4Galaxy Resource Management System4.1OverviewThe GRMS layer is composed of two sets of entities:(a)resource peers (RPs)and (b)resource brokers (RBs).RPs are GRMS layer representatives of the resources present in the Galaxy.The resources RPs represent can be individual resources,cluster of resources,virtual resources,or soft-ware entities.RPs are the mediators in the GRMS resource allocation:they launch resource requests on behalf of the entities they represent and regulate the resource acquisition requests received for the resources under their control.Ag-gregating multiple resources under an RP has number of ar-chitectural benefits:it matches the administrative domains present in real world and provides an easy way of handling trust levels and incentive shares (Section 4.2).The Resource Brokers (RBs)are the entities that coordi-nate most of the activities within the GRMS layer.Any RP can act also as an RB as long as it has sufficient reputation such that existing RBs accept the new one.RBs have their virtual representations in the RAN level,forming a separate RAN type ring of “RB type”.This enables the RBs to use the RAN’s scalable resource discovery mechanism to dis-cover resources and other RBs.Two major functionalities of the RBs are to search and allocate resources as requests emerge from RPs and to assign and revalidate trust levels and incentive shares of the RPs.Each RP chooses an RB (probably the closest)to send the resource requests.The RB uses the RAN discovery mechanism to discover the ap-propriate resources.The discovered resources tell the RB2who their RP(s)are.The RB then mediates with the desti-nation RPs to acquire the resources for the requesting RP. At the end of the resource utilization,the donor and client RPs report the performance during the utilization back to the RB and based on which the RB readjusts the incentive shares owned by the donor RPs.4.2Incentive ManagementThe core idea of the incentive management system is to make each client a share holder of the global utility by is-suing shares of well defined values.The number of shares held by each resource denotes a client’s eligibility to access the PCU’s services and is directly dependent on two pa-rameters:(i)capacity donated by the resource to the global utility and(ii)consistency of commitment of the resource towards the utility.The incentive is to perk the clients to consistently commit their capacities to the PCU.We use the notion of Ca pacity Sh ares(CASH)to mea-sure a client’s share amount.When a client joins the PCU system,it is profiled by the PCU and the maximum number of CASHs(maxCASH)the client is entitled to hold is de-termined.Thereafter,a client’s contributions are marked by assigning it a fraction of the maxCASH over some time peri-ods(called epochs).The resource should work for the PCU for certain number of epochs to accumulate its full quota of CASH.Once a client earns it full quota of CASH,it gets no more shares.But to ensure the consistency of commitment, the client is expected to remain connected with the PCU in a continuous manner.If the resource departs the PCU it loses half of the shares held by it.The RBs award the clients CASH using time-limited certificates and it is the re-sponsibility of the clients to renew their CASH certificates. At time of the renewal,a client client can present partici-pation certificates or signed work orders to establish to the RB that it has contributed capacity to the PCU since the time the CASH certificate was issued.The work orders are issued by the RBs when the client’s resource is allocated to another client in response to a resource request.More detailed descriptions for the CASH incentive mechanism is given in[2].4.3Quality of Service ManagementEven though other layers are QoS aware,the GRMS layer implements the“core”set functionalities to manage the QoS delivered by Galaxy.The big part of the Galaxy resource pool made up of publicly owned resources that are guided by incentives and reputation.But,it has been previously shown that it is hard to guarantee QoS with un-controlled public resources alone[8].Galaxy significantly improves the QoS guarantees by augmenting the public re-sources with a fully controlled and reliable pool of dedi-cated resources.We implement this idea in conjunction with the QoS guaranteed resource scheduling service provided by the RBs.An RB pre-allocates a pool of highly trustworthy re-sources and uses capacities from this pool as required to guarantee QoS for requests from client RPs.When an allo-cation is made by the RB to a client RP,an implicit service level agreement(SLA)is drawn between the client RP and the RB.The RB will reallocate the request from the client RP if it detects the SLA can be violated due to unreliable behavior from the provider RP that is engaged in the alloca-tion.After the reallocation,the client RP might be served by resources from the pre-allocated resource pool associated with the RB.The RB wants to maximize the fulfillment of the SLAs of client RPs while maximizing the utilization of the pre-allocated resource pool.The prime objective of the RB is to utilize both the infinite public pool and thefinite sized dedicated pool to deliver the best services to the client RPs.To do this,online scheduling algorithms are used to route and re-route the resource requests onto the proper re-sources.5Galaxy Services and ApplicationsGalaxy service is the highest layer of the Galaxy mid-dleware.This provides generic capabilities for resources to perform activities such as launching resource acquisition commands,managing and monitoring acquired resources, and releasing resources.Some example of the Galaxy ser-vices are(a)a Unix shell like command line interface called Galaxy shell(GShell);(b)The Galaxy networkfile system (GNFS);and(c)application-level QoS management.Galaxy is the suitable place for hosting many different applications:the Internet scale distribution of resources makes Galaxy suitable for web content distribution.Fur-ther,the public resources of Galaxy being always at the edge of the Internet supports an efficient edge delivery of the con-tent.This property in addition to the immense storage and processing capacity of Galaxy makes it suitable also for streaming content distribution.Also the high-throughput computing applications can enjoy the virtually unlimited computing capacity of the Galaxy.6Related WorkGrid[7]is a distributed enterprise solution where dif-ferent institutions pool their resources together to build a high-performance computing platform.Even though Grid concept originated as a high-performance computing plat-form,it has now evolved into a service-oriented Open Grid Services Architecture(OGSA)[4].One of the important drawbacks of the Grid approach is its limited scalability due to the requirement for high trust among the participating in-stitutions,which restricts the membership to a few institu-tions.In contrast to this“close”communities Grid presents, 3the PCU is an open architecture that solicits wide participa-tion.Utility computing is based on the notion of“commodi-tizing”computer resources.It can simplify resource man-agement and increase resource usage by introducing a uni-fied interface to heterogeneous resources.HP Lab’s Utility Data Center(UDC)[6]is one project that implements util-ity computing.It pools together the resources of an institu-tion and provides mechanisms to create service-specific re-source farms according to user specifications.Recent focus of UDC projects is to combine the UDC technology with Grid architectures to provide inter-enterprise resource shar-ing[5].Besides UDC,there are other projects such as Clus-ter on demand(CoD)[3]and Virtual appliances and Col-lective[12]with similar goals.While Galaxy shares several key ideas with the utility computing systems,it differs from these projects because it is designed to implement(i)com-moditization at the core and utilizes this notion to efficiently implement resource naming and discovery,(ii)relaxed par-ticipation models to induct public resources into the system, (iii)geographically scalable resource management architec-tures.There is an emerging class of projects that use public resources in an“online”manner.These projects attempt to extend P2P system to generalized computing platforms. With a P2P architecture base,the resource management be-comes complex as incentives and trust are introduced into the system.Cluster computing on the Fly(CCoF)[9]is an example P2P-based generalized computing system.Even though CCoF is very similar to the PCU,one of the funda-mental differences is that PCU is focused on delivering QoS to its clients requiring it to have a stronger resource manage-ment system.As part of Galaxy,we present a community-oriented architecture for the RMS.Xenoservers[1]shares the same view of a PCU as our Galaxy.It addresses the issue of incorporating public resources into the system by designing incentive and trust mechanisms.However it can be seen that Xenoservers lacks a highly scalable discovery substrate like RAN.The RBs in Xenoservers(called Xeno-corps)are overloaded with naming and discovery services. With unstructured peer arrangement among Xenocorps and the usage of description based naming,it is hard to expect high scalability.7ConclusionWe presented the design of Galaxy a QoS-aware PCU. We presented the principles that govern the overall design and a detailed description of the Galaxy architecture.Two major components of the overall architecture were exam-ined in more detail.One was the P2P overlay substrate called the RAN.It provides the connectivity among a va-riety of Galaxy elements that have a requirement to name and discover each other in a location sensitive manner.An-other was the GRMS that provides various services includ-ing resource allocation,incentive management,and trustmanagement.One of the unique aspects of GRMS wasits community-oriented architecture.In this architecture,the resources are associated with Galaxy management el-ements in an on-demand basis.This paradigm is well suitedfor PCU where the resources including the ones running theGalaxy management elements can leave or join the Galaxyat any time.Currently,the Galaxy system is under development.We are focusing on the development of various Galaxy compo-nents such as the RAN,GRMS,and GShell.We intend todeploy an initial version of Galaxy on the Planet-Lab fortesting and benchmarking purposes.References[1]Xenoservers./Research/SRG/netos/xeno/.[2] A.Mitra and M.Maheswaran.Resource Pariticipation Mod-els for Public-Resources in Computing Utilities.Techni-cal report,School of Computer Science,McGill University,May2004.[3]J.Chase,L.Grit,D.Irwin,J.Moore,and S.Sprenkle.Dy-namic virtual clusters in a grid site manager.In The12thInternational Symposium on High Performance DistributedComputing(HPDC-12),June2003.[4]I.Foster,C.Kesselman,J.Nick,and S.Tuecke.The phys-iology of the grid:An open grid services architecture fordistributed systems integration.In Open Grid Service In-frastructure WG,Global Grid Forum,June2002.[5]S.Graupner,J.Pruyne,and S.Singhal.Making the utilitydata center a power station for the enterprise grid.TechnicalReport HPL-2003-53,HP Labs,Mar.2003.Tech Report.[6]HP Labs.HP utiltiy data center:Transforming data centereconomics./go/udc,2004.White Paper.[7]I.Foster,C.Kesselman,and S.Tuecke.The anatomy of theGrid:Enabling scalable virtual organizations.InternationalJournal on Supercomputer Applications,June2001.[8] C.Kenyon and G.Cheliotis.Creating services with hardguarantees from cycle harvesting resources.In Proceeingsof the3rd IEEE/ACM International Symposium on ClusterComputing and the Grid(CCGRID’03),2003.[9]V.Lo,D.Zappala,D.Zhou,Y.Liu,and S.Zhao.Clustercomputing on thefly:P2p scheduling of idle cycles in theinternet.In The3rd International Workshop on Peer-to-PeerSystmes(IPTPS2004),Feb.2004.[10]R.Raman,M.Livny,and M.H.Solomon.Matchmak-ing:Distributed resource management for high through-put computing.In The7th IEEE International Symposiumon High Performance Distributed Computing,Chicago,IL,July1998.[11]H.Sagan.Space-filling curves.Springer-Verlag Telos,NewYork,Aug.1994.[12] C.Sapuntzakis and m.Virtual appliances in thecollective:A road to hassle-free computing.In The9thWorkshop on Hot Topics in Operating Systems(HOTOS IX),pages55–60,May2003.4。
感知服务质量英语作文英文回答:Perceived service quality (PSQ) is the consumer's subjective evaluation of the superiority or inferiority of a service in relation to their expectations. It is a multidimensional concept that encompasses various aspects of a service experience, such as:Reliability: Consistency and dependability of service delivery.Responsiveness: Willingness and ability to help customers in a timely manner.Assurance: Knowledge, courtesy, and credibility of service providers.Empathy: Understanding and caring for the individual needs of customers.Tangibles: Physical evidence of the service, such as the appearance of the service provider and the facilities used.PSQ is a critical factor in determining customer satisfaction, loyalty, and repurchase intentions. It is influenced by various factors, including:Expectations: Consumers' prior beliefs and experiences with the service.Performance: The actual service delivered compared to expectations.Comparison to alternatives: Consumers' perceptions of other available options.Personality and socio-cultural factors: Individual characteristics and societal norms.Measuring PSQ is essential for organizations tounderstand customer perceptions and improve service delivery. Common methods include:Customer surveys: Collecting feedback through questionnaires or interviews.Mystery shopping: Sending undercover shoppers to evaluate service experiences.Service audits: Assessing service quality internally using standardized criteria.Organizations can improve PSQ by focusing on:Setting realistic expectations: Managing customer expectations through clear communication and realistic promises.Meeting and exceeding performance standards: Delivering high-quality service consistently and efficiently.Providing personalized experiences: Tailoring services to meet individual customer needs and preferences.Empowering employees: Giving employees the authority and resources to resolve customer issues effectively.Investing in training and development: Enhancing the skills and knowledge of service providers.By understanding and improving PSQ, organizations can enhance customer satisfaction, strengthen brand loyalty, and gain a competitive advantage in the marketplace.中文回答:感知服务质量。
SERVQUAL模型SERVQUAL为英文“Service Quality”(服务质量)的缩写。
SERVQUAL模型衡量服务质量的五个尺度为;有形资性、可靠性、响应速度、信任和移情作用。
目录展开编辑本段简介SERVQUAL理论是20世纪80年代末由美国市场营销学家帕拉休拉曼(A.Parasuraman)、来特汉毛尔(Zeithaml)和白瑞(Berry)依据全面质量管理(Total QuaSERVQUAL模型lity Management,TQM)理论在服务行业中提出的一种新的服务质量评价体系,其理论核心是“服务质量差距模型”,即:服务质量取决于用户所感知的服务水平与用户所期望的服务水平之间的差别程度(因此又称为“期望-感知”模型),用户的期望是开展优质服务的先决条件,提供优质服务的关键就是要超过用户的期望值。
其模型为:Servqual 分数= 实际感受分数- 期望分数。
SERVQUAL将服务质量分为五个层面:有形设施、可靠性、响应性、保障性、情感投入,每一层面又被细分为若干个问题,通过调查问卷的方式,让用户对每个问题的期望值、实际感受值及最低可接受值进行评分。
并由其确立相关的22 个具体因素来说明它。
然后通过问卷调查、顾客打分和综合计算得出服务质量的分数,近十年来,该模型已被管理者和学者广泛接受和采用。
模型以差别理论为基础,即顾客对服务质量的期望,与顾客从服务组织实际得到的服务之间的差别。
模型分别用五个尺度评价顾客所接受的不同服务的服务质量。
研究表明,SERVQUAL适合于测量信息系统服务质量,SERVQUAL也是一个评价服务质量和用来决定提高服务质量行动的有效工具。
编辑本段计算公式SERVQUAL计算公式:SQ = 622i = 1( Pi - Ei )式中;SERVQUAL模型SQ 为感知服务质量;Pi为第i个因素在顾客感受方面的分数;Ei 为第i个因素在顾客期望方面的分数( i = 1 、2 、3 、.....n 、n = 22) 。
感知服务质量英语作文Title: Enhancing Service Quality Perception: Strategies and Importance。
In today's competitive business landscape, the perception of service quality plays a pivotal role in shaping customer satisfaction, loyalty, and overall business success. Whether in the realm of retail, hospitality, healthcare, or any other industry, providing exceptional service is essential for gaining a competitive edge. In this essay, we will delve into the significance of service quality perception and explore strategies to enhance it.Firstly, it's crucial to understand what servicequality perception entails. Service quality perception refers to customers' subjective assessment of the overall excellence or superiority of a service. It encompasses various factors such as reliability, responsiveness, assurance, empathy, and tangibles. Customers formperceptions based on their interactions with service providers, their expectations, and their comparisons with competitors.The importance of service quality perception cannot be overstated. Positive perceptions lead to increased customer satisfaction, which, in turn, fosters customer loyalty and advocacy. Satisfied customers are more likely to make repeat purchases, recommend the service to others, and contribute to positive word-of-mouth marketing. Conversely, negative perceptions can result in customer defection, tarnished reputation, and loss of business opportunities.To enhance service quality perception, organizations can adopt several strategies:1. Understand Customer Expectations: Conduct market research, surveys, and feedback mechanisms to gain insights into customer expectations. Understanding what customers value enables organizations to align their services accordingly and exceed expectations.2. Train and Empower Employees: Employees are frontline ambassadors of the brand and play a crucial role in shaping customer perceptions. Providing comprehensive training on customer service skills, empathy, and problem-solvingequips employees to deliver exceptional experiences. Empowering them to make decisions autonomously can alsolead to quicker resolution of issues and increased customer satisfaction.3. Consistent Communication: Clear and consistent communication is key to managing customer expectations and building trust. From marketing messages to service delivery, ensuring alignment and transparency fosters positive perceptions. Timely updates regarding service enhancements, promotions, or any changes can also demonstrate commitmentto customer satisfaction.4. Personalization: Tailoring services to meetindividual customer needs and preferences enhances the perception of personalized attention and care. Utilize customer data and technology to offer customized recommendations, exclusive offers, and personalizedinteractions. This not only enhances satisfaction but also strengthens the emotional connection with the brand.5. Continuous Improvement: Embrace a culture of continuous improvement by soliciting feedback, analyzing performance metrics, and implementing necessary changes. Demonstrating a commitment to excellence and proactively addressing issues signals responsiveness and dedication to customer satisfaction.6. Invest in Technology: Leveraging technology can streamline processes, enhance convenience, and elevate the overall service experience. Implementing self-service options, mobile applications, and digital platforms can empower customers and improve accessibility. Additionally, integrating artificial intelligence and data analytics enables personalized interactions and predictive service solutions.7. Service Recovery: Despite best efforts, service failures may occur. How organizations handle these instances can significantly impact customer perceptions.Promptly acknowledging mistakes, apologizing sincerely, and offering appropriate remedies can turn a negative experience into a positive one, thereby strengthening customer loyalty.In conclusion, enhancing service quality perception is essential for organizations striving to thrive in today's competitive marketplace. By understanding customer expectations, empowering employees, fostering clear communication, embracing personalization, prioritizing continuous improvement, leveraging technology, and mastering service recovery, organizations can cultivate positive perceptions that drive customer satisfaction, loyalty, and business success.。
服务质量评价理论研究综述16商业时代(原名《商业经济研究》)2009年6期服务质量评价理论研究综述20世纪80年代初芬兰著名学者格罗鲁斯(1982)开创了服务质量研究的先河以来,国内外学者对服务质量评价理论进⾏了深⼊研究,同时在实证研究领域也进⾏了⼤量的运⽤。
但是,由于服务质量对消费者⽽⾔,⽐实物质量更难评价;服务质量的感知取决于消费者期望服务与感受服务的对⽐;质量的度量不仅仅是服务的结果,同时也涉及到服务的提供过程(A. Parasuraman,Valarie A. Zeithaml,Leonard L.Berry,1985,以下简称PZB),因此⼈们对服务质量评价理论的研究⼀直处于不断探索和发展过程中。
鉴于此,本⽂对国内外服务质量评价理论的主要研究成果进⾏梳理和总结,以期能为后续的研究提供参考。
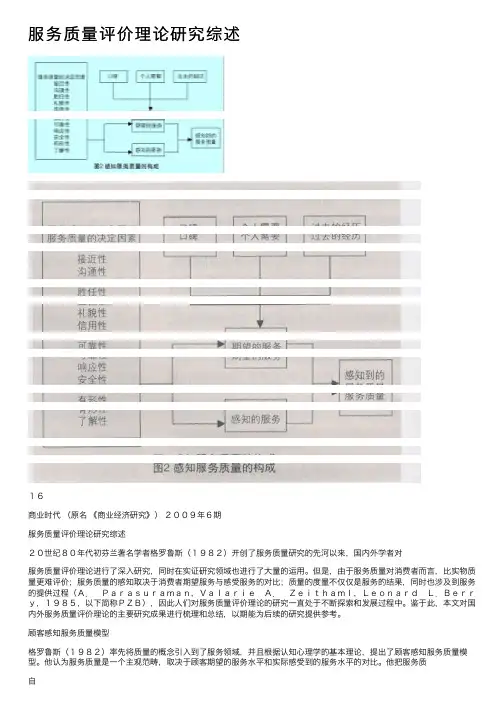
顾客感知服务质量模型格罗鲁斯(1982)率先将质量的概念引⼊到了服务领域,并且根据认知⼼理学的基本理论,提出了顾客感知服务质量模型。
他认为服务质量是⼀个主观范畴,取决于顾客期望的服务⽔平和实际感受到的服务⽔平的对⽐。
他把服务质⾃■⾼锋肖诗顺副教授(四川农业⼤学经济管理学院四川雅安625014)▲本⽂得到四川省农村发展研究中⼼课题《正规⾦融机构⼩额信贷与农民增收研究》(项⽬编号:CR0418)的资助◆中图分类号:F719⽂献标识码:A内容摘要:⾃20世纪90年代以来,服务质量研究已取得了巨⼤的成果,为企业判断并提⾼服务质量奠定了坚实的理论基础。
本⽂对服务质量评价理论研究进⾏了梳理和总结,希望能够为相关理论和实证研究提供⼀定的参考。
关键词:服务质量顾客感知服务质量模型SERVQUAL模型量分为技术质量和功能质量两类,提出了作为过程的服务和作为结果的服务:前者指顾客如何得到这种服务;后者是顾客实际得到的服务。
Lehtinen(1982,1983)先后提出了产出质量和过程质量的概念以及实体质量、相互作⽤质量和公司质量。
标题:Prioritizing service quality dimensions原文:In the “age of customer” delivering quality service is considered an essential strategy for success and survival in today’s competitive environment (Dawkins and Reichheld, 1990; Parasuraman et al., 1985; Reichheld and Sasser, 1990; Zeithaml et al., 1990). What constitutes service quality has attracted the attention of researchers all over the world. The debate continues.Even as researchers continue to debate the determinants of service quality a few important issues remain unanswered. Is there a universal set of determinants that determine the service quality across a section of services? Does the service characteristic gets reflected in what customers expect out of delivery of a particular service? Is there an inherent difference in services because they must be delivered in a particular way and does that have a bearing on what becomes important for the customer? Practitioners continue to look for advice and suggestion as to what constitute service quality for their offers and furthermore, if they tend to reposition their offers by varying some characteristics of their offers, for example, by increasing or reducing tangibility or customer contact, etc. What are the operating characteristics of determinants as they together constitute the service quality? This paper is an attempt to generate evidence if difference in services that result into peculiar service characteristics returns customers with a unique set of expectations –those different from other service types. The paper also intends to examine if the determinants of service quality show some predictable behavior as service type tend to differ based on some criterion. This paper therefore first, goes through the discussion on determinants of service quality and then, there is a small discussion on service classifications which can serve as basis for difference in service nature.Johnston (1995) suggests that one of the pressing issues before services research concerns the identification of the determinants of service quality. This should be a central concern for service management academics and practitioners, as the identification of the determinants of service quality is necessary in order to be able tospecify measure, control and improve customer perceived service quality.Early studies during 1980s focused on determining what service quality meant to customers and developing strategies to meet customer expectations (Parasuraman et al., 1985). The early pioneers of services marketing in Europe, especially the Nordic School, argued that service quality consists of two or three underlying dimensions. Lehtinen and Lehtinen (1985) referred to physical and interactive quality while Gro¨nroos (1984) identified a technical dimension, a functional dimension and the firm’s image as a third dimension. In later years, Parasuraman et al. (1988) published empirical evidence from five service industries that suggested that five dimensions more appropriately capture the perceived service quality construct. Building on the pioneering work of the Nordic School of services management and particularly Christian Gronroos, they established service quality as the core of services marketing. Their landmark article in 1985 conceptualized service quality as a gap between consumers’ ex pectations and perceptions (Parasuraman et al., 1985) and inspired many other researchers to examine the services quality construct within a marketing premise(Berry et al., 1985). However, their contribution has not gone unchallenged. Much of this interest has centered on the controversy generated by their service quality gaps model (Parasuraman et al., 1985), and particularly the SERVQUAL instrument developed to measure service quality (Parasuraman et al., 1988). Many researchers who have used the SERVQUAL instrument have been critical of its paradigmatic foundation, its convergent and discriminant validity, the use of difference scores and the use of negatively phrased items (Carman, 1990; Babakus and Boller, 1992; Peter et al., 1993; Buttle, 1995).Variations fromunidimensionality (Cronin andTaylor, 1992) to two, three, four, six and eight factor structures have been reported (Babakus and Boller, 1992; Brensinger and Lambert, 1990; Carman, 1990; Cliff and Ryan, 1994; Schneider et al., 1992). Spreng and Singh (1993) have hinted at the possible combination of some of the five dimensions due to high inter-correlations. Johnston and Silvestro (1990) went on to add the customer’s perspective to the 12 service quality characteristics. This led to the identification of an additional five service quality determinants:attentiveness/helpfulness, care, commitment, functionality, integrity; it also led to a refining of some of the other definitions. A number of other authors have also postulated their own determinants of service quality, though in some cases they appear to have been based on Berry et al.’s (1985) well publicized work.Lately, even the developers of the instrument have produced evidence confirming the doubts expressed about the five-dimensional configuration. Thus, despite the “many” studies which have analyzed the dimensions measured by SERVQUAL, “there is no clear consensus on the number of dimensions and their interrelationships.” This uncertainty hampers our understanding of service quality and casts doubts over the use of the SERVQUAL instrument in future research. It also shows that a considerable amount of research still needs to be done concerning the dimensionality of perceived service quality in general and SERVQUAL in particular, as called for by its developers (Parasuraman et al., 1994).Chowdhary and Prakash (2001) have suggested a two factors’ theory –that a more detailed approach is required wherein each factor needs to be considered independently and not as an aggregate dimension. They report evidence to support two-factor theory for services that was discarded by earlier researchers. They argue to differentiate between the factors and the outcome of performance along these factors. The study describes the two factors as “vantage factors” and “qualifying factors.” Marketers need to be selective in that certain factors behave as vantage factors while others as qualifying factors. The two are different in nature and require a differential treatment.Relative importance of dimensionsParasuraman et al. (1988) have observed that their instrument (SERVQUAL) can be used to evaluate the relative importance of the dimensions of quality in influencing customers’ overall perceptions of a service. The relative weight that customers seem to give to each quality dimension can be determined. One of the important results that have been reported in the early studies of relative importance is that customers are quite consistent in both their imputed and their direct rankings of the importance of the service quality attributes. In one key study (Parasuraman et al., 1988), reliabilitywas demonstrated to be the most important dimension and empathy (a composite of understanding and access) the least important across a seemingly wide array of service types. Zeithaml et al. (1990) also report, using a variation of SERVQUAL that tangibles proves to be consistently unimportant. A pertinent question here is that whether such a generalization is possible. Chowdhary (2000) suggest that generalizations are difficult to make because of variation in the basic nature of services (labor or capital intensity) and that the type of industry affect the design of service. It was seen that empathy and responsiveness were found to be more important for labor intensive industry while tangibles and reliability affected the assessment of quality dimensions in case of capital intensive services. This was also confirmed by the results from a similar study done for “Management Education” where the single most important dimension was the knowledge of the teacher (assurance).Services unique selling proposition can be woven around different criteria (tangibility, customization, labor intensity, etc.). This criterion in turn could be the key performance dimension. Different user groups can see each type of service in turn as performing on a number of factors across different dimensions. From among these factors, some are the key factors (KFs) and are relatively more important for the consumer. A number of these KFs could be simultaneously important for these user groups, though the relative importance of these dimensions may vary from one user group to another. There may also be a general shift in consumer preference for a dimension, for example, from “medical-care” through “patient-care” to “hospi tal-care,”incase of the consumers of healthcare. Their importance may also vary from one consumer to another.Service typesService classifications have been offered since early 1980s. Different authors have suggested different taxonomies based on different criterions. Of these four are not worthy – Chase (1978), Chase and Tansik (1983), Schmenner (1986), Wemmerlov (1990) and Lovelock (1983). Chase segments by the extent of customer contact in the delivery of the service. Schmenner classifies services using two dimensions, with the degrees of interaction (generalized from “contact”) and customization on one axis andthe degree of labor intensity on the other. Wemmerlov (1990) more recently proposed a classification scheme where the variables of differentiation are the degree of routinization of the process, the “object” of the service process, and customer contact. His operationalization of contact differs from both Chase and Schmenner in that he redefines it to be “direct” “indirect” or “no” contact with th e customer, rather than simply as “high” or “low”. Lovelock (1983) has suggested categorizing services into four distinctive categories based on what a service organization is actually processing and how does it perform that task. A service organization may be servicing individual customers or alternatively it may be servicing their possessions. Further, the servicing may be physical as in case of hair cutting or a travel by train. Alternatively, the servicing may be intangible as in case of education, entertainment or consultancy. He therefore suggests a 2 £2 classification of service processes.This scheme elaborates on how and what benefits the customer in a service transaction. This classification has tangibility of offer across the recipient of services. Why tangibility answers what benefits the customer – a tangible action or an intangible one? The second issue answers how the service benefits the customer – by service his self or his possessions. This in turn determines what the nature of a service offer is.It answers an important question whether the customers need to be mentally or physically present to receive such services. For example, the services targeted at people themselves require the presence. While tangible services require the physical presence, the intangibles can be restructured to be delivered through alternative media or at least the alternate media can be used to support the core service. Similarly, we witness the intangible services directed at possessions having greater propensity to be offered thru electronic media. Services directed at possession do not necessarily require the presence of the customer as a must. Therefore, even the tangible actions directed at possession can be redesigned as pickup services – where possessions can be picked up from customers’ location, served and returned. This eliminates the need for customers’entry into providers’ space and thus such services can be located in low cost obscure locations as against a high-presence venue. Presence (or absence) of thecustomer will also affect the demand and supply issue (Chowdhary and Chowdhary, 2005).MethodologyThe above cited literature review has discussed the service dimension and the tools to evaluate service quality. Yet it is insufficient is establishing any generic relative importance of service dimensions. Researcher believes that such a generalization may not be possible across all service types. This study seeks to make out whether some generalization is possible within service types and does that vary with classification variables. For the purpose of investigation, researcher has used Lovelock’s (1983) classification.The pertinent research question was whether the different categories of service processes show a pattern vis-a` -vis the importance of different determinants of service quality (the five dimensions suggested by Parasuraman et al.). The objective was to identify the relative importance of service quality dimensions for different service processes.For each category, four different services were identified (Table I). Thus, in all 16 services were identified. Respondents were chosen randomly. Of 16 service types, 604 respondents were approached which resulted in 396 responses. Of these, 356 responses were valid and considered proper to be used for research. Respondents were approached while they were shopping a service/services and were asked to free list what they felt was important and added value to their consumption of a particular service. A valid response from 356 respondents returned a 989 free-list items shown in Table II.In the next phase of analysis, the free list items were classified using the five dimensions of Parasuraman et al. For the purpose of this research the five service quality dimensions were defined (the Appendix). A panel of experts helped in classifying the free list items into five service quality dimensions. Panel therefore facilitated ensuring content validity for sorting the items. Panel observed the price with reference to cost, fees, charges, discounts, etc. Figured repeatedly and so it was categorized separately as the sixth dimension and was called “fees.” For a list for anyparticular service type, we could now generate the relative importance matrix using tally marks. These were then converted into percentage scores. Thus, we could get a score for each dimension for each service type (Table III). Similarly, the score were calculated for each service process category.出处:Nimit Chowdhary and Monika Prakash.Prioritizing service quality dimensions[J].Managing Service Quality,2007,17 (5), 2007:pp.493-509.标题:服务质量方面的优先次序译文:在“客户时代”,提供优质服务被认为是一种在这个竞争激烈的环境中成功和生存的必要策略,(Dawkins和Reichheld,1990;Parasuraman等,1989;Reichheld和Sasser,1990;Zeithaml等,1990)。
2004年12月第27卷增刊北京邮电大学学报Journal of Beijing U niversit y of Posts and T elecommunicat ions Dec.2004Vol.27Sup. 文章编号:1007-5321(2004)增-0135-05服务质量管理方法及应用陈 麒, 詹志强(北京邮电大学网络与交换国家重点实验室,北京100876)摘要:通过分析电信业务的服务质量管理内容,提出了一种通用的服务质量管理方法,研究了此方法在IP V PN(虚拟专用网)服务质量管理中的应用,并通过设计实现基于M PL S(多协议标记交换)的IP V PN 业务运营管理原型系统,验证了此服务质量管理方法的有效性.关 键 词:服务质量;服务质量管理;I P 虚拟专用网中图分类号:T N 915 文献标识码:A收稿日期:2004-09-02基金项目:国家自然科学基金项目(60202003,90204002);国家杰出青年科学基金项目(60025104)作者简介:陈麒(1979)),女,硕士生. E -mail:iamchen qi@詹志强(1976)),男,讲师. E -mail:B0073061@A Method for S ervice Quality Management and Its ApplicationCHEN Qi, ZHAN Zh-i qiang(State Key Laboratory of Netw ork i ng and Sw i tching,Beiji ng University of Pos ts andT elecommunications,Beijing 100876,Chi na)Abstract :The management context of telecommunication service quality is analyzedcarefully and an al-l purpose management method for service quality is put forword.Themethod is used in the service quality management of IP VPN(virtual private netw ork),results of ex perimentation based on IP VPN service operations management prototypeshow the validity of the method.Key words :service quality;serv ice quality management;IP virtual private network0 引 言下一代网络中电信运营管理的一个重要特征是面向客户、服务的管理取代面向设备、网络的管理成为运营管理的重点,其中提供全面可靠的服务质量保证是服务管理的核心问题.服务提供商(SP,service provider)运营环境复杂多变、业务种类繁多、特性各异,因此有必要建立一套通用可行的服务质量管理方法,以提高SP 服务质量管理的可靠性和高效性.因此,对服务质量管理方法的研究具有重要的现实意义.目前国内外对服务质量管理方法的研究比较少,TM F GB 917[1O 3]提出了服务等级协定(SLA,service level agreement )以解决客户和SP 之间关于服务质量保证的问题,136北京邮电大学学报第27卷T MF GB921[4]定义了基于eT OM商务处理框架的服务质量保证流程,但仅提出了贯穿业务生命周期的服务质量管理方法的抽象概念和需求,缺乏实施细则,无法直接指导实际管理工作.当SP采用服务质量管理方法进行服务质量管理时,必须考虑具体业务的特性引发的特殊管理需求,这也是目前服务质量管理中的一个难点问题.以具有大量业务需求和广泛应用前景的IP VPN业务为例,IP VPN业务属于多服务接入点(SAP,service access point)业务[2],每个SAP的重要性可以不同;通过同一个SAP向用户传递的业务流(如音频流、视频流、数据流),由于其流特性差异对应不同的业务质量(QoS,quality of service)[5]等级,因而对QoS参数的要求各异.IP VPN服务质量管理应该支持其多SAP、多QoS等级的特性.1服务质量管理方法研究服务质量管理方法之前,首先需要界定服务质量管理的内容.目前,SLA广泛应用于服务质量管理中,是解决客户和SP有关服务质量保证问题的全套解决方案,包括性能测量、客户关怀、计费等方面.本文讨论SP如何保证服务质量达到客户满意的要求.服务质量管理是业务管理的核心功能,贯穿业务及SLA生命周期[2]的全过程,在业务开发、销售、订购、运行、评估、终止6个阶段分别进行下述管理工作.(1)业务开发阶段:建立服务质量指标评价体系.服务质量指标评价体系定义了分层管理系统中,从资源管理层、业务管理层到客户管理层[4]对质量相关数据进行采集、过滤、分析、综合的全过程,实现对服务质量科学、全面、定量的评价.(2)业务销售阶段:定制个性化的指标评价体系.服务质量管理以客户为中心,支持客户更改评价体系中的部分指标取值,体现服务质量管理灵活性的特点.(3)业务订购阶段:根据指标评价体系进行业务配置工作.(4)业务运行阶段:指标相关数据的采集分析.触发服务质量保证流程[4],流程管理与指标评价体系相结合以保证向客户提供定制的服务质量.(5)业务评估阶段:指标评价体系变更.定时对业务进行评估,根据客户或SP需要更改指标评价体系,重复业务生命周期中前4个步骤的工作.(6)业务终止阶段:指标评价体系存档.当SP停止提供某种业务时,需要保存该业务的指标评价体系,以便将来开发新业务时参考.通过上述分析可知,对服务质量指标评价体系的管理是服务质量管理的基础和核心.基于此提出如图1所示的服务质量管理方法,贯穿服务质量管理准备、服务质量管理执行、服务质量管理评估等阶段.该方法围绕对指标评价体系的管理,实现对服务质量的量化评价,指导SP 调整管理策略和管理方案,最终为客户提供个性化的服务质量保证.该服务质量管理方法的执行步骤如下所述.(1)服务质量管理准备阶段:建立客户定制的服务质量指标评价体系,确定服务质量指标、指标门限及评价算法.指标反映了使用单次服务时的性能,或者某段时间内服务的平均性能.指标选取应综合考虑SP网络状况、业务特性和客户需求,指标定义要准确无歧义,并保证通过现有的测量计算方法能够获取指标值.指标门限是指标取值的权限值或平均值,大部分由SP限定.当指标值在门限限定范围内,服务的相关质量满足要求,否则可能引起质量降级甚至SLA违例.评价算法对各项指标及其关系进行分析综合,提供明确的服务总体质量评价,客户图1 服务质量管理方法可调整评价算法中某些参数值,如权重、上报周期等.(2)服务质量管理执行阶段:根据指标评价体系采集分析数据.按数据来源、数据特性选择适用的采集方法;按管理需要对采集的海量数据进行过滤、关联、计算,定义过滤策略、关联规则、统计分析时间段、统计方法,最终使用评价算法获得综合评价值.(3)服务质量管理评估阶段:完善服务质量指标评价体系.当业务开通并投入实际使用后,需要根据客户反馈及实际运营情况对网络配置、算法定义、门限取值和指标选取做出调整.评估分2种类型)))基于客户的评估和基于业务的评估.基于客户的评估针对某个客户的某个业务实例,更改网络配置或指标门限值;基于业务的评估则面向对SP 提供的某种业务,可能涉及多方面的调整.由此可见,采用上述服务质量管理方法,能够实现对服务质量的周期性管理,满足SP 和客户双方对服务质量管理的要求.2 服务质量管理方法应用下文讨论上述服务质量管理方法在IP VPN 业务管理中的应用.2.1 IP VPN 服务质量管理准备首先分析IP VPN 的应用场景和业务特性.本文研究基于Dif-f Serv 模型的MPLS P BGP IP VPN 业务,客户站点(sites)通过客户边缘设备(CE,customer edge dev ice)接入到提供商边缘路由器(PE,provider edge router),SAP 位于PE 与CE 相连一端.具有数据通信要求的站点两两间存在一条逻辑链路,逻辑链路是2个SAP 之间的逻辑连接,可能对应多条物理链路.SAP 业务流是从源SAP 到目的SAP 的单向业务流的集合,一个连接n 个对等站点的客户站点具有n 个SAP 业务流.对于单个SAP 业务流,根据传递业务的流特性不同具有不同的QoS 参数要求[6],IP VPN 中应定义多种QoS 业务等级,以满足传递不同业务媒体流的需要.本文使用流量中继(traffic trunk)的概念表示通过同一个SAP 递交,具有同一QoS 等级,经过同一条标记交换路径(LSP,label sw itch path)传送的业务流集合.基于以上分析,定义了5类IP VPN 服务质量指标:¹流量中继相关指标.包括流量中继的QoS 参数、流量参数及故障参数.ºSAP 业务流相关指标.描述一个SAP 业务流中所有流量中继的综合质量.»逻辑链路相关指标.一条逻辑链路包含2个方向相反的SAP 业务流,逻辑链路相关指标反映2个客户站点间传递业务的总体质量.¼客户站点相关指标.客户站点相关指标以所有相关的SAP 业务流质量为评价基础.½业务集合相关指标.它基于以上各分类指标,是对IP VPN 业务的综合评价.图2描述了IP VPN 服务质量指标及其关系,VPN 业务综合质量、逻辑链路综合质量、客137 增刊陈 麒等:服务质量管理方法及应用户站点综合质量、SAP 业务流综合质量分别由各自对应的指标描述,主要是服务可用性和综合质量评价值.流量中继质量是IP VPN 服务质量的基础,流量中继相关指标分为网络性能相关、服务性能相关、流量性能相关3类.网络性能相关指标是IP VPN 的QoS 等级中定义的QoS 参数,描述SP 网络提供用户间通信功能的能力;服务性能相关指标体现服务的可靠性,包括网络提供的通信传输服务满足承载业务需求的能力和网络自身的操作维护能力;流量性能相关指标描述了IP 流在端到端路径上给定点的流量特征,体现流量的测量和监控.图2 IP VPN 服务质量指标IP VPN 服务质量指标门限的确定与指标分类相关.网络性能相关指标门限值由流量中继采用的QoS 等级决定,客户可以选择一种或多种QoS 等级,从而间接决定门限值,而QoS 等级划分及其门限值可参考文献[6,7]中的定义;服务性能相关指标门限由SP 根据网络运营经验确定;流量性能相关指标的门限受SP 网络现状约束,也与客户传送的业务流类型有关.最后定义服务质量评价算法,对IPVPN 总体服务质量做出定量评价.2.2 IP VPN 服务质量管理执行IP VPN 服务质量管理执行阶段采集分析质量相关数据.参照分层管理模型,数据传递自底向上,跨越资源管理层、业务管理层和网络管理层.为获取网络性能相关指标,采用主动测量或被动测量方法[7]采集IP 网络性能参数,经资源管理层的管理系统处理后上报基于流量中继的采样周期网络性能相关指标平均值;同时,资源管理层管理系统进行告警过滤,去除不影响服务质量的告警信息,并进行告警关联,最终向业务管理层上报影响服务质量的故障信息,如故障发生时间点、故障修复时间点;流量性能相关指标则是由资源管理层直接上报.客户可随时查询当前业务状态,并获取定制的IP VPN 服务质量报表.执行IP VPN 服务质量管理时,必须把IP VPN 服务质量指标评价体系融入流程管理[4]中.实际运营中,服务质量保证场景可分为客户查询、客户投诉、网络监控3类.如图3所示,网络实时监控过程中,SP 主动发现引发SLA 违例的网络性能降级和故障时,触发了服务质量管理流程.该流程中涉及到的功能模块有:资源管理层的资源性能管理模块、资源故障管理模块;业务管理层的QoS 管理模块、业务故障管理模块;客户管理层的客户SLA 管理模块.2.3 IP VPN 服务质量管理评估IP VPN 服务质量管理评估既是服务质量管理的最后一个步骤,也是下一个服务质量管理周期的开始.基于客户评估时,SP 考察单个客户使用VPN 业务的服务质量满意度、服务质量改善潜力和客户需求变化,针对客户需求和网络状况调整该客户的指标门限、网络配置等.基于业务评估时,SP 对一段时间内所有IP VPN 业务实例的指标值、客户满意度、业务收益进行统计分析,判断现有的评价体系能否真实、准确地反映IP VPN 业务的运营状况,评价结果是否与客户感知的业务性能相吻合,业务运营能否获得预期效益,根据这些评估结果对服务质138北京邮电大学学报 第27卷图3 IP V PN 服务质量保证流程实例的时序图量指标评价体系进行调整.3 结 论本文分析了服务质量管理内容,基于此提出一种通用的服务质量管理方法,并研究该方法在IP VPN 服务质量管理中的应用.这种服务质量管理方法在/基于MPLS 的IP VPN 业务运营管理原型系统0中得到了应用.实践证明,该方法能对IP VPN 服务质量进行有效管理,提供可靠的服务质量保证.此研究具有一定的通用性,为电信服务质量管理的实现提供了指导.参考文献:[1] T M F G B 917-1v2.0)2004,SL A management handbook -v olume 1ex ecutiv e overv iew [S].[2] T M F G B 917-2v2.0)2004,SL A management handbook -v olume 2concepts and pr inciples[S].[3] T M F G B 917-3v2.0)2004,SL A management handbook -v olume 3serv ice and technolog y examples[S].[4] T M F G B 921v4.0)2004,Enhanced telecom operations map(eT O M )the business process fr amewor k[S].[5] IT U -T Rec E.800)1994,T erms and definit ions related to quality of ser vice and netw ork performance in -cluding dependability[S].[6] IT U -T R ec G.1010)2001,End -user multimedia QoS categories[S].[7] IT U -T Rec M.2301)2002,P erformance objectiv es and procedur es fo r pro visioning and maintenance of I P -based netw orks[S].139增刊陈 麒等:服务质量管理方法及应用。
国外服务质量理论研究综述-权威精品本文档格式为WORD,感谢你的阅读。
最新最全的学术论文期刊文献年终总结年终报告工作总结个人总结述职报告实习报告单位总结【摘要】过去20年国外关于服务质量问题的研究已取得了丰厚的成果,这将促进我国学者对其继续深入研究,本文在整理国外相关文献的基础上,对服务质量理论进行综述。
【关键词】服务质量;PZB;研究综述一、服务质量的定义北欧学派代表人物克里斯丁·格罗鲁斯(Christian Gronroos)于20世纪80年代提出顾客感知服务质量的概念并对其构成进行了详细的研究,从而完成了对服务管理与科学中最重要概念的界定,由此也标志着对顾客感知服务质量管理研究的全面开展。
查阅国外的相关文献,发现学者们对顾客感知服务质量和服务质量这两个概念是交替使用的。
因此本文也将顾客感知服务质量简称为服务质量。
20世纪70年代后期开始,服务质量问题引起了众多学者的关注,他们从不同角度提出了服务质量的概念。
代表性的观点如表1所示:综合以上各学者对服务质量的定义,可以看出绝大多数学者都认同服务质量是消费者对提供的服务所产生的认知的一种主观结果。
二、服务质量的构成要素关于服务质量的构成要素,比较有影响的是A.Parasuraman,Valarie A.Zeithaml和Lonard L.Berry三位学者的研究,三位学者在服务质量管理与评价方法领域做出了很多有影响的研究,本文也借鉴了三位学者的许多观点,为了便于说明,在引用他们的原文或观点时将三位学者简称为PZB。
PZB(1985)认为服务质量对消费者而言,比产品质量更加难以评估,而且服务质量的认知是来自于消费者期望与实际服务表现的比较,服务质量的评估不仅仅是结果的评估,还包含了服务传递过程的比较。
三位学者通过对银行、信用卡、证券经纪和产品维修等四种服务业进行深入访谈,提出了“十项服务质量构成因素”:(1)可靠性:每次服务质量的一致性程度,包括服务结果和可信性的一致,以及是否能如企业所承诺顾客的、在约定的时间内和质量要求下完成。
国外服务创新研究综述陈超旅游管理11211158 【摘要】:服务业越来越成为各国经济增长和国民福利提升的重要驱动。
随着SD逻辑的兴起,服务的范畴也跨越原有的局限,在更多行业范畴中发挥重要的角色。
服务创新作为服务企业发展的根本形式,在国内外得到了众多学者的关注,其研究也经历了从制造业语境到服务业语境的转变。
本文根据国外已有研究成果,对服务创新的概念、制造业语境中的服务创新研究、服务语境中的服务创新研究做了综述。
综述的研究范围涵盖营销、运营、战略等范畴。
【关键词】:服务创新综述国外一、引言“服务创新”(Service Innovation)作为一个边界明确的研究领域正焕发出活跃的生命力。
虽然关于创新(Innovation)的探讨可以追溯到Schumpeter (1934)时代,但学者们对创新发生在服务领域中的关注则不到30年(Barra,1986,1990)。
并且,早期对服务创新的探讨是制造业语境的,研究者更多的将服务作为制造业创新或产品创新的途径进行研究(Vandermerwe and Rada1988, Quinn et al., 1990,Mathe and Shapiro, 1993)。
直接对服务情境中创新的发生进行关注的研究则直到近十年来才开始出现(Sundbo and Gallouj, 2000;Thomke, 2003;Zeithaml and Bitner, 2003;Gronroos, 2007;Lovelock and Wirtz, 2007)。
并且,过去有关服务创新的研究,其核心命题也并非从整个服务宏观框架出发来审视创新的过程、机制、模式、驱动因素以及影响因素。
而是在对服务相关的诸多要素进行研究时,将创新在某个领域的发生作为了研究的部分构成而被提及。
这种情况的发生在如客户管理(Zeithaml and Bitner, 2003;Parasuraman et al., 1985; Berry and Parasuraman, 1991; Gronroos, 2007; Lovelock and Wirtz, 2007), 服务管理(Levitt, 1972; Quinn et al., 1990, 1994; Heskett et al.,1997; Lovelock, 1984) 以及运营管理(Chase, 1981)等领域。
25卷第10期2008年10月微电子学与计算机M ICROELECTRONICS&COM PUTERVo l.25N o.10October2008收稿日期:2008-04-21一种多约束服务质量路由算法包学才1,戴伏生2,胡剑锋1(1江西蓝天学院信息技术研究所,江西南昌330098;2哈尔滨工业大学(威海)信息学院,山东威海264209)摘要:下一代网络服务质量要求解决多约束服务质量路由问题.在分析了服务质量路由特点及相关工作的基础上,提出服务质量路由新计算方法.方法基于路径计算,首先计算最少跳路径,然后利用非线性花费函数进行求解并判断约束路径,最后求出优化多约束路径.通过对网络拓扑状态仿真结果表明,该算法能快速求解在多约束条件下优化路径,约束参数扩展性好.关键词:多约束路由;NP完全问题;可扩展性;复杂度中图分类号:T N915.05文献标识码:A文章编号:1000-7180(2008)10-0147-04A Mult-i Constrained Quality of Service Routing AlgorithmBAO Xue-cai1,DAI Fu-sheng2,HU Jian-feng1(1Institute of Information T echnology,Jiangx i Bluesky U niversity,N anchang330098,China;2College of Infor mation,Harbin I nstitute of T echnolog y(W eihai),W eihai264209)Abstract:Quality of service(Q oS)of nex t-generation networ k(NGN)need to solve the a challenging problem for quality of serv ice rout ing.A new method of routing computation was proposed based on analy zing the strait of quality of service and relative research.T he met hods computed first ly the shor test link pat h and then used no n-linear ener gy function to seek ex actly and judge the mult-i constrained condition.L astly it seeks a mult-i constrained optimum path.Extensive simu-lations by networ k state show that the alg orithm can quickly seek a mult-i constrained optimum path and has good scalabil-i ty for mult-i constrained parameters.Key words:mult-i constr ained routing(Q oSR);NP complete problem;scalability;complex ity1引言为了提供高性能、高质量服务,下一代Internet 面临着极大的挑战,必须能够提供服务质量和带宽保障.因此,端到端的IP服务质量(quality of ser-vice,QoS)是研究的重点[1].服务质量路由(quality of service routing,QoSR)是提供服务质量的重要部分,算法为当前和未来的网络多媒体应用提供一个高效、安全、合理的解决方案.QoSR要求同时考虑多个约束参数,因此QoSR 问题又称多约束路径选择问题.寻找一条同时满足多种约束条件的路径具有NP完全的复杂度.因此许多学者试采用启发式算法进行了求解[2-3].但多数算法是把许多约束参数化为单一线性函数求解或基于二个约束参数,而二个约束中包括一个凹性约束参数如带宽.其他的算法有Jaffe近似算法[4]、TAM CRA[5]等算法.Jaffe算法首先构造线性函数把多约束参数化为单一约束值.TAMCRA算法提出基于通过非线性花费函数计算最短路径,并根据K个最短路径非支配原则进行最优路径求解.H-M COP[6]算法是基于线性花费函数和在TAMCRA/SAM CRA[7]算法中提出的非线性花费函数结合的基础上启发式求解最优路径,两次使用扩展Dijkstra算法.目前算法都是基于贪婪算法进行搜索,不能保证准确地找到最优路径[8].文中从网络约束参数的性质、TAMCRA算法中提出的非线性花费函数、Dijkstra算法不能在非线性花费函数下求解最短路径这三个特点出发,提出一种单播多约束路由算法并进行分析和总结,针对网络中难以解决的加性约束(乘性约束可取对数化简为加性约束)及非线性花费函数是要求先计算出一条完整的源到目的节点路径才能精确求解等问题,设计了该算法,通过仿真分析论证该算法的可行性.2新计算方法2.1问题描述为研究路由算法,将网络中的交换节点、链路、链路属性抽象为图,用有向图G(V,E)表示.其中V为节点集,元素v I V称为图G的一个顶点(节点);E为弧集,e ij元素为一条链路.在QoSR中给每个链路e ij关联上一组相互无关的权值(w1(e ij), w2(e ij),,,w k(e ij)),称为链路的QoS度量,简写为w(e ij),其中w l(e ij)为路径约束类型度量,对1 [l[k.也就是说,对于路径p=v0y v1y,y v n,权值w l(e ij)=E n i=1w l(v i-1y v i)满足可加性[3].定义1多约束路径.假定一个QoS请求的多个约束条件为L j,j=1,2,,,m,考虑一个网络G(V,E),从源顶点S到目标顶点T找到一条路径P,若P满足w j(P)E(u,v)I p w j(u,v)[L j(j= 1,2,,,m),则P称为满足QoS请求的可行路径.若要从多条可行路径中找到最优路.则称多约束最优路径问题.定义2非性性花费函数w(P)= max(w1(P)/L1,w2(P)/L2,,,w i(P)/L i)),称w(P)为非线性花费函数,其中(L1,L2,,,L i)为QoS请求的多个约束条件;这里P是指一个路径集,当取min(w(P))则就是确定最优路径.在多约束路由算法中,基于两个或两个以上加性约束的问题是NP难问题,所以从加性约束这个问题出发,如果先计算出源节点到目的节点间最少的串联路径,那么加性值在很大程序上是最小的,那么再进行约束判断就能很好的求出最优路径.从这个思想出发,以下具体描述新算法. 2.2计算方法根据实际网络的拓扑特点及多个约束参数的特征,设计先计算源目的节点间的从最小跳的路径集,在进行多约束计算时可利用非线性函数进行优化.具体算法规则如下:(1)连接分组的初始化设网络G(V,E)有n个节点,节点序号为1,2, ,,n.假设1号节点为源节点S,n号节点为目的节点T,其他为中间节点.建立n个节点的连接分组: M1(1)=[m12(1),m13(1),,,m1(n-1)(1)]M2(1)=[m22(1),m23(1),,,m2(n-1)(1)],,M n-1(1)=[m(n-1)2(1),m(n-1)3(1),,,m(n-1)(n-1)(1)]M n(1)=[m2n(1),m3n(1),,,m(n-1)n(1)].式中,M1(1)括号中的1表示各节点的连接链路数,下标1是表示节点1到其他节点的连接关系,m i j(1)表示节点i到节点j直接连接关系,标号i与j不区分前顺序,因为这里假定网络图是双向的.把n个节点网络的连接分组分成三个部分,第一个部分是M1(1)表示源节点S到中间各节点的直接连接关系,第二部分:M2(1)M n-1(1)表示中间各节点间直接关系,第三部分是M n(1)中间各节点到目的节点的直接连接路径集.分组中元素的初始表达式按照如下定义得到:#当i=j时,表示节点本身,不涉及链路,则元素初始表达式为m ij(1)=0;#当节点i y j方向无直接连接链路时,则元素初始表达式为m ij(1)=0;#当节点i y j方向的直接连接链路时,则元素初始表达式为m ij(1)=i;(2)连接分组运算及路径计算公式逻辑代数表示路径的规定:用/#0表示/与0逻辑运算关系,用/+0表示/或0逻辑运算关系./与0逻辑又称为逻辑乘积,多个变量符号的逻辑乘积,表示路径是由这些变量符号代表的链路串联构成的. /或0逻辑又称为逻辑和.在/与或0逻辑表达方式的路径表达式中,有多少个逻辑乘积项求和,就表示同时存在多少条路径.下面R i(P)表示源节点到目的节点中经过的i条链路的路径集,设P n(j)= [p2n(j),p3n(j),,,p(n-1)n(j)]表示用于保存中间各节点到目的节点n经过j条链路到达目的节点的路径集,j=1,2,,,n-1.并初始化P n(1)= M n(1),即p2n(1)=m2n(1),p3n(1)=m3n(1), ,,p(n-1)n(1)=m(n-1)n(1).求从源节点s到目的节点t之间需要串联i条链路(2[i[n-1)的路径按照下式计算:R i(P)=M1(1)#P n(j-1)=m12(1)#148微电子学与计算机2008年p2n(p-1)+m13(1)#p3n(p-1)+,+ m1(n-1)(1)#p(n-1)n(p-1)(1)求各中间节点到目的节点t之间需要串联j条链路(2[j[n-2)的路径按照下式计算: P n(j)=M i(1)#P n(j-1)=[(m22(1)#p2n(j-1)+m23(1)#p3n(j-1)+ ,+m2(n-1)(1)#p(n-1)n(j-1)),(m i2(1)#p2n(j-1)+m i3(1)#p3n(j-1)+ ,+m3(n-1)(1)#p(n-1)n(q-1)),,(m(n-1)2(1)#p2n(q-1)+m(n-1)3(1)# p3n(q-1)+,+m(n-1)(n-1)(1)#p(n-1)n(q-1))](2)通过上述两公式来回迭代计算即可求出依次源节点到目的节点串联1~n-1条链路的所有路径,在应用于多约束计算时,可以采用方法和利用非线性花费函数进行优化,将很大程度上减少计算时间,具体运用步骤及实例如下描述.3多约束路由的计算步骤从以上算法中可以得出在n个网络节点中源节点经过1到n-1条链路到达目的节点的所有路径.根据多约束加性约束及非线性函数求解最优路径的特点,可以开始从计算1条链路到达目的节点起就判断是否满足约束条件,删除不满足的路径,只保存当前链路数到达目的节点的一条最优路径,如果满足就退出算法,输出路径满足约束路径.如要输出最优路径,最后从满足约束条件的路径集中输出最优路径.具体基于新计算方法的多约束路径计算步骤如下:(1)初始化R1(1)及连接分组M1(1),M i(1), M n(1);i=2,,,n-1.P n(1)=M n(1);(2)R2(P)=M1(1)#P n(1)=m12(1)# m2n(1)+m13(1)#m3n(1)+,+m1(n-1)(1)# m(n-1)n(1),可以得出源节点S经过两条链路到目的节点T.(3)根据式(2)计算出P n(j)=M i(1)#P n(j -1),并根据前面定义的非线性花费函数判断是否满足QoS请求约束条件,删除不满足条件的中间节点到目的节点路径,并根据非线性花费函数分别只保存一条中间节点到目的节点满足的条件的最优路径,保存P n(j)进入第四步.(4)将上一步求出的P n(j)代入式(1)求解源节点到目的节点的路径集,判断是否满足QoS请求约束条件并保存,再利用非线性函数保存当前链路数到达目的节点的路径,并做好标记,如不需要计算最优路径可退出.如需计算最优路径,进入第3步继续计算并判断,如果上次标记的最优路径未更新,则输出该最优路径,并退出计算.4算法分析从仿真上看,该算法根据TAMCRA/SAMC RAM算法提出的非线性函数可以精确计算出最优路径,从仿真分析得出满足加性约束的路径一般在较短的路径中,而该算法就是从最短链路开始计算,所以根据用户输入的链路约束控制要计算的链路的长度,人为可以控制计算时间.在呼叫次数逐步增加的情况下,对不同网络进行验证时,发现通常满足约束中最优的链路较少的路径中.网络模型采用模拟现实网络的Wax man算法随机产生的拓扑图,连接度数由算法进行控制,上述仿真平均连接度限制在4以内.链路约束根据设置范围随机产生.该算法能准确计算优化路径并且时间复杂度合理.算法时间复杂度方面,假设在网络G(V,E)中,d表示网络中各节点的最大度数.n为节点个数,K为算法根据请求输入的约束条件确定计算的路径链路长度,那么该算法的时间复杂度O(K@d @n),K值小于n-1.5算法性能评价算法思想基于最小跳的计算思路,算法采用非线性花费函数优化后,找到可行路径即退出运算.为了更好地验证算法的性能,第一方面从求满足多约束路径的平均运行时间度上进行比较,第二方面从求最优路径的成功率仿真上分析.为了更好地验证算法的性能,对该算法与H M COP算法进行对比分析.具体的仿真采用Wax-man算法的随机生成图,仿真图节点数分别为30~ 50,50~70.每个节点数网络仿真次数200.链路状态产生范围1~10请求范围30~40.图1为30~50个节点下平均运行时间的比较,图2为50~70个节点下平均运行时间的比较.为进一步分析算法的性能,在节点数为50~70的网络下,每个网络运行5000次的情况下,链路随149第10期包学才,等:一种多约束服务质量路由算法图1 30~50节点网络下的平均运行时间比较情况图2 50~70节点网络下的平均运行时间比较情况机产生值范围及请求值如上仿真一致,得到的成功率对比如图3所示.图3 算法成功率分析6 结束语QoSR 是QoS 中的关键技术,QoSR 是一个NP 完全问题,至今没有很好的算法[4].文中提出基于路径新算法的多约束路由算法,由于可以优化计算出满足约束路径及最优路径,可在计算过程根据约束请求进行链路长度控制,增加了算法应用的灵活性.多约束路由算法遵循了最少链路路径的优先选择原则,因此只要把加性约束减到一个参数可以与目前网络中采用的OSPF 路由协议兼容,既可以用于源路由的计算,也可以用分布式路由的计算.以上仿真表明,当进行多约束计算时,根据TAMCRA 算法中提出的非线性函数,找到可行路径就退出运算时,该算法时间复杂度优于H MCOP 算法并且约束参数有较好的扩展性.参考文献:[1]江昊.Internet Q OS 路由的研究[D ].武汉:武汉大学,2004.[2]朱翠涛,高靓,汪汉新.多约束QoS 移动IP 最优路由的求解[J].计算机应用,2007,27(5):1180-1182.[3]贾艳萍,孟相如,麻海圆,等.基于M P LS 流量工程的多路径约束负载均衡方法[J].计算机应用,2007,27(3):522-524.[4]Jaffe J M.Algo rithms fo r finding paths with mult iple con -str aints[J].N etworks,1984(14):95-116.[5]De N eve H,V an M ieghem P.T AM CRA :a tunable accu -racy multiple co nstr aints routing algorithm [J].Computer Communicatio ns,2002(23):667-679.[6]Kor kmaz T ,Krunz M .M ulti -constrained optimal pathselection[C ]//Proc.IN FOCOM 2001.A ncho rage,A K,2001(2):834-843.[7]Van M ieghem P,Kuipers F A.Concepts of ex act qualityof service algorithms[J].I EEE/ACM T ransaction on Net -w orking ,2004,12(5):851-864.[8]Feng G.On the performance of heur istic H -M COP formulti-constr ained optimal-path QoS routing [C]//18th Intor national Corference on A duanced Infor mation M et -w orking and Appligting.Beijing,2004(2):50-53.作者简介:包学才 男,(1983-),助教.研究方向为下一代通信网路由算法.戴伏生 男,(1963-),副教授,硕士生导师.研究方向为通信网与通信电子系统.150微电子学与计算机2008年。
n e t 527.cn咖啡小猪Quality of ServicePart 1 基础知识CoS IP Precedence DSCPThe classification is carried in the IP packet header, using 6 bits from the deprecated IP type of service (ToS) field to carry the classification (class ) information. Classification can also be carried in the Layer 2 frame.•Prioritization bits in Layer 2 frames:Layer 2 Inter-Switch Link (ISL) frame headers have a 1-byte User field that carries an IEEE 802.1p class of service (CoS) value in the three least-significant bits. On interfaces configured as Layer 2 ISL trunks, all traffic is in ISL frames.Layer 2 IEEE 802.1Q frame headers have a 2-byte Tag Control Information field that carries the CoS value in the three most-significant bits, which are called the User Priority bits. On interfaces configured as Layer 2 IEEE 802.1Q trunks, all traffic is in IEEE 802.1Q frames except for traffic in the native VLAN.Other frame types cannot carry Layer 2 CoS values.Layer 2 CoS values range from 0 for low priority to 7 for high priority. •Prioritization bits in Layer 3 packets:Layer 3 IP packets can carry either an IP precedence value or a Differentiated Services Code Point (DSCP) value. QoS supports the use of either value because DSCP values are backward-compatible with IP precedence values. IP precedence values range from 0 to 7.0 routine 1 priority 2 immediate 3 flash 4 flash-override 5 critical 6 internet 7 network DSCP values range from 0 to 63.Part 2 QoS of Routern e t 527.cn咖啡小猪A.流量分类技术 Classification工具分类选项备注配合技术 access-list protocolsource source-wildcarddestination destination-wildcard [precedence precedence ] [tos tos ] [log ]隐性拒绝 CAR Queueing route-map class-map access-list rate-limitprecedence mac-address exp mask maskCARroute-map match length min maxmatch ip address {access-list-number }If there is no match, packets will be routed as usualPBRclass-map match-all match-any match access-group match input-interface match class-mapmatch ip dscpmatch ip precedencematch cosmatch packet length {max max| min min}match protocol (NBAR) class-default classpolice-map class-map police-mapclasspolice-map map-classaccess-list (IP extended)access-list access-list-number [dynamic dynamic-name [timeout minutes ]] {deny | permit } protocol source source-wildcard destination destination-wildcard [precedence precedence ] [tos tos ] [log | log-input ] [time-range time-range-name ] [fragments ]access-list rate-limitaccess-list rate-limit acl-index {precedence | mac-address | exp mask mask } acl-index Specifies the access list number. Classification options are as follows: • For IP precedence, use any number from 1 to 99. • For MAC address, use any number from 100 to 199.The following example assigns any packets with a MAC address of 00e0.34b0.7777 to rate-limit access list 100:access-list rate-limit 100 00e0.34b0.7777对IP 优先级为3 的出站流量进行限速: interface Serial1ip address 10.0.0.1 255.255.255.252rate-limit output access-group rate-limit 1 20000000 24000 32000 conform-action transmitexceed-action drop !access-list rate-limit 1 3 (基于限速ACL )对于源mac 地址是00e0.34b0.7777的流量进行限速 interface Fddi2/1/0rate-limit input access-group rate-limit 100 80000000 64000 80000 conform-action transmit exceed-action drop ip address 200.200.6.1 255.255.255.0 !access-list rate-limit 100 00e0.34b0.7777 (基于限速ACL )route-mapRouter(config)# route-map map-tag [permit | deny ] [sequence-number ] Router(config-route-map)# match length min max • Matches the Level 3 length of the packetn e t 527.cn咖啡小猪Enabling local PBRPackets that are generated by the router are not normally policy-routed. Router(config)#ip local policy route-map map-tagclass-mapclass-map [match-all | match-any] class-map-name •默认是match-allThe following example specifies class101 as the name of a class, and it defines a class map for this class. The class called class101 specifies policy for traffic that matches access control list 101. class-map class101match access-group 101NBAR (Network-Based Application Recognition )NBAR is a classification engine that recognizes a wide variety of applications, including web-based and other difficult-to-classify protocols that utilize dynamic TCP/UDP port assignments.NBAR 支持的分类:Classification of applications that dynamically assign TCP/UDP port numbersClassification of http traffic by url, host, or multipurpose internet mail extension (mime) type Classification of citrix independent computing architecture (ICA) traffic by application name Classification of application traffic using subport informationThe NBAR feature does not support the following:More than 24 concurrent urls, hosts, or mime type matchs Matching beyond the first 400 bytes in a url Non-IP trafficMulticast and other non-CEF switching modes Fragmented packetsPipelined persistent http requestsURL/HOST/MIME/classification with secure http Asymmetric flows with stateful protocolsPackets originating from or destined to the router running NBARNBAR is not configurable on the following logical interfaces: Fast etherchannel,interface where tunneling or encryption is usedVLANs, NBAR is configurable on vlans as of cisco ios release 12.1(13)E, but supported in the software switching path only. Dialer interfaces Multilink PPPNBAR cannot be used to classify output traffic on a wan link where tunneling or encryption is used. Therefore, NBAR should be configured on other interfaces on the router (such as a lan link) to perform input classification before the traffic is switched to the wan link for output.Monitoring and maintaining NBARShow ip nbar port-map [protocol-name ] displays the TCP/UDP port number used by NBAR to classify a given protocolShow ip nbar protocol-discovery displays the statistics for all interfaces on which protocol discovery is enableRouter(config-if)#ip nbar protocol-discovery enables monitoring by application on particular interface.Router(config)#ip nbar pdlm pdlm-name 加载pdlm 模块Router(config-cmap)# match protocol protocol-nameIn the following example, the class-map class1 command uses the NBAR classification of SQL*Net as its matching criterion:n e t 527.cn咖啡小猪Router(config)# class-map class1Router(config-cmap)# match protocol sqlnetRouter(config-cmap)# match protocol http [url url-string | host hostname-string | mime MIME-type ] url (Optional) Specifies matching by a URL.host (Optional) Specifies matching by a host name.mime (Optional) Specifies matching by MIME text string. 小知识In the following traffic class, all protocols except IP are considered successful match criteria: Router(config)# class-map noipRouter(config-cmap)# match not protocol ip Router(config-cmap)# exitE-Express Inc.’s network administrators wish to enforce the following policies on a 64-Kb WAN link: • Reserve a minimum bandwidth of 32 Kb out of the 64 Kb available on the WAN link for alle-commerce traffic. This e-commerce traffic will be secure HTTP traffic or files being served from the /transact/ directory through regular HTTP on the E-Express Inc. network.• SuperNetwork Inc. is a very important partner to E-Express Inc. Reserve a minimum of 10 Kb for all traffic flowing from E-Express Inc. to SuperNetwork Inc.• Limit to a maximum of 10 Kb all audio, video, and image web traffic.Follow the steps below to configure the above policies:Step 1 Classify all secure HTTP and HTTP traffic for the /transact/ directory: Router(config)# class-map match-all http_transactRouter(config-cmap)# match protocol http url “/transact/*” Router(config)# class-map match-all http_secure Router(config-cmap)# match protocol secure-http Router(config)# class-map match-any ecommerce Router(config-cmap)# match class-map http_transact Router(config-cmap)# match class-map http_secureStep 2 Classify all traffic to SuperNetwork Inc:Router(config)# access-list 101 permit ip 10.0.0.1 0.0.0.0 10.0.0.3 0.0.0.0 Router(config)# class-map match-all super_network Router(config-cmap)# match access-group 101Step 3 Classify all audio, video, and image web traffic: Router(config)# class-map match-any audio_videoRouter(config-cmap)# match protocol http mime “audio/*” Router(config-cmap)# match protocol http mime “video/*” Router(config)# class-map match-any web_images Router(config-cmap)# match protocol http url “*.gif”Router(config-cmap)# match protocol http url “*.jpg |*.jpeg” Router(config)# class-map match-any av_im_web Router(config-cmap)# match class-map audio_video Router(config-cmap)# match class-map web_imagesStep 4 Create the policies:Router(config)# policy-map e-express Router(config-pmap)# class ecommerce Router(config-pmap-c)# bandwidth 32Router(config-pmap-c)# class super_network Router(config-pmap-c)# bandwidth 10 Router(config-pmap-c)# class av_im_webRouter(config-pmap-c)# police 10000 conform transmit exceed dropStep 5 Attach the policy to the WAN link: Router(config)# interface hssi1/0Router(config-if)# service-policy output e-expressn et 527.cn咖啡小猪B.流量策略设置 Policing and ShapingMost newer mechanisms require Cisco Express Forwarding (CEF)可以调用的流量分类技术 技术命令方向接口下应用 模块化调用CAR 承诺访问速率rate-limit in/out access-list (rate-limit) police-map(class-map)流量限制 Policing police 限速 police in/out police-map(class-map)GTS 通用流量整形 traffic-shape out access-list 流量整形ShapingClass-Based Shaping shape out police-map(class-map)流量标记 Marking set 系列in/out police-map(class-map)策略路由Police Based Routing set 系列in route-map令牌桶Token bucket implementations usually rely on three parameters: CIR, Bc and Be. CIR is the Committed Information Rate 承诺信息速率 单位bps Bc is known as the burst capacity 承诺突发 单位BytesBe is known as the excess burst capacity 超量突发 单位BytesTc is an interval constant that represents time. 单位时间间隔 单位seconds/ms A Bc of tokens are forwarded without constraint in every Tc interval.In the token bucket metaphor, tokens are put into the bucket at a certain rate, which is Bc tokens every Tc seconds. The bucket itself has a specified capacity. If the bucket fills to capacity (Bc + Be), it will overflow and therefore newly arriving tokens are discarded. Each token grants permission for a source to send a certain number of bits into the network. To send a packet, the regulator must remove, from the bucket, the number of tokens equal in representation to the packet size.CARThe CAR services limit the input or output transmission rate on an interface or subinterface based on a flexible set of criteria. CAR is often configured on interfaces at the edge of a network to limit traffic into or out of the network.CAR(承诺访问速率) 一种流量策略的分类和标记的方法,基于ip 优先级、DSCP 值、MACn e t 527.cn咖啡小猪地址或者访问控制列表来限制ip 流量的速率流量策略的分类包括定义一个流量策略并且使用CAR 来实施速率限制CAR 使用3种速率Normal rate(正常的速率) 像流量中的CIR ,流量的平均速率 Normal burst(正常突发) 类似于Bc ,正常的突发是在时间间隔内允许超过正常流量速率的流量Excess burst(过量突发) 超过正常突发的流量Normal-burst=(normal-rate/8)*1.5倍 normal-rate 单位为bits Excess-burst=normal-burst*2Router(config)# interface interface-type interface-numberRouter(config-if)#rate-limit {input | output } [access-group [rate-limit ] acl-index ] bps burst-normal burst-max conform-action action exceed-action action Normal-rate 平均的流量速率,bpsAccess-group {access-list-number | rate-limit rate-list-number } Normal-burst 正常突发,byteMaximum-burst 过量的突发,byteConform-action 任何遵循正常速率的数据包将会执行这个命令的下一个数值所规定的行为 Continue 继续执行列表的剩余部分 Drop 立即丢弃数据包并且退出列表Set-dscp-continue dscp-value 将dscp 的值设为特定的值,范围从0~63,并且继续执行剩余的列表Set-dscp-transmit dscp-value 将dscp 的值设为特定的值,范围从0~63,传输这个数据包,退出这个列表Set-prec-continue precedence-value 设置ip 优先级(0~7),并且继续处理剩余的列表 Set-prec-transmit dscp-value 设置ip 优先级(0~7),传输这个数据包,退出这个列表 Transmit 传输数据包并且停止对剩余的列表处理Exceed-action 指定当超过正常的速率时应当采取的行为 Continue 继续执行列表的剩余部分 Drop 立即丢弃数据包并且退出列表Set-dscp-continue dscp-value 将dscp 的值设为特定的值,范围从0~63,并且继续执行剩余的列表Set-dscp-transmit dscp-value 将dscp 的值设为特定的值,范围从0~63,传输这个数据包,退出这个列表Set-prec-continue precedence-value 设置ip 优先级(0~7),并且继续处理剩余的列表 Set-prec-transmit dscp-value 设置ip 优先级(0~7),传输这个数据包,退出这个列表 Transmit 传输数据包并且停止对剩余的列表处理使用CAR 来指定流量Access-list rate-limit list-number {precedence-value | precedence-mask } (list-name 0-99) Access-list rate-limit list-number MAC-address (list-name 100-199)Show interface rate-limittraffic-policeRouter(config-pmap-c)#police bps burst-normal burst-max conform-action action exceed-action actionAction to take on packets that conform to the specified rate limit. Specify one of the following keywords:• drop —Drops the packet.• set-prec-transmit new-prec —Sets the IP precedence and sends then e t 527.cn咖啡小猪packet.• set-dscp-transmit new-dscp —Sets the differentiated services code point (DSCP) value and transmits the packet. • transmit —Sends the packet.In this example, a customer is connected to an Internet service provider (ISP) by a T3 link. The ISP wants to rate limit transmissions from the customer to 15 Mbps of the 45 Mbps. In addition, the customer is allowed to send bursts of 2,812,500 bytes. All packets exceeding this limit are dropped. The following commands are configured on the High-Speed Serial Interface (HSSI) of the ISP connected to the customer: interface Hssi0/0/0description 45Mbps to R1rate-limit input 15000000 2812500 2812500 conform-action transmit exceed-action drop rate-limit output 15000000 2812500 2812500 conform-action transmit exceed-action dropIn this particular example, traffic policing is configured with the average rate at 8000 bits per second, the normal burst size at 2000 bytes, and the excess burst size at 4000 bytes. Packets coming into Fast Ethernet interface 0/0 are evaluated by the token bucket algorithm to analyze whether packets conform exceed, or violate the specified parameters. Packets that conform are sent, packets that exceed are assigned a QoS group value of 4 and are sent, and packets that violate are dropped. 7200-uut(config)# class-map acgroup27200-uut(config-cmap)# match access-group 2 7200-uut(config-cmap)# exit7200-uut(config)# policy-map police 7200-uut(config-pmap)# class acgroup27200-uut(config-pmap-c)# police 8000 2000 4000 conform-action transmit exceed-action set-qos-transmit 47200-uut(config-pmap-c)# exit 7200-uut(config-pmap)# exit7200-uut(config)# interface fastethernet 0/0 7200-uut(config-if)# service-policy input policeTRAFFIC-SHAPEBc(持续突发速率) 在每个时间间隔内流量被允许突发超出正常流量速率的速率,bit 表示 Be(过量突发速率) 在第一个时间间隔内,流量被允许突发超出持续突发速率的速率 Tc(时间间隔) 每隔一个Tc ,流量会被填充到流量整形的令牌桶中 Tc=Bc/CIR Be=Bc*2如果这个接口不能支持突发Be=Bc流量整形的时间间隔不能小于10ms 或者大于125ms 。
Compositional Quality of Service SemanticsRichard Staehli Simula Research LaboratoryP.O.Box134N-1325Lysaker,Norwayrichard@simula.noFrank Eliassen Simula Research LaboratoryP.O.Box134N-1325Lysaker,Norwayfrank@simula.noABSTRACTMapping QoS descriptions between implementation levels has been a well known problem for many years.In compo-nent-based software systems,the problem becomes how to predict the quality of a service from the quality of its com-ponent services.The weak semantics of many QoS speci-fication techniques has complicated the solution.This pa-per describes a model for defining the rigorous QoS seman-tics needed for component architectures.We give a de-tailed analysis of compositional QoS relations in a video Object-Tracker and discuss how the model simplifies the analysis.1.INTRODUCTIONThe need for QoS management support in component ar-chitectures is well known[4].While many aspects of QoS management have been investigated in the context of dis-tributed systems,component architectures present new chal-lenges.One of those new challenges is how to reliably predict QoS properties for a composition of components. Component architectures such as the CORBA Compo-nent Model(CCM)guarantee that applications assembled from independently developed components will function cor-rectly when deployed on any sufficiently provisioned imple-mentation of the component architecture platform.We refer to this as the safe deployment property.Although current component standards have had good success in some do-mains,such as e-business,an application that performs well in one deployment may be unusable as load scales up or when connections are re-distributed across low-bandwidth connec-tions.We use the term QoS-sensitive application to refer to an application that will commonly perform unacceptably if platform resources are scarce or if the deployment is not carefully configured and tuned for the anticipated load. State-of-the-art middleware and component technologies provide QoS management APIs that force application de-velopers to code deployment-specific knowledge into the ap-plication[1][6][8].Rather than specifying an assembly of Permission to make digital or hard copies of all or part of this work for personal or classroom use is granted without fee provided that copies are not made or distributed for profit or commercial advantage and that copies bear this notice and the full citation on thefirst page.To copy otherwise,to republish,to post on servers or to redistribute to lists,requires prior specific permission and/or a fee.SAVCBS’04,October31,2004,Newport Beach,California,USA Copyright2004ACM...$5.00.black-box components that will run on any standard plat-form,developers instead write deployment-specific configu-ration code that depends on knowledge of component and platform service implementations.This approach compli-cates development and fails to preserve the safe deployment property.1.1The QuA ProjectThe QuA project is investigating how a component archi-tecture can preserve the safe-deployment property for QoS-sensitive applications[9].We believe that platform-managed QoS is the only general solution that preserves the safe de-ployment property.This means that applications and appli-cation components should be written without knowledge of the runtime platform implementation and resource alloca-tion decisions.Application specifications for accuracy and timeliness of outputs must refer only to the logical properties of the component interfaces.Platform-managed QoS means that the platform must be able to reason about how end-to-end QoS depends on the quality of component services.The composition relationship is often non-trivial as in the case of a remote video conference where image quality may depend on both packet transport loss and video encoding.We refer to the set of characteristics used to specify QoS as a quality model and the concepts used to define such char-acteristics as a QoS meta-model.To enable a component platform to reason about composition and conformance,we need a QoS meta-model that allows us to uniformly model every level of implementation as a service,from the appli-cation level down to physical resources,and that,for any service,allows us to define a quality model that does not depend on implementation.These properties allow the cre-ation of QoS specification standards and developer provided mapping functions that can be used to derive composition QoS properties from independently developed components. In the next section,we describe how the QuA QoS meta-model satisfies the above requirements.In Section3the model is applied recursively to define QoS models for a com-plex real-time video processing application and its compo-nents.We show how the model permits a precise mapping of component-composition QoS dependencies.Section4dis-cusses related work and Section5presents our conclusions.2.THE QUA QOS META-MODELThe QuA QoS Meta-Model(QQMM)defines the seman-tics of our QoS specifications.It defines a generic model of a service and defines quality in a way that allows us to cre-ate precise and practical QoS models for any specific service type.To begin,we need to be precise about what a service is.In common use,the term service means work done for another. In computing systems,we want the term to apply both to the work performed by a complex distributed application for its clients and to the work performed by the simplest of hardware resources,such as a memory address that stores a binary value for some computation.Definition1A service is a subset of output messages and causally related inputs to some composition of objects. This is consistent with the common definition,since the output messages represent the”work done”and the inputs represent the work request.An object’s type semantics de-fine which inputs cause which outputs.Since network packet delivery is a service that is well known in the QoS literature,we will use it to illustrate our definitions.We can model an IP network port as a distributed port object that can accept send(packet)mes-sages at multiple locations and emit deliver(packet)mes-sages at an endpoint identified by the host and port num-ber.This service is illustrated in Figure1.We can de-fine a service provided by this port object as consisting of only the deliver(packet)output events and causally re-lated send(packet)input events for which the input came from source A.These packets are colored black in Figure1.Figure1:Example packet transport service.In the QQMM definition of a service,we assume the most basic model of object-oriented analysis,where objects in some platform-defined identity space communicate by send-ing messages.The sending of a message is both an input event for the receiver and an output event for the sender. In the packet service,we can define the occurrence of the send event as precisely the moment when the send func-tion is invoked and the occurrence of the deliver event as the precise moment when the received packet is made avail-able in the output buffer.The QQMM makes no assump-tions about object implementations and so we must allow that objects may receive input messages concurrently from multiple senders and send output messages concurrently to multiple receivers.This suits a general model of distributed computation.As in the packet service example,other services may share the same object and even the same interface to that object, so long as they have a disjoint set of output events.A service specification can be as simple as identifying an output interface for an object;the causally related inputs are implied by the semantics for the object type.For ex-ample,the semantics of the distributed port object dictate that every packet delivered has exactly one send event that caused it.The semantics also dictates that the value of the packet delivered should be the same as the packet that was sent.Now,to reason about the behavior of a service,we need to talk about the history of input and output events.Definition2A message event trace is a set of message val-ues associated with the sending interface and the time it was sent.A message value represents all content of the message, including its type or signature.The sending interface is the location of the mechanism used to send the message.In the packet service example,the sending interface used by Source A is thefirst PortProxy object,while the sending interface for packet service outputs is the Endpoint object.The time associated with an event comes from a local clock at the sending interface.We assume that clocks are synchronized, but acknowledge that when times from remote clocks are compared there will always be some uncertainty about how well they were synchronized.The QQMM defines a message send to be a local and instantaneous event.All preparation for a message send is done in the sender and all processing of a message after the send event is done in the receiver.This property assures us that end-to-end processing time is consistently and properly accounted for.In the packet service example,all real delay occurs within one of the service components,including the Network object that encapsulates physical network access. We use the term input trace to refer to the message event trace with all input events for a service,and output trace to refer to the message event trace with all output events for a service.The behavior of a service implementation is deter-mined not only by the semantics of its declared interfaces, but also by the availability and scheduling of resources in the underlying platform.To define quality of service,we need to ask what is the ideal behavior of a service.Definition3For a given input trace,the ideal output trace is generated when the service executes completely and correctly on an infinitely fast platform with unlimited resources.That is,computation takes no time and results are ob-tained at the same time they are requested.Of course, events in an ideal output trace still only occur as frequently as the inputs that cause them!Although we believe the QQMM can model QoS for non-deterministic computations,we ignore them for now to sim-plify the presentation.For deterministic computations,the semantics of a service’s interfaces defines the ideal output trace as a function of an input trace.This means that the best possible quality for a service is always well defined.In a real implementation of a service,the actual output trace will differ from the ideal in both the timing and value of message events.The causes for this deviation from ideal includefinite CPU speed,queueing delays,and bandwidth reduction strategies.This is the stuffof QoS management. We would like to view the possible output traces for a service as points in a behavioral space and consider distance from the ideal output trace as an error measurement,but to use this concept in QoS specifications,we mustfirst define the dimensions of this behavioral space.Consider again,the packet service example.Figure2 shows the input trace as incoming messages on the left sideFigure2:Ideal(shown in grey)versus actual(black) behavior.of the service’s timeline and the actual output trace as out-going messages on the right.The ideal output trace is shown in grey.Assuming that this trace shows the entire lifetime of the service,we can see that each event in the ideal out-put trace can occur at a later time in the actual trace and may have its packet value corrupted or degraded in some way.The second and third packets have apparently been corrupted and it is not possible to be certain which is which without some knowledge of the service implementation.The fourth packet sent had not been delivered at the time of reckoning and may be considered lost.The important point to observe about the packet service output is that every event can vary independently from the others in its delay from the ideal and in the change to its packet value.The QQMM generalizes from this example to make the assumption that the only possible values in an ac-tual output trace that can differ from the ideal are the time of the output event and the values of message arguments. Each of these variables in the output trace represents an independent dimension of the behavioral space.Let X be the vector of values that may differ in a trace X,ordered by event order in the ideal trace and by the order they occur in the message value.Then the difference between an actual output trace A and the ideal trace I is the difference vector δ= A− I.For the packet service example,the values that may differ in the actual output trace are the event times and the packet values.If I is the ideal output trace for the example,the order of values in I is packet value followed by time for the first output,then for the second and so forth as shown in Equation1.I=(1,0,2,10,3,20,4,30)(1) If A is the actual output trace for the example,then the first two values of A are1and5.A=(1,5,9,21,9,24,0,∞)(2) As noted above,it is not possible to be certain which of the next two packets delivered corresponds to the second event in the ideal trace.This is an inescapable problem in QoS management:unreliable systems cannot be relied on to communicate enough information to unambiguously de-termine error.Instead,the difference vector can have many possible values depending on different interpretations of the correspondence between actual and ideal events[11].Fortu-nately,it is usually safe to consider only the interpretation corresponding to the least error as it is unlikely that random faults would yield better service.So,we choose the following interpretation of A and the difference vector δ:δ=(0,5,7,11,6,4,−4,∞)(3) Although this definition of the difference between actual and ideal allows us to define quality in a weak sense,i.e., actual traces in which every vector component is below a corresponding threshold value,it fails to tell us which of two output traces is better when each contain some com-ponents that are worse than the other.Another problem is that as the complexity of an ideal trace increases,through additional messages and more complex message structure, the number of ways in which actual traces may differ ex-plodes.Fortunately,we frequently are concerned only with an overall measure of distance from the ideal.For exam-ple,we can ignore the individual values for event delay and instead monitor aggregate statistics such as maximum and median.The QQMM concept of an error model provides a rigorous way to define the type of quality characteristics that are most useful for QoS management.Definition4An error model =`1( δ),..., n( δ)´is a vec-tor of n functions that each map from a difference vec-tor δto a real number such that|| ( δ)||=0when || δ||=0.The notation|| δ||represents the magnitude of the vec-tor δ.According to this definition,a function in an error model(error function)must be zero if there are no differ-ences between the actual and the ideal.We also expect that the magnitude of an error model will generally increase as the difference from ideal grows larger,but we have found it difficult to formalize this requirement without being overly restrictive.One trivial error model is the set of projection functions πi( δ)=δi;these are zero when|| δ||=0and increase as the respective component of δincreases.But the value of our error model definition is that it allows us to construct a much simpler error space with the type of QoS characteris-tics commonly discussed in the QoS management literature.A point in this simplified error space represents an equiva-lence class of output traces that are the same distance from the ideal with respect to the error model.To continue the packet service example,if we define the service as consisting of all deliver(packet)messages,then both the input trace and its associated ideal output trace may contain an unbounded number of events.To define an error model for this service we need to decide how to interpret packet delivery events that are expected but never happen,or that cannot be distinguished from other packet delivery events.For this error model,we consider a packet to be lost if either the time difference in δfor its deliver event exceeds some limit,such as20seconds,or its value difference is non-zero.We associate a packet delivery event with an ideal delivery event if the the actual event happened after the ideal event and there is no other interpretation that offers fewer packet losses.To allow us to model quality at time t during the service, we define i(p,t, δ)to be the sequence of consecutive valuesin δassociated with ideal events in the interval(t−p,t].Let d(p,t, δ)be the values in i(p,t, δ)associated with packets that were correctly delivered(not lost).A value of10sec-onds was chosen arbitrarily for the period p in this example. We can then construct an error model with the following functions:•delay(t)is the mean of time differences in d(10,t, δ).•jitter(t)is the variance of time differences in d(10,t, δ).•loss(t)is the ratio of the number of packets lost in i(10,t, δ)to the number sent,or zero if none were sent.These satisfy our definition of an error model,since each is zero when the difference values in δare zero and none decrease when a difference value in δincreases.Note that these definitions model only the error in the recent history of time t.To constrain error over the lifetime of a service we would need to use expressions like:for all time t,delay(t)<5.We could define many other similar error models with different parameters or different functions. For example,it may be useful to model the95th percentile of delay values.Still,the simple error model above is quite useful for specifying and measuring the quality of a packet delivery service and is similar to other common definitions of packet service QoS characteristics.A point in this error space;say delay(t)=1second, jitter(t)=0.5second,and loss(t)=0.2;corresponds to all output traces in which the mean delay for recent events before time t is one second,and so forth.This set of output traces forms a surface in the behavioral space that surrounds a neighborhood of the ideal output trace.Inside this neigh-borhood,all output traces are closer to the ideal and can be considered better at time t according to this error model. We can use an error model to both quantify the loss of quality and to constrain it.Let ( A− I)be the tuple of error values for an error model ,an actual trace A and the ideal trace for a service I.Let limits be a tuple of positive real numbers representing an upper bound for each of the functions in .Then we say a service with output trace A is acceptable if for each i,| i( A− I)|<limits i.Since many error models can be defined for a given service, we would like some criteria to judge which error models are better than others.The QQMM allows us to formally de-fine desirable properties of a good error model.For brevity, we suggest only informal definitions here.We say an error model is sound if any set of non-zero error limits can be sat-isfied by some set of actual output traces.An error model is complete if,for any output trace that is different from the ideal,we canfind a set of non-zero error limits that would exclude this trace.An error model is minimal if no function can be removed without losing the ability to distinguish be-tween some output traces.We say an error model M is more expressive than an error model N if it can define exactly the same sets of acceptable output traces as N,and then some more.The example error model for the packet service appears to be sound,because any non-zero limits can be satisfied by output traces with non-zero delay,jitter,and loss.The error model also appears to be complete:for any time difference value x>0in some i(10,t, δ)with n successfully delivered packets,x/(n+1)is a non-zero delay limit that must be less than|delay(t)|even if all n−1other time differences are zero,and if v>0is a value difference in such an interval with m packets,1/(m+1)is a non-zero loss limit that must be less than|loss(t)|even if all other packets are delivered in a timely manner without corruption.The error model is also minimal,as each function models an independent facet of error.The error model could be made more expressive by adding functions,to distinguish packet corruption from loss for example.3.APPLICATION TO AN OBJECT TRACK-ING SERVICEIn this section,wefirst define error models for a real appli-cation and its component services,and then show how error for the application service can be predicted from error in the component services.We apply QQMM to an example of a class of applications we refer to as real-time content-based video analysis.These applications must process the video data at least as fast as the video data is made available and perform analysis with acceptable accuracy.Real-time content analysis is an active researchfield where efficient techniques have been found for problems such as multi-object detection and tracking.In such applications, pattern classification systems which automatically classify media content in terms of high-level concepts have been adopted.Such pattern classification systems must bridge the gap between the low-level signal processing services(fil-tering and feature extraction)and the high-level services desired by the end-user.The design of such a pattern classification system must select analysis algorithms that balance requirements of ac-curacy against requirements of timeliness.3.1The object tracking serviceIn this example,we refer to a simple object tracking ser-vice as an Object-Tracker.The service is simple in the sense that it can track a single object on a stationary back-ground(i.e.the camera remains still).This example is adapted from our earlier work on supporting quality con-straints in real-time content-based video analysis[12]. Figure3shows the Object-Tracker as a component re-ceiving input from a VideoSrc and sending output to an EventSink.The Object-Tracker is implemented as a com-position of Feature extractor and Classifier components with multicast input to the feature extractors and pub-lish/subscribe middleware for communications between the feature extractors and the classifier.The extractors and the classifier are further decomposed into functional and com-munication components.The VideoSrc sends each frame of an uncompressed video stream to afilter component(not shown)that divides the frame into regions,publishing the data for each to a mul-ticast channel for that region.The multicast channel is an efficient mechanism to communicate high-bandwidth data to multiple clients over a local area network.However,in this example,exactly one Feature Extractor receives the data for each frame region.Each Feature Extractor calculates features from the set of frame data it has received.In this example,the Feature Extractor components compute a two dimensional array of motion vectors;one for each block of the frame region, where a block is a subdivision of the frame intofixed size rectangles of pixels.A motion vector indicates the directionFigure3:Functional decomposition of the Object-Tracker.and distance that most pixels within a block appear to have moved from a previous frame.The motion vectors and the associated frame number are then published by the Feature Extractor as event notifi-cations on a channel for the frame region.The Classifier subscribes to these channels to receive motion vector data from multiple Feature Extractor components.In this ex-ample,the Classifier examines the history of motion vec-tors over several frames to identify and determine the center of a moving object.We use Dynamic Bayesian Networks(DBNs)as a classi-fier specification language.DBNs[5]represent a particularly flexible class of pattern classifiers that allows statistical in-ference and learning to be combined with domain knowledge. In order to automatically associate high-level concepts (e.g.object position)with the features produced through feature extraction,a DBN can be trained on manually an-notated media streams.The goal of the training is tofind a mapping between the feature space and high-level con-cept space,within a hypothesis space of possible mappings. After training the DBN can be evaluated by measuring the number of misclassifications on a manually annotated media stream not used in the training.This measured error rate can be used as an estimate of how accurately the DBN will classify novel media streams and can be associated with the classifier as meta data.One important reason for using DBNs is the fact that DBNs allow features to be missing during classification at the cost of some decrease in accuracy.This fact is exploited in our work with the Object-Tracker to trade accuracy for timeliness as discussed below.3.2QoS role in planning service configuration Even this simple Object-Tracker implementation requires many deployment configuration choices with associated QoS tradeoffponents may be deployed to different proces-sors to work in parallel,increasing throughput and reduc-ing delay.Throughput may also be increased by deploying pipeline components on different processors.But distribu-tion may also increase communication overhead and add to delay.Since the motion vector Feature Extractor operates lo-cally on image regions,the performance can scale with the size of video processing task by distributing the work among a greater number of Feature Extractor components,each on its own processor.Similarly,the Classifier could be parallelized if classification should become a processing bot-tleneck[12].In this paper,we consider only the case of parallelizing the Feature Extractor.The amount of processing required for acceptable accu-racy in object tracking is another tradeoffpoint.The level of accuracy provided by the Object-Tracker depends on the misclassification behavior(error rate)of the classifier algorithm,which in turn depends on the quality of the fea-ture extraction input.Greater accuracy can be achieved by processing video data at a higher frame rate or higher resolution,but the increased processing requirements might increased delay in reporting the object location.Hence the configuration must be carefully selected based on both the desired level of accuracy and the tolerance for delay.To reason about which configurations might satisfy the Object-Tracker QoS requirements,it must be possible to estimate what QoS the components will offer and how these QoS offers compose to satisfy the end-to-end requirements. To do this in practice,we exploit knowledge of the measured behavior of the components in the target physical processing environment.3.3Error model definitionsWe model the Object-Tracker as a service that has un-compressed video frames as input and that produces a lo-cation event for every video frame as its output.A video frame number accompanies each frame,frame region,set of motion vectors,and each location output event so that there is no ambiguity about which frame these events are to be associated with.Each video frame is divided into m×n blocks.A location is represented as a block number in the video frame and indicates the center position of the tracked object.For this service,the variables in the output trace are the time of the output and the location coordinates.It matters little whether the difference between actual and ideal loca-tion coordinates is in one axis or another,so we will refer to location as an aggregate value.We would like to model three quality characteristics for this service:latency,errorRate and period.Let i(p,t, δ) be the values from the difference vector for the interval of period p up to time t as defined in the last section.We can define the error model as follows:•latency(t)is the mean of time differences in i(10,t, δ).•errorRate(t)is the ratio of non-zero location differ-。