雅思哥作文task1六种图
- 格式:docx
- 大小:392.51 KB
- 文档页数:9
雅思小作文各种图题、表格题技巧总结雅思作文Task 1受图表内容的限制,遣词造句的要求非常有限,只需针对考试,把核心表达用准用熟即可,所谓博大不如精深。
下面是威学教育雅思教研组总结的雅思小作文线图题、柱形图题、饼图题、表格题以及流程图等的写作总结!线图、柱状图、饼图,表格题介绍段introduction介绍段内容几乎完全不用创新,就是对题目文字部分的第二段做改写,paraphrase the rubric.所谓改写,要么换词,要么换句式。
例如:(I4-100)The charts below give information about travel to and from the UK and most popular countries for UK residents to visit.换词(1) 图 The charts图:chart, graph(雅思写作中完全等价,无差别)线:line / curve chart柱图:bar / column graph饼:pie chart表:table / statistics / figures(2) 动词“表明”give information about介绍段是客观描述,用一般现在时态,give information about 虽然在这篇作文中最好不再用,但是informal learning,随手学到的东东,留作其它文章再用。
替换的词语和结构很多,比如我常用的show /illustrate / demonstrate/compare,大家也可以选几个自己喜欢并且拼写准确的形成风格。
第二段其余部分的替换因题而异,比如travel换成visitthe UK换成Britain(注意不是England,英格兰只是Britain的一部分)popular换成fashionablecountry换成nationUK residents to visit换成UK tourists不过随着练习作文数量的增加,你会惊喜的发现,雅思图表作文,连描述的对象都是类似的。

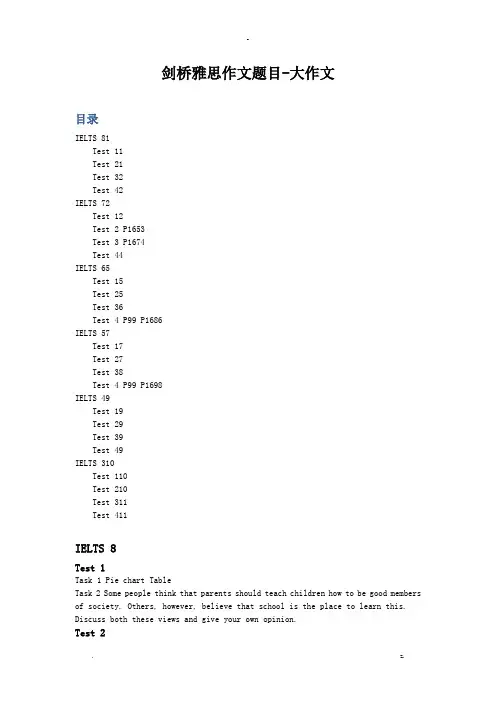
剑桥雅思作文题目-大作文目录IELTS 81Test 11Test 21Test 32Test 42IELTS 72Test 12Test 2 P1653Test 3 P1674Test 44IELTS 65Test 15Test 25Test 36Test 4 P99 P1686IELTS 57Test 17Test 27Test 38Test 4 P99 P1698IELTS 49Test 19Test 29Test 39Test 49IELTS 310Test 110Test 210Test 311Test 411IELTS 8Test 1Task 1 Pie chart TableTask 2 Some people think that parents should teach children how to be good members of society. Others, however, believe that school is the place to learn this. Discuss both these views and give your own opinion.Test 2Task 1 Pie chartTask 2 Nowadays the way many people interact with each other has changed bee of technology.In what ways has technology affected the types of relationships people make" Has this bee a positive or negative development"Test 3Task 1 Process diagramTask 2 Increasing the price of petrol is the best way to solve growing traffic and pollution problem.To what e*tent do you agree or disagree"What other measures do you think might be effective"Test 4Task 1 Line graphTask 2 In some countries the average weight of people is increasing and their levels of health and fitness are decreasing.What do you think are the causes of these problems and what measures could be taken to solve them"IELTS7Test 1Task 1 TableTask 2 It is generally believed that some people are born with certain talent, for instance for sport or music, and others are not. However, it is sometimes claimed that any child can be taught to bee a good sports person or musician.Discuss both these view and give your own opinion.文:The relative importance of natural talent and training is a frequent topic of discussion when people try to e*plain different levels of ability in, for e*ample, sport, art or music.Obviously, education systems are based on the belief that all children can effectively be taught to acquire different skills, including those associated with sport, art or music. So from our won school e*perience, we can find plenty of evidence to support the view that a child can acquire these skills with continued teaching and guided practice.However, some people believe that innate talent is what differentiates a person who has been trained to play a sport or an instrument, from those who bee good players. In other words, there is more to the skill than a good learned technique, and this e*tra talent cannot be taught, no matter how good the teacher or how frequently a child practices.I personally think that some people do have talents that are probably inherited via their genes. Such talents can give individuals a facility for certain skills that allow them to e*cel, while more hard-working students never manage to reach a parable level. But, as with all questions of nature versus nurture, they are not mutually e*clusive. Good musicians or artists and e*ceptional sports stars have probablysucceeded because of both good training and natural talent. Without the natural talent, continuous training would be neither attractive nor productive, and without the training, the children would not learn how to e*ploit and develop their talent. In conclusion, I agree that any child can be taught particular skills, but to be really good in areas such as music, art or sport, then some natural talent is required. (282words)Test 2P165Task 1 Line graphTask 2 Some people believed that there should be fi*ed punishment for each type of crime. Others, however, argue that the circumstances of an individual crime, and the motivation for mitting it, should always be taken into account when deciding on punishment.Discuss both these view and give your own opinion.文:This is a thoughtful and well-argued response to the task. The candidate e*amines the opposing views of the topic and gives a clear opinion that is well developed and supported. To reach the highest band a more clearly-signaled conclusion would be needed. The argument is well organized and linking is well-managed throughout. The development of the answer is not helped, however, by poor control of paragraphing which sometimes confused the links across different sections. This is a weak feature of the script which limits the overall rating. In contrast, an e*cellent range of vocabulary is used with a sophisticated level of control and only rare slips. The range of structures is also wide and most sentences are accurate and precise, but there are some errors and omissions. These, however, are only minor and do not affect munication.Band 7.5 score:Fi*ing punishments for each type of crime has been a debatable issue. There are many arguments supporting both views, those for and those against fi*ed punishments. On the one hand, fi*ed punishments will have a deterring effect on society. Individuals knowing that they will be subject to a certain punishment if they are convicted with a given crime will reconsider mitting this act in the first place. This deterring effect also leads to social stability and security, through minimizing the number of crimes mitted.If people knew they would be able to convince the court or the jury of a reason for having mitted the crime they are accused of, penal decisions would be largely arbitrary. This would result into criminals getting away with their crimes and into a high level of injustice caused by the subjective approach of different courts. On the other hand, taking the circumstances of a crime and its motivation into consideration is a prerequisite for establishing and ensuring justice and equity.A person killing in self-defense cannot be pared to a serial killer, moving from one victim to the ne*t. In my opinion an intermediary position between both solutions is the perfect way to establish and ensure justice and equity.There have to be fi*ed punishments for all crimes. However, criminal laws have to provide for a minimum and a ma*imum for the punishment and the laws also have toforesee certain cases of e*emptions.An e*ample for setting minimum and ma*imum penalties is petition Law where a person being held liable of a crime under this law will be convicted to pay a fine, according to the harm caused by the violation and the profit gained by the violator through mitting the crime.As for the e*emptions, in some countries the law e*empts thiefs stealing food during a period of famine taking into consideration the distress and hunger.Also, a person killing in self-defense will be e*empted from punishment. (325) Test 3 P167Task 1 Bat chartTask 2 As most people spend a major of their adult life at work, job satisfaction is an important element of individual wellbeing.What factors contribute to job satisfaction"How realistic is the e*pectation of job satisfaction for all workers"文:Nowadays many adults have full-time jobs and the proportion of their lives spent doing such jobs is very high. So feelings about one’s job must reflect how an individual feels about his or her life as whole, and because of this, job satisfaction is indeed very important for the wellbeing of that person.Employees get job satisfaction in a number of ways. Firstly, a person needs to feel that they are doing valued and valuable work, so positive feedback from superiors is very important in this respect. A sense of fulfillment is also encouraged if a worker feels the job is worth doing because it contributes to the society or the economy as a whole. Secondly, when someone feels they are improving or developing their skills through training opportunities, for e*ample, then there is as sense of progression and purpose that rewards a worker. The sense of belonging to a team or a working munity also contributes to job satisfaction because colleagues help each other to enjoy their working lives. Satisfaction is also increased by a sense of responsibility for and loyalty to a team.Of course not everyone enjoys heir work. Hard economic realities mean that many people have little choice in the kind of job they can get. In some cases an employee is working in a job that suits neither their skills nor their personality. Some jobs are repetitive and boring, and labour relations may be poor and lead to resentment and insecurity rather than to job satisfaction.However, even though it is unlikely that all workers do feel happy in their work, I think it is not unrealistic to promote more job satisfaction in any job. If the factors identified above are implemented, then any job can be improved and more workers can feel greater degrees of job satisfaction. (303)Test 4Task 1 Pie chartTask 2 Some people think that university should provide graduates with the knowledge and skills needed in the work place. Others think that the true function of university should be to give access to knowledge for their own sake, regardless of whether the course is useful to an employer.What, in your opinion, should be the mine function of a university"文:IELTS6Test 1Task 1 Line graphTask 2 Today, high sales of popular consumer goods reflect the power of advertising and not the real needs of the society in which they are sole.To what e*tent do you agree or disagree"文:Nowadays, there are lots of advertisements on television or on the streets. Some people think that the advertising boosts the sales of goods and it encourages people to buy things unnecessarily. This arguments may be true. In my country, many advertising panies produce advertisements with famous and popular actors or singers. People, especially youngsters, buy goods that their favourite singer advertise, although they do not really need the products.Also, on the television screen, a product may look gorgeous and good quality. As a result of it, people often buy goods without enough consideration. Consumers may not actually need it but they buy goods impulsively soon after they watch the advertising. Furthermore, as many customers buy a particular product due to its advertising campaign, the other people may be affected by the trend, even if the product is not of the real needs of the society.On the other hand, there are various aspects against these arguments. Moreover, it is people’s choice to make a decision to buy goods. Advertising may be not a cause of customers’buying habits. Individuals have their own spending habits. If they have got enough disposable ine, then the right to make a decision is given to them. No one actually can judge whether the goods sold are the real needs of the society or not.In addition, as there should be a limited amount of disposable ine consumers are able to spend, people try to allocate their budgets. They cannot be simply swayed by those advertisements.In conclusion, as customers have their own strong opinions and standard of good quality goods, it is better to leave them to make their own decision in buy goods. It is fairly difficult to say everyone is swayed by advertising and buy good impulsively. However, in sensitive area of businesses such as toy industries, it may be necessary to band advertising to those children as children have not got enough ability to control themselves or to know what they need. (332 words)Test 2Task 1 TableTask 2 Successful professionals can earn a great deal more money than people in other important professions. Some people think this is fully justified while others think it is unfair.Discuss both these view and give your own opinion.考官文:As a result of constant media attention, sports professionals in my country have bee stars and celebrities, and those at the top are paid huge salaries. Just like movie stars, they live e*travagant lifestyles with huge houses and cars.Many people find their rewards unfair, especially when paring these super salaries with those of top surgeons or research scientists, or even leading politicians who have the responsibility of governing the country. However, sports salaries are not determined by considering the contribution to society a person makes, or the level of responsibility he or she holds. Instead, they reflect the public popularity of sport in general and the level of public support that successful stars can generate. So the notion of ‘fairness’ is not the issue.Those who feel that sports stars’salaries are justified might argue that the number of professionals with real talent are very few, and the money is a recognition of the skills and dedication a person needs to be successful. petition is constant and a player is tested every time they perform in their relatively short career. The pressure from the media is intense and there is little privacy out of the spotlight. So all of these factors may justify the huge earnings.Personally, I think that the amount of money such sports stars make is more justified than the huge earnings of movie stars, but at the same time, it indicates that our society places more value on sport than on more essential professions and achievements.翻译:在媒体不断地推波助澜下,我国的许多职业运发动已成为了明星和名人。

雅思英语图表作文范文第1篇A类雅思各类图表作文要点及范文一.曲线图解题关键1曲线图和柱状图都是动态图,解题的切入点在于描述趋势。
2在第二段的开头部分对整个曲线进行一个阶段式的总分类,使写作层次清晰,同时也方便考官阅卷。
接下来再分类描述每个阶段的specifictrend,同时导入数据作为分类的依据。
3趋势说明。
即,对曲线的连续变化进行说明,如上升、下降、波动、持平。
以时间为比较基础的应抓住“变化”:上升、下降、或是波动。
题中对两个或两个以上的变量进行描述时应在此基础上进行比较,如变量多于两个应进行分类或有侧重的比较。
4极点说明。
即对图表中最高的、最低的点单独进行说明。
不以时间为比较基础的应注意对极点的描述。
5交点说明。
即对图表当中多根曲线的交点进行对比说明。
6不要不做任何说明就机械地导入数据,这不符合雅思的考试目的。
曲线图常用词汇动词—九大运动趋势一:表示向上:increase,rise,improve,grow,ascend,mount,aggrandize,goup,climb, take off, jump,shoot up暴涨,soar,rocket, skyrocket雅思英语图表作文范文第2篇It is said that countries are becoming similar to each other because of the global spread of the same products, which are now available for purchase almost anywhere. I strongly believe that this modern development is largely detrimental to culture and traditions worldwide.A country’s history, language and ethos are all inextricably bound up in its manufactured artefacts. If the relentless advance of international brands into every corner of the world continues, these bland packages might one day completely oust the traditional objects of a nation, which would be a loss of richness and diversity in the world, as well as the sad disappearance of t he manifestations of a place’s character. What would a Japanese tea ceremony be without its specially crafted teapot, or a Fijian kava ritual without its bowl made from a certain type of tree bark?Let us not forget either that traditional products, whether these be medicines, cosmetics, toy, clothes, utensils or food, provide employment for local people. The spread of multinational products can often bring in its wake a loss of jobs, as people urn to buying the new brand,perhaps thinking it more glamorous than the one they are used to. This eventually puts old-school craftspeople out of work.Finally, tourism numbers may also be affected, as travelers become disillusioned with finding every place just the same as the one they visited previously. To see the same products in shops the world over is boring, and does not impel visitors to open their wallets in the same way that trinkets or souvenirs unique to the particular area too.Some may argue that all people are entitled to have access to the same products, but I say that local objects suit local conditions best, and that faceless uniformity worldwide is an unwelcome and dreary prospect.Heres my full answer:The line graphs show the average monthly amount that parents in Britain spent on their children’s s porting activities and the number of British children who took part in three different sports from 2008 to is clear that parents spent more money each year on their children’s participation in sports over the six-year period. In terms of the number of children taking part, football was significantly more popular than athletics and 2008, British parents spent an average of around £20 per month on their children’s sporting activities. Parents’ spending on children’s sports increased gradually over the followi ng six years, and by 2014 the average monthly amount had risen to just over £ at participation numbers, in 2008 approximately 8 million British children played football, while only 2 million children were enrolled in swimming clubs and less than 1 million practised athletics. The figures for football participation remained relatively stable over the following 6 years. By contrast, participation in swimming almost doubled, to nearly 4 million children, and there was a near fivefold increase in the number of children doing athletics.剑桥雅思6test1大作文范文,剑桥雅思6test1大作文task2高分范文+真题答案实感。

2012.2⽉4⽇雅思写作预测 写作 task1 流程图曲线图表格图饼图 task2 1.The wide spread of English language is an unstoppable trend nowadays. Meanwhile the disappearing of lesser-known languages is also a major social issue for many nations. Do the advantages outweigh the disadvantages for this issue? 2.In today's world, it is private companies rather than government who pay for and carry out most on scientific research. Do you think the advantages outweigh the disadvantages? 3.In today's world, it is private companies rather than governments who pay for and carry out most scientific research. Do advantages outweigh disadvantages? 4.Some people think adults should learn practical skills by themselves, while others think they should learn from teachers. Discuss both views and give your own opinion. 5.Recent research shows that majority of the criminals who are sent into the prison continue to commit crime after they are set free. What do you think in the case? What should be done to solve this problem? 6.Some people believe that the best way to improve public health is by increasing the number of sports facilities. Others think that this has little effect and other measures are required. Discuss both views and give your opinion. 7.Some people hold that the development of modern technology leads to environmental pollution and energy shortage. Do you agree or disagree? 8.Some people say university students should pay for their tuition fees. Some others say the government should pay for the tuition fees. What is your opinion?。

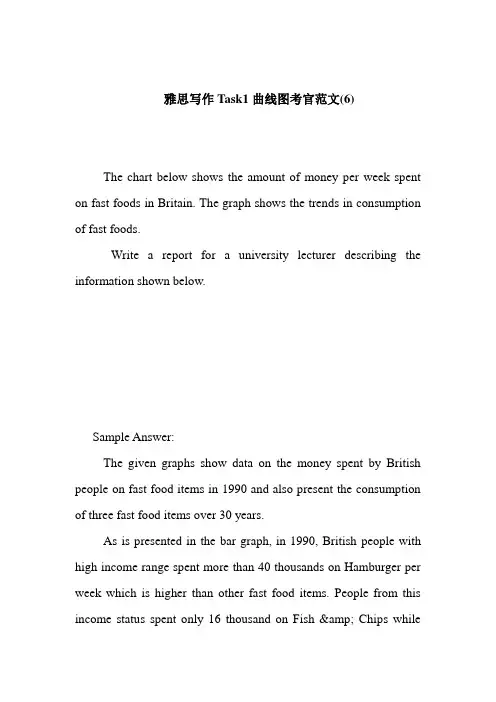
雅思写作Task1曲线图考官范文(6)The chart below shows the amount of money per week spent on fast foods in Britain. The graph shows the trends in consumption of fast foods.Write a report for a university lecturer describing the information shown below.Sample Answer:The given graphs show data on the money spent by British people on fast food items in 1990 and also present the consumption of three fast food items over 30 years.As is presented in the bar graph, in 1990, British people with high income range spent more than 40 thousands on Hamburger per week which is higher than other fast food items. People from this income status spent only 16 thousand on Fish & Chips whilethey spent around 18 thousand on Pizza in a week. Again Hamburger was the most popular fast food item in the medium income earning people also. They spent over 30 thousand dollar on this food item while they spent only 25 thousand on Fish & Pizza and 11 thousand on Pizza. Finally among the low income group, the fish & chips was the most popular fast food item as they spend most on this item (17 thousand per week). Their expenditure of pizza was only 6 thousand per week while they spent 14 thousand per week on hamburger.According to the line graph, people consume pizza more than any other fast food items in 1970. In this year UK citizens consumed more than 300 tons of pizza while the consumed only 100 tons of hamburger and fish & chips. The percentage of pizza consumption started declining and reached to only 200 tons on 1990. On the contrary, the popularity of the fish and chips reached to 500 tons in 1990 from the initial consumption volume of 80 tons. Finally the consumption of hamburger also increased over the year and reached to around 300 tons in 1990 from the initial amount of 20 tons.(Approximately 280 words)。
雅思小作文流程图和地图题词汇在雅思写作部分, A 小作文的流程和地一直是雅思烤比痛的部分。
此部分型在构文方式并没有特的技巧和特殊性。
事上,除了把握形的分析方法和每种形不同的解方式外,考生最关注的是充什么的做考准了。
大部分考生在市面上找不到的流程和地考籍,而上也并不把流程地的划分复,网信息把流程和地的材料区分明确,使得考生找不到一个合考法。
在本文中,成都 / 朗 / 培中心的雅思家了合完整的流程地,提供雅思烤完善的考指引。
以下的条按照不同表达方式行分。
Part 1:表时间流程和地中都可能涉及表达。
流程中,使用多的是程的表述,而地的使用体地理迁的化。
一般在方位址中少出。
确切的指引,既增加文章的自然和度,也能体行文的精确性。
常表示的:in few hours几小 a decade earlier几十年前during the period of在⋯期from that moment on从那起after 10 days 10天后after a while一会from ⋯ to 从⋯到⋯since 自从between⋯ and 在⋯之since then自从over the⋯ year period 在一个⋯年期finally 最后5 years before 5年前over the subsequent⋯years近几年例句: The process lasts for up to 7 day s and the products are finally distributedto customers.Part 2:表空间空表达地出概率高,但流程也偶出。
空是地解关和主要特点。
多考生容易把地的空位置写成上下左右位置,是失分点非常大的地方。
都朗培中心的雅思家提示烤,空表达需要注意区分:在空状里,in 内部, on 表接壤, to表分开。
成表常用的空:lies 靠近on the⋯ sideof the面⋯is located坐落on both sides of两is situated in位于just off靠⋯近across 交叉on the opposite side在另一parallel平行on the border在上intersect交点center/middle/central area中near/next to/close to/adjacent to靠近例句: It lies 450 kilometers from the nearest city, which is ofthe KK mountain.on the north sidePart 3:表顺序表序的使用在流程中是典型,表序的关能使描述的流程更加清晰,构条理明。
雅思写作Task1曲线图考官范文(10)(最新版)编制人:__________________审核人:__________________审批人:__________________编制学校:__________________编制时间:____年____月____日序言作文(composition)是经过人的思想考虑和语言组织,通过文字来表达一个主题意义的记叙方法。
作文分为小学作文,中学作文,大学作文(论文)。
作文体裁包括:记叙文、说明文、应用文、议论文。
作文并不神秘,要想写好一篇文章,首先要多看,多想,勤于观察,积累素材。
只有细致的观察生活,积累素材才是写好作文的基础。
首先要明确你要写的主题,认真的审题,列出大纲,不要只注意题目中要求的字有多少,要多注意题目的本身,要多读多想,准确的用好词语和修饰语。
这是审题的关键,要确立好主题的依据,要精心的选材,布局列题,有的材料,还要分析整理。
这就要对材料进行分类,比较,概括,筛选。
我们不要象盖房子那样的把所有的材料都堆砌起来,要合理恰当的组合,具体的说开头和结尾要略写,那么经过就要仔细的推敲,修辞,润色,写好以后不要急于交稿,反复检查认真的修改。
古人说:书读百遍,其义自见。
熟读唐诗三百首,不会作诗也会吟。
这些都说明一个道理,只要你多看书,多读书对你的写作文有一定的好处。
只要你明白这样的一个道理,作文就是要你把生活中喜,怒,哀,乐用文字经过加工,修饰。
整理,也就是我们说的作文。
作文内容英语作文啦雅思频道特为大家收集整理了雅思写作Task1曲线图考官范文。
认真研读一定的雅思范文及作文模板可以帮助我们检验自己的写作水平,并能很好地吸收和应用优秀范文里的优秀内容~更多雅思报名官网的最新消息,最新、最专业的雅思备考资料,英语作文啦将第一时间为大家发布。
The graph and table below give information about water use worldwide and water consumption in two different countries.Summarize the information by selecting and reporting the main features, and make comparisons where relevant.Sample Answer:The graph shows how the amount of water used worldwide changed between 1900 and 2000 and water consumptions of two countries compared to their population.Throughout the century, the largest quantity of water was used for agricultural Purposes, and this increased dramatically from about 500 km³ to around 3,000km³ in the year 2000. Water used in the industrial and domestic sectors also increased, but consumption was minimal until mid-century. From 1950 onwards, industrial use grew steadily to just over 1,000 km³, while domestic use rose more slowly to only 300 km³, both far below the levels of consumption by agriculture.The table illustrates the differences in agriculture consumption in some areas of the world by contrasting the amount of irrigated land in Brazil (26,500 km³) with that in the D.R.C. (100 km²). This means that a huge amount of water is used in agriculture in Brazil, and this is reflected in the figures for water consumption per person: 359 m³ compared with only 8 m³ in the Congo. With a population of 176 million, the figures for Brazil indicate how high agriculture water consumption can be in some countries.(Approximately 275 words)。
雅思写作样例写作task1 流程图曲线图表格图task21.Some people think that examinations have some bad effects on students. Some people say they have some good effects on education. Discuss both sides and give your opinion.2.Nowadays it is difficult for university graduates to find a job. Analyze the personal and social reasons and offer some solutions.3.In some countries, children start school at the age of seven, so they could have more time to build relationship with their parents. In other countries, Some think that children start school as young as possible.Discuss both views and give your own opinion.4.Some people think children should obey the rules their parents and teachers set and listen to them, but others think less control will help children to deal with their future adult life.Discuss both views and give your own opinion.5.Some people think that teachers should be responsible for teaching students to judge what is right and wrong so that they can behave well. Others say that teachers should only teach students academic subjects. Discuss both views and give your opinion.6.It has been suggested that everyone in the world want to own a car, a TV and a fridge. Do you think disadvantage of such a development outweigh advantages?To what extent do you agree or disagree?7. Some people hold that the development of modern technology leads to environmental pollution and energy shortage. Do you agree or disagree?8.When we seek a future career, what factors should we consider? Whose suggestions should we consider?9.It becomes more popular to find out the history of one’s family. What are the reasons for people to do this and do you think it is a positive or negative development?10.Studies suggest that children spend more time on watching TV than they did in the past and spend less on doing active or creative things.Why do you think this is the case? Suggest some ideas to solve the problem.。
组合图是雅思小作文里常考的题型之一,其写作非常值得我们深入研究。
现专供一组合图(组合图+饼图或pie chart + line chart)写作范例和各位“雅友”一起分享,期望对大家的组合图写作带去一些启发和帮助。
不过,在鉴赏前还是请各位先看图表,并思考以下问题:* 饼图和曲线图各自展示了什么数据在哪个时间点或段的变化特征?* 在饼图中,数据总值为多少?它由几部分组成?每一部分各代表什么?各自所占百分比又是多少?百分比从大到小如何排列的?谁最大?谁最小?* 曲线图有何特征?根据特征,曲线可以分成几段来描述?起点值、终点值、峰值、谷值多少?各自对应的时间点又是什么?WRITING TASK 1:雅思口语考试最新评分标准雅思考试小作文—图表作文逻辑分析雅思流程图作文—你不知道的秘密雅思写作流程图的注意事项如何在20分钟内写出不低于6分的雅思小作文雅思流程图作文的注意事项雅思零基础三个月创6分奇迹You should spend about 20 minutes on this task.* The chart and graph below give information about sales and share prices for Coca-Cola.* Summarise the information by selecting and reporting the main features, and make parisons where relevant.You should write at least 150 words.写作范文:The pie chart shows the worldwide distribution of sales of Coca-Cola in the year 2000 and the graph shows the change in share prices between 1996 and 2001.In the year 2000, Coca-Cola sold a total of 17.1 billion cases of their fizzy drink product worldwide. The largest consumer was North America, where 30.4 per cent of the total volume was purchased. The second largest consumer was Latin America. Europe and Asia purchased 20.5 and 真的不掉线吗??、????????????16.4 per cent of the total volume respectively, while Africa and the Middle East remained fairly small consumers at 7 per cent of the total volume of sales.Since 1996, share prices for Coca-Cola have fluctuated. In that year, shares were valued at approximately $35. Between 1996 and 1997, however, prices rose significantly to $70 per share. They dipped a little in mid-1997 and then peaked at $80 per share in mid-98. From then until 2000 their value fell consistently but there was a slight rise in mid-2000.真的不掉线吗??、????????????文言文临场翻译的技巧及七大误区临场翻译的技巧古文翻译是对古汉语知识的综合能力的训练。
WRITING TASK 1You should spend about 20 minutes on this task.The graph below gives information about cinema attendancein Australia between 1990 and the present, with projections to 2010.Summarise the information by selecting and reporting the main features, and make comparisons where relevant.Write at least 150 words.The graph shows percentages of cinema attendance at least once a year in Australia between 1990 to 2010 with projections for the future. The graph is described by 4 groups of different ages which are 14 to 24, 25 to 34, 35 to 49 and over 50 year olds.The youngest age group people have been going to cinema more than any other age groups and the percentage has been keeping very high at approximately90% since 1990. It is predicted to keep the high and to increase more from 2006.The middle age groups people have enjoyed going cinema between 60% to 80%. The percentage of age 25 to 34 group has been higher than the one of age 35 to 49 group but from 2006 the percentage of 25 to 34 year olds people will decrease while the one of35 to 49 year olds people will increase and get higher than the other one.The oldest people seem to go cinema less than the other groups but the percentageof the attendance has slightly going up by 15% from 40% to 55% between 1990 to 2004 and it will keep increasing to 60% by 2010.Overall, it seems the younger age people, the more going to cinema.(210 words)【考官评语】Band 6This response addresses the requirements of the task and selects relevant material to describe. Key features and an overview are presented, although clearer highlighting, more support and a more comprehensive overview would be needed to reach a higher band. Information is well-organised and there is a clear overall progression in the response. There is some effective use of cohesive devices, but only limited use of reference and substitution. The range of vocabulary is not wide, but it is adequate for the task. Control of word form and spelling is consistentlygood, although there are some clumsy noun phrases that indicatelimited flexibility. The candidate attempts to use a mix of simple and complex sentences, but control is variable and grammatical errors or omissionsare quite intrusive at times. Figures are poorly integrated into sentences and indicate evident limitations.。
雅思小作文TASK1图表题规律注意事项:1.Task1就是客观写作,要求客观真实。
2.客观性:不应该有任何图里没有而靠自己主观想象加入得成分。
结尾段针对图形做出得总结性结论也应该就是根据图表得实际内容做出得符合逻辑得总结。
准确性:图表里面得数据介绍要力求精确,不能抄错数字。
但当一个特征点没有落在一个准确得坐标值上时,允许进行合理得目测或估计一个大概数值。
详尽性:要有层次感,并不需要把所有得数字都推到文章里。
3.类型Table表格题LineGraph线图BarChart柱状图PieChart饼状图ProcessChart流程图4.瞧图要注意单位,标题与图例。
5.对于多数小作文题,题中给出了几个图就对应得写出几个主体段。
题目里只给出一个图,根据图中包含几类图形元素写几个主体段。
图中只给了一个图,但图中所含图形元素很多,则分类。
题目中出现多线多柱多饼,用“对应提取法“,把每组里得对应元素提出来组织主体段。
6.时态与发生时间意义对应。
陈述永恒事实得句型,其主句得谓语动词必定用一般现在时。
若题目里没有出现时间,则全文都使用一般现在时。
7.结构开头段(1~2句)改写原题主体段1总体概括具体介绍数字主体段N总体概括具体介绍数字结尾段(1~2句)介绍总数(若图里并没有明确得给出总数,则省略)结论(根据图里得数据得出有一定合理性得结论)8.开头段得改写题目中改写成Show illustrate /compareProportion percentageInformation dataThe number/amount of the figure forFamily householdMales menFemale womenInfluence affect/effectCategories kinds/typesSubway system underground railway/train systemStore shop9.介绍数据或描述变化趋势得常用词。
雅思写作图表题之模板和词汇汇总task1图表题是雅思写作里最好掌握的一块,框架是固定的,词汇是有限的,考场上套用就可以快速写完!每段框架如下:段落1: 开头:总述图表内容(改写题目)段落2:动态图表-描述起点信息;静态图表-描述最值信息(最大最小最高最低……)段落3:趋势变化+终点;比较数据、分析关联段落4-结尾:总述总体特征/趋势变化开头/结尾总述:The graph/figure/table/pie chartillus trates/demonstrates/describes……The graphs show the general trend in …The statistics show that …The graph provides some interesting data regarding …(记两个就可,一个放开头,一个放结尾。
记得注意是单数图表还是复数图标哦)描述最值信息:… was the largest, at 220 grams per person per week.… was t he smallest (95 grams)… was the largest, with 220 grams consumed perweek, while that of … was the least (…peak at;reach a peak; reach the highest point达到最高峰bottom out; fall to/ hit the lowest point 降到最低点描述百分比:According to the figure, it is obvious that the most (adj.) component is A, which accounts for a% of all. B is the next largest proportion/part, b%, m% lower than A, followed closely by C (c%).The above three items take up about n% of all. By contrast, D, E, F make up a small percentage of the t otal…, which are p%, q% and r% respectively.Comprise only a small percentage. Stand at m%...描述趋势变化:(一)词汇1、上升:rise, increase, climb, grow, go up. (迅速上升)boom, surge, soar2、下降:fall, decrease, decline, drop, go down, dip, reduce. (骤降)slump3、不变:level out/off, remain stable/steady, stay constant, maintain the same level4、波动:fluctuate around5、幅度大:dramatically; sharply; rapidly;substantially; considerably; significantly; markedly6、幅度中等:moderately; gradually; steadily7、幅度小:slightly; minimally(二)句型1. The number of people increase steadily from approximately 300 at 6a.m. to 450 to 8a.m.2. There is a steady increase in the number of people from … to …3. There are increasingly more people at the subway station from … to …4. The time from 6a.m. to 8a.m./The subway station witnesses a steady increase in …5. A noticeable increase can be found/seen in the …6. The trend is a steady increase in the number of …7. The number of … showed an upward trend from …衔接词:then/ from then on/ from this time onwards…after… / before… which is followed by…however/ by contrast / on the contrary / , while / , whereassimilarly, / likewise, …。
这六篇必背小作文之前推送过,还没认真准备的同学磨磨枪吧。
一定要背诵下来!差点忘了告诉第一次看到必背小作文系列的同学,此六篇文章是线、饼、柱、表、地图和流程的极具代表性文章,要做到活学活用、触类旁通。
The graph illustrates changes in the amounts of beef, lamb, chicken and fish consumed in a particular European country between 1979 and 2004.In 1979 beef was by far the most popular of these foods, with about 225 grams consumed per person per week. Lamb and chicken were eaten in similarquantities (around 150 grams), while much less fish was consumed (just over 50 grams).However, during this 25-year period the consumption of beef and lamb fell dramatically to approximately 100 grams and 55 grams respectively. The consumption of fish also declined, but much less significantly to just below 50 grams, so although it remained the least popular food, consumption levels were the most stable.The consumption of chicken, on the other hand, showed an upward trend, overtaking that of lamb in 1980 and that of beef in 1989. By 2004 it had soared to almost 250 grams per person per week.Overall, the graph shows how the consumption of chicken increased dramatically while the popularity of these other foods decreased over the period.柱图You should spend about 20 minutes on thistask.Thecharts below show the levels of participation in education and science indeveloping and industrialized countries in 1980 and 1990.Write a report a university lecturer describing the information shownbelow.You should write at least 150 words.The data shows the differences between developing and industrialized countries’ part icipation in education and science.In terms of the number of years of schooling received, we see that the length of time people spend at school in industrialized countries was much greater at 8.5 years in 1980, compared to 2.5 years in developing countries. The gap was increased further in 1900 when the figures rose to 10.5 years and 3.5 years respectively.We can see a similar pattern in the second graph, which shows that the number of people working as scientists and technicians in industrialized countries increased from 55 to 85 per 1,000 people between 1980 and 1990, while the number in developing countries went from 12 to 20.Finally, the figures for spending on research and development show that industrialized countries more than doubled their spending, from $200bn to$420bn, while developing countries decreased theirs , from$75bn down to $25bn.Overall we can see that not only are there very large differences between the two economies but that there gaps are widening.The charts compare the sources of electricity in Australia and France in the years 1980 and 2000. Between these years, electricity production almost doubled, rising from 100 units to 170 in Australia, and from 90 to 180 units in France.In 1980 Australia used coal as the main electricity source (50 units) and the remainder was produced from natural gas, hydro power (each producing 20 units) and oil (which produced only 10 units). By 2000, coal had becomethe fuel for more than 75% of electricity produced and only hydro continued to be another significant source supplying approximately 20%.In contrast, France used coal as a source for only 25 units of electricity in 1980, which was matched by natural gas. The remaining 40 units were produced largely from oil and nuclear power, with hydro contributing only 5 units. But by 2000, nuclear power, which was not used at all in Australia, had developed into the main source, producing almost 75% of electricity, at 126 units, while coal and oil together produced only 50 units. Other sources were no longer significant.Overall, it is clear that by 2000 these two countries relied on different principal fuel sources: Australia relied on coal and France on nuclear power.表格The take below gives information about the underground railway systems in six cities.Summarise the information by selecting and reporting the main features, and make comparisons where relevant.You should write at least 150 words.Underground Railways SystemsThe table shows the detailed information regarding the underground railway systems in six cities, namely, London, Paris, Tokyo ,Washington DC, Kyoto and Los Angeles.London has the oldest underground railway system among the six cities which was opened in 1863. AndParis is the second oldest, and it was openedin 1900. This was then followed by other four cities,namely,Tokyo,WashingtonDC andKyoto with the opening date of 1927, 1976, and 1981 respectively. As forLos Angeles, it is the last one in this table to have its own underground railway system (opened in 2001).In terms of the size of the railway system, Londonenjoys the largest underground railway systems, with 394 kilometres of route in total, which is nearly twice as large as that in Paris(199 kilometres). Kyoto, in contrast, has the smallest system, for it only has 11 kilometres of route, which is nearly 1/36 of the route of London. The other three cities(Tokyo, Washington DC, and Los Angeles) have 155, 126 and 28 kilometres respectivelyInterestingly, Tokyo, which only has 155 kilometres of route, enjoys the greatest number of passengers per year, at 1927 million passengers. The system inParis has the second greatest number of passengers, at 1191 millions passengers per year. The smallest underground railway system,Kyoto, serves the smallest number (only 45 people).In conclusion, the underground railway systems in different cities vary a lot in the opening date, the size as well as the number of passengers served per year.地图The following two maps show the development of a coastal city from 1950 to 2007.Summarize the information by selecting and reporting the main features, and make comparisons where relevant.The two maps illustrate the changes of a coastal city between 1950 and 2007. We can see clearly that the city became more and more modern.1n 1950, the city was like a small village, with vast grassland areas all over the city. There was a sea in the north of this city, with a park to the west. In front of the park, there was a big building area where things were under construction. By that time, three large areas were all grasslands, with a cross road dividing them.However, when it comes to 2007, things experienced significant changes.A new apartment had been built where the park was, and the original building areas were converted into industry buildings such as parks, parking lots and swimming pools. The most obvious changes were that the former grasslands disappeared, becoming cinemas in the southwest, shops in the southeast, and houses in the northeast. On the north side, although the sea was still there, a wharf was built in it so people could travel more easily by sea.Finally, although there was still a cross road in the city, the horizontal road was moved to the south. By doing so, industry buildings and houses could be left more places to develop. Anyway, the city had experienced tremendous changes throughout the 57-year period.he first diagram shows that there are four main stages in the life of the silk worm.First of all, eggs are produced by the moth and it takes ten days for each egg to become a silkworm larva that feeds on mulberry leaves. This stage lasts for up to six weeks until the larva produces a cocoon of silk thread around itself. After a period of about three weeks, the adult moths eventually emerge from these cocoons and the life cycle begins again.The cocoons are the raw material used for the production of silk cloth. Once selected, they are boiled in water and the threads can be separatedin the unwinding stage. Each thread is between 300 and 900 metres long, which means they can be twisted together, dyed and then used to produce cloth in the weaving stage.Overall, the diagrams show that the cocoon stage of the silkworm can be used to produce silk cloth through a very simple process.。
这六篇必背小作文之前推送过,还没认真准备的同学磨磨枪吧。
一定要背诵下来!差点忘了告诉第一次看到必背小作文系列的同学,此六篇文章是线、饼、柱、表、地图和流程的极具代表性文章,要做到活学活用、触类旁通。
The graph illustrates changes in the amounts of beef, lamb, chicken and fish consumed in a particular European country between 1979 and 2004.In 1979 beef was by far the most popular of these foods, with about 225 grams consumed per person per week. Lamb and chicken were eaten in similarquantities (around 150 grams), while much less fish was consumed (just over 50 grams).However, during this 25-year period the consumption of beef and lamb fell dramatically to approximately 100 grams and 55 grams respectively. The consumption of fish also declined, but much less significantly to just below 50 grams, so although it remained the least popular food, consumption levels were the most stable.The consumption of chicken, on the other hand, showed an upward trend, overtaking that of lamb in 1980 and that of beef in 1989. By 2004 it had soared to almost 250 grams per person per week.Overall, the graph shows how the consumption of chicken increased dramatically while the popularity of these other foods decreased over the period.柱图You should spend about 20 minutes on thistask.Thecharts below show the levels of participation in education and science indeveloping and industrialized countries in 1980 and 1990.Write a report a university lecturer describing the information shownbelow.You should write at least 150 words.The data shows the differences between developing and industrialized countries’ participation in education and science.In terms of the number of years of schooling received, we see that the length of time people spend at school in industrialized countries was much greater at 8.5 years in 1980, compared to 2.5 years in developing countries. The gap was increased further in 1900 when the figures rose to 10.5 years and 3.5 years respectively.We can see a similar pattern in the second graph, which shows that the number of people working as scientists and technicians in industrialized countries increased from 55 to 85 per 1,000 people between 1980 and 1990, while the number in developing countries went from 12 to 20.Finally, the figures for spending on research and development show that industrialized countries more than doubled their spending, from $200bn to$420bn, while developing countries decreased theirs , from$75bn down to $25bn.Overall we can see that not only are there very large differences between the two economies but that there gaps are widening.The charts compare the sources of electricity in Australia and France in the years 1980 and 2000. Between these years, electricity production almost doubled, rising from 100 units to 170 in Australia, and from 90 to 180 units in France.In 1980 Australia used coal as the main electricity source (50 units) and the remainder was produced from natural gas, hydro power (each producing 20 units) and oil (which produced only 10 units). By 2000, coal had becomethe fuel for more than 75% of electricity produced and only hydro continued to be another significant source supplying approximately 20%.In contrast, France used coal as a source for only 25 units of electricity in 1980, which was matched by natural gas. The remaining 40 units were produced largely from oil and nuclear power, with hydro contributing only 5 units. But by 2000, nuclear power, which was not used at all in Australia, had developed into the main source, producing almost 75% of electricity, at 126 units, while coal and oil together produced only 50 units. Other sources were no longer significant.Overall, it is clear that by 2000 these two countries relied on different principal fuel sources: Australia relied on coal and France on nuclear power.表格The take below gives information about the underground railway systems in six cities.Summarise the information by selecting and reporting the main features, and make comparisons where relevant.You should write at least 150 words.Underground Railways SystemsThe table shows the detailed information regarding the underground railway systems in six cities, namely, London, Paris, Tokyo ,Washington DC, Kyoto and Los Angeles.London has the oldest underground railway system among the six cities which was opened in 1863. AndParis is the second oldest, and it was openedin 1900. This was then followed by other four cities,namely,Tokyo,WashingtonDC andKyoto with the opening date of 1927, 1976, and 1981 respectively. As forLos Angeles, it is the last one in this table to have its own underground railway system (opened in 2001).In terms of the size of the railway system, Londonenjoys the largest underground railway systems, with 394 kilometres of route in total, which is nearly twice as large as that in Paris(199 kilometres). Kyoto, in contrast, has the smallest system, for it only has 11 kilometres of route, which is nearly 1/36 of the route of London. The other three cities(Tokyo, Washington DC, and Los Angeles) have 155, 126 and 28 kilometres respectivelyInterestingly, Tokyo, which only has 155 kilometres of route, enjoys the greatest number of passengers per year, at 1927 million passengers. The system inParis has the second greatest number of passengers, at 1191 millions passengers per year. The smallest underground railway system,Kyoto, serves the smallest number (only 45 people).In conclusion, the underground railway systems in different cities vary a lot in the opening date, the size as well as the number of passengers served per year.地图The following two maps show the development of a coastal city from 1950 to 2007.Summarize the information by selecting and reporting the main features, and make comparisons where relevant.The two maps illustrate the changes of a coastal city between 1950 and 2007. We can see clearly that the city became more and more modern.1n 1950, the city was like a small village, with vast grassland areas all over the city. There was a sea in the north of this city, with a park to the west. In front of the park, there was a big building area where things were under construction. By that time, three large areas were all grasslands, with a cross road dividing them.However, when it comes to 2007, things experienced significant changes.A new apartment had been built where the park was, and the original building areas were converted into industry buildings such as parks, parking lots and swimming pools. The most obvious changes were that the former grasslands disappeared, becoming cinemas in the southwest, shops in the southeast, and houses in the northeast. On the north side, although the sea was still there, a wharf was built in it so people could travel more easily by sea.Finally, although there was still a cross road in the city, the horizontal road was moved to the south. By doing so, industry buildings and houses could be left more places to develop. Anyway, the city had experienced tremendous changes throughout the 57-year period.he first diagram shows that there are four main stages in the life of the silk worm.First of all, eggs are produced by the moth and it takes ten days for each egg to become a silkworm larva that feeds on mulberry leaves. This stage lasts for up to six weeks until the larva produces a cocoon of silk thread around itself. After a period of about three weeks, the adult moths eventually emerge from these cocoons and the life cycle begins again.The cocoons are the raw material used for the production of silk cloth. Once selected, they are boiled in water and the threads can be separatedin the unwinding stage. Each thread is between 300 and 900 metres long, which means they can be twisted together, dyed and then used to produce cloth in the weaving stage.Overall, the diagrams show that the cocoon stage of the silkworm can be used to produce silk cloth through a very simple process.。