
雅思写作小作文范文雅思写作折线图(线状图)美国肉类消耗量
今天我们雅思写作小作文范文的文章来研究下折线图(线状图)。该图表来自于华盛顿邮报的网站,数据相对于真正的雅思考试而言要更多一些。因此如何挑选数据和进行对比就显得尤为重要。小编搜集了一篇考官写的范文,以供大家参考。
雅思写作小作文题目
雅思写作小作文范文
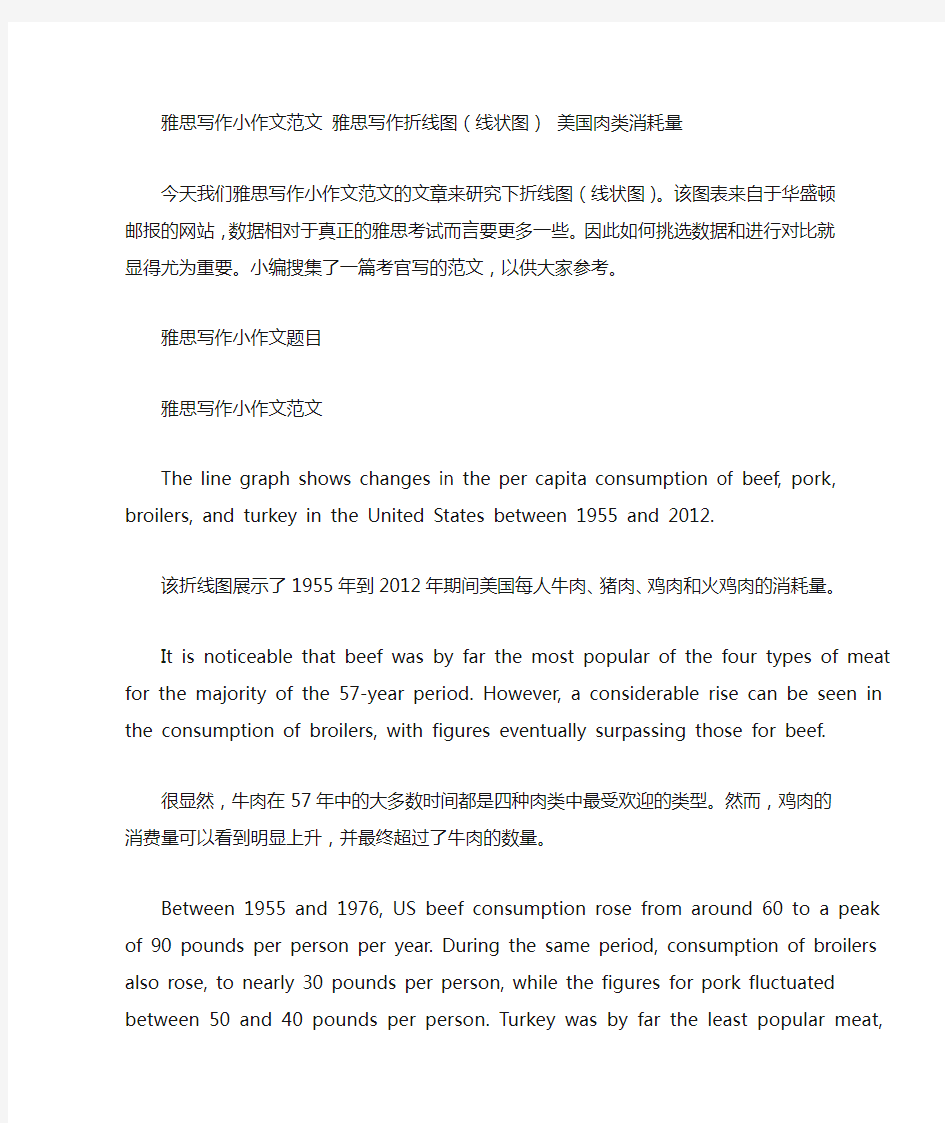
The line graph shows changes in the per capita consumption of beef, pork, broilers, and turkey in the United States between 1955 and 2012.
该折线图展示了1955年到2012年期间美国每人牛肉、猪肉、鸡肉和火鸡肉的消耗量。
It is noticeable that beef was by far the most popular of the four types of meat for the majority of the 57-year period. However, a considerable rise can be seen in the consumption of broilers, with figures eventually surpassing those for beef.
很显然,牛肉在57年中的大多数时间都是四种肉类中最受欢迎的类型。然而,鸡肉的消费量可以看到明显上升,并最终超过了牛肉的数量。
Between 1955 and 1976, US beef consumption rose from around 60 to a peak of 90 pounds per person per year. During the same period, consumption of broilers also rose, to nearly 30 pounds per person, while the figures for pork fluctuated between 50 and 40 pounds per person. Turkey was by far the least popular meat, with figures below 10 pounds per capita each year.
在1955年到1976年期间,美国牛肉的消耗量从每人每年60磅,上涨到最高点每人每年90磅。在同样的时间段里,鸡肉的消费量也在上升,到达将近每人30磅。而猪肉的消费量则在每人50磅到40磅之间徘徊。火鸡肉到目前为止是最不受欢迎的肉类,每年每人的消耗量低于10磅。
By 2012, the amount of beef consumed by the average American had plummeted to around 50 pounds, but the consumption of broilers had doubled since the 1970s, to approximately 55 pounds per capita. By contrast, there were no significant changes in the trends for pork and turkey consumption over the period as a whole.
到2012年,平均每位美国人牛肉的消耗量跌落到大约50磅,但是鸡肉的消费量上涨到了20世纪70年代的两倍,到达大约每人55磅。相比之下,猪肉和火鸡肉的消费类在整个时间段内没有太大的变化趋势。
雅思写作小作文高分范文,快速提升写作成绩
雅思经典小作文柱状图4篇范文+写作要点分析 C1T3 题目 The chart below shows the amount of money per week spent on fast foods in Britain. The graph shows the trends in consumption of fast foods. Write a report a university lecturer describing the information shown below. The chart shows that high income earners consumed considerably more fast foods than the other income groups, spending more than twice as much on hamburgers (43 pence per person per week) than on fish and chips or pizza (both under 20 pence). Average income earners also favored hamburgers, spending 33 pence per person per week, followed by fish and chips at 24 pence, then pizza at 11 pence. Low income earners appear to spend less than other income groups on fast foods, though fish and chip remains their most popular fast food, followed by
雅思写作大作文范文 在英文写作中,逻辑关系至关重要。所以在实际教学中我们都会把逻辑关系作为一个很重要的内容来教授。这些逻辑关系主要涉及:并列或递进关系、让步或转折关系、因果关系和举例等。其中举例论证是一种很常用的论证方式,因为举例论证运用具体实例来论证观点,所以更具信服力,也更易于读者理解,因此受到作者及读者的普遍欢迎。下面专家将通过它的连接方式与您共同探讨一下举例论证以及如何举例子。 一、外显连接 如:it is undeniable that mobile phones have facilitated our lives in many different ways. For example, when an emergency ours, such as a traffic aident or a violent crime, mobile phones can help the victims to call the police or an ambulance immediately for help. 本例中,for example 引出例子论证“mobile phones have facilitated our lives in many different ways.”而后面的such as 则引出emergency 的具体形式。For instance 与它的用法完全相同,即后面要接句子例证。 Like, such as, take…as 等
直接名词(或相当于名词的词)。由于这些都是基本常识,这里不再赘述。 为了使连接词多样化,建议考生运用下面的一些短语(或句式)连接论点和论据:…is a case in point; …serve as a typical example;…can be taken as an example; one example is that… another one is that等。 如:Working part time when you are studying in university is beneficial to your life. I myself is a case in point(or ‘my experiences serve as a typical example’). Through those experiences, I have learned to be independent and responsible. 二、内化连接 实际上,大家看原汁原味的文英文文章会发现有些信息的连接不用外显式,而是通过某些特定的词或者特定的方式给读者以清晰的层次感,从而使文章信息传递更通畅。 下面我们来看一下哪些例证可以省去连接词,实现内化连接。
2019年雅思写作小作文流程图解析及范文:废纸回收 The chart below shows the process of waste paper recycling. 范文: The flow chart shows how waste paper is recycled. It is clear that there are six distinct stages in this process, from the initial collection of waste paper to the eventual production of usable paper. At the first stage in the paper recycling process, waste paper is collected either from paper banks, where members of the public leave their used paper, or directly from businesses. This paper is then sorted by hand and separated according to its grade, with any paper that is not suitable for recycling being removed. Next, the graded paper is transported to a paper mill. Stages four and five of the process both involve cleaning. The paper is cleaned and pulped, and foreign objects such as staples are taken out. Following this, all remnants of ink and glue are removed from the paper at the de-inking stage. Finally, the pulp can be processed in a paper making machine, which makes the end product: usable paper. (160 words, band 9)
雅思写作Task1饼状图考官范文(4) 本文为大家收集整理了雅思写作Task1饼状图考官范文(4)。认真研读一定的雅思范文及作文模板可以帮助我们检验自己的写作水平,并能很好地吸收和应用优秀范文里的优秀内容。 The table below shows CO2 emissions for different forms of transport in the European Union. The Pie Chart shows the percentage of European Union funds being spent on different forms of transport. Write a report for a university lecturer describing the information in the graph below.
Sample Answer: The given graphs provide information on the amount of Carbon dioxide emission per person from different vehicles in the European Union and also show the expenditures on different modes of transportations. As is observed from the given illustration, the highest amount of CO2 per person is emitted by the Air transports and European Union spends highest percentage of funds for the road transportation system. According to the bar graph, a single passenger of a personal cars emit around 130 gm of CO2 per kilometer while a passenger in a bus contribute to 65 gm of emission per kilometer. Coaches, maritime and rail passengers emit the lowest amount of CO2which is about 50 grams per passenger in a kilometer. Finally a single passenger of airplane contributes to 370 km of CO2 per kilo which is the highest amount of CO2 emission among the given transportations. Based on the pie chart, the European Union spent the highest amount (52%) on the road transportation system while spent only 1% or 2% on ports, waterway airport
雅思写作小作文范文118篇之范文14 以下是三立在线雅思网给大家分享的雅思写作小作文范文118篇:范文14。希望对大家的雅思备考有所帮助,更多雅思备考资料欢迎大家随时关注三立在线雅思网。 范文14 The computer is widely used in education,and some people think teachers do not play important roles in the classroom. To what extend do you agree or disagree? In this period of communication,computer has been used in all kinds of fields widely, and plays a particular role in our lives. Especially computer has become more and more important in educational field, therefore dozens of people considered teachers could be replaced computers that will go with the current of the times. The above point is certainly wrong; this essay will outline three reasons. The main reason is that people’s brain better than computer. Firstly, people design all kinds of computer’s programs. Secondly, computer doesn’t have logistic ideation. Computer only can defend on that designer inputted computer’s programs to judge a question’s right or wrong. In other words, computer can’t defend on thinking that computer independently analyzes a question’s right or wrong. In case, designer inputted programs that are wrong. Computer output the result that also will be wrong. If this kind of problem happened in classroom, students would be infused plenty of wrong information.
2016年4月30日雅思写作考试大作文范文多版本汇总 4月30日雅思写作大作文考得是shopping habits (购物习惯)与agegroup(年龄段)之间的关系。也就是说,人们的购物习惯到底是由什么决定的?是年龄决定的,还是其他因素决定的?原题观点是:人的购物习惯更多是由年龄决定的。你也许同意这个观点,然后提出原因,给出例证;你也许不同意这个观点,那么你就得提出并论证什么因素决定了人们的购物习惯。一起来看看关于这个话题,各机构的范文都是怎么写的吧! >>>4月雅思考试真题写作范文全汇总(多版本+语料),速速查看 Task:生活类题材 People’s shopping habits depend more on the age group they belong to than any other factor. To what extent do you agree or disagree? 和其他任何因素比起来,人们的购物习惯更多的取决于他们所在的年龄层,你在多大程度上同意或不同意? Sample answers(点击标题查看) 1. 雅思哥版(260 words) 2016年4月30日雅思写作真题大作文参考范文(1) 核心观点句: Some people think that age is the main factor that affects people’s shopping habits but I think this is only true in some cases. 一些人认为年龄是影响人们消费习惯的主要因素,但我认为这仅仅在某些情况下上是正确的. 2. 新东方版(294 words) 2016年4月30日雅思写作真题大作文参考范文(2) 核心观点句: I tend to hold the view that age group is one of the many effects imposed on how people consume. 我倾向于认为,年龄层是对影响人们如何消费的众多因素之一。
雅思写作Task1饼状图考官范文(4) The table below shows CO2 emissions for different forms of transport in the European Union. The Pie Chart shows the percentage of European Union funds being spent on different forms of transport. Write a report for a university lecturer describing the information in the graph below. Sample Answer: The given graphs provide information on the amount of Carbon dioxide emission per person from different vehicles in the European Union and also show the expenditures on different modes of transportations. As is observed from the given illustration, the highest amount of CO2 per person is emitted by the Air transports and European Union spends highest percentage of funds for the road transportation system.
雅思大作文写作范文精选 多看,多练,多积累,写作能力才会提高,今天和同学们来分享一下雅思大作文范文,希望能够帮助到大家,下面就和大家分享,来欣赏一下吧。 雅思大作文写作范文——大学是否应该同时进行行为习惯的教育? 题目: Some people think schools should teach students to form good behavior in addition to providing formal education. To what extent do you agree or disagree? 大学是否应该在教授知识的同时进行行为习惯的教育? 范文: It is often argued that teachers should be accountable for their student’s good and bad conducts as they are responsible for teaching them the morality of their children. Others, on the other hand, opi ne that educators’ role should be limited to imparting academic (educational) curriculum among students. This essay will discuss both points of view and argue that instructors can share the
responsibility for inculcating socially acceptable manners in students along with academic course training, followed by a reasoned conclusion. 人们常说,教师应该对学生的好与坏行为负责,因为他们有责任教导他们的孩子的道德。另一方面,另一些人则认为教育者的角色应该局限于向学生传授学术(教育)课程。这篇*将讨论这两种观点,并认为教师可以分担责任,在进行学术课程培训的同时,向学生灌输社会可接受的礼仪,然后得出一个合理的结论。 Many support the teacher’s role in students’ behaviour modification. Firstly they think that students spend much more time with their educators in school than with their parents. So it is easy for the trainers to develop a good interpersonal relationship with students and, thereby, can have a great influence on their trainees. In addition, they can give moral lessons through moral classes. Moreover, most of the students find their teachers as their role model. So the students accept the instructions of their professors’ than anyone else. 许多人支持教师在学生行为矫正中的作用。首先,他们认为学生在学校花更多的时间和老师在一起,而不是和父母在一起。因此,培训师很容易与学生建立良好的人际关系,从而对他们的学员产生很大的影响。此外,他们可以通过道德课进行道德教育。
1. 该表格描述了在...年之...年间...数量的变化。 2. 该柱状图展示了... 3. 该图为我们提供了有关...有趣数据。 4. 该图向我们展示了... 5. 该线形图揭示了... 6. 这个曲线图描述了...的趋势。 7. 数据(字)表明... 8. 该树型图向我们揭示了如何... 9. 该数据(字)可以这样理解... 10. 这些数据资料令我们得出结论... 11. 如图所示... 12. 根据这些表(数字)... 13. 如表格所示... 14. 从图中可以看出,...发生了巨大变化。 15. 从图表我们可以很清楚(明显)看到... 16. 这个图表向我们展示了... 17. 该表格描述了...年到...年间a与b的比例关系。 18. 该图描述了...总的趋势。 19. 这是个柱型图,描述了...
20. 如图所示,两条曲线描述了...的波动情况。 21. 在...至...期间,...基本不变。 22. 在...年到...的期间 23. 1995年至1998三年里... 24. 从那时起... 25. ...月(年)至...月(年)...的数量基本不变。 26. 数字急剧上升至... 27. ...至...期间...的比率维持不变。 28. ...的数目在...月(年)达到顶点,为... 29. 比率维持在... 30. ...的比例比...的比例略高(低)。 31. ...与...的区别不大。 32. 该图表表明...的数目增长了三倍。 33. ...逐年减少,而...逐步上升。 34. ...的情况(局势)到达顶(高)点,为...百分点。 35. 数字(情况)在...达到底部。 36. 数字(情况)达到底部(低谷)。 37. a是b的...倍。 38. a增长了...
雅思写作Task1饼状图考官范文(3) 本文为大家收集整理了雅思写作Task1饼状图考官范文(3)。认真研读一定的雅思范文及作文模板可以帮助我们检验自己的写作水平,并能很好地吸收和应用优秀范文里的优秀内容。 The charts below show the percentage of food budget the average family spent on restaurant meals in different years. The graph shows the number of meals eaten in fast food restaurants and sit-down restaurants. Write a report for a university lecturer describing the information in the graph below.
Sample Answer: The given illustration compares the amounts spent on restaurant foods and on home cooking foods in four different years and gives data on the number of meals eaten in two different restaurant types. As is presented in the pie chart, initially in 1970, 90% of total food budget was spent on home-made foods while only 10% was spent on restaurant foods. The amount spent on restaurant meals increased to 15% in 1980 while it reached to 35% in 1990. Finally in 200 average family spent half of the total budget in restaurant meals and that shows a rapid increase on the people’s habit of having meals in restaurants. In the line graph, we can observe that in 1970, the fast foods and sit-down restaurant meals were taken 20 thousand times each and over time these numbers kept increasing. Finally in 2000, more than 90 thousands fast food meals were eaten while the sit-down restaurant meals were eaten 50 thousand times a year. This indicates the changes of
作文范文之雅思小作文table
雅思小作文table 【篇一:雅思小作文表格图实例分析】 雅思小作文表格图实例分析 朗阁海外考试研究中心 表格图是雅思小作文的常考图形之一,也是烤鸭们在备考时必须要准备的一类题型。那么烤鸭们具体应该如何准备表格图呢?下面,朗阁海外考试研究中心的专家将以一道具体的实例,就这一题型的解题思路和步骤做出详尽的分析和解答。 the table below shows personal savings as a percentage of personal income for selected countries in 1989, 1999 and 2009. personal savings as a percentage of personal income 一、审题,决定大体写作方式 首先,读题目,了解到这幅表格图是关于“几个国家的人民个人收入中存款的百分比”以及三个时间点(据此,正文部分描述存款率是时态基调为过去时)。表格上方的title和题目表述一样,没有额外信息,因此,读一遍即可。 然后,审具体表格,决定大致写作方向和方式,即分段方式。表格的审图需要注意以下几个方面:横轴,纵轴和总体数据特征。此图中的横纵轴分别是时间和7个研究对象——7个国 家。横纵轴中间有一栏为时间,那说明,此图原则上应该按曲线图原理来写——即,描述7个国家存款率上升或下降趋势;但是,经过下一步对表格中数据总体特征的总结发现:7个国家的存款率在这一段时间内总体呈现下降趋势。这一发现说明,如果继续按照曲线图原理描述,文章会非常单调,而且对比的空间也不大;相反,同一年份里,
2018年雅思写作大作文范文之为什么要上大学 今天三立在线教育雅思网为大家带来的是2018年雅思写作大作文范文之为什么要上大学的相关资讯,备考的烤鸭们,赶紧来看看吧! 这里为大家收集整理了雅思写作大作文参考范文:为什么要上大学。希望能对大家备考雅思写作考试有帮助。 People attend college or university for many different reasons (for example, new experiences, career preparation, increased knowledge). Why do you think people attend college or university? Model Answer 1: People attend college for a lot of different reasons. I believe that the three most common reasons are to prepare for a career, to have new experiences, and to increase their knowledge of themselves and of the world around them. Career preparation is probably the primary reason that people attend college. These days, the job market is very competitive. Careers such as information technology will need many new workers in the near future. At college, students can learn new skills for these careers and increase their opportunities for the future. Students also go to college to have new experiences. For many, it is their first time away from home. At college, they can meet new people from many different places. They can see what life is like in a different city. They can learn
雅思小作文写作
Writing Notes Date: July, 9th, 2017 Task I 1.Three Types i.Data: Bar Chart, Line Graph, Table, Pie Chart ◆图表类型:动态图、静态图 ◆动态图:有两个或以上时间 ◆重点 ●趋势 ●特殊值:起点、重点、最高点、最低点、交叉点 ◆静态图:只有一个或者没有时间 ●比较描述对象:使用倍数、比较级 ii.Process: Flow Chart iii.Map ◆Describe the change ◆Eg: Hospital is located to the west of car park 2.评分标准 i.Task Achievement/ Task Response ◆Cover the Requirements of the task ◆No off topics ◆不能添加主观想法,只能描述 ii.Coherence and Cohesive ◆使用路标性词汇:顺承和转折 iii.Lexical Resource ◆使用非高频词汇 ◆Use words and phrases naturally and appropriately ◆Vocabulary diversity ◆Accurate spelling words iv.Grammatical Range and Accuracy ◆Accurate grammar of sentences ◆Use different ranges of sentences, structures to achiever grammatical 3.写作方法 i.开头段 ◆图表词改写 ●The chart : bar chart, line chart, pie chart, table, diagram ◆动词shows改写 ●注意时态 ●Shows: illustrates, gives information about, compares, indicates, demonstrates ◆关键词(一定要改写) ●数量改写 ?The number of + 可数 ?The amount of + 不可数 ?The quantity of + 可/不可数 ?The figure for +可/不可数 ●百分比改写
图表作文讲解2:柱状图和饼状图
分析思路: 1.第一幅柱状图的描述单位是百万,即人数;第二幅则是百分比。 2.第二幅柱状图仅显示了1970年和2000年的信息,而第一幅柱状图显示了1970、1980、 1990、2000年的信息。 3.由第一幅柱状图可以看出,从1980年到2000年,结婚人数和离婚人数的变化趋势相似。 4.从第二幅图可以看出,在2000年,结婚和寡居的成年人的比例有所降低而从未结婚过 和离婚的比例则有所上升。 文分析 One chart①shows the number of marriages and divorces in the USA in 1970, 1980, 1990 and 2000.The other②shows the marital status of adult Americans in 1970 and 2000. 首段概述图表信息,对题目进行改写,注意动词的用法和时态。 ?描述类的常用词有:show/describe/illustrate/demonstrate/indicate;
分析思路 1.四个饼状图可以分为两组,一组是澳大利亚,一组是法国; 2.饼状图由五部分组成:coal, oil, natural gas, hydro power, nuclear power; 3.图中的时间是1980年和2000年 4.单位是units 文分析 The charts①compare the sources of electricity in Australia and France in the years 1980 and 2000. Between these years electricity production almost②doubled, ③rising from 100 units to 170 in Australia, and from 90 to 180 units in France. ①对比:compare ②翻番:double ③从多少增长到多少:rise from……to…… In 1980 Australia used coal as the main electricity source (50 units) and the①remainder was produced from natural gas, hydro power (each producing 20 units) and oil (which produced only 10 units). By 2000, coal had become the fuel for more than 75% of electricity produced and only hydro②continued to be another significant
雅思小作文模板句必备50句型 A 1.the table shows the changes in the number of...over the period from...to... 该表格描述了在...年之...年间...数量的变化。 2.the bar chart illustrates that... 该柱状图展示了... 3.the graph provides some interesting data regarding... 该图为我们提供了有关...有趣数据。 4.the diagram shows (that)... 该图向我们展示了... 5.the pie graph depicts (that).... 该圆形图揭示了... 6.this is a cure graph which describes the trend of... 这个曲线图描述了...的趋势。 7.the figures/statistics show (that)... 数据(字)表明... 8.the tree diagram reveals how... 该树型图向我们揭示了如何... 9.the data/statistics show (that)... 该数据(字)可以这样理解... 10.the data/statistics/figures lead us to the conclusion that... 这些数据资料令我们得出结论... 11.as is shown/demonstrated/exhibited in the diagram/graph/chart/table... 如图所示... 12.according to the chart/figures... 根据这些表(数字)... 13.as is shown in the table... 如表格所示... 14.as can be seen from the diagram, great changes have taken place in... 从图中可以看出,...发生了巨大变化。 15.from the table/chart/diagram/figure, we can see clearly that...or it is clear/apparent from the chart that... 从图表我们可以很清楚(明显)看到... 16.this is a graph which illustrates... 这个图表向我们展示了... 17.this table shows the changing proportion of a & b from...to... 该表格描述了...年到...年间a与b的比例关系。 18.the graph, presented in a pie chart, shows the general trend in... 该图以圆形图形式描述了...总的趋势。 19.this is a column chart showing... 这是个柱型图,描述了...
雅思写作大作文范文雅思写作报告类大型公司large businesses 今天我们雅思写作大作文范文的文章来研究下大型公司的问题。这些大型公司和跨国企业通常在广告与市场营销方面投入大量的资金,并抢占市场。这会挤占本土品牌的生存空间,并可能导致其彻底消失。那么这一现象会有那些后果,我们又能采取什么措施来抑制这一现象的发生呢?小编搜集了一篇相关的高分范文,以供大家参考。 雅思写作大作文题目 Large businesses have big budgets for marketing and promotion and, as a result, people gravitate towards buying their products. What problems does this cause? What could be done to encourage people to buy local products? 大型公司在市场营销和促销方面拥有极高的预算。因此,人们倾向于购买它们的产品。这会导致什么问题?我们能做些什么来鼓励人们购买本土的产品呢? 雅思写作大作文范文 Large businesses and international brands spend an enormous amount of money on marketing and advertising. Consequently, people tend to watch those advertisements all the time while small local businesses fail to reach their customers. This can lead to some serious problems, such as the closure of local businesses and the monopoly in business. Other than that, people could be easily trapped by large businesses. There are a few steps that can be adopted to address this issue and motivate people to buy local products. 大型公司和国际品牌在市场营销与广告上花费大量的资金。结果人们总是看这些广告,而当地的小型企业没有办法接触到顾客。这可能导致一些严重的问题,比如当地企业的倒闭和某些行业的垄断。除此之外,人们容易被大型企业所牵绊。可以采用一些措施来解决这一问题,并动员人们购买当地的产品。 Naturally, people prefer to buy products that were consciously or unconsciously publicized to their mind and thus many local businesses, even with their quality products, cannot attract consumers. This article is from Laokaoya website. The dominance of international brands and large businesses will destroy the market for locally made products and thus would make thousands of people unemployed. Moreover, large markets do their very best to attract public attention to their products and advertising is one of the best tools they have. Sensitive, creative and deceptive advertisements and marketing policies often make the people believe that they need these products. This would create a monopoly in the market and people would often be deceived. Thus consumers would be trapped by the large businesses and would have no alternatives for them but to buy products of some particular brands. 很自然地,人们更加喜欢购买那些有意识或者无意识推广到他们脑子里的产品。因此,