Transient elastography and biomarkers for liver?brosis assessment and follow-up of inactive hepatitis B carriers L.Caste′ra*, ,P.-H.Bernard ,B.Le Bailà,J.Foucher*, ,P.Trimoulet§,W.Merrouche*,P.Couzigou*
&V.de Le′dinghen*
*Service d’He′pato-Gastroente′rologie, Ho?pital Haut-Le′ve?que,Centre Hospit-alier Universitaire(C.H.U.)Bordeaux, Pessac,France.
Service d’He′pato-Gastroente′rologie, Ho?pital St-Andre′,C.H.U.Bordeaux, Bordeaux,France.
àService d’A natomo-Pathologie,
Ho?pital Pellegrin,C.H.U.Bordeaux, Bordeaux,France.
§Laboratoire de Virologie,Ho?pital Pellegrin,C.H.U.Bordeaux,Bordeaux, France.
Correspondence to:
Dr L.Caste′ra,Service d’He′patologie, Ho?pital Beaujon,AP-HP,Clichy, Universite′Denis Diderot Paris VII, France.
E-mail:laurent.castera@bjn.aphp.fr
Publication data
Submitted28August2010
First decision1October2010 Resubmitted24October2010 Accepted23November2010
EV Pub Online23December2010SUMMARY
Background
Non invasive methods for?brosis evaluation remain to be validated longi-tudinally in hepatitis B.
Aim
To evaluate longitudinally transient elastography(TE)and biomarkers for liver?brosis assessment and follow-up of hepatitis B virus(HBV)inactive carriers.
Methods
Three hundred and twenty-nine consecutive HBeAg-negative HBV patients (201inactive carriers)who underwent TE,Fibrotest and aspartate to plate-let ratio index(APRI)the same day were studied.
Results
TE(median 4.8vs. 6.8kPa,P<0.0001),Fibrotest(0.16vs.0.35, P<0.0001)and APRI values(0.28vs.0.43,P<0.0001)were signi?cantly lower in inactive carriers than in the remaining patients whereas they did not differ among inactive carriers according to HBV DNA levels.In82 inactive carriers with repeated examinations,although differences were observed among individual patients,TE values did not differ signi?cantly over time(median intra-patient changes at end of follow-up relative to baseline:)0.2kPa,P=0.12).Conversely,signi?cant?uctuations were observed for Fibrotest(+0.03,P=0.012)and APRI()0.01,P<0.05).Ele-ven inactive carriers(5.5%)had initial elevated TE values(>7.2kPa)con-?rmed during follow-up in two with signi?cant?brosis(F2and F3)on liver biopsy.
Conclusion
Non-invasive tools,particularly TE,could be useful,in addition to HBV DNA and transaminase levels,for follow-up of HBV inactive carriers as well as better selection of patients who require a liver biopsy.
Aliment Pharmacol Ther2011;33:455–465
a2010Blackwell Publishing Ltd455 doi:10.1111/j.1365-2036.2010.04547.x
Alimentary Pharmacology and Therapeutics
INTRODUCTION
Chronic hepatitis B virus(HBV)infection with negative Hepatitis B e antigen(HBeAg)is becoming the predomi-nant type of chronic HBV infection worldwide,1as well as in France.2The clinical spectrum of HBeAg-negative chronic HBV infection may range from the inactive chronic HBsAg carrier state,characterised by persistently normal alanine aminotransferase(ALT)values,low or undetectable viremia and no liver injury to active chronic hepatitis B(CHB)with elevated ALT activity,high HBV DNA levels and active liver histological lesions.It is important and sometimes dif?cult to distinguish true inactive carriers(IC)from patients with active HBeAg-negative CHB in whom phases of spontaneous remission may occur.3IC have a good prognosis with a very low risk of complications and need just to be followed up regularly.1Differential diagnosis with CHB is based lar-gely on careful monitoring of ALT activity,serum HBV DNA levels and liver histology.Although liver biopsy remains the reference method for assessment of liver dis-ease severity in chronic HBV infection,it is currently not recommended in IC.4,5In addition,liver biopsy is a painful and an invasive procedure6,7with rare but potentially life-threatening complications8,9and prone to sampling errors.10,11These limitations have stimu-lated the search for new non-invasive approaches.12–14A variety of methods including the measurement of liver stiffness,using transient elastography(TE)and biomar-kers,ranging from routinely available nonpatented scores such as APRI to more complex patented algorithms such as the Fibrotest(FT),have been proposed for the non-invasive assessment of hepatic?brosis,mainly in chronic hepatitis C.15–20Validation of these methods in hepatitis B is ongoing21–24but longitudinal data are still pending. The aim of this longitudinal study was to evaluate the value of TE and biomarkers(FT and APRI)for liver ?brosis assessment and follow-up of HBV IC. PATIENTS AND METHODS
Patients
Between June2003and June2009,412patients were referred to our centre for HBeAg-negative HBV infec-tion.The diagnosis of chronic HBV infection was based on the presence in serum of HBsAg and anti-HBe anti-bodies for more than6months.Patients with other viral infection[HIV(n=11),HCV(n=7),HDV(n=5)], other causes of liver disease(n=17)and unsuccessful liver stiffness measurements(n=43)were excluded from the study.Finally,329patients were analysed.Two hundred and one patients were considered as IC on the basis of persistently normal ALT and AST and HBV DNA <105copies?mL(<20000IU?mL)on at least two deter-minations during the past6months which corresponded to the IC de?nition when the study was initiated.25The remaining patients(n=128)were considered as HBeAg-negative chronic hepatitis(CHB).IC patients were also analysed according to the new HBV DNA threshold of 2000IU?mL proposed by EASL guidelines in2009.4
All patients were enrolled after giving their written informed consent to the study which was approved by the Local Ethics Committee.
Liver histology and staging of liver?brosis
Liver biopsy was performed according to clinical needs by senior operators using the Menghini technique with a 1.6-mm-diameter needle(Hepa?x;Braun,Melsungen, Germany).Biopsy specimens were?xed in formalin and embedded in paraf?n.All biopsy specimens were analy-sed by the same trained pathologist blinded to the results of non-invasive tests.
Liver?brosis and necroin?ammatory activity were evaluated semi-quantitatively according to the METAVIR scoring system.26,27Fibrosis was staged on a0–4scale, as follows:F0,no?brosis;F1,portal?brosis without septa;F2,portal?brosis and few septa;F3,numerous septa without cirrhosis;F4,cirrhosis.Activity was graded as follows:A0,none;A1,mild;A2,moderate;A3,severe.
Two clinically relevant end points were chosen:signif-icant?brosis(F?2)and cirrhosis(F4).The presence of signi?cant?brosis in HBV patients is considered a hall-mark of a progressive liver disease and an indication for antiviral treatment and the presence of cirrhosis triggers screening for complications such as oesophageal varices and hepatocellular carcinoma.4
Liver stiffness measurement
Liver stiffness measurements were performed using TE (FibroScan;Echosens,Paris,France).Details of the tech-nical background and examination procedure have been previously described.28Ten successful measurements were performed on each patient.The success rate was calculated as the number of validated measurements divided by the total number of measurements.The results were expressed in kilopascals(kPa).The median value of successful measurements was considered representative of the liver stiffness in a given patient, according to the manufacturer’s recommendations[inter-quartile range(IQR)<30%of the median value and suc-cess rate>60%].Unsuccessful results were de?ned as
L.C a s t e′r a e t a l.
456Aliment Pharmacol Ther2011;33:455–465
a2010Blackwell Publishing Ltd
either failure(no valid measurement)or unreliable results(valid measurements<10or success rate<60%or IQR>30%of median value).29The cut-offs used for diagnosing signi?cant?brosis and cirrhosis were those proposed by Marcellin et al.21in French patients(7.2 and11.0kPa respectively).
Liver stiffness measurements were repeated over time(every6–12months)since2005in IC patients, particularly in those with initial elevated liver stiffness values(>7.2kPa).In case of elevated liver stiffness values on at least two examinations,a liver biopsy was proposed.
Serum biomarkers
The parameters allowing the calculation of FT and APRI were determined in the same laboratory on blood sam-pled at the time of TE.The FT score was purchased from Biopredictive website(http://www.biopredictive. com).The APRI was calculated according to the original formula as follows:AST levels divided by its upper nor-mal limit?platelet count(109?L)·100.18The cut-offs used for diagnosing signi?cant?brosis and cirrhosis were those from original publications:FT values>0.48and >0.74respectively;19APRI values<0.5or?1.5and<1or ?2respectively.18
Statistical analysis
Patient characteristics are given as mean?s.d.or as median and range as https://www.doczj.com/doc/6c12235778.html,parisons between groups were performed using nonparametric tests, including the Mann–Whitney test(two groups)or the Kruskal–Wallis test(three groups).Comparisons between groups for qualitative data were performed using Chi-squared test or Fisher’s exact test when necessary.
Table1|Characteristics of the 329HBeAg-negative patients at the time of?brosis evalua-tion according to their status: inactive carriers and chronic active hepatitis(CHB)patients
HBeAg-negative
T otal
(n=329)
Inactive
carriers
(n=201)
HBeAg-negative
CHB patients
(n=128)P Gender(male)62%54%76%<0.0001 Age(years)39?1436?1244?16<0.0001 BMI(kg?m2)24.0?3.923.7?3.824.4?4.1N.S. ALT(IU?L)(n<50)46?7027?1175?106<0.0001 AST(IU?L)(n<50)37?4127?855?61<0.0001 Platelets(109?L)227?72237?67213?790.004 HBV DNA(IU?mL) 2.7?17.1·106 1.5?2.7·1037.4?27.9·1060.0002 BMI,body mass index;ALT,alanine aminotransferase;AST,aspartate aminotransferase; HBV,hepatitis B virus.
Table2|Diagnostic performances of transient elastography(TE),Fibrotest(FT)and APRI in the60patients with a liver biopsy
Method AUROC
(95%CI)Endpoint Cut-offs
Se
(%)
Sp
(%)
PPV
(%)
NPV
(%)+LR)LR
Correctly
classi?ed(%)
TE0.76(0.63–0.90)F?2>7.1kPa*68638342 1.840.5167
FT0.71(0.58–0.85)>0.4861819043 3.210.4867
APRI0.66(0.50–0.82)<0.562643864 1.720.59
?1.51410010030In?nite0.8627
TE0.89**(0.80–0.98)F4>9.6kPa*87805995 4.350.1682
>11.0kPa73876591 5.310.3183
FT0.74(0.58–0.90)>0.7447916784 5.200.5880
APRI0.79(0.67–0.91)<1.047804482 2.350.66
?2.013965076 3.250.9063
*Optimised cut-offs in our population.
**P<0.03vs.FT.
N o n-i n v a s i v e?b r o s i s m a r k e r s i n H B V i n a c t i v e c a r r i e r s
Aliment Pharmacol Ther2011;33:455–465457a2010Blackwell Publishing Ltd
Intra-group comparisons were made using Wilcoxon’s test for paired data.Tests were two-tailed and P-values <0.05were considered signi?cant.
Receiver operating characteristics(ROC)curves were constructed.Sensitivity(Se),speci?city(Sp),positive and negative predictive values(PPV and NPV),positive like-lihood ratio(+LR)and negative likelihood ratio()LR) were calculated using cut-offs previously described for signi?cant?brosis and cirrhosis for TE,FT and APRI. Also for TE,cut-offs were established in our population according to ROC curve in order to maximise Se and Sp. Areas under ROC curve(AUROC)were calculated using the trapezoidal https://www.doczj.com/doc/6c12235778.html,parisons of AUROCs were done using the method described by Hanley and McNeil for correlated data.30Initially,we compared all AUROCs, and in case of rejection of the null hypothesis(all AUROCs are equal),differences were searched for by two-by-two comparisons,using Bonferroni adjustment for multiple pairwise comparisons.Analyses were per-formed using SPSS software(Statistical Systems,Kayville, UT,USA)and STATA V8.0(Stata Statistical Software, release8.0;StataCorp,College Station,TX,USA). RESULTS
Patients
The baseline characteristics of the329patients are shown in Table1.There were205men(62%),and their mean age was39?14years.Among these patients,60under-went a liver biopsy.The mean liver biopsy length was 22.6?8.0mm.As expected,IC were signi?cantly youn-ger(36?12vs.44?16years respectively,P<0.0001), were less often men(54%vs.76%respectively, P<0.0001)and had lower HBV DNA(1.5?2.7·103 vs.7.4?27.9·106IU?mL respectively,P=0.0002) than CHB patients.
Cross-sectional study
Comparative diagnostic performance of TE and biomar-kers for?brosis staging.In the60patients who under-went a liver biopsy,activity grade and?brosis score were as follows:A0–A1(n=25);A2(n=22);A3(n=13) and F0–F1(n=16);F2(n=16);F3(n=13);F4 (n=15).Diagnostic performances of TE and biomarkers are shown in Table2.
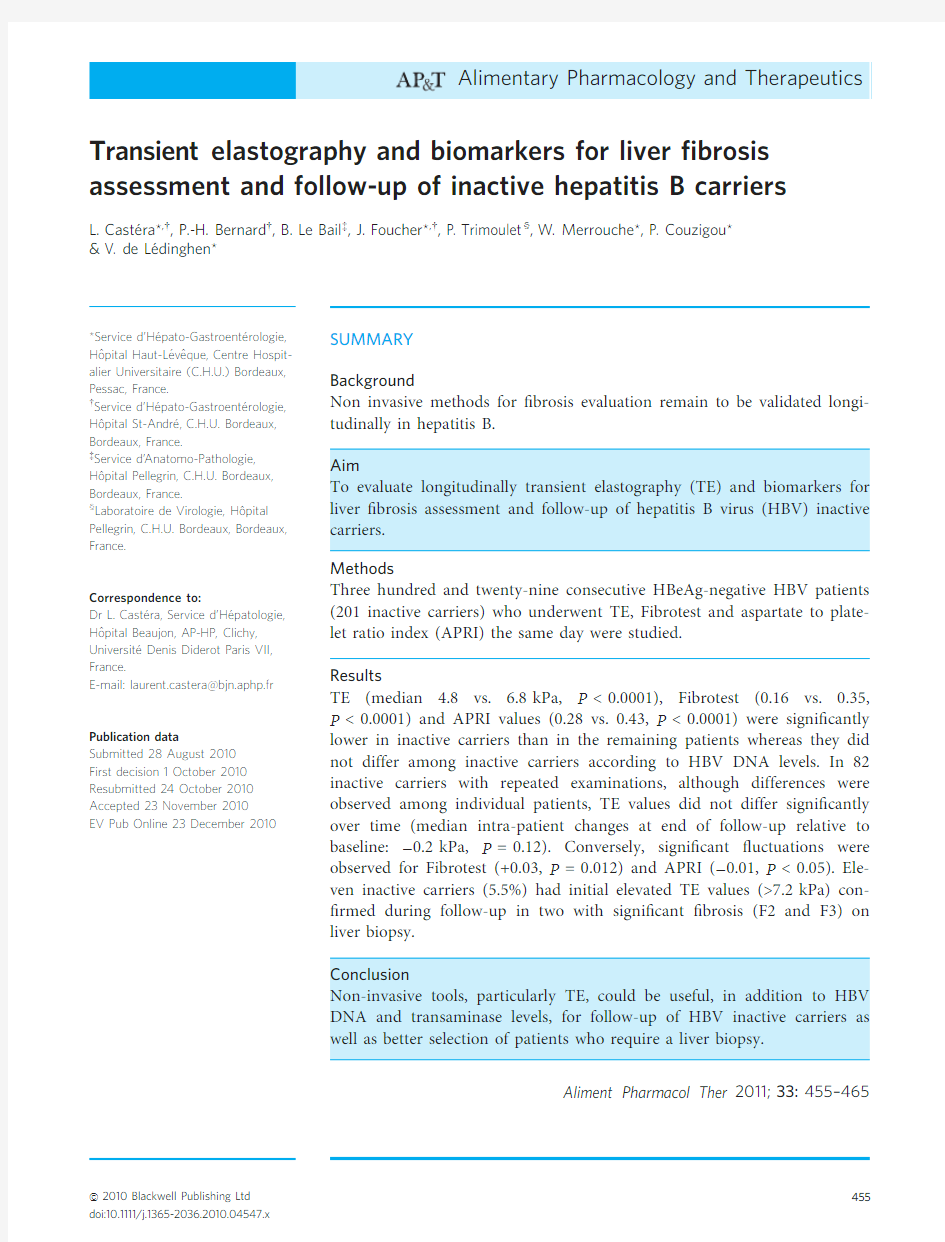
TE,FT and APRI had similar performance for F?2 [AUROC(95%CI):0.76(0.63–0.90),0.71(0.58–0.85) and0.66(0.50–0.82)respectively,P=N.S.].Conversely, for F4TE had better performance than FT[0.89(0.80–0.98)vs.0.74(0.58–0.90)respectively,P=0.03]but not different from APRI[0.89(0.80–0.98)vs.0.79(0.67–0.91)respectively,P=N.S.].The TE cut-offs optimised in our population were:7.1kPa for signi?cant?brosis (F?2)and9.6kPa for cirrhosis(F4)respectively. Comparison of TE and biomarkers between IC and HBeAg-negative disease.IC had signi?cantly lower liver stiffness values[median:4.8(4.1–5.8)vs.6.8(4.9–9.5)
10
8
12
14
16
(a)
(b)
(c)
P < 0.0001
P < 0.0001
P < 0.0001
L
i
v
e
r
s
t
i
f
f
n
e
s
s
v
a
l
u
e
s
(
k
P
a
)
2
4
6
Inactive carriers
(n = 201)
CHB patients
(n = 128)
Inactive carriers
(n = 201)
CHB patients
(n = 128)
Inactive carriers
(n = 201)
CHB patients
(n = 128)
0.8
0.7
0.6
F
i
b
r
o
t
e
s
t
v
a
l
u
e
s
0.2
0.1
0.3
0.4
0.5
1.4
0.6
0.4
0.8
1
1.2
0.2
A
P
R
I
v
a
l
u
e
s
Figure1|Box plots of liver stiffness(a),Fibrotest(b), and APRI(c)values in the201IC patients and the128 CHB patients.The top and bottom of the boxes are the ?rst and third quartiles respectively.The length of the box thus represents the IQR within which50%of the values were located.The line through the middle of
each box represents the median.The error bars show
the minimum and maximum values(range).
L.C a s t e′r a e t a l.
458Aliment Pharmacol Ther2011;33:455–465
a2010Blackwell Publishing Ltd
1M ?2521.6
33
75367.40.120.244607.36.57.80.090.160.20
0.17
0.230.23
35
7325
F 2
2F ?2519.7
24
<127.80.170.131824.15.8–0.220.14–
0.19
0.17
–
32
<12
N o
3M ?4927.1
35
<127.80.200.241796.8––0.18–
–
0.26
–
–
35
<12
N o
4M ?3120.5
18
3157.90.130.252535.9––0.22
–
–
0.32
–
–
23
<12
N o
5M ?5223.4
47
16008.00.430.082365.44.8–0.33
0.28–
0.10
0.09–
34
973
N o
6M ?1821.8
24
6628.20.110.413959.89.512.70.12
0.080.06
0.28
0.350.36
21
372
F 3
7M ?5924.9
29
<128.60.340.602476.3––
0.30
–
–
0.51
–
–
20
<12
N o
8M ?2224.6
25
17828.80.160.541005.9–
–
0.15
–
–
0.54
––
29
1239
N o
9M ?4523.4
38
7749.40.140.311866.16.7
6.6
0.10
0.270.20
0.35
0.440.38
38
118
N o
10M ?2319.6
21
93809.50.060.214166.96.8
–
0.13
0.12
–
0.17
0.20–
9
9216
N o
11M ?2626.440
56611.60.410.363295.85.3
4.9
0.30
0.420.58
0.43
0.350.46
42
715
N o
N o n -i n v a s i v e ?b r o s i s m a r k e r s i n H B V i n a c t i v e c a r r i e r s
Aliment Pharmacol Ther 2011;33:455–465
459
a2010Blackwell Publishing Ltd
kPa respectively;P<0.0001],FT values[median:0.16 (0.10–0.25)vs.0.35(0.19–0.60)respectively;P<0.0001] and APRI values[median:0.28(0.22–0.35)vs.0.43 (0.29–0.72)respectively;P<0.0001]than CHB patients (Figure1).
Interestingly,11IC(5.5%)had elevated liver stiffness values(?7.2kPa)suggestive of signi?cant?brosis (Table3).All were offered follow-up and their charac-teristics are detailed below in the longitudinal study chapter.
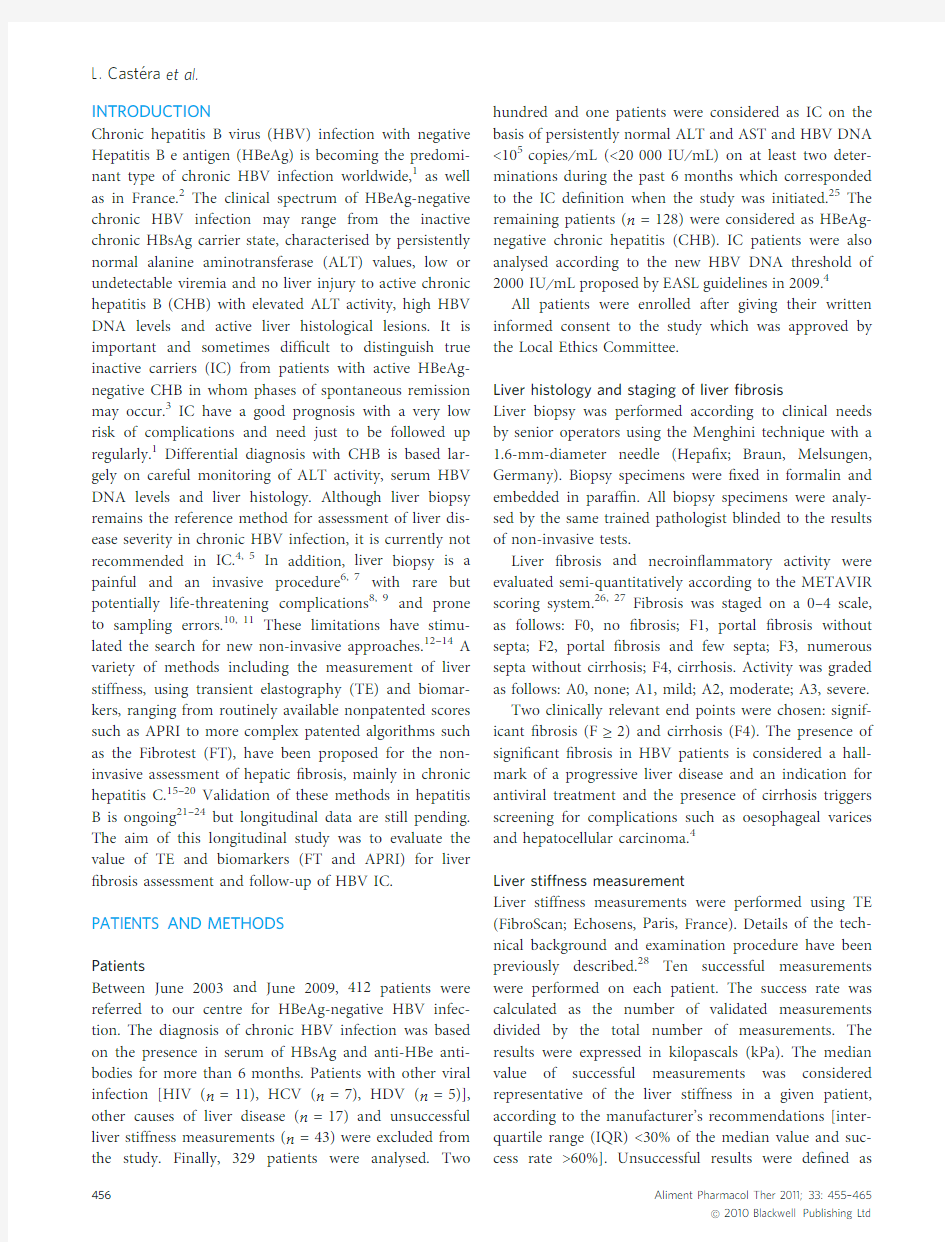
Comparison of TE and biomarkers according to HBV DNA levels in IC.The distribution of serum HBV DNA levels among IC was as follows:undetectable(<12IU?mL),33 (16%);>12IU/mL and<2000IU?mL,139(65%)and >2000IU/mL and<20000IU?mL,39(19%).Patients with HBV DNA levels<2000IU?mL(81%)correspond to the recently proposed EASL de?nition for IC4whereas patients with HBV DNA levels<20000IU?mL corre-spond to the classical de?nition.25IC did not differ according to serum HBV DNA levels for baseline charac-teristics(age,gender,BMI,ALT and AST)as well as for liver stiffness values,FT and APRI values(Figure2). Longitudinal study
Among the201IC,82underwent repeated TE and bio-markers determinations:two determinations(n=82, median interval of11.5months;range:3.3–26.8);three determinations(n=48,median23.1months;range: 10.1–34.7)and four determinations(n=27,median 34.4months;range:21.6–49.1).When pooling the differ-ent time points for the82patients,taking into account the last available time point(end of follow-up),the med-ian interval was:21.7months(range:3.3–49.1).These82 patients did not differ from the other IC for baseline characteristics(age,gender,BMI,ALT,AST,platelet count),FT and APRI except for liver stiffness values (median5.0vs.4.6kPa respectively,P=0.005).Indeed, as mentioned before,eleven of these patients had liver stiffness values>7.2kPa at?rst examination,suggestive of the presence of signi?cant?brosis.Their characteris-tics are detailed in Table3.These patients did not differ from the other190IC for most baseline characteristics
(age,gender,BMI,ALT,AST and platelet count),FT and APRI,and TE success rate,except for the IQR?me-dian value ratio(mean0.21?0.08vs.0.16?0.07 respectively,P<0.03).During follow-up,liver stiffness values returned to values below7.2kPa in all patients except two.These two patients(number1and6)under-went liver biopsy.Patient number1had moderate?bro-sis(F2)whereas patient number6had severe?brosis (F3).Both were offered antiviral treatment.
Table4shows the median intra-patient changes in liver stiffness,FT,APRI,AST,ALT and HBV DNA val-ues at different time points relative to baseline in the82 IC patients who underwent at least two determinations of non-invasive methods over time.Globally,the liver 4
3
5
6
7
HBV DNA
<12 IU/mL
(n = 33)
HBV DNA
12 < <2000 IU/mL
(n = 129)
HBV DNA
2000 < <20 000 IU/mL
(n = 39)
HBV DNA
<12 IU/mL
(n = 33)
HBV DNA
12 < <2000 IU/mL
(n = 129)
HBV DNA
2000 < <20 000 IU/mL
(n = 39)
HBV DNA
<12 IU/mL
(n = 33)
HBV DNA
12 < <2000 IU/mL
(n = 129)
HBV DNA
2000 < <20 000 IU/mL
(n = 39) L
i
v
e
r
s
t
i
f
f
n
e
s
s
v
a
l
u
e
s
(
k
P
a
)
1
2
0.4
0.5
P = NS
P = NS
P = NS
F
i
b
r
o
t
e
s
t
v
a
l
u
e
s
0.1
0.2
0.3
A
P
R
I
v
a
l
u
e
s
0.2
0.3
0.4
0.5
0.1
(a)
(b)
(c)
Figure2|Box plots of liver stiffness(a),Fibrotest(b), and APRI(c)values in the201IC patients according to HBV DNA levels.The top and bottom of the boxes are the?rst and third quartiles respectively.The length of the box thus represents the IQR within which50%of
the values were located.The line through the middle of each box represents the median.The error bars show
the minimum and maximum values(range).
L.C a s t e′r a e t a l.
460Aliment Pharmacol Ther2011;33:455–465
a2010Blackwell Publishing Ltd
stiffness changes observed in82patients at the end of follow-up(last determination available)relative to base-line were not signi?cant,although there was a trend towards a decrease in liver stiffness over time(median intra-patient changes at end of follow-up:)0.2()1.2to +0.7)kPa,P=0.12).As shown in Figure3a,there were differences among individual patients,however,the med-ian intra-patient liver stiffness changes relative to base-line were not signi?cant:+0.1()0.9to+0.5)kPa (P=0.41)at second determination and)0.1()0.9to +0.5)kPa(P=0.33)at third determination(Table4). Similarly,no signi?cant change was observed for AST, ALT and HBV DNA levels at the end of follow-up rela-tive to baseline(Table4).
Conversely,a signi?cant increase in FT values was observed over time:median of intra-patient changes in FT values at the end of follow-up relative to baseline [+0.03()0.04to+0.09),P=0.012;Table4).Patients had signi?cantly higher values at the end of follow-up than at baseline[median0.19(0.12–0.32)vs.(0.16(0.10–0.24), P=0.012].Five patients(6%)had at baseline FT values suggestive of signi?cant?brosis(>0.48)but none of cir-rhosis(>0.74).During follow-up,FT values remained comprised between0.48and0.74in these?ve patients. As shown in Figure3b,there were important differences among individual patients and FT values?uctuated over time:as a result,median intra-patient FT changes relative to baseline were signi?cant:+0.03()0.03to+0.07) (P=0.03)at second determination and+0.05()0.03to +0.11)(P=0.001)at third determination(Table4).
As for APRI,there were also differences among indi-vidual patients and APRI values?uctuated over time (Figure3c).A signi?cant decrease was observed over time:median of intra-patient changes at the end of fol-low-up relative to baseline[)0.01()0.07–+0.03), P<0.05;Table4].
N o n-i n v a s i v e?b r o s i s m a r k e r s i n H B V i n a c t i v e c a r r i e r s
Aliment Pharmacol Ther2011;33:455–465461a2010Blackwell Publishing Ltd
DISCUSSION
The results of the present study,based on a large series of consecutive HBeAg-negative HBV patients,suggest that non-invasive tools for liver ?brosis assessment,par-ticularly TE,may be useful for liver ?brosis assessment and follow-up of IC.
Among the different available non-invasive methods,we chose to evaluate two different and complementary approaches:(i)a physical approach based on the mea-surement of liver stiffness using TE;(ii)a biological approach based on serum biomarkers including a pat-ented algorithm (FT)and a free nonpatented index (APRI).31These three non-invasive methods are by far the most widely used and validated.32–34
In the cross-sectional part of the study,we ?rst vali-dated the performances of TE,FT and APRI against liver biopsy for diagnosing signi?cant ?brosis and cirrhosis in our population.TE had better diagnostic accuracy for cirrhosis (AUROC:0.89)than for signi?cant ?brosis (0.76),as previously reported in hepatitis C 32and hepati-tis B.21,35,36Interestingly,the TE cut-off we found for signi?cant ?brosis (7.1kPa)is similar to the one we pro-posed initially in chronic hepatitis C 16and close to those recently proposed in CHB by Marcellin et al.(7.2kPa),21as well as other groups.35,36As for cirrhosis,our cut-off (9.6kPa)is lower than in hepatitis C (12.5kPa)16but close to those proposed in hepatitis B.21,23,35,36The higher prevalence of macronodular cirrhosis in CHB than in hepatitis C as well as differences in the preva-lence of cirrhosis in the different studied populations may account for these differences.As for FT and APRI,their performances were in keeping with those previously reported in hepatitis B.24,37–39Interestingly,although performance did not differ among the three methods for the diagnostic accuracy of signi?cant ?brosis,TE had better diagnostic accuracy than FT for cirrhosis,a ?nding consistent with our experience in patients with chronic hepatitis C.40In that respect,some authors have pro-posed algorithms combining TE with serum biomarkers to increase diagnostic accuracy for advanced ?brosis in patients with CHB.41
Although liver biopsy remains important for deter-mining active disease,42it is not feasible or necessary to biopsy all HBeAg-negative patients with near normal ALT and relatively low HBV DNA levels.43Non-invasive tests could provide an additional adjunct for separating patients with inactive and minimal ?brosis from those for whom a liver biopsy could be mandated.Liver stiff-ness values in our series of 201IC were low and similar to those reported in two recent series of healthy
individ-2t i m e p o i n t s (n =82)
E O
F )0.2()1.2t o +0.7)0.12+0.03()0.04t o +0.09)
0.012)0.01()0.07t o +0.03)<0.050.0()4.0t o +4.0)
0.990.0()6.0t o +5.0)
0.640.0()461t o +290)
0.98
3t i m e p o i n t s (n =48)S e c o n d +0.1()0.9t o +0.5)0.41+0.03()0.03t o +0.07)
0.03
)0.02()0.06t o +0.02)
0.020.0()5.5t o +3.0)0.28)2.0()9.0t o +2.0)
0.10117.0()509t o +3230)
0.14T h i r d
)0.1()0.9t o +0.5)0.33+0.05()0.03t o +0.11)
0.001
)0.01
()0.08t o +0.04)
0.410.5()3.8t o +5.0)
0.99
0.0()5.0t o +4.0)
0.800.0()770t o +848)
0.82
4t i m e p o i n t s (n =27)S e c o n d +0.2()0.8t o +0.9)
0.980.00()0.04t o +0.06)
0.55
0.00()0.06t o +0.04)
0.452.0()4.0t o +4.0)
0.600.0()3.0t o +7.0)
0.90117.0()422t o +4076)
0.18T h i r d
)0.1()1.0t o +0.5)0.50+0.07(0.00t o +0.13)
0.002+0.02()0.06t o +0.06)0.712.0()2.0t o +6.0)
0.222.0()3.0t o +7.0)0.09)70.0()1786t o +91)0.21
E O
F ,e n d o f f o l l o w -u p ;P -v a l u e s a r e f o r i n t r a -p a t i e n t s c h a n g e s r e l a t i v e t o b a s e l i n e .
L .C a s t e
′r a e t a l .462
Aliment Pharmacol Ther 2011;33:455–465
a2010Blackwell Publishing Ltd
uals with44and without45liver biopsy as well as in patients with chronic hepatitis C and persistently normal ALT.46In addition,liver stiffness values were signi?-cantly lower than in CHB patients and consistent with those previously reported in IC.36,47However,no serum ?brosis biomarker was evaluated in these two stud-ies.36,47Interestingly,both APRI and FT values were low in our IC as previously reported38and signi?cantly lower than in CHB patients.
As a new de?nition of IC has been recently proposed,4 we also examined the results of non-invasive tests according to HBV DNA levels.Approximately80%of our IC patients had HBV DNA levels<2000IU?mL,cor-responding to this new de?nition,a?nding in keeping with those of a recent series of85IC where23%of patients had HBV DNA<2000IU?mL.48Interestingly, TE,FT and APRI values did not differ according to HBV DNA levels in IC whereas they were signi?cantly higher in patients with HBV DNA>20000IU?mL.Such ?ndings are consistent with those of Papatheodoridis et al.43showing that in patients with persistently normal ALT and HBV DNA<20000IU?L,the2000IU?L cut-off does not allow discriminating between patients with and without signi?cant?brosis on liver biopsy.
In the second longitudinal part of the study,we thor-oughly evaluated the evolution of TE,FT and APRI over time by measuring median intra-patients changes at dif-ferent time points relative to baseline in82IC with repeated examinations(two to four examinations).Inter-estingly,although some differences were observed among individual patients(Figure3),liver stiffness values were stable over time,as were AST,ALT and HBV DNA lev-els.Conversely,signi?cant?uctuations were observed with FT and APRI.
We have no clear explanation for this latter?nding. In the only study were FT was assessed longitudinally in 160IC,38reproducibility was deemed excellent but no data were provided regarding the median or mean FT values over time.It is possible that some components of FT such as bilirubin levels or alpha-2-macroglobulin may ?uctuate over time.49Similarly with APRI,AST and platelet may?uctuate over time.Concerning TE,it has been shown to be highly reproducible50and?uctuations of liver stiffness over time are mainly related to acute in?ammation or ALT?ares,22,36,51which are usually not observed in IC.
Interestingly,eleven out of201IC(5.5%)had baseline elevated liver stiffness values(>7.2kPa),suggestive of the presence of signi?cant?brosis.During follow-up,liver stiffness values returned to values below7.2kPa in all patients but two.It should be noted that when compared to the other IC,these11patients had signi?cantly higher TE IQR?median value ratio.The importance of this ratio for accuracy of TE results has been recently emphas-ised.52This?nding suggests that when liver stiffness val-ues are elevated(>7.2kPa)in patients with a pro?le of IC,TE should be repeated before taking a liver biopsy, to make sure that IQR?median value ratio is satisfactory. Indeed,in the two patients with baseline elevated liver stiffness values con?rmed on a second examination,liver biopsy revealed the presence of signi?cant?brosis in both cases(F2and F3),suggesting that TE in this con-text is a sensitive tool for detection of signi?cant?brosis. In conclusion,our results suggest that non-invasive tools for liver?brosis assessment,particularly TE,could be useful,in addition to HBV DNA and transaminase levels,for follow-up of HBV IC as well as better selection of patients who require a liver biopsy. ACKNOWLEDGEMENTS
Declaration of personal interests:We are grateful to Dr Fran?oise Roudot-Thoraval for her helpful statistical comments on the article.Declaration of funding interests: None.
REFERENCES
1.Dienstag JL.Hepatitis B virus infection.
N Engl J Med2008;359:1486–500. 2.Zarski JP,Marcellin P,Leroy V,et al.
Characteristics of patients with chronic hepatitis B in France:predominant fre-quency of HBe antigen negative cases.J Hepatol2006;45:355–60.
3.Brunetto MR,Oliveri F,Coco B,et al.
Outcome of anti-HBe positive chronic hepatitis B in alpha-interferon treated
and untreated patients:a long term
cohort study.J Hepatol2002;36:263–
70.
4.European Association for the Study of
the Liver.EASL Clinical Practice Guide-
lines:management of chronic hepatitis
B.J Hepatol2009;50:227–42.
5.Lok AS,McMahon BJ.Chronic hepatitis
B:update2009.Hepatology2009;50:
661–2.
6.Castera L,Negre I,Samii K,et al.
Pain experienced during percutaneous
liver biopsy.Hepatology1999;30:
1529–30.
7.Castera L,Negre I,Samii K,et al.
Patient-administered nitrous oxide?oxy-
gen inhalation provides safe and effective
analgesia for percutaneous liver biopsy:a
randomized placebo-controlled trial.Am
J Gastroenterol2001;96:1553–7.
N o n-i n v a s i v e?b r o s i s m a r k e r s i n H B V i n a c t i v e c a r r i e r s
Aliment Pharmacol Ther2011;33:455–465463a2010Blackwell Publishing Ltd
8.Cadranel JF,Rufat P,Degos F.Practices
of liver biopsy in France:results of a
prospective nationwide survey.For the
Group of Epidemiology of the French
Association for the Study of the Liver
(AFEF).Hepatology2000;32:477–81. 9.Piccinino F,Sagnelli E,Pasquale G,et al.
Complications following percutaneous
liver biopsy.A multicentre retrospective
study on68,276biopsies.J Hepatol1986;
2:165–73.
10.Bedossa P,Darge`re D,Paradis V.Sam-
pling variability of liver?brosis in
chronic hepatitis C.Hepatology2003;38: 1449–57.
11.Regev A,Berho M,Jeffers LJ,et al.Sam-
pling error and intraobserver variation
in liver biopsy in patients with chronic
HCV infection.Am J Gastroenterol2002;
97:2614–8.
12.Castera L.Transient elastography and
other noninvasive tests to assess hepatic
?brosis in patients with viral hepatitis.J
Viral Hepat2009;16:300–14.
13.Pinzani M,Vizzutti F,Arena U,et al.
Technology insight:noninvasive assess-
ment of liver?brosis by biochemical
scores and elastography.Nat Clin Pract
Gastroenterol Hepatol2008;5:95–106.
14.Castera L,Pinzani M.Non-invasive
assessment of liver?brosis:are we
ready?Lancet2010;375:1419–20.
15.Sandrin L,Fourquet B,Hasquenoph JM,
et al.Transient elastography:a new non-invasive method for assessment of hepa-
tic?brosis.Ultrasound Med Biol2003;
29:1705–13.
16.Castera L,Vergniol J,Foucher J,et al.
Prospective comparison of transient elas-tography,Fibrotest,APRI,and liver
biopsy for the assessment of?brosis in
chronic hepatitis C.Gastroenterology
2005;128:343–50.
17.Ziol M,Handra-Luca A,Kettaneh A,
et al.Noninvasive assessment of liver
?brosis by measurement of stiffness in
patients with chronic hepatitis C.Hepa-
tology2005;41:48–54.
18.Wai CT,Greenson JK,Fontana RJ,et al.
A simple noninvasive index can predict
both signi?cant?brosis and cirrhosis in
patients with chronic hepatitis C.Hepa-
tology2003;38:518–26.
19.Imbert-Bismut F,Ratziu V,Pieroni L,
et al.Biochemical markers of liver?bro-sis in patients with hepatitis C virus
infection:a prospective https://www.doczj.com/doc/6c12235778.html,ncet
2001;357:1069–75.
20.Castera L,Denis J,Babany G,et al.
Evolving practices of non-invasive mark-ers of liver?brosis in patients with
chronic hepatitis C in France:time for
new guidelines?J Hepatol2007;46:528–9.
21.Marcellin P,Ziol M,Bedossa P,et al.
Non-invasive assessment of liver?brosis
by stiffness measurement in patients
with chronic hepatitis B.Liver Int2009;
29:242–7.
22.Coco B,Oliveri F,Maina AM,et al.
Transient elastography:a new surrogate
marker of liver?brosis in?uenced by
major changes of transaminases.J Viral
Hepat2007;14:360–9.
23.Chan HL,Wong GL,Choi PC,et al.
Alanine aminotransferase-based algo-
rithms of liver stiffness measurement by
transient elastography(Fibroscan)for
liver?brosis in chronic hepatitis B.J
Viral Hepat2009;16:36–44.
24.Sebastiani G,Vario A,Guido M,et al.
Sequential algorithms combining non-
invasive markers and biopsy for the
assessment of liver?brosis in chronic
hepatitis B.World J Gastroenterol2007;
13:525–31.
25.Lok AS,Heathcote EJ,Hoofnagle JH.
Management of hepatitis B:2000–sum-
mary of a workshop.Gastroenterology
2001;120:1828–53.
26.The French METAVIR Cooperative
Study Group.Intraobserver and interob-
server variations in liver biopsy interpre-
tation in patients with chronic hepatitis
C.Hepatology1994;20:15–20.
27.Bedossa P,Poynard T.An algorithm for
the grading of activity in chronic hepati-
tis C.The METAVIR cooperative study
group.Hepatology1996;24:289–93.
28.Castera L,Forns X,Alberti A.Non-inva-
sive evaluation of liver?brosis using
transient elastography.J Hepatol2008;
48:835–47.
29.Castera L,Foucher J,Bernard PH,et al.
Pitfalls of liver stiffness measurement:a
5-year prospective study of13,369exam-
inations.Hepatology2010;51:828–35.
30.Hanley JA,McNeil BJ.A method of
comparing the areas under receiver
operating characteristic curves derived
from the same cases.Radiology1983;
148:839–43.
31.Castera L,Pinzani M.Biopsy and non-
invasive methods for the diagnosis of
liver?brosis:does it take two to tango?
Gut2010;59:861–6.
32.Friedrich-Rust M,Ong MF,Martens S,
et al.Performance of transient elastogra-
phy for the staging of liver?brosis:a
meta-analysis.Gastroenterology2008;
134:960–74.
33.Poynard T,Morra R,Halfon P,et al.
Meta-analyses of Fibrotest diagnostic
value in chronic liver disease.BMC Gas-
troenterol2007;7:40.
34.Shaheen AA,Myers RP.Diagnostic
accuracy of the aspartate aminotransfer-
ase-to-platelet ratio index for the predic-
tion of hepatitis C-related?brosis:a
systematic review.Hepatology2007;46:
912–21.
35.Wang JH,Changchien CS,Hung CH,
et al.FibroScan and ultrasonography in
the prediction of hepatic?brosis in
patients with chronic viral hepatitis.
J Gastroenterol2009;44:439–46.
36.Oliveri F,Coco B,Ciccorossi P,et al.
Liver stiffness in the hepatitis B virus
carrier:a non-invasive marker of liver
disease in?uenced by the pattern of
transaminases.World J Gastroenterol
2008;14:6154–62.
37.Myers RP,Tainturier MH,Ratziu V,
et al.Prediction of liver histological
lesions with biochemical markers in
patients with chronic hepatitis B.J Hepa-
tol2003;39:222–30.
38.Ngo Y,Benhamou Y,Thibault V,et al.
An accurate de?nition of the status of
inactive hepatitis B virus carrier by a
combination of biomarkers(FibroTest-
ActiTest)and viral load.PLoS ONE
2008;3:e2573.
39.Chang PE,Lui HF,Chau YP,et al.Pro-
spective evaluation of transient elastogra-
phy for the diagnosis of hepatic?brosis
in Asians:comparison with liver biopsy
and aspartate transaminase platelet ratio
index.Aliment Pharmacol Ther2008;28:
51–61.
40.Castera L,Le Bail B,Roudot-Thoraval F,
et al.Early detection in routine clinical
practice of cirrhosis and oesophageal
varices in chronic hepatitis C:compari-
son of transient elastography(FibroScan)
with standard laboratory tests and non-
invasive scores.J Hepatol2009;50:59–
68.
41.Wong GL,Wong VW,Choi PC,et al.
Development of a non-invasive algo-
rithm with transient elastography(Fibro-
scan)and serum test formula for
advanced liver?brosis in chronic hepati-
tis B.Aliment Pharmacol Ther2010;31:
1095–103.
42.Kumar M,Sarin SK,Hissar S,et al.
Virologic and histologic features of
chronic hepatitis B virus-infected asymp-
tomatic patients with persistently normal
ALT.Gastroenterology2008;134:
1376–84.
43.Papatheodoridis GV,Manesis EK,Man-
olakopoulos S,et al.Is there a meaning-
ful serum hepatitis B virus DNA cutoff
level for therapeutic decisions in hepati-
tis B e antigen-negative chronic hepatitis
B virus infection?Hepatology2008;48:
1451–9.
44.Fung J,Lai CL,Chan SC,et al.Correla-
tion of liver stiffness and histological fea-
tures in healthy persons and in patients
with occult hepatitis B,chronic active
hepatitis B,or hepatitis B cirrhosis.Am J
Gastroenterol2010;105:1116–22.
45.Roulot D,Czernichow S,Le Clesiau H,
et al.Liver stiffness values in apparently
healthy subjects:in?uence of gender and
metabolic syndrome.J Hepatol2008;48:
606–13.
46.Castera L,Foucher J,Bertet J,et al.Fi-
broScan and FibroTest to assess liver
L.C a s t e′r a e t a l.
464Aliment Pharmacol Ther2011;33:455–465
a2010Blackwell Publishing Ltd
?brosis in HCV with normal amin-
otransferases.Hepatology2006;43:373–4.
47.Maimone S,Calvaruso V,Pleguezuelo
M,et al.An evaluation of transient elas-tography in the discrimination of
HBeAg-negative disease from inactive
hepatitis B carriers.J Viral Hepat2009;
16:769–74.
48.Papatheodoridis GV,Chrysanthos N,
Hadziyannis E,et al.Longitudinal
changes in serum HBV DNA levels and
predictors of progression during the nat-
ural course of HBeAg-negative chronic
hepatitis B virus infection.J Viral Hepat
2008;15:434–41.
49.Poynard T,Munteanu M,Imbert-Bismut
F,et al.Prospective analysis of discor-
dant results between biochemical mark-
ers and biopsy in patients with chronic
hepatitis C.Clin Chem2004;10:10.
50.Fraquelli M,Rigamonti C,Casazza G,
et al.Reproducibility of transient elas-
tography in the evaluation of liver?bro-
sis in patients with chronic liver disease.
Gut2007;56:968–73.
51.Arena U,Vizzutti F,Corti G,et al.
Acute viral hepatitis increases liver stiff-
ness values measured by transient elas-
tography.Hepatology2008;47:380–4.
52.Lucidarme D,Foucher J,Le Bail B,et al.
Factors of accuracy of transient elastog-
raphy(?broscan)for the diagnosis of
liver?brosis in chronic hepatitis C.Hep-
atology2009;49:1083–9.
N o n-i n v a s i v e?b r o s i s m a r k e r s i n H B V i n a c t i v e c a r r i e r s
Aliment Pharmacol Ther2011;33:455–465465a2010Blackwell Publishing Ltd
第三章烃源岩可溶有机质生物标志物组成特征 第一节饱和烃生物标志物组合类型及地球化学特征 饱和烃生物标志物组成比较复杂,在原油和烃源岩中分布比较广的主要有正构烷烃、类异戊(间)二烯烷烃、环烷烃(甾、萜类化合物)等。这些化合物的相对组成及分布特征取决于烃源岩有机组分的生源母质、沉积环境和成熟度等多种地质和地球化学因素。因此,烃源岩中饱和烃生物标志物组合特征可以反映烃源岩中有机质的原始母质、沉积环境及演化程度。不同层位或同一层位的泥岩,由于沉积环境的差别,地球化学特征也存在一定的差别,为了便于讨论不同层位或同一层位不同岩性组合的烃源岩的油源贡献,根据烃源岩的生物标志物组合特征,可将其划分为三大类型(MA、MB、MC)。 一、烃源岩生物标志物组合类型 1.MA类 MA类烃源岩正构烷烃碳数分布特征呈单峰态前峰型(或正态型,个别为双峰态前峰型),植烷(Ph)相对含量大于姥鲛烷(Pr)的相对含量,β-胡萝卜烷和伽马蜡烷相对含量中等~很高;ααα20RC27、C28、C29甾烷呈“V”型分布,部分样品中ααα20RC27甾烷含量接近于甚至大于ααα20RC29甾烷的含量。表明烃源岩形成于湖水盐度较高的还原环境,有机质生源以低等水生藻类为主,有高等陆源植物生源贡献。这类烃源岩中代表来源于藻类生物的规则甾烷与来源于原核生物细菌的藿烷系列化合物相比,具有一定的优势,这也反映了藻类生物生源的有机质占优势。 根据β-胡萝卜烷和伽马蜡烷的相对含量,MA类烃源岩可进一步划分为MA-I和MA-II 两亚类。MA-I烃源岩中β-胡萝卜烷含量较高,伽马蜡烷含量中等~很高,主要分布在阜二段中部、阜四段上部和泰州组,以黑色、灰黑色和深灰色泥岩为主。不同层段MA-I类烃源岩的主要差别在于,阜二段、泰州组烃源岩样品的C20、C21、C23三环萜烷含量较高,β-胡萝卜烷含量较高,而阜四段烃源岩样品的C20、C21、C23三环萜烷含量较低,β-胡萝卜烷含量相对较低。MA-II类烃源岩中β-胡萝卜烷和伽马蜡烷含量中等,主要分布在阜四段,阜二段也有分布。 2.MB类 MB类烃源岩正构烷烃碳数分布特征为单峰态后峰型或双峰态后峰型,低碳数正构烷烃中不可分辨化合物含量较高,鼓包比较明显。低碳数部分与低等水生生物母质有关,高碳数部分主要来源于高等植物蜡,C27、C28、C29ααα20R甾烷呈上升型或“V”型分布,且ααα20RC27甾烷<ααα20RC29甾烷,表明这类烃源岩中沉积有机质来源以陆源高等植物为主,这类烃源岩中来源于原核生物细菌的藿烷系列化合物与代表来源于藻类生物的规则甾烷相比,具有一
《感染相关生物标志物临床意义解读专家共识》要点 尽管近年来医学科技已有了“飞跃式”的发展,但直到今天医生们所面临的多数疾病,如肿瘤、代谢性疾病、自身免疫性疾病等都是无法彻底治愈的,即使最常见的支气管哮喘和慢阻肺也往往需要终生不间断治疗。感染性疾病与上述疾病截然不同,其中大多数只要诊断准确,治疗恰当,都可望在相对较短时间内彻底治愈。感染可发生在临床各科,人体任一部位,因此,与感染有关的诊断技术和治疗手段是所有临床医生均应掌握的基本功之一。 感染性疾病的诊断如只靠症状、体征及影像学表现有时会遇到困难,如某些老年性肺炎,可以无发热,或仅有轻微发热,也可缺少呼吸道症状,可能只表现为意识的某些改变,在这种情况下如没有实验室相关检测指标的帮助就可能发生误诊。某些非感染性疾病也可有一些酷似感染的临床表现,如血液病、自身免疫性疾病、移植物抗宿主病(GVHD)及隐源性机化性肺炎(COP)等,此时感染相关生物标志物的检测对鉴别诊断的参考意义更大。除感染性疾病的诊断外,某些生物标志物对判定患者的预后与确定抗感染疗程也有较大帮助,甚至也能在一定程度上帮助区别引起感染的致病原(细菌、真菌、结核、病毒)。 基于以上原因,中国医药教育协会感染疾病专业委员会(IDSC)决定编写此共识,争取尽量系统、客观、全面地向临床医生介绍常用的和即将在临床推广的与感染相关的重要生物标志物,以供大家在临床实践中参考。
需要指出的是,没有任何一个生物标志物是绝对敏感又绝对特异的,不能单凭某个生物标志物的改变来诊断疾病,只有结合、参照患者的临床表现与其他实验室检查结果,才能做出正确的判断。 一、传统细菌感染生物标志物 1. 外周血白细胞总数及分类:白细胞升高合并中性粒细胞比例升高常提示急性细菌性感染,特别是革兰阳性球菌(如金黄色葡萄球菌、溶血性链球菌、肺炎链球菌等)感染。少数病毒感染,如流行性乙型脑炎和流行性出血热也可有上述表现。此外,血液与实体肿瘤、血管炎、成人Still病及肾上腺皮质激素的使用等多种非感染原因,也可引起白细胞及中性粒细胞升高。其生理性增高见于新生儿、月经期、妊娠、分娩及情绪变化等。 白细胞总数升高合并淋巴细胞比例升高常提示急性病毒感染,如传染性单核细胞增多症,若长期持续升高,需注意与血液系统疾病,如白血病等进行鉴别。 白细胞升高合并嗜酸粒细胞比例升高常提示寄生虫感染,也可见于结核、变态反应、肿瘤及药物等原因。 病毒、非典型病原体(如支原体、衣原体、立克次体等)及某些原虫(如疟原虫、黑热病原虫)感染可致白细胞减少,在细菌感染中白细胞减少常见于沙门菌感染、结核和布鲁菌病;白细胞正常或减少同时合并嗜酸粒细胞下降常提示沙门菌感染。应当注意的是,除上述情况外,某些细菌引起的严重感染(如脓毒症)时,白细胞总数也可显著减少,常提示病
2020心力衰竭生物标志物中国专家共识要点 生物标志物已被广泛用于心力衰竭的预测、早期诊断、预后评估和治疗指导等各个方面。其中,钠尿肽(NP)是心衰诊疗中应用最多的生物标志物,常用的是B型钠尿肽(BNP)和N末端前体BNP (NT-proBNP)。 钠尿肽反映心肌容量负荷及室壁压力变化情况。心肌细胞受到压力/牵拉刺激后,即心室容积扩张、压力负荷增加时,首先形成BNP前体;BNP前体形成后被水解为BNP和无活性的NT-proBNP。两者主要由心室肌产生并分泌入血,心室肌无存储BNP和NT-proBNP的功能。BNP的生理功能包括扩张血管、排水、排钠,抑制RAAS和SNS;目前认为NT-proBNP无生理活性。BNP由血清中的钠尿肽受体C和中性内肽酶降解,也可被肾脏等高血流量器官排泄;NT-proBNP在肌肉、肝脏、肾脏等高血流量组织器官中降解。BNP与NT-proBNP的应用价值相当,但NT-proBNP的半衰期为120 min,长于BNP的20 min;NT-proBNP含量受脑啡肽酶抑制剂等药物的影响更小,因此更适合心衰药物疗效的监测。 预测心衰的发生 BNP/NT-proBNP有助于预测心衰,特别是NT-proBNP。BNP/NT-proBNP单独使用或联合使用时可以预测心衰的发生。
推荐:①测量心肌负荷标志物(BNP)、心肌损伤标志物(cTn)、肾功能不全标志物能有效预测心衰的发生,联合测量能显著提高预测价值。(Ⅰ类推荐)②BNP/NT-proBNP单独应用或联合肌钙蛋白T (TnT)/肌钙蛋白I(TnI)或联合尿白蛋白肌酐比(UACR)对新发心衰有一定的预测作用。(Ⅰ类推荐) ③BNP/NT-proBNP,TnT/TnI联合炎症指标可溶性ST2(sST2),生长分化因子15(GDF-15)对新发心衰有一定的预测作用。(Ⅱa 类推荐) 辅助诊断心衰 生物标志物联合临床表现可以极大地提高心衰诊断的准确性。BNP/NT-proBNP是目前最有价值的心衰诊断生物标志物,可用于多种类型的心衰诊断,包括无症状性心衰、慢性失代偿性心衰和急性失代偿性心衰。 1. 急性失代偿性心衰 在急性心衰中,NP是最重要的生物标志物,敏感性和阴性预测值非常高。 表1 BNP/NT‐proBNP应用于排除和诊断急性心衰时的推荐界值
生物标志物 科技名词定义 中文名称:生物标志物 英文名称:biomarker 定义:用于监测和评价能够导致生物有机体的生物化学和生理学改变的化学污染物。 所属学科:海洋科技(一级学科);海洋科学(二级学科);环境海洋学(三级学科) 本内容由全国科学技术名词审定委员会审定公布 生物标志物:在亚个体和个体水平上既可以测定污染物暴露水平,也可以测定污染物效应的生理和生化指标。 对于疾病研究,生物标志物一般是指可供客观测定和评价的一个普通生理或病理或治疗过程中的某种特征性的生化指标,通过对它的测定可以获知机体当前所处的生物学过程中的进程。检查一种疾病特异性的生物标志物,对于疾病的鉴定、早期诊断及预防、治疗过程中的监控可能起到帮助作用。寻找和发现有价值的生物标志物已经成为目前研究的一个重要热点。 自1994年蛋白质组概念提出,定量蛋白质组学已经成为蛋白质组学研究的热点和中心。定量蛋白质组学便是检测正常与疾病状态下组织全部表达蛋白质在量上的差别。 定量蛋白质组学中的蛋白质定量技术也成为发现生物标志物的重要途径。 生物标志物是生物体受到严重损害之前,在不同生物学水平(分子、细胞、个体等)上因受环境污染物影响而异常化的信号指标。它可以对严重毒性伤害提供早期警报。 这种信号指标可以是细胞分子结构和功能的变化、可以是某一生化代谢过程的变化或生成异常的代谢产物或其含量,可以是某一生理活动或某一生理活性物质的异常表现,可以是个体表现出的异常现象,可以是种群或群落的异常变化,可以是生态系统的异常变化。 生物标志物分类 从功能上一般分为: 接触(暴露)生物标志物 (biomarker of exposure); 效应生物标志物
瞬时弹性成像技术检测肝硬度失败原因及对策 发表时间:2016-02-15T16:00:25.537Z 来源:《健康世界》2015年19期供稿作者:李洪兰梁静朱光竹 [导读] 四川省达州市中心医院探讨瞬时弹性成像技术(FibroScan)测量肝硬度失败原因及提高成功率的方法 四川省达州市中心医院四川达州 635000 摘要:目的探讨瞬时弹性成像技术(FibroScan)测量肝硬度失败原因及提高成功率的方法。方法用FibroScan 对5000 例慢性肝病患者进行肝脏硬度检测,每例进行10次有效测量,并对检测失败的患者进行身高、体重、肋间隙宽度测量、肝脏B 超或CT检查,以评价身体质量指数、性别、年龄、肋间隙、影像原因对检测成功的影响.结果 5000例检测者中的240例检测失败,失败率为4.8%。BMI≥28kg /m2 者失败率明显高于BMI < 28kg /m2 者(,女性失败率高于男性,老年人失败率较<60 岁的人高,肋间隙< 9mm 患者失败率高,差异均有统计学意义(P<0.01).肝脏影像学显示异常(肝脏血管瘤、结节、囊肿,肝脏缩小、腹腔积液、气体干扰)患者检测失败173例,失败率为3.5%。对240 例初次检测失败患者采取重新摆放体位、更换检测部位、调整探头方向等方法重新检测成功52例,使失败率降低至3.8%。结论 FibroScan 检测的失败多由于肥胖、肋间隙狭窄、肝脏影像学显示异常(肝脏血管瘤、结节、囊肿,肝脏缩小、腹腔积液、气体干扰等)引起,老年人与女性检测失败率较高。针对检测失败的原因,采取相应的对策,可降低检测失败率。 关键词:瞬时弹性成像技术;肝硬度检测;失败率 Abstract Objective To investigate the cause of the failure of the transient elastic imaging(FibroScan)and the method of improving the success rate.Methods 5000 cases were detected for liver stiffness with FibroScan, in each case were 10 times of the effective measurement,and in patients with failure detection for height,weight,rib clearance width measurement,liver B ultrasonic or CT examination and evaluation of body mass index,gender,age,intercostal space,image of the successful detection of influence.Results LSM failure occurred in 4.8% of all examinations(240 patients out of 5000).Body mass index (BMI)≥28kg /m2 failure rate was significantly higher than BMI <28kg /m2.The failure rate of female patients with liver stiffness was higher than that of male,the elderly failure rate was higher than that of younger people(< 60 years of age),the intercostal space < 9mm failure rate is higher than that of the intercostal space ≥9mm.,the difference had statistically significant(P<0.01).Liver imaging showed abnormal(liver hemangioma,nodules,cysts,liver,ascites,gas interference)in patients with 173 cases of failure detection,in which failure rate was 3.5%.In 52 cases,the failure rate was reduced to 240 by re examination of 3.8% cases,which was used to re position the position,change the detecting position and adjust the direction of the probe..Conclusion The failure of FibroScan measurement much due to obesity,narrow rib spaces,liver imaging showed abnormal(liver hemangioma,nodules,cysts,shrinking liver,ascites,gas interference,etc.)caused by,the elderly and women detection failure rate is higher.To detect the failure of the reasons,to take the corresponding measures,can reduce the detection failure rate. Key words Transient elastography;Liver stiffness measurement(LSM);Failure rate 基于瞬时弹性成像技术的FibroScan 能够通过检测肝脏硬度值来判断肝纤维化的程度[1],具有无创、无痛、重复性好的优点,在我国已广泛用于临床,作为动态观察患者肝纤维化程度及抗肝纤维化治疗效果的重要评价手段之一【2】。本文通过对5000例肝病患者利用FibroScan 进行肝硬度检测对其中检测失败的病例的失败原因进行分析,采取相应的对策,提高检测成功率。 1 对象与方法 1.1 研究对象:选择本院 2014年3月~ 2015年6月住院及门诊的各种慢性肝病患者5000例行肝硬度值检测。病种包括HBV 携带者、慢性乙型肝炎、慢性丙型肝炎、酒精性肝病以及肝炎后肝硬化、自身免疫性肝病、肝癌及肝移植术后患者。检测失败240 人,其中男性76例,女性164 例,平均年龄龄37.2 ± 8.8 岁。 1.2 方法:FibroScan 为法国EchoSense 公司产品,检测方法参照FibroScan用户手册。要求每位患者成功检测10次,成功率(成功检测的次数/总的检测次数)≥60%,检测值四分位间距与中位值比值(IQR/M)应<0.3时结果有效[1]。10 次有效测量的中位值代表肝组织的硬度,以kPa 表示。测量中完全测不出数值、成功率< 60%、IQR/M>0.3 均视为测量失败。并对检测失败的患者进行身高、体重、肋间隙宽度测量、肝脏B超或CT检查。对初次检测失败病例适当改变患者的体位、检测部位、探头方向等进行再测量。 1.3 统计学处理:应用SPSS13.0软件进行数据处理,以P<0.05为差异具有统计学意义。 2 结果 2.1 一般情况:检测人数共5000 人,初次检测失败人数为240 人,失败率为4.8%。经再次测量后52 例测量成功,失败率降低为 3.8%。 2.2不同特征人群对失败率的影响 BMI≥28kg /m2 者失败率明显高于BMI < 28kg /m2 者;女性失败率高于男性;老年人测量失败率高;肋间隙狭窄患者失败率高,差异均有统计学意义(P<0.01).见表1 2.3 不同影像学原因FibroScan 探测失败率的比较[n(%)] B 超或CT 检查示肝脏血管瘤、结节、囊肿,肝脏缩小、腹腔积液、气体干扰等导致FibroScan 探测失败率明显增高。见表2。
2020心力衰竭生物标志物中国专家共识 近日,中国医疗保健国际交流促进会循证医学分会以及海峡两岸医药卫生交流协会老年医学专业委员会组织相关专家共同发布了《心力衰竭生物标志物中国专家共识》,以助力心衰管理。 预测心衰的发生 ①测量心肌负荷标志物、心肌损伤标志物、肾功能不全标志物能有效预测心衰的发生,联合测量能显著提高预测价值。(Ⅰ类推荐) ②B型钠尿肽(BNP)/N末端前体BNP(NT-proBNP)单用或联合肌钙蛋白T (TnT)/肌钙蛋白I(TnI)或联合尿白蛋白肌酐比(UACR)对新发心衰有一定的预测作用。(Ⅰ类推荐) ③BNP/NT-proBNP,TnT/TnI 联合炎症指标可溶性ST2(sST2),生长分化因子15(GDF-15)对新发心衰有一定的预测作用。(Ⅱa类推荐) ④单独应用肾功能不全标志物(胱抑素-C,UACR)、炎症因子(TNF-α,IL-6,CRP或Gal-3)对新发心衰的预测作用较弱。(Ⅱb类推荐) 心衰的诊断 急性失代偿性心衰的诊断
①BNP和NT-proBNP可用作急性心衰的诊断标志物,尤其在临床情况不明了的情况下,具有很高的阴性预测值。(Ⅰ类推荐) ②BNP<100 pg/mL可用于排除急性失代偿性心衰的诊断,有较高的阴性预测值。(Ⅰ类推荐) ③NT-proBNP 可用作急性心衰标志物,界值450 pg/mL(<50岁),900 pg/mL (50~75岁),1800 pg/mL(大于75岁),有较高阴性预测值。(Ⅰ类推荐) ④BNP>400 pg/mL 或NT-proBNP>450 pg/mL(<50岁),900 pg/mL (50~75岁),1800 pg/mL(大于75岁)应考虑心衰的诊断。(Ⅱa类推荐) ⑤房颤或脓毒血症时BNP对心衰的诊断价值有限。(Ⅱb类推荐) ⑥sST2对急性失代偿性心衰的诊断有重要的辅助作用,具有较高的阴性预测值。(Ⅱa类推荐) 射血分数保留的心衰(HFpEF)的诊断 ①BNP ≥100 pg/mL或NT-proBNP ≥800 pg/mL可作为HFpEF的诊断界值,合并肺疾病、肾功能不全、肥胖等临床情况时,BNP的界值应上下微调。(Ⅱa 类推荐) ②BNP联合舒张功能标志物、心肌重构标志物、炎症标志物等可以提高HFpEF 的诊断效能。(Ⅱb类推荐)
5月业务学习考核 姓名:科室:成绩: 一、选择题 1、心力衰竭(简称心衰)是由于的一组复杂临床综合征。() A.心脏异常搏动 B.血压突然增高 C.心脏结构或动能异常引起心室充盈或射血能力受损 D.冠状动脉循环改变引起冠状血流和心肌需求之间不平衡而导致的心肌损害 2、心衰常见病因是() A.高血压病 B.冠心病 C.肺部感染 D.肾功能损害 3、心衰的生物学标志物是() A.血浆利钠肽、心脏肌钙蛋白 B.血尿素、血浆利钠肽 C.肌酐、心脏肌钙蛋白 D.血尿素、肌酐 4、心衰临床表现包括() A.进行性呼吸困难 B.活动耐量受限 C.心前区疼痛 D.体液潴留 5、治疗心衰的常用药物包括() A.利尿剂 B.血管紧张素转换酶抑制剂 C.血管紧张素受体激动剂 D.β受体阻滞剂 E.醛固酮受体拮抗剂 (6—10题共用以下案例) 患者小张,男性,56岁,既往有冠心病史,具体用药不详,近日活动后出现气促、乏力、心悸,休息较长时间后可缓解,2018-05-20在家突发心绞痛,伴呼吸困难,全身乏力,口服硝酸甘油片、卧床休息仍未见好转,由家人送入医院治疗,血压172/108mmhg,肌钙蛋白阳性,BNP 96ng/L,肌酐79umol/L,血清钾浓度3.43mmol/L。 6、患者小张最可能发生了() A.心肌梗死 B.脑血管意外 C.心力衰竭 D.高血压危象
7、患者目前心功能分级为() A.Ⅰ级 B.Ⅱ级 C.Ⅲ级 D.Ⅳ级 8、以下对该名患者的护理措施中,正确的是() A.绝对卧床休息,取半坐卧位 B.中流量给氧 C.控制补液速度约60滴/分 D.记24小时出入量 E.限制钠摄入<2g/天 9、治疗期间,患者病情趋于稳定,5-26早饭后突发心慌、恶心、呕吐,心电图显示室性期前收缩,最可能发生了() A.急性心梗 B.急性心衰 C.洋地黄中毒 D.胃肠道不良反应 10、患者病情得到控制,今日出院,护士小陈进行出院宣教内容包括() A.定期复诊,按时用药 B.适量运动,劳逸结合 C.保持心情舒畅,家人多关怀 D.控制体重,每天水摄入量不超1000ml E.自我监测血压、脉搏,注意药物不良反应 答案:1-10:C、B、A、ABD、ABDE、C、D、ABDE、C、ABCDE
2020泌尿系统感染生物标志物研究进展 泌尿系统感染(urinary tract infection, UTI)是临床最常见的感染之一, 发病率及复发率较高。肾脏移植术后感染中有30%以上为UTI[1]。中段尿培养是目前UTI诊断的金标准, 但其阳性检出率低且耗时长, 不能满足临床诊疗的需求。因此, 寻找更加敏感和准确的UTI生物标志物作为中段尿培养方法的补充, 具有重要的临床意义。我们就UTI的生物标志物研究进展进行综述。 1 降钙素原(procalcitonin, PCT) UTI的预后与感染部位有关。因此, 快速而准确地鉴别上尿路感染及下尿路感染有重要的临床意义。PCT和C反应蛋白(C-reactive protein, CRP)是临床上常用的炎症指标, 近年来作为判断UTI的生物标志物, 临床诊断效果很好。XU等[2]对PCT与CRP在鉴别儿童上尿路感染和下尿路感染中的价值进行研究, 结果显示, PCT和CRP 均可作为鉴别诊断儿童上尿路感染与下尿路感染的生物标志物, 但PCT的敏感性(90.47%)及特异性(88.0%)均优于CRP(敏感性为85.7%, 特异性为48%), 表明PCT是更适合用于鉴别诊断儿童UTI的生物标志物。
LEVINE等[3]研究发现, PCT可以作为排除UTI的生物标志物, 他们分析了293例UTI患者血清PCT水平, 结果显示, PCT< 0.25 ng/mL 可以排除UTI, 这种排除性的生物标志物可以更有效地避免抗菌药物的滥用。 2 肝素结合蛋白(heparin-binding protein, HBP) HBP是相对分子质量为37 000的低分子蛋白质, 储存在人类中性粒细胞分泌体和嗜苯胺蓝颗粒中, 当其从活化的嗜中性粒细胞中被释 放时, 可作为多功能炎症介质引起血管渗漏并趋化和诱导单核细胞[4, 5], HBP是各种潜在细菌感染的生物标志物, 有研究结果表明, 血浆、脑脊液和皮肤中HBP水平的升高与菌血症、细菌性脑膜炎或链球菌感染有关[6]。儿童尿中HBP水平的明显升高可反映UTI程度。KJ? LVMARK等[7]的研究发现, 尿相对于尿白细胞, 诊断尿路感染更敏感且更具特异性。他们对成年患者进行研究后发现, 尿HBP与尿白细胞介素-6、白细胞和亚硝酸盐相比, 尿HBP是区分下尿路感染和肾盂肾炎的最佳的生物标志物[8]。 3 黄嘌呤氧化酶(xanthine oxidase, XO) 人类的XO主要存在于肝脏。CIRAGIL等[9]的研究结果显示, UTI患者尿XO活性会增强, 且仅当尿液中含有> 105/mL的细菌时, XO活性才显著增强, 尿液中XO活性诊断UTI的敏感性和特异性均为100%。尿XO或可成为新的潜在生物标志物, 用于诊断UTI [10]。
瞬时弹性成像技术(TE)临床应用专家共识(2015年) 瞬时弹性成像技术(TE)临床应用共识专家委员会 肝脏纤维化是各种慢性肝脏疾病向肝硬化发展的病理过程。肝纤维化程度是各种慢性肝病严重程度及预后的重要预测指标。对肝纤维化程度的准确评价有助于指导临床的诊疗。目前评价肝纤维化的金标准仍然是肝脏活检的肝病理学检测。但肝活检是有创的,且由于肝脏病变可能不均匀,单个肝组织活检标本不一定能全面反映肝脏整体纤维化程度,不同阅片人判定的结果可能会有一定偏差等,此外尚不好满足目前临床上所需的多次动态检查的应用。瞬时弹性成像技术(transient elastography,TE)通过测量肝脏硬度值(liver stiffness measurement,LSM),从而反映肝纤维化程度。由于其具有无创、简便、快速、易于操作、可重复性、安全性和耐受性好的特点,目前已被AASLD、EASL及中国慢性乙型肝炎防治指南推荐为乙型、丙型肝炎病毒相关肝纤维化临床评估的重要手段。2013年《中华肝脏病杂志》发表了“瞬时弹性成像技术诊断肝纤维化专家意见”,同年澳大利亚肝病协会(ALA)在墨尔本澳大利亚胃肠病学周(AGW)上也发布了“TE 用于临床实践的专家共识”[1]。随着该技术应用的不断推广,近年来又有一些新进展。为此,《中华实验和临床感染病杂志(电子版)》和《中国肝脏病杂志(电子版)》组织全国部分专家,结合最新研究的相关资料,对该技术的临床应用进行广泛讨论并形成此共识,以为临床医务工作者提供最新的指导文献。 本《共识》资料来源包括:① Pubmed截止至2015年3月关于瞬时弹性成像技术(TE)的文献;②中文数据库中关于瞬时弹性成像技术(TE)的文献;③截止至2015年3月AASLD、EASL、APASL及澳大利亚肝病学会(ALA)年会会议摘要、指南;④专家的个人经验与意见。相应证据及推荐等级见表1。《共识》经专家委员会讨论,可作为TE技术在临床应用的指导。随着相关临床实践的不断深入及文献的积累,专家委员会将对《共识》内容进行更新。 1瞬时弹性成像技术原理及应用注意事项 1.1 TE用于肝纤维化检测的基本原理剪切波在肝脏中的传递速度与肝组织硬度直接相关,肝组织硬度越大,剪切波的传播速度则越快,弹性数值越大,由此来评估肝纤维化的程度。 基金项目:北京市医院管理局扬帆计划[京医管科教字(2014)2号]1.2 TE应用注意事项测量时患者仰卧,右手放在头后,暴露肝右叶区的肋间隙。通常取剑突水平线、右腋中线及肋骨下缘所包围的区域为检测区域。探头垂直紧贴于皮肤,于肋间隙选定测量位置, 检查者按探头按钮开始采集图像并获得测量值。10次成功测定值的中位数即为最终测定值,对于有效TE检测,要求操作成功率≥60%且四分位数间距(interquartile range)/中位数(median)即IQR/M ≤ 0.3。但LSM小于7.1 kPa时,即使IQR/M > 0.3其结果也较为可靠[4]。 1.3 多种因素影响TE检测值如患者合并腹水、肥胖或肋间隙过窄可能致操作失败率为 2.4%~9.4%;肝脏炎症、胆汁淤积、肝脏淤血、进食等均可影响肝脏硬度,进而影响对肝纤维化程度判断的准确性。肝脏炎症会增加肝脏硬度,在慢性肝炎急性发作期,当反映肝脏炎症的ALT升高时,可使LSM检测值升高,这种情况在纤维化分期F≤2时影响更明显[5];而在肝病相对稳定的肝硬化患者,轻度ALT升高(<3倍)对LSM检测值影响不大。但当合并急性肝炎加重可能也会有影响[6,7]。故在解读LSM值时,若存在肝脏炎症,需特别谨慎。有学者[8]依据ALT水平分别界定明显肝纤维化的界值,以便更好地判断肝纤维化的真实情况(A1)。TBil升高时,LSM值会显著升高。此外,GGT、AST、AFP、PLT、ALB、PT、病毒载量及右心功能衰竭所致肝淤血等因素均对患者的LSM值也有一定影响[9],解读LSM结果时亦需加以考虑。法国一项前瞻性研究显示体重指数BMI ≥ 30 kg/m2与检测失败或结果不可靠独立相关[10]。BMI < 30 kg/m2时,操作失败率为2.6%,而BMI ≥ 30 kg/m2的高加索或中国人中,3%检测结果不可靠、11.6%~18.4%检测失败[11-13]。另有研究显示,国外瞬时弹性检测仪FibroScan配置有不同探头,用M型探头检测失败率达25.5%,这可能与皮下脂肪较厚有关;当换用XL探头时,在之前操作失败的患者中可有61%检测成功,检测值要略低于M型探头所测值,分析时需加以考虑。但有研究认为肝脏脂肪变程度并不影响LSM值,故该法也可用于非酒精性脂肪肝患者肝纤维化程度的检测(A1)。国产瞬时弹性检测仪FibroTouch应用动态宽频探头技术减少肥胖等因素干扰,同时还增加了二维影像引导功能,在避开囊肿和血管等相关影响因素后,可大幅提升探头检测成功率和检测速
瞬时弹性成像:检测肝硬化的有效方法 作者:陈景寿 许多研究提示,超声瞬时弹性成像是一种检测肝纤维化的无创方法,有望替代肝活检。美国学者Talwalkar等的一项荟萃分析结果显示,基于超声的瞬时弹性成像可能是临床检测肝硬化的一种有效方法。[Clin Gastroenterol Hepatol 2007,5(10)∶1214] 研究者应用手工目录搜索和电子搜索的方式,收集应用瞬时弹性成像和肝活检的方法检测肝纤维化的临床对照研究,进行系统性回顾和荟萃分析,综合各研究中瞬时弹性成像的敏感性、特异性和似然比进行评价。 结果显示,共纳入9项研究,Ⅵ期肝纤维化(肝硬化)的混合敏感性、特异性、阳性似然比和阴性似然比分别为87%[95%可信区间(CI)为84%~90%]、91%(95% CI为89%~92%)、11.7(95% CI为7.9~17.1)和0.14(95% CI 为0.10~0.20)。在其中7项调查研究中,Ⅱ~Ⅳ期肝纤维化的混合敏感性、特异性、阳性预测值和阴性预测值分别为70%(95%CI为67%~73%)、84%(95%CI为80%~88%)、4.2(95% CI为2.4~7.2)和0.31(95% CI为0.23~0.43)。诊断界值(cut-off值)偏倚是导致这两组混合结果具有异质性的主要原因。(陈景寿) 肝脏瞬时弹性成像技术,是以超声检查为基础,通过肝硬度测量,对慢性肝病患者作出肝纤维化的诊断,并由此给出分级。它由三个关键部分组成:产生超声波并作为超声波接收器的换能器;位于换能器上发出低频震动波的探针;可以记录数据的软件程序。仪器配有的软件程序将低频超声波在肝组织内的运行速度,通过专用的运算系统,换算成肝组织弹性。弹性数值越大,肝组织质地就越硬。 测量时,患者仰卧,右手放在头后,暴露胸部肝右叶区的肋间隙。换能探头将紧贴肋间隙皮肤做检查。每名患者需测10个点,每点测定时间不到20秒,整个检查时间不到10分钟。该检查法安全方便、操作简便,对患者也不会造成痛苦,具有多次测定的良好重复性。 已有研究人员对不同阶段慢性肝病患者肝硬度值进行了测量。结果发现,非活动性表面抗原携带者、慢性乙型肝炎、肝硬化代偿期和失代偿期肝的硬度值,是随着病情的发展而逐渐升高的。肝脏瞬时弹性成像技术不仅在诊断肝纤维化、肝硬化上有良好的表现,而且对肝硬化并发症的诊断也有帮助。 当然,事物都有两面性。尽管肝脏瞬时弹性成像技术是一种无创、定量评估肝纤维化程度的好方法,但研究发现它也存在局限性,影响了诊断的普及率和准确性。 肝活检与无创标志物
《感染相关生物标志物临床意义解读专家共识》专家解读 近日,在南京举办的《感染相关生物标志物临床意义解读专家共识》(以下简称《共识》)媒体专访会上,中国人民解放军总医院呼吸科主任解立新教授、解放军南京总医院呼吸病研究所所长施毅教授以及浙江省人民医院检验中心主任周永列教授从不同角度对《共识》内容进行了全面、深入的解读。 感染生物标志物PCT与IL-6 辅助感染性疾病诊疗 感染性疾病不能仅靠症状、体征、影像学表现做出判断,优选良好的感染相关生物标志物对帮助临床鉴别感染与非感染、动态评价疾病严重程度和预后、指导抗菌药物的合理使用具有重要意义。解立新教授指出,优选感染标志物应具备的特性包括:灵敏度高,可以在感染早期即发生显著变化且不受非感染因素影响;高特异性,能够区分病原体类别,鉴别是否为细菌性感染;能够辅助评估感染严重程度和预后,监测治疗应答,并指导抗菌药物的使用等。 C-反应蛋白(CRP)是目前在临床广泛应用的细菌感染生物标志物。作为敏感的炎症指标,CPR检测快速、便捷,其升高幅度与感染或炎症严重程度呈正相关;CRP检测还可辅助区分细菌感染和病毒感染。
此外,更多优秀生物标志物如降钙素原(PCT)、白细胞介素6(IL -6)等近年也逐步在临床上开始应用。施毅教授指出,PCT作为目前临床常用的重要细菌感染生物标志物,参考意义较大;IL-6检测的相对优势则在于急性感染的早期发现。 PCT是一种功能蛋白,是降钙素合成过程中的中间产物,是无激素活性的降钙素前肽物质。《共识》指出,PCT对严重细菌感染的早期诊断、判断病情严重程度、预后、评价抗感染疗效、指导抗菌药物应用等方面都具有较高的临床价值,且对全身与局部感染具有较高诊断价值,是判断脓毒症的重要工具。 一项包含30 个临床试验的荟萃分析证实,PCT可有效辅助脓毒症的早期诊断。数据显示:当PCT截断值定为1.1 μg /L 时,早期识别脓毒症的敏感性为77%,特异性为79%。此外,PCT在局灶性细菌感染中往往正常或轻度升高,可辅助诊断局灶性细菌感染。同时,PCT水平可有效反映患者细菌感染严重程度,其浓度与全身性细菌感染严重程度呈正相关。 在判断脓毒症患者预后及辅助指导抗生素治疗方面,研究证实,经过有效的抗感染治疗,脓毒症患者24小时后循环中的PCT水平可降低50%,其降低程度和患者存活率升高呈正相关,而PCT水平仍继续增高或居高不下则提示预后不良;PCT检测结合临床信息能够进一步明确抗生素治疗的必要性以及优化抗生素使用流程,动态监测PCT水平可辅助抗生素治疗,
肝脏瞬时弹性超声评价自身免疫性肝炎肝纤维化的价值 王绮夏;沈镭;邱德凯;包瀚;陈晓宇;曾民德;茅益民;马雄 【期刊名称】《中华肝脏病杂志》 【年(卷),期】2011(019)010 【摘要】Objective To validate transient elastography (Fibroscan) in assessment of hepatic fibrosis in autoimmune hepatitis (AIH).Methods Liver stiffness was assessed using Fibroscan in totally 30 patients with AIH.We compared the results of Fibroscan with the Scheuer fibrosis stage in liver biopsy in each patient.Results 4 patients were shown as liver fibrosis stage S0,6 as S 1,5 as S2,11 as S3 and 4 as S4.Failure of the Fibroscan measurement occurred in 1 case (3.3%) because of her increased body mass index (BMI).The stiffness of Fibros can was significantly correlated with the liver biopsy fibrosis stage (r= 0.801,P<0.001).The liver stiffnesses between mild and moderate fibrosis (S0-2) and advanced fibrosis (S3-4) were significantly different (t=-3.937,P= 0.001).Conclusion Transient elastography (Fibroscan) is a promising non-invasive method for detection of fibrosis in patients with autoimmune hepatitis.Its use for the follow up and management of these patients and should be evaluated further.%目的验证肝脏瞬时弹性超声在评估自身免疫性肝炎(AIH)患者肝纤维化程度中的价值.方法用瞬时弹性超声对30例AIH患者进行肝脏瞬时弹性测定,并将测定值与按照Scheuer系统进行纤维化分级的患者肝活组织检查结果作纤维化程度的比较,用Spearman等
心肌标志物的分类和临床应用时间:2009-3-19 9:53:04 心力衰竭标志物的应用 各种心脏疾病最终均可发展到心力衰竭。由于心力衰竭的发展比较缓慢,心脏是在各种病症累积多年后,才渐渐失去其泵血能力和各方面功能的减弱及下降。而在心衰的早期,心脏功能的减退是依靠心脏所分泌的短肽激素来调节心脏的代偿功能,故在临床上往往不易出现症状。传统诊断心衰的指标为心脏超声诊断,以评价心脏左室的射血分数了解心脏功能。近几年,由美国和欧洲心脏病协会推荐使用的B型尿钠肽(B-type brain natriuretic peptide,B-BNP),是目前唯一一个最好的用于评价心力衰竭的实验室检测指标,在欧洲心脏协会(European Society of Cardiology,ESC)2001年的心衰诊断指南中心,已将其作为实验室检测项目中的唯一指标。 B型尿钠肽又称脑尿钠肽(Brain natriuretic peptide,BNP),是由心肌细胞合成的具有生物学活性的天然激素,主要在心室表达,同时也存在于脑组织中。当左心室功能不全时,由于心肌扩张而快速合成释放入血,有助于调节心脏功能。心肌细胞所分泌的BNP先以108个氨基酸组成的前体形式存在,当心肌细胞受到刺激时,在活化酶的作用下裂解为由76个氨基酸组成的无活性的直线多肽和32个氨基酸组成的活性环状多肽,释放入血循环,分别被称为NT-proBNP和BNP。 NT-proBNP的生物学半衰期为60~120min,而BNP仅为20min。B-BNP的释放与心衰程度密切相关,心衰程度加重,B-BNP的释放增加。B-BNP的主要生物学作用是参与钠调节,促进尿钠排泄和利尿,扩张血管,维持血压的动态平衡,
BNP作为心衰定量标志物,不仅反映左室收缩功能障碍,也反映左室舒张功能障碍、瓣膜功能障碍和右室功能障碍情况。在急性呼吸困难患者中有30-40%存在急诊医生难以确诊而影响预后,以BNP 100pg/ml作为临界值的阴性预测值达到90%,可以减少74%的临床不确定性;而BNP 超过400pg/ml提示患者存在心力衰竭的可能性达95%。而BNP 在 100-400pg/ml时可能由肺部疾病、右心衰、肺栓塞等情况引起。呼吸困难患者急诊就诊时的BNP水平以及治疗后的变化也可以反映其出院时风险。 ①BNP是HF的定量标志物;②BNP对于诊断HF是高度准确的;③BNP 可以帮助给急诊科病人进行危险分层以便判断是该入院还是出院。④BNP 测试有助于改善病人管理,减少总治疗费用;⑤BNP测试节省6个月内费用;⑥BNP是HF最强大的预测物;⑦BNP水平有助于评估出院的安全性; ⑧BNP指导的治疗能提高慢性HF疗效;⑨BNP水平,以及症状和体重增加,是确定临床失代偿的最好方法;⑩BNP是急性冠脉综合征病人死亡的最强大的预测物。 B型尿钠肽又称脑尿钠肽(Brain natriuretic peptide,BNP),是由心肌细胞合成的具有生物学活性的天然激素,主要在心室表达,同时也存在于脑组织中。当左心室功能不全时,由于心肌扩张而快速合成释放入血,有助于调节心脏功能。心肌细胞所分泌的BNP先以108个氨基酸组成的前体形式存在,当心肌细胞受到刺激时,在活化酶的作用下裂解为由76个氨基酸组成的无活性的直线多肽和32个氨基酸组成的活性环状多肽,释放入血循环,分别被称为NT-proBNP和BNP。BNP小于100pg/ml 可排除心衰 医学上,BNP是血清脑钠肽,分析BNP 在评估心功能和冠脉病变程度方面有一定作用。它的含量与心室的压力、呼吸困难的程激素调节系统的状况相关。心室的体积和压力增高可导致血浆内BNP的升高,升高的程度与心室扩张和压力超负荷成正比.可敏感和特异性地反映左心室功能的变化。近年来美国等国家推荐使用的BNP是目前最好的用于评价心力衰竭的实验室检测指标。 中文名称:脑钠肽英文名称:brain natriuretic peptide;BNP 定义:主要由心脏分泌的利尿钠肽家族的一员,由32个氨基酸残基组成的多肽。因其首先在猪脑中发现,故名。能调节血压和血容量的自稳平衡,并有利尿作用。BNP的生成与清除 BNP 主要由心室肌细胞合成和分泌,心室负荷和室壁张力的改变是刺激BNP 分泌的主要条件。BNP 的清除有两条途径:一是由利尿钠肽家族的C 型受体介导,内吞入胞内后由溶酶体降解;二是经中性内肽酶(NEP)降解。 BNP的结构合成与分泌 BNP同ANP一样具有一个由17个氨基酸通过一对二硫键组成的环状结构,它对于受体的结合很必要,其中二硫键对于BNP的生物活性很重要。BNP具有种属特异性,大鼠的BNP由45个氨基酸组成,而猪、狗与人的BNP由32个
龙源期刊网 https://www.doczj.com/doc/6c12235778.html, 肝脏弹性硬度检查 作者:罗光荣 来源:《家庭医学》2019年第08期 慢性肝病持续存在的最严重后果,是逐渐发生肝脏的纤维化,进而发展成不可逆转的肝硬化。监测肝脏纤维化的程度是评估各类慢性肝病病情轻重的关键指标。以往,我国慢性肝病的最常见病因是乙型肝炎;随着经济状况的改善和生活水平的提高,肥胖所致的脂肪肝已成为我国慢性肝病的最常见病因。最新统计表明,我国成年人脂肪肝患病率高达30%左右。因此,监测肝脏脂肪变程度也成为非常重要的一项体检内容。 过去,肝组织病理活检一直是诊断肝纤维化的“金标准”,尤其在某些情况下,具有确定肝纤维化病因的不可取代的作用。患者通常需要局部麻醉,运用负压吸引一秒钟穿刺技术,在B 超、CT的定位和引导下经皮肤穿刺,或在腹腔镜的监视下直接穿刺。穿刺获取肝脏标本一般在10~25毫克,经过处理后做病理组织学、免疫组化等染色,在显微镜下观察肝脏组织和细胞形态。但由于肝穿刺的有创性和不可重复操作的缺点,被检查者可能出现疼痛、感染、局部血肿甚至死亡的风险,以及存在肝穿样本误差和阅片者的偏差,导致其在临床上的应用受到一定限制。 随着医疗技术的发展,一种新型的肝纤维化无创检测仪器“瞬时弹性成像”出现在临床。瞬时弹性成像的英文名称为“FibroScan”,一些网民根据它的译音称其为“飞波”,用来检测肝脏硬度值,以评估肝脏纤维化程度。该仪器2001年由法国Echosens公司研制成功,可部分替代肝穿刺活檢,同时还能够应用于各类肝病不同阶段病情的监测与评估。因操作简便,对人体没有创伤,被很多健康体检中心列为常规的体检项目。 瞬时弹性成像的奥秘 瞬时弹性成像仪器上装备有一个探极,探极中有一个超声换能器,可以把仪器发出的小振动波通过超声换能器向肝组织传递,同时收集肝组织对振动波的脉冲回声波,通过测定回声波的速度测量肝组织的弹性。回声波在肝脏中的传递速度与肝组织硬度直接相关,肝组织硬度越大,回声波的传播速度则越快,弹性数值越大,以此来评估肝纤维化的程度。 该仪器还把肝脏内脂肪组织在超声波下回声衰减的情况,转化成一种反相射频信号的参数——肝脏脂肪变受控衰减参数(CAP),使肝脏内脂肪堆积的情况能够比较准确地以参数形式反映出来,实现了对肝脏脂肪变的定量检测。 检查时患者取仰卧位,右手抱头,最大限度地展现肋间隙;检查者在探极上涂抹导电凝胶后,将探极垂直置于肋间隙,测定肝右叶的弹性。