Research Article
Photobioreactor for cultivation and real-time,in-situ measurement of O 2and CO 2exchange rates,growth dynamics,and of chlorophyll ?uorescence emission of photoautotrophic microorganisms
A detailed knowledge about the dynamics of phytoplanktonic photosynthesis and respiration is crucial for the determination of primary productivity in open oceans as well as for biotechnological applications.The dynamics are best studied in photo-bioreactors that are able to simulate natural conditions in such,that light can be modulated not only diurnally but also mimicking effects of solar elevation angle from sunrise to sunset,variable cloudiness,light modulation in refractory sun ?ecks due to water waves,or light intermittence due to turbulent ?ow in dense suspensions.In addition,high performance photobioreactors ought to be able to monitor in real time photosynthetic and respiratory activities as well as culture growth.Here,we demon-strate performance of a newly designed bench-top laboratory photobioreactor that meets these needs,with a study of green alga Scenedesmus quadricauda .The algal suspension was exposed to simulated daily variations of total photosynthetic active irradiance and spectral pro?le,with a larger proportion of red photons in the morning and evening hours.The instrument monitored automatically the culture growth by measuring the optical densities at 735nm and 680nm and by measuring steady state and maximal chlorophyll ?uorescence emission yields.The photochemical yields were estimated from chlorophyll ?uorescence data.These widely used but rather indirect yield estimates were confronted with direct measurements of oxygen evolution and consumption quantum yields.The CO 2?uxes in and out of the culture media as well as the dissolved CO 2in algal suspension were also recorded.The experiments demon-strated potential of the new photobioreactor to reveal minute modulations in gas exchange rates as well as to yield data for calculation of photon requirement of oxygen evolution in the suspension volume that is key technological parameter for planning of large scale photobioreactors as well as key optimization parameter for strain selection.
Keywords:Bioreactor /Biotechnology /CO 2sequestration /Photosynthesis Received:December 22,2008;revised April 7,2009;accepted:May 7,2009DOI:10.1002/elsc.200800123
1Introduction
Oxygenic photosynthesis,which evolved in ancient photo-synthetic prokaryotes more than 3.5billion years ago,has shaped the environment on Earth and resulted in an O 2-enriched and CO 2-depleted atmosphere,thus providing the fundament for all aerobic forms of life [1].Recently,photosynthesis became the main topic in mitigating the impact of anthropogenic greenhouse gas emissions and in searching for higher generation biofuels [2].Prokaryotic cyanobacteria and eukaryotic algae are considered favorable candidates for the development of sustainable energy resources [3].It is this potential that has led in recent years to a keen interest of scientists and engineers in developing new
Jan C ˇerveny ′1Ivan S
ˇetl?′k 2,3Martin Trt?′lek 4Ladislav Nedbal 1,3,4
1
Institute of Systems Biology
and Ecology ASC
ˇR,Za ′mek 136,CZ-37333Nove
′Hrady,Czech Republic
2
Institute of Microbiology ASC
ˇR,Opatovicky ′mly ′n,CZ-37901Tr
ˇebon ˇ,Czech Republic
3
Institute of Physical Biology,University of S.
Bohemia,Za
′mek 136,CZ-37333Nove
′Hrady,Czech Republic
4
Photon Systems Instruments,Ltd.,
Kola
′c ˇkova 39,CZ-62100Brno,Czech Republic
Abbreviations :ADP ,adenosine di-phosphate ;ATP ,adenosine tri-phosphate ;Chl,chlorophyll a 1b ;dCO 2,concentration of dissolved carbon dioxide in suspension ;dO 2,concentration of dissolved oxygen in suspension ;F M 0,maximum ?uorescence emission yield measured during saturating ?ash of light ;F S ,instantaneous ?uorescence emis-sion yield ;I red/blue ,irradiance emitted by red or blue light emitting diodes ;LED,light emitting diode ;OD l ,optical density measured at l nm ;P ,rate of net photosynthetic oxygen evolution ;P sat ,rate of net photosynthetic oxygen evolution in saturating irradiance ;R ,rate of respiration ;NADPH,nicotinamide adenine dinucleotide phosphate ;PAR,photosynthetically active radiation,400–700nm ;QY PSII ,effective quantum yield of photosystem II ;D 680–735,proxy to chlorophyll
Correspondence:Jan C
ˇerveny ′(Jan.Cerveny@bionext.eu),Institute of Systems Biology and Ecology ASC
ˇR,Za ′mek 136,CZ-37333Nove ′Hrady,Czech Republic.
Eng.Life Sci.2009,9,No.3,247–253247
techniques and instruments for phycology as well as for algal biotechnology.
Algae and cyanobacteria absorb photosynthetically active part of solar radiation,PAR(approx.400–700nm)to drive primary photochemistry in the reaction centers of Photosystem II and Photosystem I[4,5].In the process of photochemical charge separation,Photosystem II extracts electrons from water leading to the release of molecular oxygen and the accumulation of protons in the thylakoid lumen.Photosystem I accepts those electrons and delivers them to produce the strongly reducing NADPH.The chain of charge transfer reactions leads to further accumulation of protons in the thylakoid lumen and to a reduction of proton concentration at the outside.The electro-chemical potential difference across the thylakoid membrane is utilized to produce ATP from ADP and phosphate.The two major products of the photosynthetic light reactions,NADPH and ATP are used in the Calvin-Benson cycle to assimilate CO2 into glyceraldehyde3-phosphate and?nally into sugars and other energy rich-metabolites.In a simpli?ed model,the photosynthetic apparatus could be characterized as PAR light (400–700nm)absorbing structure,which re-emits a small part of the absorbed light energy in form of chlorophyll?uorescence (ca.660–760nm),takes up dissolved CO2,releases O2,and supplies energy-rich organic compounds.The exchange of CO2 and of O2between microbial cells and their environment is further in?uenced by respiration that can be approximately considered as inverse process to photosynthesis-releasing CO2 while taking up O2and consuming energy rich storage compounds to support growth of the organism.
In order to understand these complex phenomena on the level of a photobioreactor,the dynamics of O2,CO2,as well as of pH and temperature must be monitored and controlled.Chlorophyll ?uorescence emission is another key reporter signal on energetic ef?ciency and yield of photochemistry to measure[6].W e moni-tored all these reporter signals in a new instrument that represents a signi?cant extension of the photobioreactor that we constructed and described earlier[7].This instrument is able to monitor growth of the microbial culture by measuring light scattering at 735nm and light absorption by chlorophyll at680nm.In addition, steady-state chlorophyll?uorescence emission in light(F S)and maximum chlorophyll?uorescence emission during a saturating ?ash(F M0)are recorded.F S and F M0are used to calculate the approximate effective quantum yield of PSII photochemistry, QY PSII5(F M0àF S)/F M0[8,9].The major new feature is the capacity of the instrument to measure in situ the O2exchange rates as well as dynamics of CO2mass transfer rates.
In this study,we monitored the dynamics of Scenedesmus quadricauda culture during several diurnal cycles.This comparison provides new insights into capacity of various signals to report on the photosynthetic activity of algae in a dynamic environment. 2Materials and methods
2.1Algal culture
The chlorococcal alga Scenedesmus quadricauda(TURP.)BRE′B (strain Greifswald15,CCALA]463)was obtained from the Culture Collection of Autotrophic Organisms maintained in Trˇebonˇ,Czech Republic(http://www.butbn.cas.cz/ccala/ ccala.htm).In the precultures,the population of algae was kept in cylinders of30mm inside diameter placed in a constant temperature water bath at281C.The algae grew in a mineral medium that was optimized for Scenedesmus[10].The suspension was aerated with2%CO2enriched air.Irradiance from Dulux EL ?uorescent tubes(Osram,Munich,Germany)was set to 400m mol(photons).mà2.sà1PAR during14hours of day followed by10hours of dark.An exponentially growing culture was used to inoculate identical mineral medium in the photobioreactor. 2.2Photobioreactor base unit
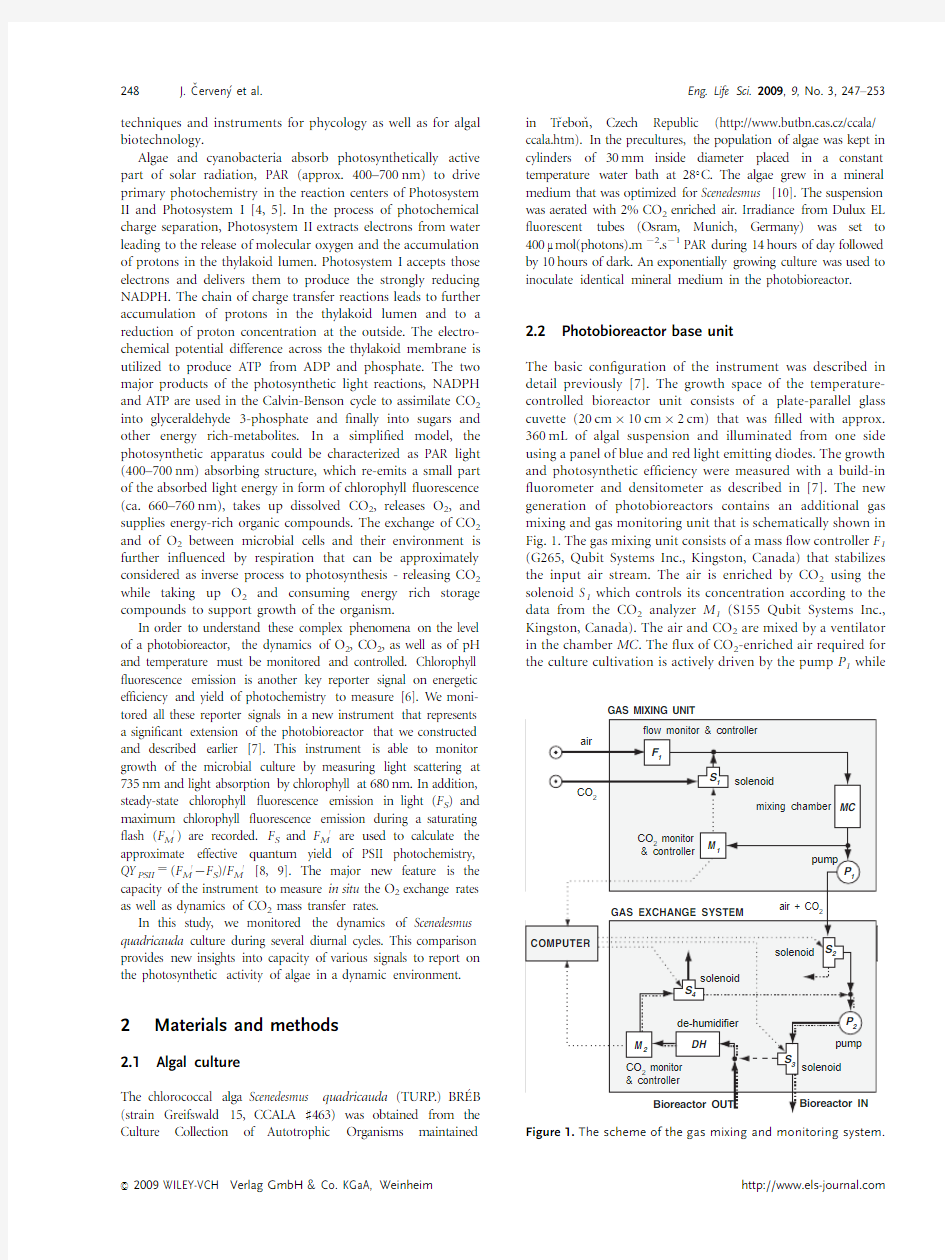
The basic con?guration of the instrument was described in detail previously[7].The growth space of the temperature-controlled bioreactor unit consists of a plate-parallel glass cuvette(20cm?10cm?2cm)that was?lled with approx. 360mL of algal suspension and illuminated from one side using a panel of blue and red light emitting diodes.The growth and photosynthetic ef?ciency were measured with a build-in ?uorometer and densitometer as described in[7].The new generation of photobioreactors contains an additional gas mixing and gas monitoring unit that is schematically shown in Fig.1.The gas mixing unit consists of a mass?ow controller F1 (G265,Qubit Systems Inc.,Kingston,Canada)that stabilizes the input air stream.The air is enriched by CO2using the solenoid S1which controls its concentration according to the data from the CO2analyzer M1(S155Qubit Systems Inc., Kingston,Canada).The air and CO2are mixed by a ventilator in the chamber MC.The?ux of CO2-enriched air required for the culture cultivation is actively driven by the pump P1while
GAS MIXING UNIT
Figure1.The scheme of the gas mixing and monitoring system.
248J.Cˇerveny′et al.Eng.Life Sci.2009,9,No.3,247–253
surplus air mixture is released through M1.To ensure air pressure stability in the gas exchange system,the gas mixture (solid arrows)is further driven by the pump P2through the solenoid S3into the bioreactor unit(250mL minà1)where it is dispersed into seven bubble streams by ori?ces in a stainless steel tube at the bottom of the bioreactor cuvette(not shown). The gas?ow from the bioreactor unit is channeled through a de-humidi?er(DH)into the CO2analyzer(M2),which allows comparing continuously the CO2concentration in the outlet with that in the inlet(measured by M1).Every hour,the air ?ow through the bioreactor unit is interrupted and bypassed so that the analyzers M2and M1can be cross-calibrated (dashed thick line).During this period when the suspension is not aerated,it is ef?ciently mixed in the neighborhood of the electrodes by a magnetic stirrer,so that photosynthetic and respiratory oxygen exchange between the algal cells and the medium can be measured as described below in Figs.3and4. In another measuring mode(dotted thick line),the air mixture is circulated in a closed loop through the bioreactor to measure the rate of CO2exchange between the gaseous and aqueous phases over a period of several minutes so that cumulated CO2sequestration in the bioreactor can be measured during multiple passages of the head volume gas through the suspension(see below for a detailed explanation). The computer is used to record data as well as to control timing of the three different operational regimes and the irradiance pro?le.
The dissolved O2concentration in the algal suspension was measured with Clark type electrode(InPro6800,Mettler-Toledo,Inc.,1900Polaris Parkway,Columbus,OH43240, USA).The dissolved CO2concentration was measured with a pCO2electrode(Carbon Dioxide Electrode,Mettler-Toledo, Inc.,1900Polaris Parkway,Columbus,OH43240,USA).The pH of the media was stabilized around7.5using10mM HEPES buffer and con?rmed by measuring with in-situ pH electrode(InPro3250,Mettler-Toledo,Inc.,1900Polaris Parkway,Columbus,OH43240,USA).
3Results
3.1Irradiance dynamics
The irradiance was modulated to approximate the natural light conditions[11]in Denver,USA(latitude401,longitudeà1051) by using blue LED light(l max E455nm,Dl1/2E20nm)and red LED light(l max E627nm,Dl1/2E20nm).The red light is
changing more steeply during morning and evening hours and its daily course can be approximated as sin4/3(pá(tàt0)/T),where T is the daylight period of14hours,t0is the time of simulated sunrise and t is time between t0and(t01T).Blue light is strongly scattered in the atmosphere during morning and evening hours and changes therefore less steeply,following approximately sin10/7(pá(tàt0)/T)function.The daily illumination pro?le is shown in Fig.2(and in other?gures)by x symbols representing the red light,I red,and by1symbols showing the blue light, I blue.The instrument is capable of changing the incident irra-diance level in a wide range(0–1500m mol(photons)ámà2ásà1 or0–3000m mol(photons)ámà2ásà1,depending on LED con?guration)and the irradiance can be changed instantaneously (not demonstrated here).We also compared the present blue-red con?guration of the LED panel with warm white irradiance.The resulting growth rates were found similar,indicating limited effects of the irradiance spectral composition on the culture dynamics.
3.2Measurements of optical density
Fig.2documents two daily cycles of Scenedesmus quadricauda growth.Each cycle starts with10hours of dark followed by 14hours of red(I red,?)and blue(I blue,1)irradiance that was modulated to simulate natural conditions as described above. After the second24hour cycle,another night period is recor-ded.The optical density at735nm(OD735)and at680nm (OD680)was measured every9min,day and night.In the earlier paper[7],we showed that OD735and D680–7355 OD680–OD735can be used as proxies to estimate cell density and chlorophyll content in a cyanobacterial suspension.Here, we also counted cells and measured chlorophyll concentration by conventional aliquot-sampling techniques and we con?rmed that the proportionality between these quantities and OD735and D680–7355OD680–OD735holds also in green algae(not shown).The biomass proxy and the chlorophyll proxy(OD735and D680–735in top panel of Fig.2)were 012243648
F
l
u
o
r
e
s
c
e
n
c
e
e
m
i
s
s
i
o
n
y
i
e
l
d
,
r
e
l.
u
n
i
t
s
Time, h
I
r
r
a
d
i
a
n
c
e
,
μ
m
o
l
(
p
h
o
t
o
n
s
)
.
m
-
2
.
s
-
1
F S
F M’
OD735
20
40
60
80
100 0
0.2
0.4
0.6
20
40
60
80 0
0.4
0.8
1.2
F S
O
p
t
i
c
a
l
d
e
n
s
i
t
y
O
D
7
3
5
Δ
6
8
-
7
3
5
=
O
D
6
8
-
O
D
7
3
5
Δ680-735
I red
I blue
Figure 2.Two days of Scenedesmus quadricauda growth as recorded by optical density OD735(bottom solid line)and by the difference between optical densities D680–735.OD735 and D680–735are proxies of cell density and of chlorophyll concentration.The daily irradiance pro?les are shown as I blue (1,455nm)and I red curves(?,627nm).The steady-state ?uorescence,F S,excited by blue measuring light is represented as open circles.The maximum?uorescence yield,F M0,is indi-cated as gray?lled circles.F S and F M0that were measured with red excitation light follow nearly identically the dynamics observed with blue light excitation(data not shown).
Eng.Life Sci.2009,9,No.3,247–253High-performance photobioreactor249
increasing during the day and,to a much smaller extent, decreasing early in night.
3.3Measurements of chlorophyll?uorescence
The steady-state?uorescence emission F S was excited alter-natively by blue light(455nm,absorbed by chlorophyll a and b and by carotenoids)and by red light(627nm,absorbed by chlorophyll a and b)and measured every9min during the experiment.The two spectrally different excitation lights are very useful when analyzing the?uorescence behavior of phycobilin containing photosynthetic microorganisms(for example[7]).The fact that the?uorescence excited by the two lights in Scenedesmus was nearly identical(not shown)shows only that there is no noteworthy difference in their absorption by photosystems I and II.The F S measurements are shown by open circles in both panels of Fig.2so that a comparison to dynamics of optical densities(top panel)as well as to maxi-mum?uorescence F M0(bottom panel)is possible.The F S was increasing with growing density of the culture in a trend that was interrupted only by transitions from light to dark and vice versa.The discontinuities of the F S signal at these transitions are due to abrupt changes of photochemical quenching in the reaction centers of photosystem II[12].
During the day hours,the F S measurements were comple-mented with measurements of the maximum?uorescence F M0 yield which were obtained during a saturated light?ash (bottom panel in Fig.2).F M0was not measured during night. The maximum?uorescence yield(F M’)was decreasing from morning to noon due to increasing photoprotective non-photochemical quenching[13].
From noon to evening,the non-photochemical quenching decreased and maximal?uorescence gradually recovered to a level that was higher than the one observed in the morning.The difference between the higher evening and the lower morning values of F M0re?ects the growth of algal biomass during the day.
3.4Measurements of dissolved O2dynamics Figure3shows details of the measurements by the Clark electrode.The upper trace shows changes of dissolved O2 (dO2)during a day measurement when the suspension was illuminated.The arrow1indicates when the suspension bubbling in the photobioreactor stopped and dO2started to increase due to photosynthetic oxygen evolution.During this phase,the irradiance in the bioreactor remained at the level that was before the dO2measurement.The arrow2shows when the light was switched off and respiration resulted in subsequent decrease of dO2.The arrow3marks switching on saturating irradiance in which the saturated oxygen evolution was measured.The irradiance returned to the initial level after bubbling resumed at the time indicated by the arrow
4.The respective curve slopes that are indicated in Fig.3by the dashed lines re?ect the rates of the oxygen exchange: 1-2,the rate(P-R)where photosynthesis P is reduced by respiration R that occurs simultaneously in irradiance in which the cells grew at given time of the day;
2-3,rate of respiration R in dark;
3-4,the rate(P sat-R)where the rate of photosynthesis in saturating irradiance P sat is reduced by the respiration R.
The lower trace in Fig.3shows a typical measurement at night when the bubbling by air was suspended(5-6)and the respiration decreased dO2with time revealing the rate of respiratory oxygen uptake R of the algal cells.
The steady state levels of oxygen dissolved in the suspension (dO2)are shown more globally during the two daily periods in the top panel of Fig.4(solid line with spikes)on the background of irradiance(?marking red,1for blue).The ‘spikes’re?ect measurements of the oxygen exchange rates that were described in detail in Fig.3.The dO2steady-state levels between the‘spikes’re?ect dynamic equilibrium dictated by the gas-liquid mass transfer in bubbled suspension.At night, dO2was below240m M slightly lower than the equilibrium concentration of244m M,the difference due to respiratory dO2 uptake.During the day,dO2was modulated much more strongly by photosynthesis reaching a maximum soon after the maximum irradiance at noon.The levels of dissolved oxygen are higher during the second day re?ecting an increased cell density.
03691215
Time, min
C
o
n
c
e
n
t
r
a
t
i
o
n
o
f
d
i
s
s
o
l
v
e
d
o
x
y
g
e
n
,
μ
M
Figure3.Detailed overview of the measurement of O2evolution and consumption rates during a day(upper curve)and at night (lower curve).Each day measurement starts by stopping the air ?ow through the bioreactor(arrow1)which leads to a rise of dissolved oxygen concentration by combined effects of photo-synthesis P and respiration R.The O2evolution rate is indicated by the slope of the dashed line referring to‘Light-limited O2 evolution’.Then,the light is switched off(arrow2)and respiration rate is represented as the slope for‘Day respiration’. Finally,the saturating light is switched on(arrow3)and the rate of light-saturated O2evolution is determined by the slope corresponding to the‘Light-saturated O2evolution’.At arrow4, the saturating irradiance is reduced to the level prior arrow1and the aeration of the culture is again switched on.The oxygen curve follows the gradual transition to the steady state char-acteristic for the aerated suspension.At night time(lower curve),only the respiratory activity is measured and represented as the slope labeled‘Night respiration’.
250J.Cˇerveny′et al.Eng.Life Sci.2009,9,No.3,247–253
3.5
Measurements of dissolved CO 2dynamics and of CO 2sequestration
The closed circles in the middle panel of Fig.4show the diurnal modulation of dissolved carbon dioxide (dCO 2).The minimum dCO 2levels where found in early afternoons resulting from interplay of the dominating CO 2uptake by photosynthesis,probably overlaid by CO 2-concentrating mechanisms [14,15]and by respiratory CO 2release.
Important parameter re?ecting CO 2sequestration capacity of the algal suspension is the relative change of the CO 2partial pressure between the outlet and inlet of the bioreactor that is shown by triangles in the bottom panel of Fig.4.At noon hours,the CO 2uptake by photosynthesis caused a change as
high as ca.à0.25,thus,25%of incoming CO 2was sequestered in the bioreactor in a single passage.Once in every hour,the CO 2-enriched air was bubbled through the suspension in a closed loop (dotted line in Fig.1)for 5minutes.Multiple passages of the gas through the bioreactor resulted in ca.75%sequestration of CO 2in 5minutes.The sequestration capacity of the bioreactor was higher on the second day compared to the ?rst day,re?ecting increased cell density of the suspension.The quantities presented in Fig.2and Fig.4increase with increasing cell density in the algal culture.Fig.5shows results that are normalized to chlorophyll concentration of the algal suspen-sion.The rate of net photosynthetic oxygen evolution P is shown in Fig.5by closed circles.It was zero during night darkness and was modulated with irradiance (?and 1in Fig.5)to reach at noon a maximum of approx.30–40m mol(O 2)ámmol(Chl)à1ás à1.The rate of net photosynthetic oxygen evolution in saturating irradiance P sat was low in the early morning and late afternoon hours and was otherwise stable through most of the day reaching to ca.50m mol(O 2)ámmol(Chl)à1ás à1.The rate of res-piration was diurnally modulated between à2and à10m mol(O 2)ámmol(Chl)à1ás à1with higher respiratory rates during day hours.The rates of the CO 2sequestration were estimated from the rate of change of partial pressure in the gas phase (Fig.4,bottom panel)and are shown in Fig.5by the closed triangles.During the day the rate of the uptake was modu-lated with irradiance reaching a maximum around 50–70m mol(CO 2)ámmol(Chl)à1ás à1.The maxima were observed in the early afternoon hours.
4Discussion
The results demonstrate the capacity of the photobioreactor to accurately monitor growth rates,?uorescence parameters and gas exchange rates in the algal suspension.Thus,it minimizes perturbations that can occur,if samples of the algal population are taken to an external spectro-or ?uorometer or gas exchange measuring chamber and assayed.This advantage may be particularly evident with the measurements of some of the ?uorescence parameters,which are extremely susceptible not only to the value of the current irradiance but also to its duration preceding the measurement (notable examples are F m or F 0m ).Another advantage of the photobioreactor is its capacity to provide automatic measurements every few minutes during round o’clock https://www.doczj.com/doc/6e10224890.html,st but not least,the data are streamed in real time to an internet-accessible server and can be accessed remotely.Also,the photobioreactors can be accessed remotely to control or adjust the experimental protocols.This feature is particularly useful when running comparative experiments in different laboratories.
The present experiments were primarily aiming at collection of the data on the dynamics of optical densities and ?uorescence (Fig.2)and of O 2and CO 2exchange rates (Fig.3,Fig.4,and Fig.5)in situ and in real time.These data can also be used to calculate bioreactor performance parameters that are crucial for use in strain selection and in optimization of growth conditions.Knowing the number of photons incident at the photobioreactor front window per second and knowing the amount of O 2released in the bioreactor per second,one can calculate photon requirement
12
243648
d i s s o l v
e d C O 2
d i s s o l v
e d O 2
C o n c e n t r a t i o n o f d i s s o l v e d g a s e s , μM
R e l. c h a n g e o f C O 2
c o n c e n t r a t i o n i n g a s p h a s e
Time, h
I r r a d i a n c e , μm o l (p h o t o n s ).m -2.s -1
0204060800204060800
20406080Figure 4.Top panel :Concentration of O 2(solid thick line)dissolved in the algal suspension of the bioreactor during two days of Scenedesmus quadricauda growth.The irradiance is shown using the same symbols as in Fig.2.The ‘spikes’in the trace of dissolved O 2re?ect the changes that occur in dO 2during the hourly measurements of oxygen rates that were shown in Fig.3.The increase of dissolved O 2during day and its decrease at night are due to the photosynthetic and of respira-tory activities of the algal cells.Middle panel :Concentration of dissolved CO 2(black circles)in the algal suspension during two days of Scenedesmus quadricauda growth.Bottom panel :The relative changes in the air CO 2partial pressure.The open triangles show relative changes of CO 2in the air mixture.The gas mixture at the bioreactor inlet contains 0.3%of CO 2and passes through the bioreactor at a constant rate of 250mL min à1.The open squares represent relative changes in the CO 2when 160mL of the 0.3%CO 2-enriched air mixture in the head volume is circulated at the rate of 250mL min à1for 5min.
Eng.Life Sci.2009,9,No.3,247–253High-performance photobioreactor 251
of the photosynthetic oxygen evolution.The thus calculated photon requirement was 40to 32photons/O 2molecule on the ?rst day of experiments and 30to 23photons/O 2molecule (data in Fig.5).The decreasing photon requirement between the ?rst and second day of the experiment was probably due to increasing density of the suspension that decreased the number of photons that passed through the bioreactor cuvette without being absorbed by chlorophyll.The well established limit of 8–10photons/O 2molecule [16–19]refers to light absorbed by photosynthetic unit rather than to light incident at the front window of the photo-bioreactor.Y et,the difference of the photobioreactor quantum requirement between the two experimental days indicates potential to optimize the suspension density and growth parameters and further improve the photobioreactor performance.Among the easiest measures was to place at the front bioreactor window a white re?ecting surface that returns most of the transmitted photons back into the suspension.However,the limit 8–10photons/O 2molecule is hardly feasible in biotechnological setting where other essential optimization factors such as bioreactor cost and harvesting cost must be considered.
Acknowledgements
LN and JC
ˇwere supported by grants A V0Z60870520(Czech Academy of Sciences)and by GAC
ˇR 206/05/0894and 206/09/1284(Grant Agency of the Czech Republic)and through the FUNCDYN Programme of the European Science Foundation and European Commission,Contract no.ERAS-CT-2003-980409.IS
ˇwas supported by grant GAC ˇR 206/08/1683and Institutional Research Concepts A V0Z50200510and
MSM6007665808.MT was supported by Photon Systems Instruments,Ltd.The authors appreciate critical reading and
multiple suggestions for improvements by Jana Sto
¨ckel of Washington University in St.Louis.Our technicians Z
ˇaneta Princova
′a Zuzana Ryba ′rova ′contributed by keeping our cultures clean and alive through many months of the experiments.
Con?ict of interest
The authors have declared no con?ict of interest.
References
[1]J.A.Raven,The Role of Marine Biota in the Evolution of
Terrestrial Biota:Gases and Genes,Biogeochemistry 1997,39(2),139–164.DOI:10.1023/A:1005855528289.
[2]J.Hill,E.Nelson,D.Tilman,S.Polasky,D.Tiffany,Envir-onmental,Economic,and Energetic Costs and Bene?ts of Biodiesel and Ethanol Biofuels,Proceedings of the National Academy of Sciences 2006,103(30),11206–11210.DOI:10.1073/pnas.0604600103.
[3]Y.Chisti,Biodiesel from Microalgae Beats Bioethanol,
Trends Biotechnol .2008,26(3),126–131.DOI:10.1016/j.tibtech.2007.12.002.
[4]J.H.A.Nugent,S.Purton,M.C.W.Evans,Photosynthesis in
Algae ,1st ed,Advances in Photosynthesis and Respiration,Vol.14,Springer,Dordrecht 2003,133–156.
[5]https://www.doczj.com/doc/6e10224890.html,rkum,Photosynthesis in Algae ,1st ed,Advances in
Photosynthesis and Respiration,Vol.14,Springer,Dordrecht 2003,277–304.
[6]L.Nedbal,M.Kobl?
′z ˇek,Chlorophylls and Bacteriochlorophylls:Biochemistry,Biophysics,Functions and Applications ,1st ed,Advances in Photosynthesis and Respiration,Vol.25,Springer,Dordrecht 2006,507–519.
[7]L.Nedbal,M.Trt?
′lek,J.C ˇerveny ′,O.Koma ′rek,H.B.Pakrasi,A Photobioreactor System for Precision Cultivation of Photoautotrophic Microorganisms and for High-Content Analysis of Suspension Dynamics,Biotechnol.Bioeng .2008,100(5),902–910.DOI:10.1002/bit.21833.
[8]B.Genty,J.M.Briantias,N.R.Baker,The Relationship
between the Quantum Yield of Photosynthetic Electron Transport and Quenching of Chlorophyll Fluorescence,Biochim.Biophys.Acta 1989,990(1),87–92.
[9]I.Heinze,H.Dau,H.Senger,The Relation between the
Photochemical Yield and Variable Fluorescence of Photo-system Ii in the Green Alga Scenedesmus Obliquus ,Journal of Photochemistry and Photobiology B:Biology 1996,32(1–2),89–95.DOI:10.1016/1011-1344(95)07200-4.
[10]Proceedings of the Fifth International Congress on Photo-synthesis (Ed G.Akoyunoglou),Balaban International Science Services,Philadelphia 1980,481–490.
[11]R.E.Bird,C.Riordan,Simple Solar Spectral Model for
Direct and Diffuse Irradiance on Horizontal and Tilted Planes at the Earth’s Surface for Cloudless Atmospheres,J.Appl.Meteorol .1986,25(1),87–97.DOI:10.1175/1520-0450(1986)025o 0087:SSSMFD 42.0.CO;2.
20
40
60
80
100
-70
-50-30-10
1030500
122436
48
Time, h
I r r a d i a n c e , μm o l (p h o t o n s ).m -2.s -1
R a t e o f ΔO 2,μm o l (O 2).m m o l (C h l )-1.s -1
R a t e o f ΔC O 2, μm o l (C O 2).m m o l (C h l )-1.s -1
Figure 5.The rates of photosynthetic and respiratory oxygen and carbon dioxide exchange as obtained in short time measure-ments performed in hourly intervals.The curve P (closed circles)shows the rate of photosynthesis in response to the actual growth irradiance at the given time,curve P sat (open circles)the rate of photosynthesis under saturating irradiance and curve R (closed squares)show the rate of respiration.All data was recorded by the oxygen electrode with aeration switched off.The details of the measurement are shown in Fig.3.The curve D CO 2(closed triangles)follows rates of CO 2consumption calculated from the difference of CO 2concentration measured simulta-neously by infrared analyzers at the input and output of the bioreactor.
252
J.C
ˇerveny ′et al.Eng.Life Sci.2009,9,No.3,247–253
[12]L.N.M.Duysens,H.E.Sweers,Studies on Microalgae and
Photosynthetic Bacteria,1st ed,University of Tokyo Press, Tokyo1963,353–372.
[13]P.Horton,A.V.Ruban,R.G.Walters,Regulation of Light
Harvesting in Green Plants,Annu.Rev.Plant Physiol.Plant Mol.Biol.1996,47(1),655–684.DOI:doi:10.1146/annur-ev.arplant.47.1.655.
[14]J.Thielmann,N.E.T olbert,A.Goyal,H.Senger,T wo Systems for
Concentrating CO2and Bicarbonate During Photosynthesis by Scenedesmus,Plant Physiol.1990,92(3),622–629.
[15]K.Palmqvist,S.Sjoberg,G.Samuelsson,Induction of Inor-
ganic Carbon Accumulation in the Unicellular Green Algae Scenedesmus Obliquus and Chlamydomonas Reinhardtii,Plant Physiol.1988,87(2),437–442.[16]R.Emerson,The Quantum Yield of Photosynthesis,Annu.
Rev.Plant Physiol.Plant Mol.Biol.1958,9,1–24.
[17]B.A.Osborne,R.J.Geider,Measurements of Minimum
Photon Requirements,Photosynth.Res.1988,16(3),291–292.
DOI:10.1007/BF00028847.
[18]D.J.Tennessen,R.J.Bula,T. D.Sharkey,Ef?ciency of
Photosynthesis in Continuous and Pulsed Light Emitting Diode Irradiation,Photosynth.Res.1995,44(3),261–269.
DOI:10.1007/BF00048599.
[19]Govindjee,On the Requirement of Minimum Number of
Four V ersus Eight Quanta of Light for the Evolution of One Molecule of Oxygen in Photosynthesis:A Historical Note,Photosynth.Res.1999,59(2–3),249–254.DOI:10.1023/ A:1006122501487.
Eng.Life Sci.2009,9,No.3,247–253High-performance photobioreactor253
3 釜式反应器 3.1在等温间歇反应器中进行乙酸乙酯皂化反应: 325325+→+CH COOC H NaOH CH COONa C H OH 该反应对乙酸乙酯及氢氧化钠均为一级。反应开始时乙酸乙酯及氢氧化钠的浓度均为0.02mol/l ,反应速率常数等于5.6l/mol.min 。要求最终转化率达到95%。试问: (1) (1) 当反应器的反应体积为1m 3时,需要多长的反应时间? (2) (2) 若反应器的反应体积为2m 3,,所需的反应时间又是多少? 解:(1)002220 00001()(1)110.95169.6min(2.83) 5.60.0210.95 ===?---= ?=?-??Af Af X X A A A A A A A A A A A dX dX X t C C R k C X kC X h (2) 因为间歇反应器的反应时间与反应器的大小无关,所以反应时间仍为2.83h 。 3.2拟在等温间歇反应器中进行氯乙醇的皂化反应: 223222+→++CH ClCH OH NaHCO CH OHCH OH NaCl CO 以生产乙二醇,产量为20㎏/h ,使用15%(重量)的NaHCO 3水溶液及30%(重量)的氯乙醇水溶液作原料,反应器装料中氯乙醇和碳酸氢钠的摩尔比为1:1,混合液的比重为1.02。该反应对氯乙醇和碳酸氢钠均为一级,在反应温度下反应速率常数等于5.2l/mol.h ,要求转化率达到95%。 (1) (1) 若辅助时间为0.5h ,试计算反应器的有效体积; (2) (2) 若装填系数取0.75,试计算反应器的实际体积。 解:氯乙醇,碳酸氢钠,和乙二醇的分子量分别为80.5,84 和 62kg/kmol,每小时产乙二醇:20/62=0.3226 kmol/h 每小时需氯乙醇:0.326680.5 91.11/0.9530%?=?kg h 每小时需碳酸氢钠:0.326684 190.2/0.9515%?=?kg h 原料体积流量:091.11190.2275.8/1.02+==Q l h 氯乙醇初始浓度:00.32661000 1.231/0.95275.8?==?A C mol l 反应时间: 02000110.95 2.968(1) 5.2 1.23110.95===?=-?-??Af Af X X A A A A B A A dX dX t C h kC C kC X 反应体积:0(')275.8(2.9680.5)956.5=+=?+=r V Q t t l (2) (2) 反应器的实际体积:956.512750.75= ==r V V l f 3.3丙酸钠与盐酸的反应: 2525+?+C H COONa HCl C H COOH NaCl 为二级可逆反应(对丙酸钠和盐酸均为一级),在实验室中用间歇反应器于50℃等温下进行该 反应的实验。反应开始时两反应物的摩尔比为1,为了确定反应进行的程度,在不同的反应时间下取出10ml 反应液用0.515N 的NaOH 溶液滴定,以确定未反应盐酸浓度。不同反应时间下,NaOH 溶液用量如下表所示:
化工原理习题及答案釜式反应器
3 釜式反应器 3.1在等温间歇反应器中进行乙酸乙酯皂化反应: 325325+→+CH COOC H NaOH CH COONa C H OH 该反应对乙酸乙酯及氢氧化钠均为一级。反应开始时乙酸乙酯及氢氧化钠的浓度均为0.02mol/l ,反应速率常数等于5.6l/mol.min 。要求最终转化率达到95%。试问: (1) (1) 当反应器的反应体积为1m 3时,需要多长的反应时间? (2) (2) 若反应器的反应体积为2m 3, ,所需的反应时间又是多少? 解:(1)00222000001()(1) 110.95 169.6min(2.83) 5.60.0210.95===?---= ?=?-??Af Af X X A A A A A A A A A A A dX dX X t C C R k C X kC X h (2) 因为间歇反应器的反应时间与反应器的大小无关,所以反应时间仍为2.83h 。 3.2拟在等温间歇反应器中进行氯乙醇的皂化反应: 223222+→++CH ClCH OH NaHCO CH OHCH OH NaCl CO 以生产乙二醇,产量为20㎏/h ,使用15%(重量)的NaHCO 3水溶液及30%(重量)的氯乙醇水溶液作原料,反应器装料中氯乙醇和碳酸氢钠的摩尔比为1:1,混合液的比重为1.02。该反应对氯乙醇和碳酸氢钠均为一级,在反应温度下反应速率常数等于 5.2l/mol.h ,要求转化率达到95%。 (1) (1) 若辅助时间为0.5h ,试计算反应器的有效体积; (2) (2) 若装填系数取0.75,试计算反应器的实际体积。 解:氯乙醇,碳酸氢钠,和乙二醇的分子量分别为80.5,84 和 62kg/kmol,每小时产乙二醇:20/62=0.3226 kmol/h 每小时需氯乙醇:0.326680.5 91.11/0.9530%?=?kg h 每小时需碳酸氢钠:0.326684 190.2/0.9515%?=?kg h 原料体积流量:091.11190.2275.8/1.02+==Q l h 氯乙醇初始浓度:00.32661000 1.231/0.95275.8?==?A C mol l 反应时间:
釜式反应器 Tank Reactor 釜式反应器的学习任务 1、了解釜式反应器的基本结构、特点及工业应用。 2、掌握各类釜式反应器的计算。 3、了解釜式反应器的热稳定性。 4、掌握釜式反应器的操作技能。 项目一釜式反应器的结构 釜式反应器又称: 槽型反应器或锅式反应器一种低高径比的圆筒形反应器,用于实现液相单相反应过程和液液、气液、液固、气液固等多相反应过程。 反应器内常设有搅拌(机械搅拌、气流搅拌等)装置。在高径比较大时,可用多层搅拌桨叶。在反应过程中物料需加热或冷却时,可在反应器壁处设置夹套,或在器内设置换热面,也可通过外循环进行换热。 操作时温度、浓度容易控制,产品质量均一。在化工生产中,既可适用于间歇操作过程,又可用于连续操作过程;可单釜操作,也可多釜串联使用;但若应用在需要较高转化率的工艺要求时,有需要较大容积的缺点。通常在操作条件比较缓和的情况下,如常压、温度较低且低于物料沸点时,釜式反应器的应用最为普遍。 一、釜式反应器基本结构 釜式反应器的基本结构主要包括: 反应器壳体、搅拌装置、密封装置、换热装置、传动装置。 壳体结构:一般为碳钢材料,筒体皆为圆筒型。釜式反应器壳体部分的结构包括筒体、底、盖(或称封头)、手孔或人孔、视镜、安全装置及各种工艺接管口等。封头;反应釜的顶盖,为了满足拆卸方便以及维护检修。 平面形:适用于常压或压力不高时; 碟形:应用较广。 球形:适用于高压场合; 椭圆形:应用较广。 锥形:适用于反应后物料需要分层处理的场合。 手孔、人孔:为了检查内部空间以及安装和拆卸设备内部构件。 视镜: 观察设备内部物料的反应情况,也作液面指示用。 工艺接管: 用于进、出物料及安装温度、压力的测定装置。
一概述 1.1醋酸乙酯生产工艺的现状和特点 醋酸乙酯分子式C4H8O2,又名:乙酸乙酯,英文名称:acetic ester;ethyl acetate,简称EA。醋酸乙酯是醋酸工业重要的下游产品,也是一种重要的绿色有机溶剂,溶解能力及快干性能均属上乘,主要用做涂料(油漆和瓷漆)、油墨和粘合剂配方中的活性溶剂,也可用做制药和有机化学合成的工艺溶剂。 EA可用于制造乙酰胺、乙酰醋酸酯、甲基庚烯酮等,并在香料、油漆、医药、火胶棉、硝化纤维、人造革、染料等行业中广泛应用,还可用作萃取剂和脱水剂,亦可用于食品工业。还可用于硝酸纤维、乙基纤维、氯化橡胶和乙烯树脂、乙酸纤维素脂、纤维素乙酸丁酯和合成橡胶等的生产过程;也可用于复印机的液体硝基纤维墨水。在纺织工业中用作清洗剂;在食品工业中作为特殊改性酒精的香味萃取剂;在香料工业中是重要的香料添加剂,可作为调香剂的组份。同时醋酸乙酯本身也是制造染料、香料和药物的原料。在高级油墨、油漆及制鞋用胶生产过程中,对醋酸乙酯的质量要求较高。 当前全球醋酸乙酯的市场状况是:欧美等发达国家醋酸乙酯的市场发展比较成熟,产量和消费量的增长都比较缓慢,亚洲尤其是中国成为醋酸乙酯生产和消费增长最为快速的国家和地区。由于中国国内快速发展的市场,尤其是建筑、汽车等行业的强劲发展,推动国内醋酸乙酯的需求,但是同时,醋酸乙酯生产能力的增长也非常快速,市场未来发展充满了机遇与挑战。 醋酸乙酯消费持续增长的主要原因是它取代了污染空气环境的用于表面涂层和油墨
配方的甲乙酮和甲基异丁基酮。醋酸乙酯作为优良溶剂,正逐步替代一些低档溶剂,发展潜力较大。 受消费拉动,20世纪90年代以来,我国醋酸乙酯生产发展迅速。“八五”期间,产量年均增长率为13.0%;1995-2000年,年均增长率达到20.5%;2000-2002年,年均增长率高达30.5%。目前我国有醋酸乙酯生产企业30多家,年产能力为57.2万吨。其中,万吨级以上规模的企业有14家,年产能力为47万吨。2001年5月,山东金沂蒙集团将醋酸乙酯产能增至8万吨/年,2003年6月又扩能至16万吨/年;2001年,上海石化采用黑龙江省石化研究院技术,建成2万吨/年乙醛缩合法生产醋酸乙酯装置;2002年5月,中英合资BP--扬子江乙酰化工有限公司8万吨/年醋酸乙酯装置投产,采用BP 切换式醋酸乙酯技术生产醋酸乙酯和醋酸丁酯,工艺技术国内领先;2001年,江西南昌赣江溶剂厂将醋酸乙酯年产能力从2万吨扩至8万吨;2003年,江门谦信化工发展有限公司将产能从1.5万吨/年扩至3.5万吨/年。近2-3年内,国内新增醋酸乙酯年产能力达31万吨。 虽然我国醋酸乙酯市场仍有潜力,但由于扩能速度太快,近两年已出现开工率不足的现象。据了解,2002年国内装置平均开工率约77%,预计2003年平均开工率将为66%。目前市场已经饱和,产品价格呈走软趋势,利润已渐微薄。而在建和拟建醋酸乙酯项目尚有20万吨/年产能。如果这些项目到2005年如期投产,我国醋酸乙酯供应将平衡有余。随着国内新增能力陆续投产,近两年我国醋酸乙酯进口量有所下降。2001年进口5.35万吨,2002年进口4.8万吨,2003年上半年进口2.45万吨。 醋酸乙酯制备方法主要有醋酸酯化法、乙醛缩合法、乙醇脱氢法和乙烯加成法。 用醋酸和乙醇酯化制醋酸乙酯是开发较早,工艺成熟,且为目前主要采用的方法。反应在酸催化剂(如硫酸)存在下进行液相酯化,分为间歇法和连续法。间歇法使用釜式反
反应器结构及工作原理图解 小7:这里给大家介绍一下常用的反应器设备,主要有以下类型:①管式反应器。由长径比较大的空管或填充管构成,可用于实现气相反应和液相反应。②釜式反应器。由长径比较小的圆筒形容器构成,常装有机械搅拌或气流搅拌装置,可用于液相单相反应过程和液液相、气液相、气液固相等多相反应过程。用于气液相反应过程的称为鼓泡搅拌釜(见鼓泡反应器);用于气液固相反应过程的称为搅拌釜式浆态反应器。③有固体颗粒床层的反应器。气体或(和)液体通过固定的或运动的固体颗粒床层以实现多相反应过程,包括固定床反应器、流化床反应器、移动床反应器、涓流床反应器等。④塔式反应器。用于实现气液相或液液相反应过程的塔式设备,包括填充塔、板式塔、鼓泡塔等(见彩图)。 一、管式反应器 一种呈管状、长径比很大的连续操作反应器。这种反应器可以很长,如丙烯二聚的反应器管长以公里计。反应器的结构可以是单管,也可以是多管并联;可以是空管,如管式裂解炉,也可以是在管内填充颗粒状催化剂的填充管,以进行多相催化反应,如列管式固定床反应器。通常,反应物流处于湍流状态时,空管的长径比大于50;填充段长与粒径之比大于100(气体)或200(液体),物料的流动可近似地视为平推流。
分类: 1、水平管式反应器 由无缝钢管与U形管连接而成。这种结构易于加工制造和检修。高压反应管道的连接采用标准槽对焊钢法兰,可承受1600-10000kPa压力。如用透镜面钢法兰,承受压力可达10000-20000kPa。
2、立管式反应器 立管式反应器被应用于液相氨化反应、液相加氢反应、液相氧化反应等工艺中。
3、盘管式反应器 将管式反应器做成盘管的形式,设备紧凑,节省空间。但检修和清刷管道比较困难。
3-1 在反应体积为3 1m 的间歇操作釜式反应器中,环氧丙烷的甲醇溶液与水反应生成丙二醇 32232COHCHOHCH H →+O H COCHCH H 该反应对环氧丙烷为一级,反应温度下的速率常数为0.981 -h ,原料液中环 氧丙烷的浓度为 2.1kmol/3 m ,环氧丙烷的最终转化率为90%。若辅助时间为0.65h ,一天24h 连续生产,试求丙二醇的日产量为多少? 解 3223 2COHCHOHCH H →+O H COCHCH H ( A ) ( B ) 一级反应 h x k C C k t Af Af A 35.29 .011ln 98.0111ln 1ln 10=-=-== h m h m t t V v /3 1)65.035.2(13 300=+=+= 丙二醇日产量=Af A x C v 0024 =天/12.159.01.23 1 24kmol =??? kmol k /g 76M B = 丙二醇日产量天/kg 2.111492.11576Q =?= 3-2一个含有A 和B 液体)/0.04m ol c /10.0c (B00 L L mol A ==、 以体积流量2L/min 流入容积V R =10L 的全混流反应器,物料在最佳的条件下进行反应A →2B+C 。已知由反应器流出的物料中含有A 、B 和C , L mol c Af /04.0=。试求:在反应器条件下,A 、B 和C 的反应速率? 解 空时 min 5min /2100===L L v V R τ
min 5/)04.01.0(00L mol C C r r C C Af A Af Af Af A -= -= =-τ τ min /012.0?=L mol min)/(024.02?==L mol r r Af Bf min) /(012.0?==L mol r r Af Cf 3-3 一个液相反应: A+B →R+S 其中,m in) /(71 ?=mol L k ,m in)/(32 ?=mol L k 。 反应是在一个容积为120L 的稳态全混流反应器中进行的,两条加料线,一个保持2.8mol/L 反应物A 的加料浓度,另一个保持1.6mol/L 反应物B 的加料浓度,两条线分别以等体积速率进入反应器,要求指定组分转化率为75%。求每条线的加料流量?假设反应器密度为常数。 解 S R 1k 2 k +??←+? →?B A 因B 的浓度低,所以为指定组分,两条线混合后两组份的浓度各降一半, 因此,有: %751x 0 0=- =-= B Bf B Bf B Bf c c c c c L mol c Bf /2.0= L mol X C C c Bf B A Af /8.075.08.04.100=?-=-= 因此, S R 1k 2 k +??←+? →?B A 出口 初始 1.4 0.8 0 0 L mol c Af /8.0= 反应掉 0.6 0.6 生成 0.6 0.6 L mol c Bf /2.0=
第三章釜式反应器 重点掌握: ?等温间歇釜式反应器的计算(单一反应、平行与连串反应)。 ?连续釜式反应器的计算。 ?空时和空速的概念及其在反应器设计计算中的应用。 ?连续釜式反应器的串联和并联。 ?釜式反应器中平行与连串反应选择性的分析,连接和加料方式的选择。 ?连续釜式反应器的热量衡算式的建立与应用。 深入理解: ?变温间歇釜式反应器的计算。 广泛了解: ?串联釜式反应器最佳体积的求取方法。 ?连续釜式反应器的多定态分析与计算。 ?产生多定态点的原因,着火点与熄火点的概念。 釜式反应器 反应器的分析与设计是《反应工程》的重要组成部分和主要任务。反应器设计的任务就是确定进行化学反应的最佳操作条件和完成规定的生产任务所需的反应器体积和主要尺寸。 对于反应器的分析计算需要建立适当的数学模型,本章将针对两类理想的反应器模型(间歇釜式反应器模型和全混流反应器模型)进行讨论和分析,考察反应器性能与各种因素的关系,反应器性能的优化设计问题等。具体内容包括: 等温间歇釜式反应器的计算(单一反应) 等温间歇釜式反应器的计算(复合反应) 全混流反应器的设计 全混流反应器的串联与并联 釜式反应器中复合反应的收率与选择性 变温间歇釜式反应器的计算 全混流反应器的定态操作与分析
第一节釜式反应器的物料衡算方程 反应器设计的基本内容: 选择合适的反应器类型 确定最佳操作条件 计算完成规定的生产任务所需的反应器体积(尺寸) 最终的目标是经济效益最大(实际上不应该仅仅针对反应系统,应该包括整个过程) 基本方程: 物料衡算--描述浓度的变化规律 能量衡算--描述温度的变化规律 动量衡算--描述压力的变化情况 注意: 首先要选择控制体 如果反应器内各处浓度均一,衡算的控制体选择整个反应器。如果反应区内存在两个或两个以上相态,反应体积内各点的反应物料组成未必相同,这时只能选择微元体积作为控制体。 对于复杂反应,方程数大大增多 第二节等温间歇釜式反应器的计算(单一反应) 特点: 分批装、卸; 适用于不同品种和规格的产品的生产,广泛用于医药、试剂、助剂等生产。 整个操作时间=反应时间+辅助时间(装+卸+清洗)
化学反应器分类及其特点 This model paper was revised by the Standardization Office on December 10, 2020
化学反应器的分类及特点 秦财德 (中南大学、化学化工学院、化工1002班) 摘要: 反应器的应用始于古代,制造陶器的窑炉就是一种原始的反应器。近代工业中的反应器形式多样。化学反应器,用于实现液相单相反应过程和液液、气液、液固、气液固等多相反应过程。器内常设有搅拌(机械搅拌、气流搅拌等)装置。本文主要介绍化学反应器的分类和特点 关键词:化学反应器特点典型反应 现在的化工反应器在向高精端方向发展,在化工反应中处于主要地位,化学反应器是化学反应的载体,是化工研究、生产的基础,是决定化学反应好坏的重要因素之一,因此反应器的设计、选型是十分重要的。反应器的种类很多,设计和选型很重要,座椅应该按照实际情况来设计制造。 一.釜式反应器 (一)反应器的简介 一种低高径比的圆筒形反应器,用于实现液相单相反应过程和液液、气液、液固、气液固等多相反应过程。器内常设有搅拌(机械搅拌、气流搅拌等)装置。在高径比较大时,可用多层搅拌桨叶。在反应过程中物料需加热或冷却时,可在反应器壁处设置夹套,或在器内设置换热面,也可通过外循环进行换热。 (二)反应器的特点
反应器中物料浓度和温度处处相等,并且等于反应器出口物料的浓度和温度。物料质点在反应器内停留时间有长有短,存在不同停留时间物料的混合,即返混程度最大。反应器内物料所有参数,如浓度、温度等都不随时间变化,从而不存在时间这个自变量。 优点:适用范围广泛,投资少,投产容易,可以方便地改变反应内容。 缺点:换热面积小,反应温度不易控制,停留时间不一致。绝大多数用于有液相参与的反应,如:液液、液固、气液、气液固反应等。 (三)典型反应: 在等温间歇反应器中进行乙酸乙酯皂化反应: CH 3COOC 2 H 5 +NaOH CH 3 COONa+ C 2 H 5 OH 二.管式反应器 (一)反应器的简介 管式反应器一种呈管状、长径比很大的连续操作反应器。这种反应器可以很长,如丙烯二聚的反应器管长以公里计。反应器的结构可以是单管,也可以是多管并联;可以是空管,如管式裂解炉,也可以是在管内填充颗粒状催化剂的填充管,以进行多相催化反应,如列管式固定床反应器。通常,反应物流处于湍流状态时,空管的长径比大于50;填充段长与粒径之比大于100(气体)或200(液体),物料的流动可近似地视为平推流.(二)反应器的特点 (1)由于反应物的分子在反应器内停留时间相等,所以在反应器内任何一点上的反应物浓度和化学反应速度都不随时间而变化,只随管长变化。
釜式反应器的维护(标准版) Safety management is an important part of enterprise production management. The object is the state management and control of all people, objects and environments in production. ( 安全管理 ) 单位:______________________ 姓名:______________________ 日期:______________________ 编号:AQ-SN-0704
釜式反应器的维护(标准版) 1、运行正常,效能良好: a.设备生产能力能达到设计规定的90%以上; b.带压釜需取得压力容器使用许可证: c.机械传动无杂音,搅拌器与设备内加热蛇管,压料管内部件应无碰撞并按规定留有间隙; d.设备运转正常,无异常振动; e.减速机温度正常,轴承温度应符合规定; f.润滑良好,油质符合规定,油位正常; g.主轴密封及减速机,管线、管件、阀门,人(手)孔、法兰等无泄漏。 2、内部机件无损坏,质量符合要求:
a.釜体,轴封、搅拌器、内外蛇管等主要机件材质选用符合图纸要求; b.釜体,轴封、搅拌器、内外蛇管等主要机件安装配合,磨损、腐蚀极限应符合检修规程规定; c.釜内衬里不渗漏,不鼓包,内蛇管装置紧固可靠。 3、主体整洁,零附件齐全好用: a.主体及附件整洁,基础坚固,保温油漆完整美观; b.减压阀、安全阀,疏水器、控制阀、自控仪表、通风、防爆、安全防护等设施齐全灵敏好用,并应定期检查校验; c.管件、管线、阀门、支架等安装合理,横平竖直,涂色明显; d.所有螺栓均应满扣、齐整、紧固 XXX图文设计 本文档文字均可以自由修改
第三章 理想反应器 1.理想反应器是指_______、_______。[理想混合(完全混合)反应器、平推流(活塞流或挤出流)反应器] 2.具有良好搅拌装置的釜式反应器按_______反应器处理,而管径小,管子较长和流速较大的管式反应器按_______反应器处理。(理想混合反应器、平推流) 3.分批式完全混合反应器操作的优化分析是以_______、_______为目标进行优化的。(平均生产速率R Y 最大、生产经费最低) 4.全混流反应器的空时τ是_______与_______之比。(反应器的有效容积、进料流体的容积流速) 5.全混流反应器的容积效率η为_______与_______之比。(反应时间t 、空时τ) 6.全混流反应器的放热速率G Q =______________。(p r A C v H r V ρ0) )((?--) 7.全混流反应器的移热速率r Q =______________。( )()1(000P m P c v U A T T c v UA T ρρ+-+ ) 8.全混流反应器的定常态操作点的判据为_______。(r G Q Q =) 9.全混流反应器稳定的定常态操作点的判据为_______、_______。(r G Q Q =、 dT dQ dT dQ G r ?) 10.全混流反应器的返混_______。(最大) 11.平推流反应器的返混为_______。(零) 12.对于恒容的平推流管式反应器_______、_______、_______一致。(平均停留时间、反应时间、空时) 13.对于恒容的_______管式反应器平均停留时间、反应时间、空时一致。(平推流) 14.如果将平推流反应器出口的产物部分的返回到入口处与原始物料混合,这类反应器为_______的平推流反应器。(循环操作) 15.对于循环操作的平推流反应器,当循环比β→0时为_______反应器,而当β→∞时则相当于_______反应器。(平推流、全混流) 16. 对于循环操作的平推流反应器,当循环比β→0时反应器内返混为_______,而当β→∞时则反应器内返混为_______。(零、最大) 17. 对于绝热操作的放热反应,最合适的反应器类型为_______。(全混流串平推流) 18. 对于反应级数n <0的反应,为降低反应器容积,应选用_______反应器为宜。(全混流) 19. 对于反应级数n >0的反应,为降低反应器容积,应选用_______反应器为宜。(平推流) 20. 对于自催化反应,最合适的反应器为_______。(全混流串平推流) 21.对于可逆的放热反应,使反应速率最大的反应温度 = opt T _______。 ( )()1(ln ) (002'00 1012A A R A A C C E k C E k R E E χχ+---) 22. 对于可逆的放热反应,达到化学反应平衡时的温度 =e T _______。