Oil Spill Detection in Northern European Waters
- 格式:pdf
- 大小:3.49 MB
- 文档页数:12
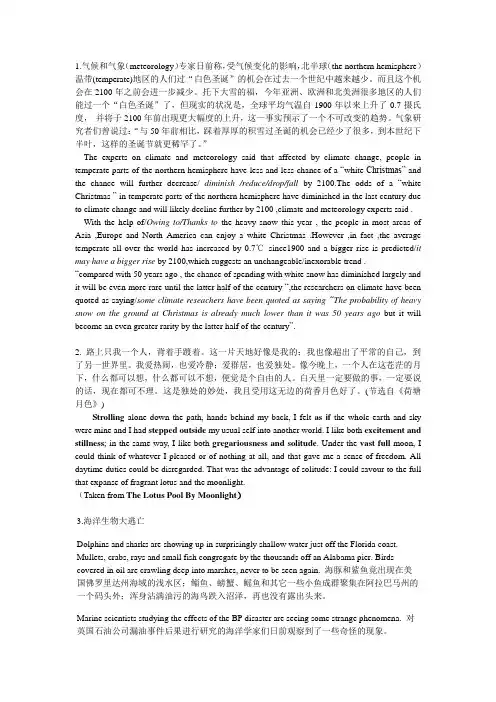
1.气候和气象(meteorology)专家日前称,受气候变化的影响,北半球(the northern hemisphere)温带(temperate)地区的人们过“白色圣诞”的机会在过去一个世纪中越来越少。
而且这个机会在2100年之前会进一步减少。
托下大雪的福,今年亚洲、欧洲和北美洲很多地区的人们能过一个“白色圣诞”了,但现实的状况是,全球平均气温自1900年以来上升了0.7摄氏度,并将于2100年前出现更大幅度的上升,这一事实预示了一个不可改变的趋势。
气象研究者们曾说过:“与50年前相比,踩着厚厚的积雪过圣诞的机会已经少了很多,到本世纪下半叶,这样的圣诞节就更稀罕了。
”The experts on climate and meteorology said that affected by climate change, people in temperate parts of the northern hemisphere have less and less chance of a “white Christmas” and the chance will further decrease/ diminish /reduce/drop/fall by 2100.The odds of a “white Christmas ” in temperate parts of the northern hemisphere have diminished in the last century due to climate change and will likely decline further by 2100 ,climate and meteorology experts said . With the help of/Owing to/Thanks to the heavy snow this year , the people in most areas of Asia ,Europe and North America can enjoy a white Christmas .However ,in fact ,the average temperate all over the world has increased by 0.7℃since1900 and a bigger rise is predicted/it may have a bigger rise by 2100,which suggests an unchangeable/inexorable trend . “compared with 50 years ago , the chance of spending with white snow has diminished largely and it will be even more rare until the latter half of the century “,the researchers on climate have been quoted as saying/some climate reseachers have been quoted as saying “The probability of heavy snow on the ground at Christmas is already much lower than it was 50 years ago but it will become an even greater rarity by the latter half of the century”.2. 路上只我一个人,背着手踱着。
BBC新闻讲解附字幕:埃及法院裁定剥夺娶以色列妻子者国籍(2010-06-8)第一部分:听力文本BBC News with Kathy Clugston.An Irish-owned ship that was trying to break through the Israeli blockade of Gaza has beendivert ed to the Port of Ashdod.Israeli forces who boarded it about30kilometres off the coast said they faced no resistance.The ship,the Rachel Corrie,was supposed to have been the7th in the flotilla which was stormed by Israeli forces on Monday when at least nine activists were killed. It’s now being searched by the Israeli police.There's been no communication with any of the pro-Palestinian campaigners on board.Andrew North reports from Ashdod.Eleven activists including a former Nobel Peace Prize winner and nine crew are being questioned. It’s not yet clear what will happen to them,but the expectation is they will eventually be released. The Israeli government will be relieved that it was able to stop this latest effort to break its blockade of Gaza peacefully and its people are firmly behind it,but it’s looking increasingly isolated worldwide,with even its American ally saying the blockade of Gaza is unsustainable.The Supreme Administrative Court in Egypt has upheld a ruling that Egyptian men married to Israelis should be stripped of their citizenship.The case is being viewed as a sign of the negative feeling against Israel in Egypt,with which it has had a peace treaty for more than30years.From Cairo,Yolande Knell reports.The judge in the Supreme Administrative Court said that the interior ministry must give the cabinet details of all Egyptian men married to Jewish Israelis and Arab Israelis.Each file will be considered separately,but steps can be taken to remove their Egyptian nationality and that of their children.The lawyer who brought the case said the offspring of such marriages should not be allowed to perform military service.He added that his aim was to protect young Egyptians and national security.The US Coast Guard official leading the operation to contain the oil spill in the Gulf of Mexico says BP’s new operation is doing better than initial estimates.Admiral Thad Allen says at least a third of the oil leaking from the broken well has been captured in the past24hours.Madeleine Morris reports from New Orleans.Admiral Thad Allen says BP hopes to increase the amount it’s capturing over the next a few days, after the company has a better idea of the oil’s pressure and rate of flow.He had bad news though from Mississippi,Alabama and Florida-suddenly winds are pushing the slick towards the shoreline of those states whose beaches have untill now escaped the brunt of the oil.A new technique for treating breast cancer could in the future eliminate the need for weeks of radiotherapy.An international study trial published in the medical journal,the Lancet,suggests that giving one dose of radiotherapy inside the breast during surgery is just as effective at preventing cancer recurring as weeks of external radiotherapy.2000women across9countries took part in the study.World News from the BBC.Pakistan has announced it’s to increase defence spending by17%in the coming year,with analysts saying much of it will be used to combat Islamic militants.In his budget speech to parliament,the Finance Minister Abdul Hafeez Shaikh said the security forces who were prepared to lay down their lives should know they had the support of parliament.Defence spending will rise to more than$5billion a year from next month.The environmental organisation,the Blacksmith Institute,has warned that hundreds of Nigerian children could die from lead poisoning in the northern state of Zamfara,where residents have been digging illegally for gold.The warning comes a day after Nigerian officials confirmed that lead contamination had killed163people,mostly children,in the region this year.Jonny Hogg reports.The Blacksmith Institute has tested children in the affected villages.Its president,Richard Fuller, told the BBC that hundreds of them have such high levels of lead in their blood that they are likely to die in the near future.Health workers in the Nigerian government providing treatment to the victims and some parts of the affected villages have already been evacuate d.Mr Fuller says the poisoning occurred after women brought metal ore back to their houses to process into gold.A storm that's hit Oman over the past2days has killed16people and left4others missing. Tropical Cyclone Phet produced winds of more than150kilometres an hour,as well as heavy rain that knocked out power and communications in the east of the country and the capital Muscat.Oil exports also had to be suspended from Oman’s main port,but as the storm has since weakened, they’ve now resume d.The Italian tennis player Francesca Schiavone has become the first woman from her country to win a Grand Slam singles title.Schiavone won the French Open championship in Paris,defeating Samantha Stosur of Australia in straight sets6-4,7-6.BBC News.提示:文本转自普特听力论坛第二部分:参考翻译一艘试图冲破以色列对加沙地带封锁线的爱尔兰船只被转移到阿什杜德港口。
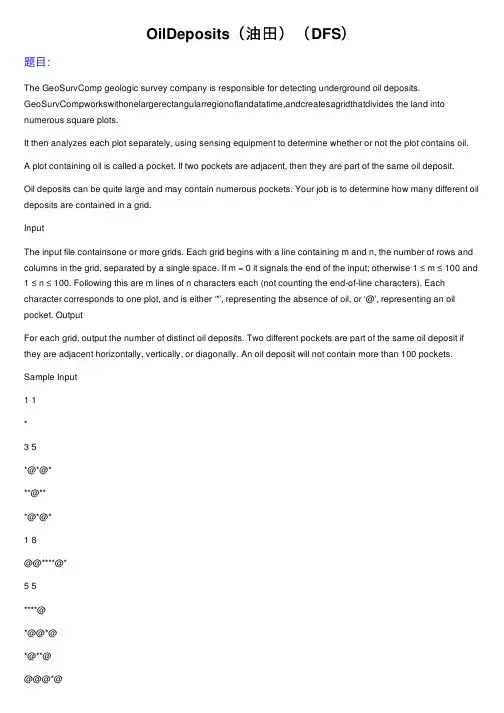
OilDeposits(油⽥)(DFS)题⽬:The GeoSurvComp geologic survey company is responsible for detecting underground oil deposits. GeoSurvCompworkswithonelargerectangularregionoflandatatime,andcreatesagridthatdivides the land into numerous square plots.It then analyzes each plot separately, using sensing equipment to determine whether or not the plot contains oil.A plot containing oil is called a pocket. If two pockets are adjacent, then they are part of the same oil deposit.Oil deposits can be quite large and may contain numerous pockets. Your job is to determine how many different oil deposits are contained in a grid.InputThe input file containsone or more grids. Each grid begins with a line containing m and n, the number of rows and columns in the grid, separated by a single space. If m = 0 it signals the end of the input; otherwise 1 ≤ m ≤ 100 and 1 ≤ n ≤ 100. Following this are m lines of n characters each (not counting the end-of-line characters). Each character corresponds to one plot, and is either ‘*’, representing the absence of oil, or ‘@’, representing an oil pocket. OutputFor each grid, output the number of distinct oil deposits. Two different pockets are part of the same oil deposit if they are adjacent horizontally, vertically, or diagonally. An oil deposit will not contain more than 100 pockets.Sample Input1 1*3 5*@*@***@***@*@*1 8@@****@*5 5****@*@@*@*@**@@@@*@@@**@0 0Sample Output0 1 2 2题意:和迷宫的输⼊差不多,‘*’是墙,‘@’是油⽥,以⼀个油⽥为中⼼,如果它的东南西北⼀个各个⾓落,⼀共⼋个⽅向也有油⽥的话,这些油⽥就算作⼀个油⽥。
⼀辆旅游巴⼠在菲律宾⾸都马尼拉遭遇劫持,车上8名⾹港游客遇难,其他7⼈正在医院接受治疗。
劫持者是⼀名携带突击步的被辞退的武装警察,在长达9⼩时的电视直播的围攻中被警⽅击毙。
⾹港特别⾏政区长官曾荫权(Donald Tsang)发表了讲话。
[注释] 1.disgruntle vt.使不⾼兴 2.tragic adj.悲剧的 例句:There was a tragic accident on the highway yesterday. 昨天公路上发⽣了⼀起很惨的事故。
3.textile n.纺织品,织物 例句:The designers have created a new textile. 设计⼈员创造了⼀种新织物。
4.rehabilitation n.复原 5.disclose v.揭露, 揭开 例句:She disclosed a secret. 她揭露了⼀个秘密。
He disclosed the box to us. 他揭开盒⼦给我们看。
6.grant vt.准许; 答应给予 例句:He refused to grant them long-term credits. 他拒绝给他们长期信贷。
7.injunction n.命令;强制令;禁⽌令 例句:The court has issued an injunction. 法院已发布⼀项强制令。
8.criticise vi.批评,吹⽑求疵,⾮难 9.renounce vt.声明放弃;宣布放弃 例句:Andrew renounced his claim to the property. 安德鲁放弃了财产的所有权。
10.fraudulent a.欺诈的,不正的,不诚实的 例句:The investigation has laid bare their fraudulent scheme. 这个调查把他们的骗局暴露⽆遗。
11.decompose vt.vi.腐烂 例句:Most animals decompose very quickly after death. ⼤多数动物死后很快腐烂。
挪威炼油厂将进行碳捕获与封存验证
章文(摘译)
【期刊名称】《石油炼制与化工》
【年(卷),期】2011(42)8
【摘要】虽然碳捕获技术尚未进行工业规模验证,但挪威政府、挪威国家石油公司(Statoil)、沙索公司和皇家荷兰壳牌公司组建的合资企业于2011年5月23日宣布,将通过在建的技术试验中心改变这一状况。
在Statoil位于卑尔根(Bergen)西北部的Mongstad炼油厂技术中心(TCM)的建设已完成70%的工作量。
【总页数】1页(P73-73)
【关键词】挪威国家石油公司;炼油厂;验证;捕获;封存;技术中心;碳;工业规模
【作者】章文(摘译)
【作者单位】
【正文语种】中文
【中图分类】TE68
【相关文献】
1.世界最大的碳捕获与封存设施在挪威落成 [J],
2.碳捕获与封存立法规制研究——以鄂尔多斯碳捕获与封存项目的实证调研为视角[J], 俞金香
3.碳中和背景下碳捕获与封存技术纳入碳市场的立法经验及中国启示 [J], 潘晓滨
4.挪威启动世界最大碳捕获与封存示范项目 [J],
5.挪威Mongstad炼油厂将实施碳捕集与封存 [J], 钱伯章
因版权原因,仅展示原文概要,查看原文内容请购买。
航海英语 57期1.I t is generally not allowed to clean up an oil spill by using_________.A.suction equipmentB. A boomC. Chemical agentsD. Skimmers2.In very high latitudes, the most practical chart projection is the ______.A.gnomonicB.azimuthalmbert conormalD.Mercator3.A steep barometric gradient indicates________.A.light windsB. calmsC.precipitationD. Strong winds4.The vessel was drifted off from her_______due to strong wind.A.directionB. TrendC. TrackD. Course5.I have steerage way. It is said that_________.A.I have the amount of movement forward which the ship needs to be steered properlyB. I am out of controlC. I am not making way through the waterD. I am underway6.A common class of wire rope used for mooring is the 6×19 class. What does the "6" represent?A.Factor of safetyB.Number of wires per strandC.Number of wires in the coreD.Number of strands per wire rope7._________cargo means to check all cargo loaded into or discharged from a vessel.A.WeighingB.HandlingC.TallyingD.Examining8.The proper way to correct a mistake in the logbook is to _________.pletely black out the entry, rewrite, and initial the correctionB.Draw several lines through the entry, rewrite, and initial the correctionC.Erase the entry and rewriteD.Draw one line through the entry, rewrite, and initial the correction9.A fire hose with a nozzle attached must be connected to each hydrant except when exposed to heavy_________.A.Fire-main system is not chargedB.Vessel is in portC.Fire hose might be damaged by cargo operationsD.Fire pumps are used for purposes other than supplying water to the fire main10.The principal purpose of adjustment of the magnetic compass is to eliminate _________.A.VariationB.Deviationpass errorD.Earth's magnetic force11.The radar control used to reduce sea return at close ranges is the _________.A.Fast time constantB.Pulse length controlC.Gain controlD.Sensitivity time control12.The chief officer_________told the stevedores to stow the cargo lot by lot.A.plainlypletelyC.AbsolutelyD.Moderately13.What is a correct reply to a pilot's request, 'How's your heading?'A.Passing 50B.checkedC.eased to 10 rudderD.steady14.Neap tides occur ____.A.at the start of spring, when the sun is nearly over the equatorB.when the sun and moon are at approximately 90 to each other, as seen from the earthC.when the Sun , Moon, and Earth are nearly in line, regardless of alignment orderD.only when the Sun and Moon are on the same sides of the Earth and are nearly in line15.A rope made of a combination of wire and fiber is known as _________.ng layB.Spring layC.IndependentD.Preformed16.In the Northern hemisphere, if your vessel is in a hurricane's navigable semicircle it should be positioned and the wind from_________.A.starboard bow and heave to until the hurricane has passed.B.Port bow, hold course and make as much speed as possible until the hurricane ha passed.C.Starboard quarter, hold course and make as much speed possible.D.port quarter, maintain course and make as much speed possible.17.Deviation changes with a change in _________.A.LongitudetitudeC.HeadingD.Sea condition18.In coastal waters GPS positions should be checked by _________?A.visual observationsB.Visual and radar observationsC.Radar observationsD.Buoys and seamarks19.Which statement about a tunnel bow thruster is TRUE?A.It will allow you to hold a position when the current is from asternB.It can be used to slow the ship in addition to backing down.C.It is fully effective at speeds up to about six knotsD.It provides lateral control without affecting headway20.Navigational charts are_________frequent changes, the important ones of which are promulgated by Ad.A.Published withbined withC.Relative toD.Subject to21.What is the worse case consideration for the hull girder at sea?A.When a wave length is two times of that of the shipB.When the wave crest are fore and aftC.When a wave length between the crests is approximately equal to the length of the ship.D.If the wave crest is amidships.22.A vessel underway and fishing shall keep out of the way of a _________.A.Vessel not under commandB.Vessel sailingC.Power-driven vessel underwayD.Vessel engaged on pilotage duty23.The most frequent cause of fires aboard tankers is due to ________.A.Leaking of cargo pump glandsB.Spontaneous combustionC.Tobacco smokingD.Improper gas freeing24.A vessel has a strong wind on the port beam. This has the same effect on stability as_________.A.Reducing the freeboardB.Weight that is off-center to starboardC.Increasing the trimD.Increasing the draft25.Chart legends printed in capital letters show that the associated landmark is _________.A.A radio transmitterB.A government facility or stationC.InconspicuousD.Conspicuous26.What is NOT a requirement for testing the line throwing appliance on a vessel?A.An entry about the test must be made in the official log bookB.A regular service line should be used when testingC.The appliance should be tested every three monthsD.A regular projectile should be used when testing27.You are overtaking a vessel at night and you see a yellow light showing above the sternlight of the _________.A.pushing ahead or towing alongsideB.Underway and dredgingC.Towing asternD.A pilot vessel28.If a void occurs in the cargo hold, it is better to _________to control the broken stowage.A.Fill it with small piecesB.Cover it with large piecesC.Brace it with dunnageD.Leave it as it is29.On cargo booms, preventers are________A.Auxiliary guysB.Steel bandsC.Extra fair leadsD.Stops30.Forecastle deck is located in the ship's________.A.PortsideB.Starboard sideC.Bow stemD.stern31.What is meant by the term TOPPING THE BOOM?A.Lowering the boomB.Swinging the boom athwarshipsC.Spotting the boom over the deckD.Raising the boom32.If you shorten the scope of anchor cable, your anchor's holding power________.A.DecreasesB.IncreasesC.Remains the sameD.Has no relation to the scope33.It is dangerous for vessels without the use of radar ________ the estuary.A.To approachB.To closeC.To proceedD.To get34.If the electronic chart is part of an ECDIS, it must display the minimum data required by IMO/IHO to include all of the following except_______.A.HydrographyB.Regulatory boundariesC.Tidal currentsD.Aids to navigation35.What is a lighted safe water mark fitted with to aid in its identification?A.Red and white retroreflective materialB.A red and white octagonC.Square or triangular topmarksD.A spherical36.The end of the joint with the exterior threads is called the ________.A.StemB.PinC.BoxD.Stand37.Risk of collision is considered to exist if ________ .A . There is any doubt that a risk of collision existsB . A special circumstance situation is apparentC . Four vessels are nearbyD . A vessel has a steady bearing at a constant range.38.What benefit is a weather bulletin to a mariner?A.It is of little benefit since the weather changes frequently and rapidly .B.It allows the mariner to make long term weather forecastsC.It provides a legal reason to cancel a projected voyageD.It gives the mariner time to prepare for weather changes39.To treat a person suffering from heat exhaustion, you should________.A.Put him in a tub of ice waterB.Give him sops of cool waterC.Administer artificial respirationD.Cover him with a light cloth40.Radar makes it possible and much safer for us to sail ________ .A.In the open seaB.In boisterous weatherC.In riversD.In dense fog41.For small angles of inclination, if the KG were equal to the KM, then the vessel would have ________.A.negative stabilityB.Maximum stabilityC.Neutral stabilityD.Positive stability42.Which action should you take after sending a false distress alert on VHF?A.Make a voice announcement to cancel the alert on CH16B.Make a voice announcement to cancel the alert on CH22AC.Send a DSC cancellation message on CH70D.Make a voice announcement to cancel the alert on CH1343.What is the correct speed input to an ARPA used for traffic surveillance?A.Speed from GPSB.Speed from DopplerC.Ground speedD.Speed through water44. A vessel is ___ when she is not at anchor, made fast to the shore, or aground.A.dead in the waterB.making wayC.a power driven vesselD.underway45.Damage to cargo caused by fumes or vapors from liquids, gases, or solids is known as ___.A.vaporizationB.taintingC.oxidationD.contamination46.A continuous sounding of a fog-signal apparatus indicates ___.A.the vessel is in distressB.the vessel has completed loading dangerous cargoC.the vessel is anchoredD.it is safe to pass47.In order to pay out or slack a mooring line which is under strain, you should ___.A.surge the lineB.slip the lineC.stopper the lineD.sluice the line48.According to SOLAS the breathing apparatus onboard shall have sufficient capacity for how manyminutes?A.30B.20C.45D.6049.Many of the soundings shown on the chart are derived from ___. Under reliance should not beplaced ___.A.correct and often very good surveysB.inadequate and often very old surveysC.adequate and present surveysplete and often very poor surveys50.you are on watch while entering port and the pilot has the conn. The pilot gives a steeringcommand. You should immediately ___.A.ask the pilot to repeat the command since the helmsman failed to hear it completelyB.repeat the pilot’s command and ensure that the helmsman repeats it completelyC.ignore the helmsman’s response as long as it was close to what the pilot orderedD.observe the helmsman’s wheel action to be sure that it complies with the pilot’s command51.The productivity of working shifts can be improves through a decrease of ___.A.gangsB.working hoursC.idle timeD.weight per set52.When a buoy is in position only during a certain period of the year, where may the dateswhen the buoy is in position be found?______A.Light listB.Notice to MarinersC.coast pilotD.on the chart53.Painting on ___ is prohibited because it will weaken its sensibility.A.hydrostatic release unitB.exterior of winchesC.hold laddersD.ship shell54.In good weather, you should deploy the sea anchor from the liferaft to ___.A.stay in the general locationB.keep the liferaft from capsizingC.navigate against the currentD.keep personnel from getting seasick55.A red triangular daymark marks ___.A.a prominent object of navigational interest that has no lateral significanceB.the centerline of a navigable channelC.an area of a channel where passing another vessel is permittedD.the starboard side of a channel56.___ is not contained in the NM Weekly.A.Supplement to Guide to Port EntryB.Amendments to Admiralty List of Radio SignalsC.Amendments to Admiralty List of Lights and Fog SignalsD.Amendments to Admiralty Sailing Directions57.A Doppler log in the bottom return mode indicates the ___.A.speed over the groundB.bottom characteristicsC.velocity of the currentD.depth of the current58.The first treatment given to a person overcome by benzene vapor should be to ___.A.flush their face with water for about 5 minutesB.remove their clothing and wrap them in blanketsC.stand them up and walk them aroundD.remove them to fresh air59.Which of the following is the most useful factor for predicting weather?A.The present reading of the barometerB.The difference in the barometric readings within the past 24 hoursC.The rate and direction of change od barometric readingsD.The previous reading of barometer60.When lowering a personnel net to pick up personnel from a boat, the personnel basket should be___.A.tied to the vessel with a tag lineB.lowered over open waterC.dropped in the waterD.tied to the rig with a tag line61.The word “breadth of a vessel” in International Regulations for Preventing Collision at Sea 1972 is___.A.the registered breadthB.the maximum breadthC.the breadth amidshipsD.the molded breadth62.The purpose of the inclining experiment on a ship is to determine the ___.A.maximum load lineB.position of the center of buoyancyC.position of the metacenterD.lightweight and lightweight center of gravity location63.Prior to burning of welding on a fuel tank on a ship, regulations require that an inspection bemandatorily required if this inspection is made by ___.A.the Master or person in charge of the shipB.a marine chemistC.the Officer in Charge, Marine InspectionD.the National Fire protection Association64.In towing, chocks are used to ___.A.stop off the towline while retrieving itB.secure the end of the towline on the tugC.protect the towline from chafingD.absorb shock loading on the towline65.What is the best method to overcome the effect of shadowing when attempting to place anINMARSAT-B?A.A small course change should workB.Select a CES that serves the INMARSAT satellite that will handle the callC.Turning on a compensators will work in all but extreme cases of shadowingD.Installing a shadow correction filter will compensate in fringe areas66.The ISM code is part of ___.A.MARPOLB.SOLASC.STCWD.High speed Craft Code67.The ship’s tanks most effective for trimming are the ___.A.settlersB.domesticsC.deepsD.peaks68.A device used ti tighten up remaining slack in wire rope when you are making up to a tow ininland water is a ___.A.steamboat ratchetB.tripping lineC.tripping bracketD.norman pin69.If your propeller is racing in rough weather, you should ___.A.decrease your engine speedB.stop your engine until the rough weather passesC.ignore itD.increase your engine speed70.If your passenger vessel is fitted with a loudspeaker system, it must be tested at least once ___.A.every tripB.a watch or once a trip, whichever is shorterC.every weekD.a day71.A large navigational buoy (LNB) is painted ___.A.redB.yellowC.with red and white vertical stripesD.with a distinct colour and pattern unique to each buoy72.Two well-developed high pressure areas may be separated by a ___.A.ridge of a low pressureB.valley of low pressureC.hill of low pressureD.trough of low pressure73.Watertight compartment are separated by ___.A.longitudinal bulkheadB.decks and bulkheadsC.dunnagesD.tween decks74.When reversing, the tidal stream will have a period with little or no effect. This is called the ___.A.RiseB.RangeC.SpringD.Slack75.Ships’masters are requested to ensure that, while te=heir vessels are calling at this port, alldischarging outlets are ___.A.kept half openedB.kept half closedC.openedD.blocked up76.When should navigator rely in the position of floating aids to navigation?A.During daylight onlyB.During calm weather onlyC.Only when fixed aids are not availableD.Only when inside a harbor77.A vessel fitted with twin screws is easier in ___ than a vessel wit single screw.A.turning maneuverB.regulating speedC.position fixingD.course setting78.What does the term TO NA VIGATE WITH CAUTION mean?A.To navigate completelyB.To navigate intentionallyC.To navigate carefullyD.To navigate intensely79.From ___ mariners can know the date of tide.A.the Cargo planB.the Sea PilotC.the Pilot ListD.the Tide Table80.During the voyage from Dalian to Singapore, my vessel ___ heavy damages to the deck fittingsowing to heavy seas.A.containedB.sustainedC.pertainedD.maintained81.Your oceangoing vessel is requires to have a waste management plan. This plan must be in writingand describe procedures for ___.A.disposing waste from marine sanitation devicesB.reducing the amount of shipboard wasteC.segregating the different types of shipboard wasteD.collecting and discharging garbage82.When anchoring, good practice requires 5 to 7 fathoms of chain for each fathom of depth. In deepwater, ___.A.the same ratioB.less chain for each fathom of depthC.more chain for each fathom of depthD.two anchors with the same ratio of chain83.How can vessel personnel detect the operation of a SART in its vicinity?A.The SART signal appears as a target which comes and goes; the effect of heavy swells on the chartB.A unique radar signal consisting of a blip code radiating outward from a SART’s position along itsline of bearingC.A unique of two tone alarm signal heard upon the automatic unmuting of the 2182 kHzradiotelephone automaticD.A unique two tone “warbling” signal heard on VHF-FM ch-7084.What is MOST important thing you should do before transmitting on a marine radio?A.Record the time in your radio logB.Monitor the channel to ensure that it is clearC.Press the push to talk button three timesD.Ask for permission85.Which davit type can be operated by one man?A.Sheath-screwB.RadialC.QuadrantalD.Gravity86.My gyro-compass ___ is two degrees eastA.mistakeB.troubleC.errorD.wrong87. When the bypass valve of a self-contained breathing device is opened, the air flows _____A.directly to the air supply bottleB.directly to the facepieceC. From the bottle into the atmosphereD.through the regulator88. In rough weather,when a ship is able to maneuver, it is best to launch a lifeboat ____.A. On the windward sideB. with the wind from asternC. with the wind dead aheadD. . with the wind阅读理解[关联题]Corrections to Sailing Directions are given in Section Ⅳ. Those in force at the end of the year are reprinted in the Annual Summary of Notices to Mariners. A list of corrections in force is published in Section Ⅳof the Weekly Edition for the last week of each month.It is recommended that corrections be kept in a file with the latest list of corrections in force on top. Thelist should be consulted when using the parent book to see if any corrections affecting the area under consideration are in force.It is not recommended that corrections be stuck in the parent book or current supplement,but,if this is done,when a new supplement is received care must be taken to retain those corrections issued after the date of the new supplement,which may be several months before its receipt on board.89__ are reprinted in the Annual Summary of Notices to Mariners.A. The Sailing DirectionsB. The corrections to Sailing DirectionsC. The effective corrections to Notices to MarinersD. The Weekly Edition90. The parent book is ___.A. The Sailing DirectionB. The corrections to Sailing Directions in forceC. the Annual Summary of Notices to MarinersD. the Weekly Edition91. It is recommended that corrections to the Sailing Directions be___.A. made by handB. consulted at the last week of each monthC. stuck in the parent book or current supplementD. kept in a file with the latest list of corrections in force on top92. If the corrections be stuck in the parent book or current supplement,___.A. when a new supplement is received,those corrections issued after the date of the new supplementmust be retainedB. the parent book must be consultedC. the current supplement must be consultedD. the Annual Summary of Notices to Mariners must be used(关联题)oil-supply operation for ships shall not be conducted at the quay of Mizushima Works, unless and by the oil-supplier, is previously submitted to approved by the transportation Control Section.......from sunrise to an hour before sunset. In an exceptional case where it is necessary for some inevitable ...subject to a prior specific approval of the section, to which a due application shall be made stating the ...fences shall be installed in addition to other preventive measures. For the purpose of early detection of the spot operation.93.The oil-supply operation for ships can be done at the quay of Mizushima Works when________.A.The vessel gets oral permission from the master and oil-supplierB.A written from is signed by master and oil-supplier jointlyC.A written from which is signed by the master and oil-supplier is to be submitted to and approved by advanceD.The vessel gets written permission from the master and the oil-supplier94.Before the oil-supply operation begins________.A.Install oil fences as well as preventive measuresB.Take preventive measuresC.Take preventive measuresD.State reasonsE.Fit in oil fences only95.This paragraph is most likely extracted from________.A.Port of entryB.SOLASC.MarpolD.BLU code96.If we have to carry out the oil-supply at night, we shall________.A.Subject a prior specific approval to the Section concernedB.State inevitable reasons onlyC.Execute it if we feel it necessaryD.Get the approval of the Section beforehand by making a due application。
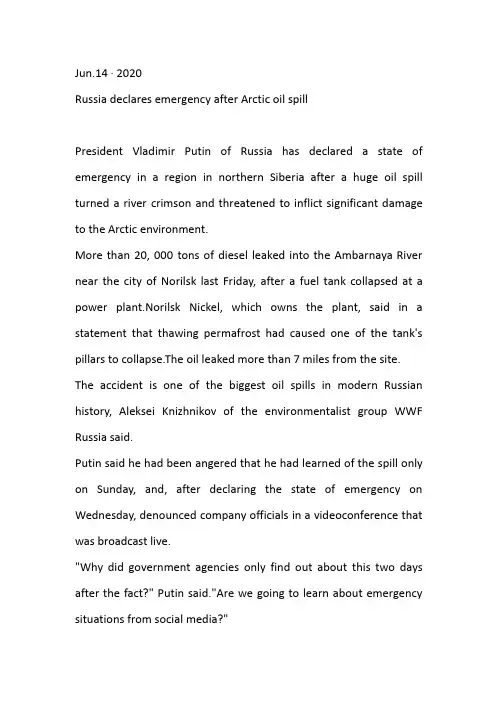
Jun.14·2020Russia declares emergency after Arctic oil spillPresident Vladimir Putin of Russia has declared a state of emergency in a region in northern Siberia after a huge oil spill turned a river crimson and threatened to inflict significant damage to the Arctic environment.More than20,000tons of diesel leaked into the Ambarnaya River near the city of Norilsk last Friday,after a fuel tank collapsed at a power plant.Norilsk Nickel,which owns the plant,said in a statement that thawing permafrost had caused one of the tank's pillars to collapse.The oil leaked more than7miles from the site. The accident is one of the biggest oil spills in modern Russian history,Aleksei Knizhnikov of the environmentalist group WWF Russia said.Putin said he had been angered that he had learned of the spill only on Sunday,and,after declaring the state of emergency on Wednesday,denounced company officials in a videoconference that was broadcast live."Why did government agencies only find out about this two days after the fact?"Putin said."Are we going to learn about emergency situations from social media?"Putin said he would ask investigators to look into the spill to make a clear assessment of how officials reacted to the accident.Norilsk Nickel,along with the Russian Emergency Situations Ministry, dispatched hundreds of personnel to clean up the mess.So far, Norilsk Nickel said,they had managed to gather up only around340 tons of the oil."The incident led to catastrophic consequences,and we will be seeing the repercussions for years to come,"Sergey Verkhovets, coordinator of Arctic projects for WWF Russia,said in a statement."We are talking about dead fish,polluted plumage of birds and poisoned animals."主编:Eein品控:Lala审核:PitaMarine Rescue Service/Handout via REUTERS完成学习2020年6月14日超2万吨柴油泄漏,北极圈河流变“红海”今日导读最近,邻国俄罗斯暴发了一场环境危机:在位于北极圈以北250英里的诺里尔斯克市(Norilsk),一家热电厂发生柴油泄漏事故,约有两万吨的柴油流入了附近河道及土壤;亚北极地区的河流表面,如今是肉眼可见的一片血色。
ReviewReview of oil spill remote sensingMerv Fingas a ,⇑,Carl Brown ba Spill Science,Edmonton,Alberta T6W 1J6,CanadabEnvironmental Science and Technology Section,Environment Canada,Ontario K1A OH3,Canadaa r t i c l e i n f o Keywords:Oil spill remote sensing Laser fluorosensor Oil detectionOil spill surveillanceOil spill thickness measurementa b s t r a c tRemote-sensing for oil spills is reviewed.The use of visible techniques is ubiquitous,however it gives only the same results as visual monitoring.Oil has no particular spectral features that would allow for identification among the many possible background interferences.Cameras are only useful to provide documentation.In daytime oil absorbs light and remits this as thermal energy at temperatures 3–8K above ambient,this is detectable by infrared (IR)cameras.Laser fluorosensors are useful instruments because of their unique capability to identify oil on backgrounds that include water,soil,weeds,ice and snow.They are the only sensor that can positively discriminate oil on most backgrounds.Radar detects oil on water by the fact that oil will dampen water-surface capillary waves under low to moderate wave/wind conditions.Radar offers the only potential for large area searches,day/night and foul weather remote sensing.Ó2014Elsevier Ltd.All rights reserved.Contents 1.Introduction (00)2.Optical remote sensing .................................................................................................002.1.Optical properties of oil ...........................................................................................002.2.Visible remote sensing ............................................................................................002.3.Infrared ........................................................................................................002.4.Near-infrared....................................................................................................002.5.Ultraviolet ......................................................................................................002.6.Satellites operating in optical region ser fluorosensors.....................................................................................................004.Microwave sensors.....................................................................................................004.1.Passive microwave sensors.........................................................................................004.2.Radar ..........................................................................................................004.3.Satellite radar systems ............................................................................................004.4.Radar image processing ...........................................................................................004.4.1.Quality assessment........................................................................................004.4.2.Speckle removal ..........................................................................................004.4.3.Noise removal............................................................................................004.4.4.Wind field elimination.....................................................................................004.4.5.GIS to remove known shoreline and other effects ...............................................................004.4.6.Edge detection ...........................................................................................004.4.7.Texture analysis ..........................................................................................004.4.8.Shape analysis............................................................................................004.4.9.Fuzzy logic ..............................................................................................004.4.10.Neural networks.........................................................................................004.4.11.Others .................................................................................................00/10.1016/j.marpolbul.2014.03.0590025-326X/Ó2014Elsevier Ltd.All rights reserved.⇑Corresponding author.Tel.:+17809896059.E-mail addresses:fingasmerv@shaw.ca (M.Fingas),Carl.Brown@ec.gc.ca (C.Brown).Please cite this article in press as:Fingas,M.,Brown, C.Review of oil spill remote sensing.Mar.Pollut.Bull.(2014),/10.1016/j.marpolbul.2014.03.0594.4.12.Automatic systems.......................................................................................004.5.Ship-borne radar oil spill detection ..................................................................................005.Slick thickness measurements............................................................................................005.1.Passive microwave ...............................................................................................005.2.Acoustic travel time ..............................................................................................005.3.Visual..........................................................................................................005.4.Near-IR absorption ...............................................................................................005.5.Infrared ser trigonometry ...............................................................................................005.7.Radar polarimetry ................................................................................................005.8.Sorbents or oil recovery ...........................................................................................005.9.Spreading rates and wave containment...............................................................................005.10.Spectroscopic differences .........................................................................................005.11.Radar surface damping ...........................................................................................005.12.Light polarization differences between oil and ser fluorescence...............................................................................................005.14.Water Raman suppression ........................................................................................005.15.Electrical ser interferometry .............................................................................................005.17.Ultrasound.....................................................................................................005.18.Thermal conduction time .........................................................................................006.Detection of oil in the water column and on the sea bottom ser fluorosensors ...............................................................................................006.3.Cameras ........................................................................................................006.4.Chemical analysis ................................................................................................007.Detection of oil with and under ice or snow ................................................................................008.Concluding remarks....................................................................................................00References .. (00)1.IntroductionRemote sensing is an important part of oil spill response.Public and media scrutiny is usually intense following a large spill,with demands that the location and extent of the oil spill be precisely known.Through the use of modern remote sensing instrumenta-tion,oil can be monitored on the open sea on a 24-h basis (Robbe and Hengstermann,2006).With the knowledge of slick locations and movement,response personnel can more effectively plan countermeasures to lessen the effects of the pollution.An additional role for remote sensing has been the strong interest in detection of illegal discharges,especially in view of the large seabird mortality associated with such discharges (O’Hara et al.,2013).The most common forms of oil spill surveillance and mapping are still sometimes carried out with simple still or video photography.Remote sensing from an aircraft (including unmanned aerial vehicles (UAVs),i.e.drones)is still the most com-mon form of oil spill tracking.Remote sensing from satellites using radar sensors is also becoming a common technique.Attempts to use visual satellite remote sensing for oil spills are improving,although success is not necessarily as claimed and is generally lim-ited to identifying features at sites where known oil spills have occurred.It is important to divide the uses of remote sensing into the end use or objective as the utility of the sensor or sensor system is best defined that way.Oil spill remote sensing systems used for routine surveillance certainly differ from those used to detect oil on shorelines or land.One tool does not serve for all functions.For a given function,many types of systems may,in fact,be needed.Further it is necessary to consider the end use of the data.The end use of the data,be it location of the spill,enforcement or support to cleanup,may also dictate the resolution or character of the data needed.There are several broad uses of oil spill remote sensing:1.Mapping of spills.2.Surveillance and general slick detection.3.Provision of evidence for prosecution.4.Enforcement of ship discharge laws.5.Direction of oil spill countermeasures.6.Determination of slick trajectories.Several general reviews of oil spill remote sensing have been prepared (Fingas and Brown,2011;Leifer et al.,2012;Robbe and Hengstermann,2006).These reviews generally show that special-ized sensors offer advantages compared to off-the-shelf sensors which are usually designed for other purposes.2.Optical remote sensing 2.1.Optical properties of oilThere are several optical properties of concern to the appear-ance of oil in the region from the ultraviolet to the near infrared.This includes the reflectance,absorbance and the resulting contrast between oil and water.This,of course changes somewhat with oil type,oil weathering,atmospheric conditions (e.g.fog)and sun illumination.Oil/water differences have not been measured across the spectrum in great accuracy for all conditions and at all wavelengths (Andreou and Karathanassi,2011;Bulgarelli and Djavidnia,2012;Kudryashova et al.,1986;Otremba and Piskozub,2001;Shen et al.,2011;Yin et al.,2012).However a sum-mary can be prepared and is shown in Figs.1–3.These figures are generalized and do not show sharp features that may be present.The point of these figures is that there does not exist,any broad2M.Fingas,C.Brown /Marine Pollution Bulletin xxx (2014)xxx–xxxPlease cite this article in press as:Fingas,M.,Brown, C.Review of oil spill remote sensing.Mar.Pollut.Bull.(2014),/10.1016/j.marpolbul.2014.03.059distinctions between oil and water in the visible such that one can positively identify oil.2.2.Visible remote sensingIn the visible region of the electromagnetic spectrum (approxi-mately 400–700nm),oil has a higher surface reflectance than water,but does not show specific absorption/reflection tendencies.Oil generally manifests throughout the entire visible spectrum.Sheen shows up silvery and reflects light over a wide spectral region down to the blue.As there is no strong information in the 500–600nm region,this region is often filtered out to improve contrast (O’Neil et al.,1983).Overall,however,oil has no specific characteristics that distinguish it from the background (Brown et al.,1996;Taylor,1992).Therefore,techniques that separate spe-cific spectral regions do not increase detection capability.Some researchers noted that while the oil spectra are flat,that the pres-ence of oil may slightly alter water spectra.Scanners were used in the past as sensors in the visible region of the spectrum.A rotating mirror or prism swept the field-of-view and directed the light towards a detector.Before the advent of CCD (charge-coupled device)detectors,this sensor provided much more sensitivity and selectivity than video cameras.Another advantage of scanners was that signals were easily digitized andabsorbance of oil and water (Generalized from Kudryashova et al.,1986)The blue line is the water (water-to-air)and references to color in this figure legend,the reader is referred to the web version of this article.)hypothetical contrast of oil and water (Generalized from Figs.1and 2)The black line the oil as compared to the reflectance of oil and water.The blue line is the water and the black line the oil.(Generalized from:Andreou Kudryashova et al.,1986;Otremba and Piskozub,2001;Shen et al.,2011;Yin et al.,2012).(For interpretation of the the web version of this article.)Please cite this article in press as:Fingas,M.,Brown, C.Review of oil spill remote sensing.Mar.Pollut.Bull.(2014),/10.1016/j.marpolbul.2014.03.059which an imaging spectrometer collects hundreds of images at dif-ferent wavelengths for the same spatial area(Gonzalez et al., 2013).Hyperspectral images are extremely complex,and require advanced processing algorithms to satisfy near real-time require-ments in applications such as,mapping of oil spills and chemical contamination.One of the most widely used techniques for analyz-ing hyperspectral images is spectral un-mixing,which allows for sub-pixel data characterization.This is particularly important since the available spatial resolution in hyperspectral images is typically several meters,and therefore it is reasonable to assume that sev-eral spectrally pure substances(called endmembers in hyperspec-tral imaging terminology)can be found within each imaged pixel. This type of processing is time-consuming and computer intensive. Multi-spectral and hyperspectral sensing was used extensively during recent large spills(Bostater et al.,2012;Bradford and Sanchez-Reyes,2011;Corucci et al.,2010;Kokaly et al.,2013; Kroutil et al.,2010;Rand et al.,2011;Svejkovsky et al.,2012).Data in the visible has been subject to many efforts to use math-ematical techniques to help distinguish oil from water(Nie and Zhang,2012;Sun et al.,2013;Wang et al.,2010a,b;Yuan et al., 2011).At this time no automatic processing algorithms are used in the oil spill industry.Overall,the visible area remains an active research area as well as a practical means of monitoring oil spills.Fig.4shows one of the many visible images from the Deepwater Horizon oil spill.2.3.InfraredOil,which is optically thick,absorbs solar radiation and re-emits a portion of this radiation as thermal energy,primarily in the8–14l m region(long-wave).As oil has a higher emissivity of infrared than water,oil will after heating emit infrared radiation. Use of infrared is a case where one is measuring the emissions from the oil(Pinel and Bourlier,2009).In infrared(IR)images,thick oil appears hot,intermediate thicknesses of oil appear cool and thin oil or sheens are not detected.The thicknesses at which these transitions occur are poorly understood,but evidence indicates that the transition between the hot and cold layer lies between 50and150l m and the minimum detectable layer is between10 and70l m(Fingas and Brown,2011).The reason for the appear-ance of the‘cool’slick may be that a moderately thin layer of oil on the water surface causes destructive interference of the thermal radiation waves emitted by the water,thereby reducing the amount of thermal radiation emitted by the water.This is analo-gous to the appearance of the rainbow sheen in the visible range. The cool slick would correspond to the thicknesses as observed above,because the minimum destructive thickness would be about 2times the wavelength which is between8and10l m.This would yield a destructive interference onset of about16–20l m to about 4wavelengths or about32–40l m.The destructive or‘cool’area is usually only seen with test slicks,which is explained by the fact that the more rapidly-spreading oil is of the correct thickness to show this phenomenon.Slicks that have been on the water for a longer period of time usually are thicker or thinner(i.e.sheen)than 16–40l m.The onset of the hot thermal layer would,in theory, then be at thicknesses greater than this or at about50l m.Under circumstances such as high evaporation of a slick,the temperature contrast between water and the oil may not be distinct.Infrared sensors cannot detect emulsions(water-in-oil emul-sions)under most circumstances(Bolus,1996).This is probably a result of the high thermal conductivity of emulsions as they typi-cally contain50–70%water and thus do not show temperature dif-ferences from the surrounding water.Most infrared sensing of oil spills takes place in the thermal infrared at wavelengths of8–14l m.Specific studies in the thermal infrared show that there is no spectral structure in this region (Salisbury et al.,1993).Tests of a number of infrared systems show that spatial resolution is extremely important when the oil is distributed in windrows and patches.Cameras operating in the 3–5l m range are only marginally useful(Hover,1994).Nighttime tests of IR sensors show that there is detection of oil(oil appears visible image of the Deepwater Horizon spill from spaceshows the ease with which photography can be used onweather.Please cite this article in press as:Fingas,M.,Brown, C.Review of oil spill remote sensing.Mar.Pollut.Bull.(2014),/10.1016/ j.marpolbul.2014.03.059cold on a warmer ocean),however the contrast is not as good as during daytime (Shih and Andrews,2008a ).Further,on many nights no difference is seen.A daytime image of oil using infrared is seen in Fig.5.The relative thickness information in the thermal infrared is not useful enough to provide information for oil spill countermeasures.Oil detection in the infrared is not positive,however,as several false targets can interfere,including seaweeds,sediment,organic matter,shoreline,and oceanic fronts.Infrared sensors are reasonably inex-pensive,however,and are currently a tool used by the spill remote sensor operator.Infrared cameras are now very common and com-mercial units are available from several manufacturers.2.4.Near-infraredNear infrared (NIR)has not been used much for oil spills in the past.With the advent of NIR bands on the satellites MODIS and MERIS and the airborne AVIRIS,some work has been carried out.Oil spill imaging on all of these sensor platforms was possible dur-ing the Deepwater Horizon spill (Bulgarelli and Djavidna,2012;Etellisi and Deng,2012).Some researchers have attempted to use the NIR as a means for estimating oil spill thickness (Clark et al.,2010;De Carolis et al.,2012).Thicknesses of 0.5–10mm are needed for countermeasures pur-poses these are almost 1000times greater than those indicated by infrared (Brown et al.,1998).Ultraviolet data are also subject to many interferences or false images such as wind slicks,sun glints,and biogenic material (Yin et al.,2010).2.6.Satellites operating in optical regionThe use of optical satellite remote sensing for oil spills has been attempted for many years.In the past there were few satellites with limited passes and thus success was limited by chance to clear days when there was an overpass (Fingas and Brown,2011).In the past,there were several problems associated with relying on satellites operating in optical ranges,for oil spill remote sensing.The first is the timing and frequency of overpasses and the absolute need for clear skies to perform optical work (Fingas and Brown,2011).This is particularly true with older satellites with very infrequent overpasses.The chances of the overpass and the clear skies occurring at the same time gave a very low probability of seeing a spill on a satellite image.This point is well illustrated in the case of the Exxon Valdez spill.Although the spill covered vast amounts of ocean for over a month,there was only one clear day that coincided with a satellite overpass,and that was on April 7,infrared image of the Gulf spill in 2010.The black objects near portions of the oil are oil.The black objects near the top oil slick is patchy as the sheen does not show up.This sensor ASTER on the Terra satellite (NASA).Fig.6.A view of the Deepwater Horizon spill from an optical satellite.The oil in this case is some of the gray material off the Louisiana coast.Much of the scene obscured by clouds.This image shows some of the difficulty in discriminating using photographic images from space (from USGS).M.Fingas,C.Brown /Marine Pollution Bulletin xxx (2014)xxx–xxx 5Please cite this article in press as:Fingas,M.,Brown, C.Review of oil spill remote sensing.Mar.Pollut.Bull.(2014),/10.1016/j.marpolbul.2014.03.059Horizon spill in the United States (Leifer et al.,2012).An example of this is shown in ser fluorosensorsLaser fluorosensors are sensors that use the phenomenon that aromatic compounds in petroleum oils absorb ultraviolet light and become electronically excited.This excitation is rapidly removed through the process of fluorescence emission,primarily in the visible region of the spectrum (Brown,2011;Brown and Fingas,2003a,b;Sarma and Ryder,2006).Since very few other compounds show this tendency,fluorescence is a strong indication of the presence of oil.Natural fluorescing substances,such as chlo-rophyll,fluoresce at sufficiently different wavelengths than oil to avoid confusion.As different types of oil yield slightly different fluorescent intensities and spectral signatures,it is possible to dif-ferentiate between classes of oil under ideal conditions (see Fig.7).Most laser fluorosensors used for oil spill detection employ a laser operating in the ultraviolet region of 308–355nm (Brown,2011).There are several commercially-available ultraviolet lasers in the 300–355nm region including the XeCl excimer laser (308nm),the nitrogen laser (337nm),the XeF excimer laser (351nm),and the frequency-tripled Nd:YAG laser (355nm).With the excimer wavelength of activation,there exists a broad range of fluorescent response for organic matter,centered at 420nm.This is referred to as Gelbstoff or yellow matter,which can be easily annulled.Chlorophyll yields a sharp peak at 685nm.The fluores-cent response of crude oil ranges from 400to 650nm with peak centers in the 480nm region.Most fluorosensors use a technique to open their detectors just at the time when signals return from the surface.This technique is called ‘gating’.This vastly increases sensitivity and selectivity.Some fluorosensors are capable of gating their detectors to look below the target surface and some also to look at above the target surface.in the sampling rate of the surface where the oil contamination is being observed.At ground speeds of 100–140knots at a laser rep-etition rate of 100Hz,a fluorescence spectrum is collected approx-imately every 60cm along the flight path.This decreases if the instrument is scanning.If the sensor were to be gated to look only at signals above the target surface,then it might be useful to look at aerosols such as occur with chemical accidents.Little work has been carried out on this.Another phenomenon,known as Raman scattering,involves energy transfer between the incident light and the water mole-cules (Brown,2011).When the incident ultraviolet light interacts with the water molecules,Raman scattering occurs.This involves an energy transfer between the incident light and water molecules.The water molecules absorb some of the energy as rotational–vibrational energy and emit light at a wavelength which is the dif-ference between the incident radiation and the vibration–rota-tional energy of the molecule.The Raman signal for water occurs at 344nm when the incident wavelength is 308nm (XeCl laser).The water Raman signal is useful for maintaining wavelength cal-ibration of the fluorosensor in operation.Laser fluorosensors have significant potential as they may be the only means to discriminate between oiled and unoiled sea-weeds and to detect oil on different types of shorelines.Tests on shorelines show that this technique has been successful.Laser fluorosensors have shown high utility in practice and are now becoming essential sensors in many remote sensing packages (Tebeau et al.,2007).The information in the output is unique and the technique provides a unique method of oil identification.The method is analogous to performing chemistry in flight.The typical fluorosensor can provide an abundance of information to the user.4.Microwave sensorsMicrowave sensors are becoming the most commonly used sen-sors for oil spill remote sensing,particularly the active sensors such as radars.4.1.Passive microwave sensorsPassive microwave radiometers detect the presence of an oil film on water by measuring the reflection of the surface as excited by the radiation from space.The apparent emissivity factor of water is 0.4compared to 0.8for oil (Ulaby et al.,1989).A passive microwave radiometer can detect this emissivity difference and therefore can be used to detect oil.In addition,as the signal changes with thickness,the device can be used to measure thick-ness.Biogenic materials also interfere and the signal-to-noise ratio is low.In addition,it is difficult to achieve high spatial resolution.One needs resolution in metres rather than the typical tens of metres for a radiometer.In the past there were extensive efforts in this area (Fingas and Brown,2011).Many systems have been flown in the past with gen-erally positive results.Focus has generally been on using multiple frequencies to measure thickness.This will be discussed in greater detail later in this paper.Several workers have focussed on using passive microwave to image oil slicks as a remote sensing tool (Yujiri et al.,2003;Calla et al.,2011,2013).4.2.RadarCapillary waves on the ocean reflect radar energy,producing a ‘bright’image known as sea clutter.Since oil on the sea surface dampens capillary waves,the presence of an oil slick might be detected as a ‘dark’sea or one with an absence of this sea clutterFig.7.Portions of a real-time fluorosensor output display.The oil detections are shown as bars along the mapped flight path.The color of the bars shows the type oil measured.The length of the bar shows the aerial coverage.At each point along the flight path the spectrum of the target is also displayed.(From Environment Canada.)6M.Fingas,C.Brown /Marine Pollution Bulletin xxx (2014)xxx–xxxPlease cite this article in press as:Fingas,M.,Brown, C.Review of oil spill remote sensing.Mar.Pollut.Bull.(2014),/10.1016/j.marpolbul.2014.03.059(Nunziata et al.,2008;Li et al.,2011).Oil slicks are not the only phe-nomena that are detected in this way.There are many interferences or false targets,including fresh water slicks,wind slicks (calm areas),wave shadows behind land or structures,shallow seaweed beds that calm the water just above them,glacial flour,biogenic oils,and whale and fish sperm (Gens,2008).As a result,radar can be problematic in locations where fresh water inflows,ice,and other features produce hundreds of such false targets.Liu et al.(2010)showed that even with extensive processing,that false hits on SAR imagery were 20%,that is 20%of the images reported as oil,were still look-alikes.Despite these limitations,radar is an important tool for oil spill remote sensing because it is the only sen-sor that can be used for searches of large areas and it is one of the few sensors that can detect anomalies at night and through clouds or fog.Side-looking radar has completely different geometries than the more-familiar search radars.Search radar systems,such as those frequently used by the military,cannot be used for oil spills as they usually remove the clutter signal,which is the primary signal of interest for oil spill detection.Furthermore,the signal processing of this type of radar is optimized to pinpoint small,hard objects,such as periscopes.This signal processing is very detrimental to oil spill detection.The two basic types of imaging radar that can be used to detect oil spills and for environmental remote sensing in general are Syn-thetic Aperture Radar (SAR)and Side-Looking Airborne Radar (SLAR).The latter is an older,but less expensive technology,which uses a long antenna to achieve spatial resolution.Synthetic aper-ture radar uses the forward motion of the aircraft to synthesize a long antenna,thereby achieving good spatial resolution,which is independent of range,with the disadvantage of requiring sophisti-cated electronic processing.While more expensive,the SAR has greater range and resolution than the parative tests show that SAR is vastly superior (Mastin et al.,1994).SLAR has pre-dominated airborne oil spill remote sensing,primarily because of the lower price.Experimental work on oil spills has yields better data than L-or C-band Minchew et al.,2012;Yang et al.,2009).sive oil for a long period of timeon the allowed several parties to study various band relationships (Minchew et al.,2012).In advantages over other bands,however C oil spill imagery and L-band radar provides spills.Several different polarizations exist horizontal (H)electromagnetic wave mission and reception are in the same (transmission polarity then reception actually 4poles available:HH,VV,HV and these is designated as quadrapole.It has also tical antenna polarizations for both (VV)yield better results than other airborne radar,however at the angles used izations are less significant in terms of (Nunziata et al.,2012,2013;Solberg,2012that VV polarization tends to be more detection when winds are strong and HH although this was observational (However,the dependency of HH angle is greater than that of VV the incidence angle is small,the difference HH and VV polarization is small,but if the the VV image on the sea is brighter than gests that generally the VV image is better (Solberg,2012).Several workers have noted that polarimetric SAR can provide powerful discrimination between slicks and look-alikes (Hensley et al.,2012;Salberg et al.,2012;Skrunes et al.,2012).Additionally,phase differences can be used to detect oil and perhaps to discrim-inate these from other phenomena (Migliaccio et al.,2009,2011).Further work on polarimetric SAR continues and this shows prom-ise for future work.The ability of radar to detect oil is limited by sea state.Sea states that are too low will not produce enough sea clutter in the surrounding sea to contrast with the oil and very high seas will scatter radar sufficiently to block detection inside the wave troughs.Indications are that minimum wind speeds of 1.5m/s ( 3knots)are required to allow detectability and a maximum wind speed of 6–10m/s will again remove the effect (Hühnerfuss et al.,1996;Akar et al.,2011).The most accepted limits are 1.5m/s ( 3knots)to 10m/s ( 20knots).This limits the environ-mental window of application of radar for detecting oil slicks.Radar is also subject to interferences that appear to be like oil,i.e.substances or phenomena that dampen waves.These look-alikes include:low wind areas,areas sheltered by land,rain cells,organic films,grease ice,wind fronts,up-welling zones,oceanic fronts,algae blooms,current shear zones,etc.Extensive effort has been placed upon removing these look-alikes from imagery and automating the process of slick detection (Anderson et al.,2010;Ferraro et al.,2010;Muellenhoff et al.,2008;Shi et al.,2008;Shu et al.,2010;Sipelgas and Uiboupin,2007;Topouzelis et al.,2008,2009a ).This issue is relevant to both satellite and air-borne SAR systems.In summary,radar optimized for oil spills is useful in oil spill remote sensing,particularly for searches of large areas and for night-time or foul weather work.The technique is highly prone to false targets,however,and is limited to a narrow range of wind speeds (1.5–10m/s).Because of the all-weather and day-night capability,radar is now the most common means of oil spill remote sensing in offshore areas.Fig.8shows successful application of Fig.8.The Deepwater Horizon as imaged by Radarsat (EOSANP).M.Fingas,C.Brown /Marine Pollution Bulletin xxx (2014)xxx–xxx 7Please cite this article in press as:Fingas,M.,Brown, C.Review of oil spill remote sensing.Mar.Pollut.Bull.(2014),/10.1016/j.marpolbul.2014.03.059。
GENERAL STANDARDFORSOIL POLLUTION CONTROLDEC. 1997This standard specification is reviewed andupdated by the relevant technical committee onOct. 2005. The approved modifications areincluded in the present issue of IPS.This Standard is the property of Iranian Ministry of Petroleum. All rights are reserved to the owner. Neither whole nor any part of this document may be disclosed to any third party, reproduced, stored in any retrieval system or transmitted in any form or by any means without the prior written consent of the Iranian Ministry of Petroleum.CONTENTS : PAGE No.0. INTRODUCTION (3)1. SCOPE (4)2. REFERENCES (4)3. DEFINITIONS AND TERMINOLOGY (5)4. UNITS (12)SECTION I5. UNSATURATED ZONE (13)5.1 General (13)5.2 Organization Responsibility (13)5.3 Limitation (15)6. SITE ASSESSMENT (15)6.1 General (15)6.2 Gathering Release Information (16)6.3 Gathering Site-Specific Information (17)6.4 Gathering Contaminant-Specific Information (18)6.5 Evaluating Contaminant Mobility (19)7. TECHNOLOGY SELECTION (22)7.1 Soil Venting (22)7.2 Biorestoration (22)7.3 Soil Flushing (23)7.4 Hydraulic Methods (23)7.5 Excavation (24)SECTION II8. SATURATED ZONE (26)8.1 General (26)9. SITE ASSESSMENT (29)9.1 General (29)9.2 Gathering Release Information (29)9.3 Gathering Site-Specific Information (29)9.4 Gathering Contaminant-Specific Information (29)9.5 Evaluating Contaminant Phase in the Saturated Zone (29)9.6 Evaluating Contaminant Mobility (31)9.7 Setting Remediation Goals (36)10. TECHNOLOGY SELECTION (36)10.1 General (36)10.2 Containing NAPL and/or Dissolved Contaminant (36)10.3 Recovery of Floating NAPL (39)10.4 Treatment of Contaminants Dissolved in Groundwater (40)SECTION III11. METHODOLOGY FOR PIPELINE LEAK CONSEQUENCE EVALUATION (45)11.1 General (45)11.2 Evaluation of Leak (45)11.3 Safety Consequence Factor (47)11.4 Environmental Consequence Factor (48)12. LEAK DETECTION TECHNIQUES (52)12.1 General (52)12.2 Balancing of Mass Input Versus Output (53)13.LEAKPROOF CONTROL OF PIPELINES GAS PIPING, TANKSAND TECHNOLOGICAL INSTALLATIONS USING RADIOACTIVE TRACERS (57)13.1 General Consideration (57)13.2 Leak Detection in Pipelines for Liquids (58)13.3 Leak in Gas Pipelines Detection (59)0. INTRODUCTIONCleaning up hydrocarbon based liquids and refined products release from pipelines,oil production units, Desalter plants, pumping Station, Tank farms and drilling operation in upstream part and other pollutants from oil and petrochemical refineries and above ground/ under ground storage tanks in down stream part of OGP industries, typically involves using several corrective actions and strategies. Short term emergency measures may involves imminent actions to control acute safety and health hazards such as potential explosions and toxications. After the imminent danger has been eliminated, longer term corrective actions involve cleaning up pollutants that have entered the surface and subsurface environment.Petroleum products in the subsurface may be trapped between soil particles in the unsaturated zone, floating on the water table or dissolved in ground water in the saturated zone. The focus of this standard is on long-term strategies for cleaning up petroleum products in unsaturated or saturated zones. When the spill occurs some kind of soil clean up is typically necessary.1. SCOPEIn this Standard the following matter of soil pollution control is discussed:a) To provide authorities concerned on how to assess site conditions in the unsaturated zone and where a petroleum product release has occurred, information needed to localized where in the unsaturated zone petroleum product is located, and also the removal of petroleum products from the unsaturated zone at a given site.b) To assess on the technologies designed specifically for clean-up of the saturated zone.c) To provide a structural methodology for evaluation and potential consequences of a leak in a pipeline. The methodology that is intended to assist pipeline operators in assessing the need to install pipeline leak detection facilities, and an overview of available pipeline leak detection techniques.d) The requirements of Islamic Republic of Iran Environmental Department for soil pollution prevention shall be considered in engineering design and site selection of OGP facilities. Under no circumstances soil pollutants elements shall exceed the determined rates in this standard. The Standard is classified into three sections as follows:Section I: Unsaturated ZoneSection II: Saturated ZoneSection III: Pipeline Leak DetectionNote:This standard specification is reviewed and updated by the relevant technical committee on Oct. 2005. The approved modifications by T.C. were sent to IPS users as amendment No. 1 by circular No. 298 on Oct. 2005. These modifications are included in the present issue of IPS.2. REFERENCESThroughout this Standard the following dated and undated standards/codes are referred to. These referenced documents shall, to the extent specified herein, form a part of this standard. For dated references, the edition cited applies. The applicability of changes in dated references that occur after the cited date shall be mutually agreed upon by the Company and the Vendor. For undated references, the latest edition of the referenced documents (including any supplements and amendments) applies."Cleanup of Petroleum Contaminated Soils at Underground Storage Tanks",by Warren J. Lyman, David C. Noonan, Patrick J. Reidy (1990).IPS (IRANIAN PETROLEUM STANDARDS) IPS-E-PR-730 "Process Design of Plant Waste Water Treatment of RecoveringSystem" IPS-E-PR-771“Process Requirements of Heat Exchanging Equipment”EPA (ENVIRONMENTAL PROTECTION AGENCY USA)EPA (1989)"Estimating Air Emissions from Petroleum Under Storage TankCleanups"ANSI/ASME(AMERICAN NATIONAL STANDARD INSTITUTE/AMERICAN SOCIETY OFMECHANICAL ENGINEERS)ANSI/ASMEB 31-8 (1989) "Gas Transmission and Distribution Piping Systems"ROYAL DUTCH/SHELLPractice"EngineeringandDEP "DesignDEP 31.40.60 11-Gen. (1194) "Pipeline Leak Detection"DEP 31.40.40.38-Gen. "Hydrostatic Pressure Testing of New Pipelines"3. DEFINITIONS AND TERMINOLOGYTerms used in this Standard are defined below:AbsorptionThe penetration of atoms, ions or molecules into the bulk mass of a substance.AdsorptionThe retention of atoms, ions or molecules onto the surface of another substance.AerobicIn the presence of oxygen.AquiferA geologic formation capable of transmitting significant quantities of groundwater under normal hydraulic gradients.AquitardA geologic formation that may contain groundwater but not capable of transmitting significant quantities of groundwater under normal hydraulic gradients.AromaticAromatic is of or relating to organic compounds that resemble benzene in chemical behavior.AttenuationAttenuation is to reduce or lessen in amount (e.g., a reduction in the amount of contaminants in a plume as it migrates from the source).BiodegradationA process by which microbial organisms transform or alter through enzymatic action the structure of chemicals introduced into the environment.BiomassThe amount of living matter in a given area or volume.Bulk densityThe amount of mass of a soil per unit volume of soil; where mass is measured after all water has been extracted and total volume includes the volume of the soil itself and the volume of air space between the soil grains.Capillary suctionProcess where water rises above the water table into the void spaces of a soil due to tension forces between the water and soil particles.Capillary fringeThe zone of a porous medium above the water table within which the porous medium is saturated but is at less than atmospheric pressure. The capillary fringe is considered to be part of the vadose zone, but not of the unsaturated zone.Confined aquiferAn aquifer under greater than atmospheric pressure, bounded above and below by relatively impermeable formations.Confining layerA geologic formation exhibiting low permeability that inhibits the flow of water.Consolidated soilWhen a soil is subjected to an increase in pressure due to loading at the ground surface, a re-adjustment in the soil structure occurs. The volume of space between the soil particles decreases and the soil tends to settle or consolidate over time.ConstituentAn essential part or component of a system or group: examples are an ingredient of a chemical system, or a component of an alloy.Critical success factors (CSFs)Are parameters that influence the likelihood of success of a particular method.CurieCurie is equal to 3.7 × 10¹⁰ Bq s-1 (exactly) (see note below).Note:Activity of a radioactive nuclide in a particular energy state at a given time is the quotient of dN by dt, where dN is the expecta- dN tion value of the number of spontaneous nucleartransition from that energy state in that time interval of dt A =dtdN units: S -1 The special name for the unit of activity is Becquerel (Bq), 1Bq = 1s -1.DowngradientIn the direction of decreasing static head.Drawdown Lowering of the water table due to withdrawal of groundwater from a well.FluidSubstances which are transported through a pipeline in liquid and/or gaseous phase.Fluid conductivityThe constant of proportionality in Darcy’s Law relating the rate of flow of a fluid through a cross-section of porous medium in response to a hydraulic gradient. Fluid conductivity is a function of the intrinsic permeability of a porous medium and the kinematic viscosity of the fluid which flows through it. Fluid conductivity has units of length per time (cm/sec.).Free productA contaminant in the unweathered phase, where no dissolution or biodegradation has occurred.Field capacityThe percentage of water remaining in the soil 2 or 3 days after gravity drainage has ceased from saturated conditions.Hard liquidA liquid with a vapor pressure below the prevailing atmospheric pressure, e.g. stabilized crude oil.Henry’s lawThe relationship between the partial pressure of a compound and the equilibrium concentration in the liquid through a constant of proportionality known as Henry’s Law Constant. See partial pressure.HeterogeneousVarying in structure or composition and having different properties in different locations or directions.Hydraulic conductivityThe constant of proportionality in Darcy’s law relating the rate of flow of water through a cross-section of porous medium in response to a hydraulic gradient. Also known as the coefficient of permeability, hydraulic conductivity is a function of the intrinsic permeability of porous medium and the kinematic viscosity of the water which flows through it. Hydraulic conductivity has units of length per time (cm/sec.).Hydraulic gradientThe change in piezometric head between two points divided by the horizontal distance between the two points, having dimensions of length per length (cm/cm). See piezometric head.InfiltrationThe downward movement of water through a soil from rainfall or from the application of artificial recharge in response to gravity and capillarity.In situ treatmentIn situ treatment means treatment of the soil in place, i.e., they are not dug up. The excavation of contaminated soils usually adds significant expense to a site remediation.Interfacial tensionPhenomena occurring at the interface of a liquid and gas where the liquid behaves as it if were covered by an elastic membrane in a constant state of tension. The tension is due to unbalanced attractive forces between the liquid molecules at the liquid surface.LeakAn uncontrolled fluid release from a pipeline and other sources.Leak consequencesThe result of a pipeline leak and other sources in terms of human safety and damage to the environment. Economic loss such as cost of repair and deferred production are not taken into account in the leak consequence evaluation methodology given in this Standard.Leak expectancyThe probability of occurrence of a leak.Moisture contentThe amount of water or lost from the soil upon drying to a constant weight, expressed as the weight per unit weight of dry soil or as the volume of water per unit bulk volume of the soil. For a fully saturated medium, moisture content equals the porosity; in the vadose zone, moisture content ranges between zero and the porosity value for the medium. See porosity, vadose zone, saturated zone.Molecular diffusionProcess where molecules of various gases tend to intermingle and eventually become evenly dispersed.Molecular weightThe amount of mass in mole of molecules of a substance determined by summing the masses of the individual atoms comprising the molecule. One mole is equivalent to 6.02 × 10²³ the molecules. Non-Aqueous Phase Liquid (NAPL)Contaminants that remain as the original bulk liquid in the subsurface.Octanol-water partition coefficient (K ow)A coefficient representing the ratio of solubility of a compound in octanol to its solubility in water. As Kow increases, water solubility decreases.OPCOA Group Operating Company.PermeabilityA measure of a soils resistance to fluid flow. Permeability, along with fluid viscosity and density are used to determine fluid conductivity.PhaseThe physical form in which a substance is found. The three major phases are liquid, vapor and dissolved in pore water.Piezometric headThe level to which water from a given aquifer will rise by hydrostatic pressure. For the uppermost unconfined aquifer, the piezometric head is identical to the water table elevation. For confined aquifers, the piezometric head can be above or below the water table.PipelineA system of pipes and other components used for the transportation of fluids, between (but excluding) plants. A pipeline extends from pig trap to pig trap (including the pig traps and associated pipework and valves), or, if no pig trap is fitted, to the first isolation valve within the plant boundaries or a more inward valve if so nominated.PorosityThe volume fraction of a rock or unconsolidated sediment not occupied by solid material but usually occupied by water and/or air. Porosity is a dimensionless quantity.Pressure gradientA pressure differential in a given medium, which tends to induce movement from areas of higher pressure to areas of lower pressure.Refractory indexA measure of the ability of a substance to be biodegraded by bacterial activity.Residual saturationThe amount of water or oil remaining in the voids of a porous medium and held in an immobile state by capillary and dead-end pores.RetardationPreferential retention of contaminant movement in the subsurface resulting from adsorption processes or solubility differences.Protective covering, often stone or coarse gravel, for earthen slopes to prevent erosion.Saturated zoneThe zone of the soil in which all space between the soil particles is occupied by water, including the capillary zone.Soft liquidA liquid with a vapor pressure above the prevailing atmospheric pressure, e.g. ethylene, NGL, LPG, etc.Soil sorption coefficientA measure of the preference of an organic chemical to leave the dissolved aqueous phase in the soil and become attached or adsorbed to soil particles as organic carbon.SorptionA general term used to encompass the process of absorption, adsorption, ion exchange, and chemisorption.StratigraphyThe study of original succession and age of subsurface layers; dealing with their form, distribution, composition, and physical and chemical properties.SurfactantNatural or synthetic chemicals that have the ability to promote the wetting, solubilization, or emulsification of various organic chemicals.Technical integrityThe state of a system which exists when, under specified operating conditions, there is no foreseeable risk of its failure endangering people, the environment or asset value.Unconfined aquiferAn aquifer that is under atmospheric pressure. It is usually the uppermost aquifer in the subsurface with its upper limit being the water table.UpgradientIn the direction of increasing static head.Vadose zoneThe portion of a porous medium above the water table within which the capillary pressure is less than atmospheric and the moisture content is usually less than saturation. The vadose zone includes the capillary fringe.Vapor pressureThe equilibrium pressure exerted on the atmosphere by a liquid or solid at a given temperature. Also a measure of a substance’s propensity to evaporate or give off flammable vapors. The higher the vapor pressure, the more volatile the substance.In flowing liquids the existence of internal friction or the internal resistance to relative motion of the fluid particles with respect to each other must be considered; this resistance is called viscosity. VolatilizationThe process of transfer of a chemical from the water or liquid phase to the air phase. Solubility, molecular weight, and vapor pressure of the liquid and the nature of the air-liquid/ water interface affect the rate of volatilization.Water tableThe water surface in an unconfined aquifer at which the fluid pressure in the voids is at atmospheric pressure.WeatheringThe process where a complex compound is reduced to its simpler component parts, transported through physical processes, or biodegraded over time.Abbreviations and SymbolsALARP Principle As low as is Reasonably PracticablePipelineIntegrityofASPIN AssessmentInstituteAPI AmericanPetroleumDemandBOD BiochemicalOxygenCDM Camp Dresser & Mckee Inc.MinuteperCFM CubicFeetOxygenDemandCOD ChemicalFactorSuccessCSF CriticalConsequenceFactorECF EnvironmentalProtectionAgencyEnvironmentalEPA U.S.FRED Fire Release Exposure and DispersionCarbonGAC GranularActivatedGasLPG LiquefiedPetroleumMAOP Maximum Allowable Operating PressurePhaseLiquidNAPL Non-AqueousLiquidGasNGL NaturalCarbonPAC PowderedActivatedComputerPC PersonalPOTW Publicly Owned (Waste Water) Treatment WorkVehicleOperatedROV RemotelyFactorConsequenceSCF SafetyYieldStrengthMinimumSMYS SpecifiedDetectionLeakSPLD StatisticalPipelineUST Underground Storage Tank UT Ultrasonic Testing USD United States Dollar VOCs Volatile Organic Compounds ZOC Zone of Contribution Note:Further abbreviations and symbols used in leak consequence modeling are defined in Appendix A. C a Concentration of contaminant in soil [cm³/cm³] C w Concentration of Contaminant in Pore Water [mg/l] K ocSoil/Water Partitioning CoefficientK ow Octanol/Water Partitioning CoefficientpHIndicates Alkaline or Acid Conditions in Log UnitsRI Refractory Index4. UNITSThis Standard is based on International System of Units (SI), except where otherwise specified.LIST OF SYMBOLSSYMBOL UNITDESCRIPTIONA mm² Area of leak hole d Mm Diameter of leak holeD Inch Pipeline nominal diameterECF --- Environmental consequence factor E1 --- Fluid persistence/seepage factor E2 --- Climate correction factor for liquidsE3 USD/m³ Clean-up and other associated costs for liquids h m Water depth I g --- Ignition factorK --- Ratio of specific heats for a gas, (Cp/Cv) L e --- Leak expectancy L m ton Potential leak mass LR kg/s Leak rateL s km Section lengthMW kg/kg-mol Molar mass of gasesP in bar (ga) Fluid pressure in the pipeline (gage)P out bar (ga) Back-pressure outside the pipeline (gage)P c bar Critical pressure of a gas for choked flow through an orifice π --- 3.1416Q 10³ m³/h Fluid flow rate (for gases, under standard reference conditions, i.e. 15°C and 1.01325 bar) Ro kg/m³ Fluid densitySCF --- Safety consequence factor S1 --- Fluid hazard factorS2 --- Population density factorT hour Time elapsed between the onset of a leak and shut-down of pumps/compressorsT g °C Average gas temperature T m °C Average ambient temperature z---Compressibility factorSECTION IUNSATURATED ZONE5. UNSATURATED ZONE5.1 General5.1.1 Unsaturated zone is the portion of a porous, usually above the water table in an unconfined aquifer, within which the moisture content is less than saturation and the capillary pressure is less than atmospheric pressure and the unsaturated zone does not include the capillary fringe.A good understanding of the conditions in the unsaturated zone is essential when selecting an appropriate soil treatment technology. By site assessment which reveal analysis of basic hydrologic, geologic, and chemical data measurements collected at the site of interest. The following points shall be considered.a) What was released? Where? (time since petroleum released).b) Currently, where in the unsaturated zone is most of the petroleum product likely to be?c) How much petroleum product is likely to be present in different locations and phases?d) How mobile are the constituents of the contaminant, and where are they likely to travel and atwhat rate?.5.2 Organization ResponsibilityContractors or other parties who have responsibility for cleaning up the unsaturated zone as shown in Fig. 1 shall consider three main components as given below:a) Site assessment;b) technology selection;c) monitoring and follow-up measurements.Fig. 15.3 LimitationSeveral significant limitations regarding its content and its precision are given below:1) Estimates are for relative assessmentsHow much of the release is likely to be in each phase in unsaturated zone, and which technologies are more likely to be effective.2) Petroleum hydrocarbons as contaminantsSince petroleum products comprise most of the materials stored in USTs, therefore special focus is given to gasoline.3) Situ treatmentAfter a contaminated soil has been excavated, the soil can also be treated above ground using many of the same techniques described for in situ applications (see Clause 7.5).6. SITE ASSESSMENT6.1 General6.1.1 The data collected should be used to gain the behavior of the contaminant in the subsurface. When dealing with the unsaturated zone, the data are primarily used to determine the mobility of the contaminant and which phase(s) it is likely to be in. Mobility of petroleum product in the unsaturated zone is related to:a) The potential for the various phases of contaminant to move through the subsurface; andb) the potential for the petroleum product to change from one phase into another.To choose an effective clean-up technology for soils contaminated by petroleum, it is necessary to collect certain basic information about the released product and the subsurface environment, and these are:1) What contaminants were released?Knowledge of the type of product released, its physical and chemical properties, and its major chemical constituents is required.2) Where is the petroleum product currently?Distribution of petroleum product within the unsaturated zone, i.e., as a vapor in soil gas, as a residual liquid, or dissolved in pore water.3) How much petroleum product is in each phase?Immediately after a release (weeks to months) most of the product will exist as a residual liquid, significant fractions will volatilize and dissolved in existing pore water or infiltrating rain water.4) Where is the petroleum product going?Mobility effects not only extent the potential of a release, but also make the effectiveness of any treatment scheme that depends on mobilizing the contaminants difficult to remove them (e.g.vacuum extraction).These four questions provide a framework for decision, and more information can often improve the selection process. As a whole petroleum product in unsaturated zone exist only in three phase as shown in Fig. 2.REPRESENTATION OF THREE DIFFERENT PHASES IN WHICH PETROLEUM PRODUCT CANBE FOUND IN UNSATURATED ZONEFig. 26.2 Gathering Release Information6.2.1 The questions listed in Table 1 provides a starting point for finding the mobility and phase distribution of the product in the subsurface. For more above ground spills, the answers to questions in Table 1 are usually easy to obtain.Petroleum products include a variety of fuel types, each with different physical and chemical properties. In addition, each fuel type is a mixture of many constituent compounds which have properties that can be quite different from those of the mixture. Mobility of different contaminant’s must be known to determine over spilled fuel (e.g., "Will this contaminant spread quickly and reachthe water table?"), its partitioning ("Will this contaminant vaporize and pose explosion hazards?") and its degradation potential ("Will this contaminant be biodegraded easily in the unsaturated zone?"). These factors are an important part of the technology selection process.TABLE 1 - BASIC RELEASE INFORMATION ASSUMED TO BE KNOWN INFORMATION NEEDED WHY INFORMATION IS IMPORTANTWhat contaminants were released? Physical and chemical properties differ for each contaminant, leading tovarying phase partitioning, mobility, and degradation characteristics foreach contaminant. Corrective action selection is tied to these characteristics.How much was released? The amount released directly affects the phases in which in the contaminantmay be found.What was the nature of the release (quick spill/slow leak)? Phase partitioning and mobility of the released contaminant are bothaffected by the nature of the release. As a result, selection of appropriate corrective actions may differ for quick spills versus leaks over extended period of time.How long since the release? Contaminants "weather" over time, that is, change in composition due toprocesses such as degradation, volatilization, and natural flushing frominfiltrating rainfall. This change in composition directly affects the physicaland chemical properties of the bulk contaminant.How was the release detected? May provide insight into above questions and areal extent and distributionof contamination in the subsurface.6.2.2 How much petroleum product was released?The volume of spilled product can help the user to evaluate whether the contaminant has reached the saturated zone and estimate the level of contamination in the unsaturated zone.6.2.3 Time since releasedThe time since release is important because the composition and properties of the released material changes over time; volatile compounds evaporate, soluble constituents dissolve in infiltrating rainwater, and some constituents biodegrade. These biochemical changes that occur over time are called "Weathering".6.3 Gathering Site-Specific Information6.3.1 Site-specific information pertains primarily to the hydrologic and geologic characteristics of thesite. Geologic characteristics can vary greatly, even over short distances, therefore it is essential to make the accurate estimates of soil parameters through numerous field data. Table 2 lists site-specific data that are needed to conduct a site assessment. This table lists the essential data needed to assess the site.6.3.2 Default values obtained via tables, figures, and other data-for many of the parameters. Thesedefault values enable users of this Standard to make estimates of the critical parameters on the timely basis for a preliminary site assessment.。
原油倾点测试方法的国际标准原油倾点测试是评估原油可用性和稳定性的重要指标之一。
在国际贸易和石油开采过程中,准确测定原油的倾点对于决定储运和储存条件至关重要。
本文将介绍国际上广泛使用的原油倾点测试方法以及它们的标准化。
倾点测试方法的国际标准:1. ASTM D93测试方法:ASTM D93是美国材料和测试协会(ASTM)所发布的原油倾点测试方法的标准。
根据该方法,样品在封闭容器内加热至测试温度,然后点燃一个试纸在容器口,并观察试纸点燃与熄灭的温度范围。
这个温度范围即为原油的倾点。
2. ISO 3016测试方法:ISO 3016是国际标准化组织(ISO)发布的原油倾点测试方法的标准。
该方法与ASTM D93类似,采用相同的测试原理和步骤。
主要区别在于试纸点燃与熄灭的温度范围的定义。
3. GOST 5234测试方法:GOST 5234是俄罗斯国家标准技术监督局(GOST)发布的原油倾点测试方法的标准。
这种方法采用闭杯法,将样品加热,在不断搅拌的条件下观察温度。
当有初步燃烧迹象出现时,该温度即为原油的倾点。
4. IP 170测试方法:IP 170是英国石油学会(IP)发布的原油倾点测试方法的标准。
根据该方法,在评估原油的倾点时,样品被加热至预定的温度,并进行演示搅拌。
在样品上方发现烟雾体现初步燃烧的迹象。
这个温度即为原油的倾点。
原油倾点测试方法的国际标准有多种,如ASTM D93、ISO 3016、GOST 5234和IP 170等。
这些标准都采用了相似的测试原理和步骤,通过观察试纸或烟雾的出现来判断原油的倾点。
这些标准的制定和使用在国际上起到了重要的统一和指导作用,确保了原油倾点测试结果的准确性和互通性。
本文介绍了原油倾点测试方法的国际标准,包括ASTM D93、ISO 3016、GOST 5234和IP 170等。
这些标准的制定和使用对于原油的储运和储存条件的决策至关重要。
准确测定原油的倾点对于保障原油可用性和稳定性具有重要的意义。
821 国内外油气管道检测监测技术的现状1.1 国外油气管道检测监测的现状油气管道完整性管理理念的不断兴起,带动了油气管道内检技术的快速发展。
管道内检技术主要是在不影响油气管道正常运输的情况下,通过智能检测设备进行管道缺陷的检测评价以及合理修复,既保障油气管道的安全运行,又有效的延长了油气管道的使用寿命。
目前国内与国外应用的检测主要包括漏磁检测技术、超声检测技术,历经40年的发展在工业界得到广泛的应用,为管道的科学管理以及管道的安全运行提供了有力依据,管道内检的技术正像更高的适应性和更好的精密性发展。
漏磁检测受到的约束条件相对较少所以其技术的发展较为突出,各种各样的漏磁检测技术不断出现,比如:轴向、横向和螺旋磁场检测技术。
在超声检测技术上不仅有传统的压电式超声技术,还有现在开始应用于天然气管道的电磁超声检测技术。
由于检测较为复杂,还出现了多功能组合的检测仪器,将各监测技术功能的优势互补。
1.2 国内油气管道检测监测的现状我国的管道内检测技术发展还不到30年的时间,20世纪80年代的时候我国对管道内部检测技术进行了研究探讨且在理论上取得了初步的成果,但是并没有应用到实际当中。
1994年我国才引进了漏磁检测的设备,才真正意义上开始漏磁检测技术的应用与研究。
经过十几年的应用与研究我国的漏磁检测技术取得了质的飞跃,从引进到自主研发再到将自主研发的设备(精准度漏磁检测仪器)应用于管道检测中。
我国的轴向漏磁检测技术已经接近国际水平,但是电磁超声技术与超声波监测技术研究才刚起步。
2 国内外管道检测光纤传感技术的现状以及发展趋势随着管道的不断建设,各种各样的监测技术也随之不断的发展,现在应用于管道泄漏监测的主要技术有负压力波、超声波检测、光纤传感等方式。
但是负压力波与超声波检测的方式对于小的泄漏的监测受介质流体的限制,不能用于气体管道泄漏的监测。
光纤传感监测技术在测量应力和地道变形问题做了多种研究,最近几年,不论是国内还是国际上对光纤传感技术进行的研究,有干涉式光纤传感技术,其主要利用光线对所监测物理场的感应(压力、温度以及震动等),使得导光相位发生延迟造成输出的光的强度的变化,来判断被监测物理场的变化。
水下滑翔机集群应用现状与关键技术展望毛柳伟,杜 度,李 杨(中国人民解放军92587部队,北京 100161)摘要: 水下滑翔机依靠调节浮力实现升沉,借助水动力实现水中滑翔,可对复杂海洋环境进行长时续、大范围的观测与探测,在全球海洋观测与探测系统中发挥着重要作用,目前其应用领域已部分拓展至水下目标探测。
本文综述水下滑翔机集群组网执行海洋环境观测和集群水下目标探测方面的应用现状,对水下滑翔机平台集成控制、人工智能技术应用、能源补给、水声通信等制约其集群水下探测能力提升的关键技术进行分析,对水下滑翔机技术未来的发展趋势进行了展望。
关键词:水下滑翔机;集群组网;关键技术中图分类号:TP242; TJ630 文献标识码:A文章编号: 1672 – 7649(2020)12 – 0013 – 08 doi:10.3404/j.issn.1672 – 7649.2020.12.003Application status and key technology prospect of underwater glider clusterMAO Liu-wei, DU du, LI Yang(No.92587 Unit of PLA, Beijing 100161, China)Abstract: The underwater glider(UG) dives along a saw-tooth trajectory by adjusting the buoyancy and maintains its gliding mode by making use of hydrodynamic force. It can realize continuous observation and detection in long range and large scale in the complex ocean environment. Therefore, UG plays an increasingly important role in the novel global ocean observation and detection systems; At present, its application comprehension has been partially extended to underwater tar-get detection. This paper summarizes the recent development status of UG cluster networking in marine environment obser-vation and cluster underwater target detection, and the constraints technology on its cluster underwater detection were ana-lyzed, such as integrated control of underwater glider platform, the application of artificial intelligence, energy supply, under-water acoustic communication. In addition, the development trend of UG application was prospected.Key words: underwater glider;cluster networking;key technology0 引 言水下滑翔机(underwater glider)是一种典型的自治水下航行器,主要采用浮力驱动实现其在海洋中的上升或下潜,其工作原理如图1所示。
Oil Spill Detection in Northern European Waters: Approaches and AlgorithmsAnne H.S. Solberg 1, 2 and Camilla Brekke 1, 31 Department of Informatics, University of Oslo, Oslo, Norway2also at Norwegian Computing Center, Oslo, Norway 3 also at Norwegian Defence Research Establishment, Kjeller, Norway Abstract. The combined use of satellite-based Synthetic Aperture Radar (SAR) images and aircraft surveillance flights is a cost-effective way to monitor deliberate oil spills in large ocean areas and catch the polluters. SAR images enable covering large areas, but aircraft observations are needed to prosecute the polluter, and in certain cases to verify the oil spill. We discuss the limitations of satellite imaging of oil spills compared to aircraft monitoring. Automatic detection of oil spills has proven to be an interesting complement to manual detection. We present an overview of algorithms for automatic detection, and discuss their potential compared to manual inspection as part of an operational oil spill detection framework. Experimental results show that automatic algorithms can perform compa-oil spills, false alarm ratio, and they can also speed up the image analysis process compared to fully manual services.1. IntroductionMarine pollution arising from illegal oily discharges from ships represents a serious threat to the marine environment. Oil pollution caused by large accidents like the Prestige event in 2002 capture many headlines, but the majority of the oil pollution cases are caused by operational discharges from tankers. Observed oil spills commonly appear in connection with off-shore installations and correlate well with major shipping routes. A combi-nation of aircraft and satellite sensors are currently used to monitor large ocean areas to detect oil spills and catch the polluter. The inclusion of sat-spill surveillance and to cover larger areas.ellite surveillance allows the user to better target the aircrafts used for oil rable to manual detection, both in terms of accuracy in detecting verified 359V. Barale, M. Gade (eds.), Remote Sensing of the European Seas.© Springer Science+Business Media B.V. 2008360 A.H.S. Solberg and C. Brekke2. Remote sensing sensors for oil spill detectionFor routine monitoring of illegal oil discharges from ships and offshore installations both aircraft sensors and satellite sensors can be used. Satellite-based Synthetic Aperture Radar (SAR) images can be used to screen large ocean areas, while aircrafts are more suitable to be brought into action to identify the polluter, the extent, and the type of spill.2.1 Aircraft sensorsMost surveillance aircrafts used for oil pollution monitoring in Europe are equipped with a combination of sensors: Side-Looking Airborne Radar (SLAR), infrared/ultraviolet (IR/UV), Laser Fluoro-Sensor (LFS), Micro-wave Radiometer (MWR). For an overview of aircraft sensors for oil spill detection, see (Goodman 1994; Trieschmann et al. 2003). SLAR is the main sensor for long-range detection of oil pollution on the sea surface. The SLAR is used to locate possible spill locations. Then the spill is ins-pected more closely using additional sensors and/or visual inspection. The sensor configuration used on board surveillance aircrafts varies from coun-try to country. An example is the German aerial surveillance, which lo-cates the oil spills by SLAR, IR/UV scanning is used to quantify the extent of the film, a MWR is used to quantify the thickness, and a LFS is used for oil type classification. The SLAR, IR, and LFS can operate at night. A number of different aircraft types are used for oil spill aerial surveillance. They differ in terms of endurance, cruising speed and SLAR sensor equip-ment resulting in different SLAR area coverage during one flight hour. One hour of airborne remote sensing over the sea at a speed of 335 km/h covers an area of 13400 km2 (Tufte et al. 2005).2.2 Satellite sensorsSAR is the main spaceborne remote sensing instrument for oil spill imag-ing, with all-weather and all-day operation capabilities, although it is not capable of oil spill thickness estimation and oil type recognition. The main limitation for spaceborne optical sensors is the need for daylight and cloud-free scenes, but they have a potential to discriminate between oil and algal blooms. A more detailed discussion of other satellite sensors for oil spill detection is given in (Brekke and Solberg 2005).SAR is particularly useful for searching large areas. Usually even small volumes of oil cover large areas and thus the need for very highOil Spill Detection in Northern European Waters 361spatial resolution in SAR images is not crucial. SAR has however some limitations, as a number of natural phenomena can produce similar dark objects in the SAR images (see Section 3).Currently, RADARSAT-1 and ENVISAT ASAR are the two main SAR sensors used for oil spill detection. The best trade-off between spatial cov-erage and spatial resolution is achieved using RADARSAT-1 ScanSAR and ENVISAT ASAR Wide Swath image modes. Table 1 describes the coverage and resolution of these sensors. The costs of satellite images are much lower than the costs of covering the same area by aircraft. The actual time that the satellite passes over a given location will vary with latitude, but the overflight will be fixed in time.ASAR products.RADARSAT-1 ScanSAR Narrow ENVISAT ASAR Wide SwathSpatial coverage per scene Spatial resolution per scene 300 km × 300 km 50 m × 50 m 400 km × 400 km 150 m × 150 mThe number of available RADARSAT-1 or ENVISAT ASAR images of a given area on a given date depends on the geographic latitude and the observation period. Daily coverage is possible in Northern Europe, and a coverage a couple of times a week is possible for all European waters.2.3 The advantages and limitations of satellite-based vs. aircraft monitoring are summarized in Table 2. In order to cover the same area as a RADARSAT-1 ScanSAR Narrow scene or an ENVISAT ASAR Wide Swath scene with an aircraft, 6 or 12 flight hours, respectively, are needed. A limitation with the satellite monitoring is that the images are taken at fixed times of the day. The fate and persistence of oil in seawater are controlled by processes that vary considerably in space and time. The amount of oil spilled, its initial physical and chemical characteristics, and the prevailing climatic and sea conditions have great impact on the lifetime of an oil spill. A reasonable as-sumption might be that most illegal oil discharges are bilge oil, i.e. a mixture of several kinds of oils (fuel oil, hydraulic oil, etc.). For instance, in the Fin-nish surveillance area it is estimated that 1–5 percent of the detected slicks persists only some hours (Tufte et al. 2005). To cover oil spills occurring at Satellite vs. aircraft – advantages/limitationsTable 1. Coverage and resolution for selected RADARSAT-1 and ENVISAT are thicker slicks that persist several days, and 95–99% are bilge oil that362 A.H.S. Solberg and C. Brekkeall times of the day, aerial surveillance can be used to supplement the fixed coverage times of the SAR satellites.Table 2. Advantages and drawbacks with SAR satellite and aerial surveillance. (Adapted from Tufte et al. 2005).Satellite SAR Aerial surveillance Advantages Advantages lance.aircraft operational efficiency.Flexible monitoring. Can be deployed at short notice. Can identify additional oil parameters. Limitations Limitations False targets can occur in analysis.Fixed monitoring schedule.Limited to certain wind conditions. High cost. Smaller spatial coverage. Limited to certain weather conditions.3. SAR imaging of oil spillsOil spills dampen the Bragg waves (wavelength of a few cm) on the ocean surface and reduce the radar backscatter coefficient. This results in dark regions or dark spots in a satellite SAR image. A part of the oil spill detec-tion problem is to distinguish oil spills from other natural phenomena that dampen the short waves and create dark patches on the surface. Natural dark patches are termed oil spills look-alikes. Oil spills include all oil re-lated surface films caused by oil spills from oilrigs, leaking pipelines, pass-ing vessels as well as bottom seepages, while look-alikes include natural films/slicks, grease ice, threshold wind speed areas, wind sheltering by land, rain cells, shear zones, internal waves etc.A service for oil spill detection based on SAR images must contain an oil spill detection step where the SAR images are analyzed, and dark re-gions that might be oil spills are identified. In this process, the factors that can be used to discriminate between an oil spill and a look-alike are impor-and provide larger damping to the surrounding sea than natural films (Hovland et al. 1994). A newly released oil spill will have reasonably sharp borders to the surrounding sea. As the weathering effects the spill, the borders can become more fuzzy. The shape will be altered by wind and current. Depending on the source of the outlet, certain shapes of the oil spills can be expected. Oil spills from moving ships are thin, linear ortant. Due to higher viscosity, oil spills tend to remain more concentrated High accuracy of oil spill detection. Can identify polluter. Large and well-defined spatial coverage.Less expensive than airborne surveil-Can be used to cue aircraft to improveOil Spill Detection in Northern European Waters 363 piecewise slicks, while oil spills from stationary sources can be wide and regular if a significant amount of oil is released in short time.Other types of pollution can also cause slicks that are visible in the SAR image Algae can also create dark patches in the SAR image very similar to oil spills. This is in particular a problem in the Baltic Sea, where a certain algae type that dampens the Bragg waves is common during the summer season. If additional information from e.g. ocean color sensors is available, it can be used to identify algae.The wind speed is also important for imaging of oil spills. With very low wind, no backscatter from the sea surface will be seen. Look-alikes are very frequently observed in low to moderate wind conditions (approxi-mately 3 to 7 m/s). As the wind speed increases, the expected number of look-alikes will be lower. For oil spills, the contrast between the spill and the surrounding sea will decrease with higher wind speeds. At high wind speeds (>10 m/s) only larger slicks with thicker oil will be visible. The up-per limit for observing oil in the SAR image is not known exactly. In an operational oil spill detection service at Kongsberg Satellite Services (KSAT) in Tromsø, Norway, an upper limit of 15 m/s is used.4. SAR oil spill detection: manual vs. automaticOil spills in a SAR image can be identified by manual inspection, or the image can first be screened by an automatic algorithm for oil spill detec-tion, followed by manual inspection of the suspect alarms only. Manual interpretation of e.g. a 400 km × 400 km ENVISAT ASAR image can be a complex and time consuming task because the image is so large that the operator can only view a small part of the scene at a time to be able to de-tect thin oil spills. Recent benchmarks (Indregard et al. 2004; Solberg et al. 2006) comparing automatic algorithms to manual detection shows that an automatic algorithm can be a valuable tool when a large number of images are to be inspected.4.1 Manual oil spill detectionA well-established operational service for oil spill detection is run at KSAT. Trained operators detect oil spills by inspecting the SAR images. In addition to the image, they can use external information about wind speed and direc-tion, oil rig/pipeline location, national territory borders and coast lines. After a possible oil spill has been detected, it is assigned confidence level low, medium or high based on a certain set of rules (Indregard et al. 2004).364 A.H.S. Solberg and C. Brekke4.2 Automatic approachesA literature review of automatic techniques for oil spill detection in SAR images can be found in Brekke and Solberg (2005 ). In this section we give a short update on the state-of-the-art in this field.Several of the published papers on oil spill algorithms for SAR images (e.g. Fiscella et al. 2000; Del Frate et al. 2000; Solberg et al. 1999, 2006) describe a methodology consisting of dark spot detection followed by fea-ture extraction and a classification step (see Figure 1).Fig. 1. A framework for oil spill detection algorithms.Segmentation techniquesAs oil spills are characterized by low backscattering levels, the use of thresholding for dark spot segmentation is commonly applied (see e.g. Keramitsoglou et al. 2006; Solberg et al. 1999; Brekke and Solberg 2005). As SAR images tend to become darker with increasing range and as local variations in the wind level and other meteorological and oceanic condi-tions occur, thresholding algorithms where the threshold is set adaptively based on local statistical estimates should be preferred.Dark spot feature extractionDiscrimination between oil spills and look-alikes are often based on a number of features computed for each suspicious dark spot on the sea sur-face (see e.g. Topouzelis et al. 2002; Solberg et al. 1999; Brekke and Sol-berg 2006; Del Frate et al. 2000; Fiscella et al. 2000).Good features are very important for the success of the following classi-fication step. Most of the features applied in the literature are covered by the following types:• the geometry and shape of the dark spot;The location of detected oil spills and their confidence level is then immediatelysent to the surveillance aircrafts.Oil Spill Detection in Northern European Waters 365 •the physical characteristics of the backscatter level of the dark spot and its surroundings;•the dark spot contextual features;•the texture features of both the dark spot and the surroundings.Slick classificationThe purpose of the classification step is to distinguish oil spills from look-alikes. How difficult the classification task is depends on the variability in the feature values for objects in the oil spill class relative to the difference between feature values for objects in the look-alike class. Effective methods for developing classifiers involve learning from example patterns (training). In statistical approaches, the classification decision is based on the probabil-ity and the cost of a certain decision (e.g. Solberg et al. 1999; Brekke and Solberg 2007; Brekke et al. 2007).Various classifiers have been applied to the oil spill detection problem (Fiscella et al. 2000; Nirchio et al. 2005; Del Frate et al. 2000; Keramitso-glou et al. 2006). All detection algorithms suffer from false alarms, and dark spots classified as oil spills may be confused with look-alikes (e.g. natural film and low wind areas). Applying external data to improve classification and assess the slick nature has been suggested. Girard-Ardhuin et al. (2005) combines characteristics of the detected dark spots from the SAR images and meteorological and oceanic data through a multi-sensor approach (in-cluding information about surface wind measurements, sea-surface tempera-ture, atmospheric fronts and clouds and chlorophyll).5. A benchmark study of oil spill detection approaches As part of the EC project Oceanides, a benchmark study comparing oil spill recognition approaches was performed. Manual oil spill detection based on SAR images was compared to semi-automatic and automatic ap-proaches. A joint satellite-airborne campaign was performed during 2003. The campaign covered the Finnish and German sectors of the Baltic Sea, in addition to the German sector of the North Sea. The campaign was or-ganized in such a way that a trained operator at KSAT (KSAT1) analyzed the SAR images, and reported possible oil spills to the Finnish and German pollution control authorities. They would check the positions and verify the slicks, and report additional slicks found by the aircraft. This was done for both ENVISAT and RADARSAT-1 images.366 A.H.S. Solberg and C. BrekkeCenter (NR) (Solberg et al. 2006) was used to analyze all images without knowing aircraft detections or KSAT results. Figure 2 shows examples of correctly classified oil spills, false alarms, and slicks detected only by aircraft.Examples of false alarms. The slick in the image on the left was verified as algae, while the clearly suspect dark spot in the right image could not be found when the aircraft inspectedthe position (possibly resolved).For benchmark comparisons, KSAT let another operator (KSAT2) inspect the same SAR images without knowing the aircraft detections or the automatic oil spill detection approach developed at Norwegian Computingresult of the previous inspection to study the inter-operator variance. The ESA/KSAT/NR.© Fig. 2. ENVISAT images with examples of oil spills and false alarms.Oil Spill Detection in Northern European Waters 367 The benchmark data set contained 27 ENVISAT images and 32 RADARSAT-1 images. The real-time inspection of the ENVISAT images at KSAT (KSAT1) detected 11 oil spills that were verified as oil spills by the aircraft. The repeated inspection by another operator, KSAT2, detected 8 of these verified slicks, the automatic algorithm (NR) also detected 8 of the verified slicks. For RADARSAT-1 data, there was 18 verified oil spills, KSAT2 found 15 of these, while the NR algorithm found 14.This demonstrates that the inter-operator variance was significant. KSAT has later taken measures to reduce this variability by increasing op-erator training and harmonising the interpretation process. The perform-ance of the NR algorithm is also almost comparable to KSAT2, so it can be a valuable alternative or supplement to manual inspection.It is also of interest to study additional slicks reported by the aircraft, but not detected from satellite image analysis. In general, these slicks involved a small amount of oil. For some of them, the time of aircraft pass was sev-eral hours after the satellite image acquisition, so the release could be new. For other cases, the satellite image was taken several hours after the air-craft pass, and a small amount of oil could very well be resolved during this time period.The number of false alarms, the number of slicks reported by satellite, but verified as not oil by the aircraft, was also studied. All false alarms are discussed in detail in (Indregard et al. 2004). Some linear slicks with good contrast were detected in the satellite image but verified as algae.The confidence levels that are associated with reported possible oil spills from KSAT can be used by the surveillance aircraft crew to prioritize which oil spill positions they will inspect first. Slicks that were assigned confidence level High had very low false alarm ratio, slicks that were assigned confi-dence Medium had reasonably low false alarm ratio, while slicks that were assigned confidence Low had relatively high false alarm ratio (again the de-tails can be found in (Indregard et al. 2004). However, the confidence as-signed by two different operators at KSAT varied. The automatic algorithm can also be used to compute confidence levels using a set of rules that simu-late the rules used by the operators at KSAT (see Solberg 2005 for how this is done). By comparing the confidence levels assigned by two KSAT opera-tors and NR’s automatic algorithm on a set of 22 selected oil spills, it was found that KSAT1 and KSAT2 assigned the same confidence for 7 out of 22 slicks, while the algorithm and KSAT1 agreed for 13 of 22 slicks, and had a confidence level difference of one (indicating e.g. High vs. Medium) for six additional slicks. What this indicates is that there is still some subjectivity involved in confidence assignment, and using an algorithm to get a “second opinion” to use in confidence assignment might be valuable.368 A.H.S. Solberg and C. BrekkeThe processing time for manual inspection at KSAT varied between 3 and 25 minutes for RADARSAT-1 images, with an average of 9 minutes. The automatic algorithm had an average processing time of 3 minutes. For ENVISAT images, the average time for manual inspection at KSAT was 10 minutes, while the automatic algorithm had an average processing time of 1.45 minutes.6. Discussion and conclusionsThe combined use of satellite-based SAR images and aircraft surveillance flights is a cost-effective way to monitor large areas and catch the pollut-ers. The coverage in terms of the number of weekly satellite passes of European waters is very good in Northern Europe and decent in the Medi-terranean.Oil spill detections from aircrafts and satellite images were compared in a benchmark study. In general, there were good agreement between aircraft detections and satellite-based detections when the time offset between the image acquisitions was low.Some information about oil spill statistics and hot spots exist, see e.g. (Bauna and Clayton 2004; Tufte et al. 2005). Hot spots coincide well with major shipping routes, pipelines, oil rigs etc. Tufte et al. (2005) discuss sampling requirements as guidelines for operational oil spill monitoring in European waters. They also summarize current monitoring efforts for many countries in Northern Europe, and their experience in using a com-bination of aerial- and satellite monitoring. The best approach for a spe-cific national authority depends on the size and shape of the area to be monitored, and other resources available. International cooperation with neighboring countries on planning satellite acquisitions and sharing costs is important.Many different techniques are proposed for automatic detection of oil spills. They often consist of three main parts: segmentation, feature extrac-tion and classification. However, there is still a challenge in reducing the number of false alarms, and automatically assigned confidence levels can be helpful in prioritizing the alarms. Interoperator variance in manual de-tection should be reduced by better training, or introducing the algorithm as a second information source. This applies to both detection and confi-dence assignment.Presently, one of the biggest challenges for operational oil spill de-tection services is obtaining sustainability in terms of data availability. SENTINEL-1 is a planned two-satellite system (C-band) to be operated asOil Spill Detection in Northern European Waters 369 a constellation for maximized coverage/repeat cycle. The first satellite will be launched in 2010 and the second some 12–15 months later (Attema 2005 ). RADARSAT-2 is a Canadian SAR satellite planned to be launc-hed in the summer of 2007. The SAR instrument will be C-band like RADARSAT-1, but there will be more flexibility in the selection of polarizations.AcknowledgementsThe authors would like to thank the Oceanides project, in particular Marte Indregard, Peter Clayton and Lars Tufte for contributions to the benchmark study on oil spill approaches.ReferencesAttema E (2005) Mission Requirements Document for the European Radar Obser-vatory Sentinel-1, Requirement Specification. Technical Report ES-RSESA-SY-0007, issue 1, revision 4, European Space AgencyBauna T, Clayton P (2004) D3c-state of knowledge of potential oil spill hotspots in european waters. Technical report, Oceanides project, European Commis-sion, Archive No. 04-10225-A-Doc, Contract No: EVK2-CT-2003-00177 Brekke C, Solberg A (2005) Oil spill detection by satellite remote sensing. Rem Sens Environ, 95 (1): 1–13Brekke C, Solberg A, Storvik G (2007) Classifying Oil Spills and Look-alikes in ENVISAT ASAR Images. In Proc. ENVISAT Symposium, Montreux, Switzer-land, 23–27 April 2007Brekke C, Solberg AHS (2006) Segmentation and feature extraction for oil spill detection in ENVISAT ASAR images. Int J Rem Sens (submitted)Brekke C, Solberg AHS (2007) Classifiers and Confidence Estimation for Oil Spill Detection in ENVISAT ASAR Images. IEEE Trans Geosci Rem Sens (submitted)Del Frate F, Petrocchi A, Lichtenegger J, Calabresi G (2000) Neural networks for oil spill detection using ERS-SAR data. IEEE Trans Geosci Rem Sens 38 (5): 2282–2287Fiscella B, Giancaspro A, Nirchio F, Pavese P, Trivero P (2000) Oil spill detection using marine SAR images. Int J Rem Sensi 21 (18): 3561–3566Girard-Ardhuin F, Mercier G, Collard F, Garello R (2005) Operational Oil-Slick Characterization by SAR Imagery and Synergistic Data. IEEE J Oceanic En-gineering, 30 (3): 69–74Goodman R (1994) Overview and future trends in oil spill remote sensing. Spill Science & Technology Bulletin 1 (1): 11–21370 A.H.S. Solberg and C. BrekkeHovland HA, Johannessen JA, Digranes G (1994) Slick detection in SAR images.Proc. IGARSS’94, 4: 2038–2040Indregard M, Solberg A, Clayton P (2004) D2-report on benchmarking oil spill recognition approaches and best practice. Technical report, Oceanides project, European Commission, Archive No. 04-10225-A-Doc, Contract No: EVK2-CT-2003-00177Keramitsoglou I, Cartalis C, Kiranoudis C (2006) Automatic identification of oil spills on satellite images. Environmental Modelling & Software 21 (5): 640–652 Nirchio F, Sorgente M, Giancaspro A, Biamino W, Parisato E, Ravera R, Trivero P (2005) Automatic detection of oil spills from SAR images. Int J Rem Sens26 (6): 1157–1174Solberg A, Brekke C, Husøy P (2006) Oil spill detection in Radarsat and Envisat SAR images. IEEE Trans Geosci Rem Sens 45 (2): 746–755Solberg AHS (2005) Automatic oil spill detection and confidence estimation. Proc Int Symp Rem Sens Environ, St. Petersburg, Russia, pp 943–945Solberg AHS, Storvik G, Solberg R, Volden E (1999) Automatic detection of oil spills in ERS SAR images. IEEE Trans Geosci Rem SeDns 37 (4): 1916–1924 Topouzelis K, Karathanassi V, Pavlakis P, Rokos D (2002) Oil spill detection: SAR multi-scale segmentation & object features evaluation. Proc SPIE, Re-mote Sensing of the Ocean and Sea Ice, series 4880, pp 77–87 Trieschmann O, Hunsänger T, Tufte L, Barjenbruch U (2003) Data assimilation of an airborne multiple remote sensor system and of satellite images for the North- and Baltic sea. Proc SPIE 10th Int Symp Rem Sens, pp 51–60Tufte L, Indregard M, Solberg A, Huseby RB (2005) D11-oil spill monitoring guidelines and methodology to combine satellite oil spill recognition with rou-tine airborne surveillance. Technical report, Oceanides project, EC Archive No. 04-10225-A-Doc。