商务统计学+习题 (5)[21页]
- 格式:pdf
- 大小:163.77 KB
- 文档页数:21
商务统计实务参考答案项目1一、名词解释(略)二、选择题1.B2.C3.A4.D5.B6.A7.B8.C9.B10.C三、判断题1.错2.对3.错4.错5.对6.错7.对8.错四、简答题(略)项目2一、名词解释(略)二、选择题1.D2.C3.B4.C三、判断题1.错2.错3.错4.错5.对6.对7.对8.错9.错四、简答题(略)项目3一、名词解释(略)二、选择题1.A2.D3.C4.A5.C6.D7.B三、判断题1.错2.错3.对4.错5.错6.对7.错8.错9.对10.对11.错四、简答题(略)项目4一、名词解释(略)二、选择题1.A2.C3.B4.D5.B6.D三、判断题1.错2.错3.错4.对5.对6.错7.对8.错9.对10.错11.对四、简答题(略)项目5一、名词解释(略)二、选择题1.D2.B3.B4.B5.D6.C7.C8.B9.C三、判断题1.错2.对3.对4.对5.对6.错7.错8.错四、简答题(略)项目6 略项目7一、名词解释(略)二、选择题1.D2.C3.A4.D5.ABD6.ABC三、判断题1.对2.错3.对4.错四、简答题(略)项目8一、名词解释(略)二、选择题1.D2.C3.B4.D5.A三、简答题(略)项目9一、名词解释(略)二、选择题1.A2.B3.B4.A5.B6.A7.D8.B9.C10.A11.D12.A13.B14.A15.C16.B17.D18.B19.B三、判断题1.错2.错3.错4.错5.错6.对7.错8.错9.对四、简答题(略)项目10一、名词解释(略)二、选择题1. B2.C3.C4.A5.B6.A7.D8.B9.D10.B三、判断题1.错2.对3.错4.错5.错6.对四、简答题(略)项目11一、名词解释(略)二、选择题1.C2.B3.D4.C5.D6. B三、判断题1.对2.错3.错4.错5.对6.错7.错四、简答题(略)项目12一、名词解释(略)二、选择题1.A2.C3.B4.B5.D6.A7.B8. C三、判断题1.错2.对3.对4.对5.对6.对7.对8.错9.对四、简答题(略)。
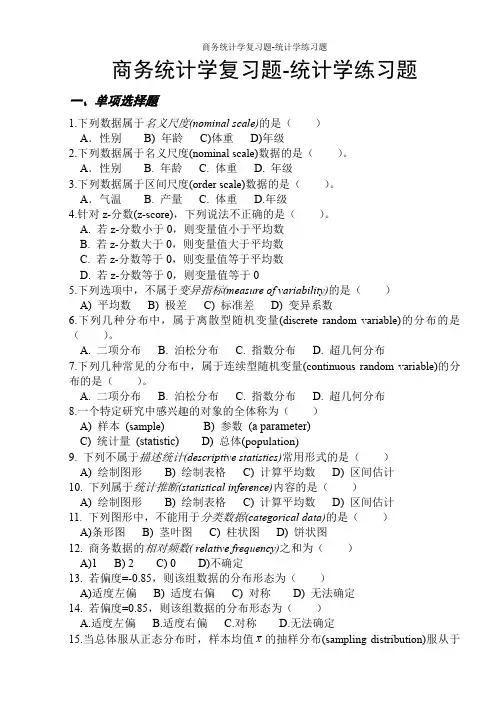
商务统计学复习题-统计学练习题一、单项选择题1.下列数据属于名义尺度(nominal scale)的是()A.性别B) 年龄C)体重D)年级2.下列数据属于名义尺度(nominal scale)数据的是()。
A.性别 B. 年龄 C. 体重 D. 年级3.下列数据属于区间尺度(order scale)数据的是()。
A.气温 B. 产量 C. 体重 D.年级4.针对z-分数(z-score),下列说法不正确的是()。
A. 若z-分数小于0,则变量值小于平均数B. 若z-分数大于0,则变量值大于平均数C. 若z-分数等于0,则变量值等于平均数D. 若z-分数等于0,则变量值等于05.下列选项中,不属于变异指标(measure of variability)的是()A) 平均数B) 极差C) 标准差D) 变异系数6.下列几种分布中,属于离散型随机变量(discrete random variable)的分布的是()。
A. 二项分布B. 泊松分布C. 指数分布D. 超几何分布7.下列几种常见的分布中,属于连续型随机变量(continuous random variable)的分布的是()。
A. 二项分布B. 泊松分布C. 指数分布D. 超几何分布8.一个特定研究中感兴趣的对象的全体称为()A) 样本(sample) B) 参数(a parameter)C) 统计量(statistic)D) 总体(population)9. 下列不属于描述统计(descriptive statistics)常用形式的是()A) 绘制图形B) 绘制表格C) 计算平均数D) 区间估计10. 下列属于统计推断(statistical inference)内容的是()A) 绘制图形B) 绘制表格C) 计算平均数D) 区间估计11. 下列图形中,不能用于分类数据(categorical data)的是()A)条形图B) 茎叶图C) 柱状图D) 饼状图12. 商务数据的相对频数( relative frequency)之和为()A)1 B) 2 C) 0 D)不确定13. 若偏度=-0.85,则该组数据的分布形态为()A)适度左偏B) 适度右偏C) 对称D) 无法确定14. 若偏度=0.85,则该组数据的分布形态为()A.适度左偏B.适度右偏C.对称D.无法确定15.当总体服从正态分布时,样本均值x的抽样分布(sampling distribution)服从于( )。

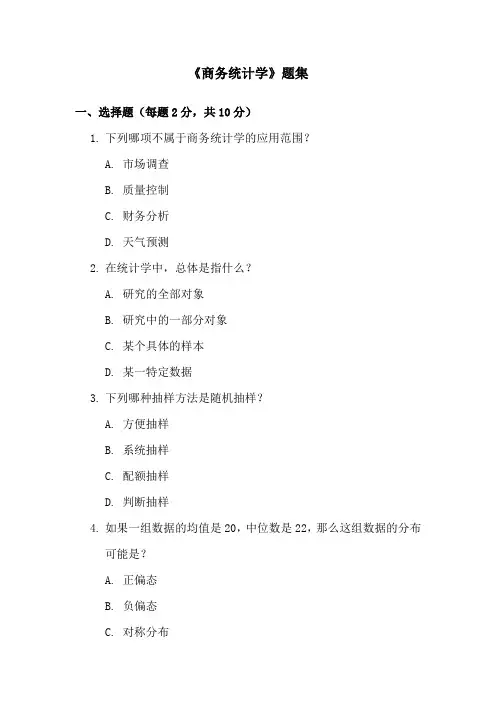
《商务统计学》题集一、选择题(每题2分,共10分)1.下列哪项不属于商务统计学的应用范围?A. 市场调查B. 质量控制C. 财务分析D. 天气预测2.在统计学中,总体是指什么?A. 研究的全部对象B. 研究中的一部分对象C. 某个具体的样本D. 某一特定数据3.下列哪种抽样方法是随机抽样?A. 方便抽样B. 系统抽样C. 配额抽样D. 判断抽样4.如果一组数据的均值是20,中位数是22,那么这组数据的分布可能是?A. 正偏态B. 负偏态C. 对称分布D. 无法确定5.在回归分析中,解释变量和被解释变量分别是什么?A. 因变量和自变量B. 自变量和因变量C. 都是自变量D. 都是因变量二、填空题(每空1分,共10分)1.在统计学中,用来衡量数据分布集中趋势的指标有______、______和______。
2.若一组数据的四分位数Q1=10,Q2=20,Q3=30,则该组数据的中位数为______。
3.在假设检验中,如果P值小于显著性水平α,则我们______原假设。
4.统计表中,频数和频率分别表示数据的______和______。
5.在回归分析中,回归系数的经济意义是解释变量每增加一个单位,被解释变量平均增加______单位。
三、判断题(每题1分,共10分)1.统计学的目的是收集、整理、分析和解释数据,从而帮助人们做出决策。
( )2.在正态分布中,均值、中位数和众数三者相等。
( )3.标准差是衡量数据波动大小的一个重要指标,标准差越大,说明数据的波动越大。
( )4.在假设检验中,如果P值大于显著性水平α,则我们有足够的证据拒绝原假设。
( )5.相关系数r的取值范围是[-1, 1],r=1表示完全正相关,r=-1表示完全负相关。
( )6.如果一组数据的偏度系数大于0,则说明这组数据是正偏态分布。
( )7.在抽样调查中,样本容量越大,抽样误差就越小。
( )8.统计推断是通过样本数据来推断总体的特征。
( )9.移动平均法是一种常用的时间序列预测方法。
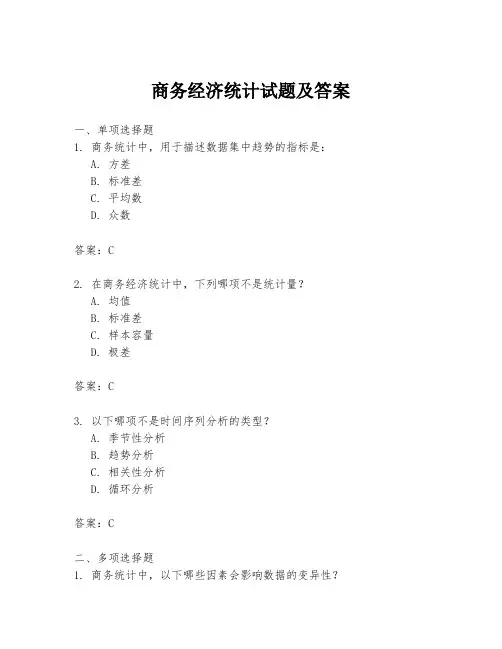
商务经济统计试题及答案一、单项选择题1. 商务统计中,用于描述数据集中趋势的指标是:A. 方差B. 标准差C. 平均数D. 众数答案:C2. 在商务经济统计中,下列哪项不是统计量?A. 均值B. 标准差C. 样本容量D. 极差答案:C3. 以下哪项不是时间序列分析的类型?A. 季节性分析B. 趋势分析C. 相关性分析D. 循环分析答案:C二、多项选择题1. 商务统计中,以下哪些因素会影响数据的变异性?A. 数据的分布形态B. 数据的集中趋势C. 数据的离散程度D. 数据的样本大小答案:A、C2. 在进行商务经济预测时,常用的统计方法包括:A. 回归分析B. 指数平滑法C. 移动平均法D. 季节性调整答案:A、B、C三、简答题1. 简述商务统计中的指数平滑法的基本原理。
答案:指数平滑法是一种时间序列预测方法,它通过对历史数据加权平均来预测未来值。
权重随着时间的递减而递减,即近期的数据比远期的数据在预测中占有更大的权重。
这种方法可以平滑掉数据中的随机波动,从而更好地反映数据的趋势。
2. 描述商务统计中相关系数的计算方法及其意义。
答案:相关系数是用来衡量两个变量之间线性关系强度和方向的统计量。
其计算公式为:\[ r = \frac{\sum (X_i - \bar{X})(Y_i -\bar{Y})}{\sqrt{\sum (X_i - \bar{X})^2 \sum (Y_i -\bar{Y})^2}} \] 其中,\( X_i \) 和 \( Y_i \) 分别是两个变量的观测值,\( \bar{X} \) 和 \( \bar{Y} \) 是它们的平均值。
相关系数的值介于-1和1之间,值越接近1或-1表示变量间的线性关系越强,正值表示正相关,负值表示负相关。
四、计算题1. 假设有一组商务数据,其平均值为100,标准差为15。
如果某次测量结果为120,计算该结果的Z分数。
答案:Z分数的计算公式为:\[ Z = \frac{(X - \mu)}{\sigma} \]其中,\( X \) 是测量结果,\( \mu \) 是平均值,\( \sigma \) 是标准差。
精选全文完整版(可编辑修改)《商务统计》试题5------------------------------------------------------------------------------------------------------------------------一、判断题(每题1分,共10分)1.应用切比雪夫定理估计与平均数的距离在z个标准差之内的数据项所占比例时,z的取值可以是任意正数( )。
2.条形图和直方图都可以用于描述分类数据的频数分布、相对频数分布或百分比频数分布( )。
3.在样本容量一定的情况下,为了确保更高的置信度,置信区间的宽度必须变大( )。
4.事件A与其补A c是互斥的( )。
5.无论是单侧检验还是双侧检验,如果p值≤α,则拒绝原假设H0( )。
6.对于简单随机样本,样本均值x̅的数学期望、标准差受到样本容量n的影响 ( )。
7.在联列表中,两个变量必须都是分类变量或者都是数值型变量( )。
8.当分类数据用数值表示时,可以进行有意义的算术运算( )。
9.在满足一定条件时,可以用正态分布近似计算二项分布 ( )。
10.方差分析仅能用于实验性研究得到的数据而不能用于观测性研究得到的数据( )。
二、单项选择题(每题2分,共30分)1.由于改变生产方法所需的时间和成本都很大,所以在一种新方法实施之前,制造负责人必须使管理人员确信,推荐的制造方法能降低成本。
目前生产方法的平均成本是每小时22美元。
一项调研工作是在样本生产期同,测量新方法的成本。
以下假设合适的是( )。
A. H0:μ≥22 H a:μ<22B.H0:μ≤22 H a:μ>22C.H0:μ>22 H a:μ≤22D.H0:μ<22 H a:μ≥222.以下关于众数的说法错误的是( )。
A.众数是数据集中出现频率最高的数据值B.众数仅适用于数值型数据C.众数是一种位置度量指标D.众数有可能存在两个或更多3.以下关于事件的概率说法错误的是( )。

4.49 4.33 (a)H = husband watching W= wife watching P(H\W) =商务统计习题解答4.41 (7)(3)(3)= 63〃! _ 7! _(7)(6)(5)X!(〃一 X )! 4!(3!)(3)(2)(1)P(WIH)・P(H) P(W I H)・P(H) + F(W 1H')・P(H')0.4 • 0.6 0.24 2 八 y0.4 • 0.6 + 0.3 • 0.4 - 036 ~ 3 - *(b) P(IV) = 0.24+0.12 =0.36 5.11 If p-0.25 and n = 5,(a) RX= 5) =0.0010(b) I\X> 4) = RX=4) + RX=5) = 0.0146+0.0010 =0.0156(c) 0) = 0.2373(d) F\X < 2) = RX=0) + RX= 1) + RX=2)=0.2373 + 0.3955 + 0.2637 = 0.89655.21(a) 0) = 0.0907 (b) RX= 1)=0.2177(c) I\X> 2)=0.6916 (d) RXv 3) = 0.56976.11 (a) P(X v 180) = P(Z v — 1.50) = 0.0668(b) P(180 v X v 300) = P(— 1.50 v Z v 1.50) = 0.9332 - 0.0668 = 0.8664(c) P( 110 v X v 180) = P(— 3.25 v Z v — 1.50) = 0.0668 - 0.00058 =0.06622(d) P(X v A) = 0.01 P(Z v - 2.33) = 0.01A = 240 - 2.33(40) = 146.80 seconds6.19(a) mean = 678.85, median = 675.5, range = 54,6(Sx ) =88.5734, interquartile range = 20, 1.33(S X ) = 19.6338 Since the mean is approximately equal to the median and the interquartile range isvery close to 1.33 times the standard deviation, the data appear to be approximatelynormally distributed.(b)710X±Z- 350±1.96- 100V64 325.5 < 辱 374.50The normal probability plot suggests that the data appear to be approximately normally distributed. 7.9 (a)P(叉 < 0.75) = P(Z < -1.3693) = 0.0855 (b)P(0.70 <X < 0.90) = P(—2.7386 <Z<2.7386) = 0.9938 (c) P(A< X < B) = P(- L2816 < Z < 1.2816) = 0.80A =0.8-1.2816 (0.0365) = 0.7532 B= 0.8 +1.2816 (0.0365) = 0.8468(d) P(X <A) = P(Z< 1.2816) = 0.90 A = 0.8 +1.2816 (0.0365) = 0.8468Note: The above answers are obtained using PHStat. They may be slightly different whenTable E.2 is used.7.19 (a) P(0.15 vp v0.25) = P(- 1.25 <Z< 1.25)=0.7887(b) P(A<p<B) = P(- 1.6449 <Z< 1.6449) = 0.90A = 0.2 - 1.6449(0.04) = 0.1342B = 0.2 + 1.6449(0.04) = 0.2658(c) P(A v p v B) = P(- 1.960<Z< 1.960) = 0.95A =0.2 - 1.960(0.04) = 0.12160.2+ 1.96(0.04) = 0.27848.8 (a)(b) No. The manufacturer cannot support a claim that the bulbs last an average 400 hours.Based on the data from the sample, a mean of 400 hours would represent a distanceof 4 standard deviations above the sample mean of 350 hours.(c) No. Since is known and n = 64, from the Central Limit Theorem, we may assumethat the sampling distribution of X is approximately normal.(d) The confidence interval is narrower based on a process standard deviation of 80hours rather than the original assumption of 100 hours.Normal Probability Plot690 680670660700650 -2 -1.5 -1 -0.5 0 0.51 Z Value 1.5 2a loo sMp(a)8.18 (a) X±F・S “,c 八4.6024 -7= = 23 ±2.0739•― 4nV23 $21.01 <//< $24.99一cr80~F= = 350 ± 1.96 • —f=X ± Z ・4tr V64(b) Based on the smaller standard deviation, a mean of 400 hours would represent adistance of 5 standard deviations above the sample mean of 350 hours. No,the manufacturer cannot support a claim that the bulbs have a mean life of400 hours.(b) You can be 95% confident that the mean bounced check fee for the population issomewhere between $21.01 and $24.99.又◊又 (\n 77 . 7〔P(l ? P n77 . j QA /0.77(0.23)8.28 (a) p= 0.77 p ± Z • ------------------------- =().77 ±1.96」 ------------------------------\ n V 10000.74 <7t< 0.80(b)p = 0.77 p ± Z •、格王=0.77 ± 1,645/wWV n v 10000.75 <7T< 0.79(c)The 95% confidence interval is wider. The loss in precision reflected as a widerconfidence interval is the price you have to pay to achieve a higher level ofconfidence.Z2<T2 1.962 - 40028.38 (a) n =——=-------------- -—— =245.86 Use n = 246& 50~, Z2cr2 1.962 -4002八”八TT八睥(b) n = ——-— = --------------- ---- =983.41 Use n = 984& 2529.30 (a) Ho: " =375 hours. The mean life of the manufacturers light bulbs isequal to 375 hours.H\: // #375 hours. The mean life of the manufacturer9s light bulbs differs from375 hours.Decision rule: Reject 仇if Z v - 1.96 or Z > + 1.96.Test statistic: Z =与人笔尹=-2.00Decision: Since Z c^ = 一2.00 is below the critical bound of - 1.96, reject There isenough evidence to conclude that the mean life of the manufacturer's light bulbsdiffers from 375 hours.(b) ^-value = 2(0.0228) = 0.0456.Interpretation: The probability of getting a sample of 64 light bulbs that will yielda mean life that is farther away from the hypothesized population mean than thissample is 0.0456-(c)Test statistic: t = s 商 315.33/应y!n<64 (d) The results are the same. The confidence interval formed does not include thehypothesized value of 375 hours.9.58 (a) H Q : // < 400 The mean life of the batteries is not more than 400 hours. H 、: 〃> 400 The mean life of the batteries is more than 400 hours.X 一以 473.46-400 t “ --------------- 7= = 7= = 1 .230 / s/y/n 210.77/J13 Decision: Since t < 1.7823, do not reject H 。
商务统计试题及答案### 商务统计试题及答案#### 一、选择题1. 统计数据收集的方法不包括以下哪项?- A. 观察法- B. 实验法- C. 调查法- D. 假设法答案:D2. 以下哪项不是描述性统计分析的内容?- A. 数据的分类- B. 数据的汇总- C. 数据的推断- D. 数据的图表展示答案:C3. 在统计学中,中位数是指:- A. 数据集中出现次数最多的数值- B. 数据集的算术平均值- C. 将数据集从小到大排列后位于中间位置的数值 - D. 所有数据的和除以数据的个数答案:C#### 二、简答题1. 解释什么是标准差,并简述其在商务统计中的重要性。
标准差是衡量一组数据离散程度的统计量,它表示数据集中的数值与平均值的偏差平方的平均数的平方根。
在商务统计中,标准差用于评估数据的波动性,帮助决策者了解业务风险和市场波动。
2. 描述相关系数的概念及其在商务分析中的应用。
相关系数是度量两个变量之间线性关系强度和方向的统计指标。
在商务分析中,相关系数可以用来评估不同因素对业务结果的影响,例如,销售额与广告支出之间的关系。
#### 三、计算题1. 给定以下数据集:10, 12, 15, 20, 25, 请计算平均值、中位数和标准差。
- 平均值 = (10 + 12 + 15 + 20 + 25) / 5 = 18- 中位数 = 15(数据集从小到大排列后位于中间位置的数值)- 标准差= √[(Σ(xi - 平均值)²) / n] = √[(10 - 18)² + (12 - 18)² + ... + (25 - 18)²] / 5 ≈ 5.392. 假设某公司连续5个月的销售额分别为:30万、35万、40万、45万和50万。
计算这5个月的平均销售额和销售额的增长趋势。
- 平均销售额 = (30 + 35 + 40 + 45 + 50) / 5 = 40万- 销售额的增长趋势可以通过计算每月销售额的增长率来分析,例如,从第一个月到第二个月的增长率为 (35 - 30) / 30 * 100% = 16.67%。
商务经济统计试题及答案一、单项选择题(每题2分,共20分)1. 商务经济统计的主要研究对象是什么?A. 社会经济现象B. 社会文化现象C. 自然现象D. 政治现象答案:A2. 下列哪项不是统计数据的来源?A. 人口普查B. 社会调查C. 历史记录D. 个人猜测答案:D3. 在商务经济统计中,下列哪项是描述性统计分析的内容?A. 预测未来趋势B. 描述数据特征C. 制定政策D. 进行假设检验答案:B4. 统计学中的“参数”是指什么?A. 样本数据B. 总体数据C. 样本容量D. 总体数量答案:B5. 以下哪个概念不是概率论的基本概念?A. 随机事件B. 概率C. 总体D. 样本答案:C6. 商务经济统计中,平均数通常用来衡量数据的什么?A. 集中趋势B. 离散程度C. 偏态分布D. 正态分布答案:A7. 在统计学中,标准差是用来衡量什么的?A. 集中趋势B. 离散程度C. 平均值D. 偏态分布答案:B8. 下列哪项是统计学中用于描述数据分布形状的指标?A. 平均数B. 标准差C. 众数D. 方差答案:C9. 在商务经济统计中,相关系数的取值范围是多少?A. -1到1B. 0到1C. 1到10D. -10到10答案:A10. 以下哪种图表最适合展示时间序列数据?A. 条形图B. 饼图C. 折线图D. 散点图答案:C二、多项选择题(每题3分,共15分)1. 商务经济统计中常用的数据收集方法包括哪些?A. 问卷调查B. 观察法C. 实验法D. 抽样调查答案:ABD2. 下列哪些是描述数据集中趋势的统计量?A. 平均数B. 中位数C. 众数D. 方差答案:ABC3. 在商务经济统计中,下列哪些因素会影响数据的代表性?A. 样本容量B. 抽样方法C. 样本误差D. 总体大小答案:AB4. 统计学中,下列哪些方法可以用来检验假设?A. t检验B. 卡方检验C. 回归分析D. 方差分析答案:ABD5. 在商务经济统计中,下列哪些图表可以用来展示数据的分布?A. 条形图B. 直方图C. 箱线图D. 散点图答案:ABC三、简答题(每题5分,共20分)1. 简述商务经济统计在企业决策中的作用。
商务统计试题及答案一、单项选择题(每题2分,共20分)1. 商务统计中,数据的收集方法不包括以下哪一项?A. 观察法B. 实验法C. 调查法D. 推算法答案:D2. 在统计学中,总体是指:A. 研究对象的全体B. 研究对象的一部分C. 研究对象的个体D. 研究对象的样本答案:A3. 下列哪个选项不是描述数据集中趋势的统计量?A. 平均数B. 中位数C. 方差D. 众数答案:C4. 在商务统计中,相关系数的取值范围是:A. -1到1之间B. 0到1之间C. 1到10之间D. 任何实数答案:A5. 以下哪种图表最适合展示时间序列数据的变化趋势?A. 条形图B. 饼图C. 折线图D. 散点图答案:C6. 假设检验的目的是:A. 确定总体参数B. 估计总体参数C. 验证样本数据D. 验证总体参数答案:D7. 在回归分析中,自变量和因变量之间的关系是:A. 正相关B. 负相关C. 无关D. 线性关系答案:D8. 下列哪个选项不是统计分析中常见的数据类型?A. 定类数据B. 定序数据C. 定距数据D. 定性数据答案:D9. 标准差是衡量数据离散程度的统计量,其计算公式为:A. 平均数的平方B. 平均数的平方根C. 方差的平方根D. 方差的倒数答案:C10. 以下哪个统计量用于衡量数据的偏态?A. 均值B. 方差C. 偏度D. 峰度答案:C二、多项选择题(每题3分,共15分)1. 下列哪些是商务统计中常用的数据收集方法?A. 观察法B. 实验法C. 调查法D. 推算法答案:ABC2. 在商务统计中,描述数据集中趋势的统计量包括:A. 平均数B. 中位数C. 方差D. 众数答案:ABD3. 以下哪些是描述数据离散程度的统计量?A. 标准差B. 方差C. 偏度D. 峰度答案:AB4. 在统计学中,总体参数和样本统计量的区别在于:A. 总体参数是固定的B. 样本统计量是估计值C. 总体参数是估计值D. 样本统计量是固定的答案:AB5. 下列哪些是商务统计中常见的数据类型?A. 定类数据B. 定序数据C. 定距数据D. 定性数据答案:ABC三、判断题(每题2分,共10分)1. 商务统计中,数据收集的方法只有调查法和观察法。
商务统计学您的姓名: [填空题] *_________________________________专业: [填空题] *_________________________________学号: [填空题] *_________________________________下列属于统计基本指标的是()。
[单选题] *人均粮食产量人口出生率人口数和粮食产量(正确答案)人均消费水平答案解析:无当我们研究某地区人口状况时,每人的文化程度、年龄、性别等方面均不同,这体现了()。
[单选题] *总体的大量性总体的差异性(正确答案)总体的同质性总体的社会性答案解析:无对连续大量生产的某种小件产品进行产品质量检查,最恰当的调查方法是()。
[单选题] *全面调查抽样调查(正确答案)重点调查典型调查答案解析:无在工业生产设备普查中,调查单位是()。
[单选题] *每个工业企业每台设备工业企业的每台设备每一台工业生产设备(正确答案)答案解析:无下列按品质标志分组的是()。
[单选题] *在校学生按性别分组(正确答案)职工按工资水平分组企业按职工人数规模分组人口按年龄分组答案解析:无总量指标按其反映的内容不同,可分为()。
[单选题] *总体总量和总体标志总量(正确答案)总体单位总量和标志单位总量总体指标和综合指标价值总量和实物总量答案解析:无某厂某年职工劳动生产率为20000元,是历史最高水平的1.2倍。
这里的1.2倍是()。
[单选题] *比例相对数计划完成相对数强度相对数动态相对数(正确答案)答案解析:无用有名数来表现相对指标的,主要是()。
[单选题] *结构相对指标结构相对指标强度相对指标(正确答案)比较相对指标答案解析:无品合格率指标是()。
[单选题] *比例相对指标结构相对指标(正确答案)比较相对指标强度相对指标答案解析:无如果变量x和变量y之间的相关系数为-1,这说明两个变量之间是()。
[单选题] *低度相关关系完全相关关系(正确答案)高度相关关系完全不相关答案解析:无标准差系数抽象了() [单选题] *总体指标数值大小的影响总体单位数多少的影响各组单位数占总体单位总数比重的影响平均水平高低的影响(正确答案)答案解析:无某班四名学生数学考试成绩分别为65分、71分、80分和87分,这四个数字是()。
CHAPTER 1—DATA AND STATISTICSMULTIPLE CHOICE1. In a questionnaire, respondents are asked to mark their gender as male or female. Gender is an exampleof thea. ordinal scaleb. nominal scalec. ratio scaled. interval scaleANS: B PTS: 1 TOP: Descriptive Statistics2. The nominal scale of measurement has the properties of thea. ordinal scaleb. only interval scalec. ratio scaled. None of these alternatives is correct.ANS: D PTS: 1 TOP: Descriptive Statistics3. The scale of measurement that is used to rank order the observation for a variable is called thea. ratio scaleb. ordinal scalec. nominal scaled. interval scaleANS: B PTS: 1 TOP: Descriptive Statistics4. Some hotels ask their guests to rate the hotel's services as excellent, very good, good, and poor. This is anexample of thea. ordinal scaleb. ratio scalec. nominal scaled. interval scaleANS: A PTS: 1 TOP: Descriptive Statistics5. The ordinal scale of measurement has the properties of thea. ratio scaleb. interval scalec. nominal scaled. ratio and interval scalesANS: C PTS: 1 TOP: Descriptive Statistics6. The ratio scale of measurement has the properties ofa. only the ordinal scaleb. only the nominal scalec. the rank scaled. the interval scaleANS: D PTS: 1 TOP: Descriptive Statistics7. Temperature is an example of a variable that usesa. the ratio scaleb. the interval scalec. the ordinal scaled. either the ratio or the ordinal scaleANS: B PTS: 1 TOP: Descriptive Statistics8. The interval scale of measurement has the properties of thea. ratio and nominal scalesb. ratio and ordinal scalesc. ratio scaled. None of these alternatives is correct.ANS: D PTS: 1 TOP: Descriptive Statistics9. Arithmetic operations are inappropriate fora. the ratio scaleb. the interval scalec. both the ratio and interval scalesd. the nominal scaleANS: D PTS: 1 TOP: Descriptive Statistics10. Income is an example of a variable that uses thea. ratio scaleb. interval scalec. nominal scaled. ordinal scaleANS: A PTS: 1 TOP: Descriptive Statistics11. Data obtained from a nominal scalea. must be alphabeticb. can be either numeric or nonnumericc. must be numericd. must rank order the dataANS: B PTS: 1 TOP: Descriptive Statistics12. The scale of measurement that has an inherent zero value defined is thea. ratio scaleb. nominal scalec. ordinal scaled. interval scaleANS: A PTS: 1 TOP: Descriptive Statistics13. Arithmetic operations are appropriate fora. only the ratio scaleb. only the interval scalec. the nominal scaled. None of these alternatives is correct.ANS: D PTS: 1 TOP: Descriptive Statistics14. Quantitative data refers to data obtained with a(n)a. ordinal scaleb. nominal scalec. either interval or ratio scaled. only interval scaleANS: C PTS: 1 TOP: Descriptive Statistics15. Dataa. are always be numericb. are always nonnumericc. are the raw material of statisticsd. None of these alternatives is correct.ANS: C PTS: 1 TOP: Descriptive Statistics16. The entities on which data are collected area. elementsb. populationsc. samplesd. None of these alternatives is correct.ANS: A PTS: 1 TOP: Descriptive Statistics17. The set of measurements collected for a particular element is (are) calleda. variablesb. observationsc. samplesd. None of these alternatives is correct.ANS: B PTS: 1 TOP: Descriptive Statistics18. A characteristic of interest for the elements is called a(n)a. sampleb. data setc. variabled. None of these alternatives is correct.ANS: C PTS: 1 TOP: Descriptive Statistics19. All the data collected in a particular study are referred to as thea. inferenceb. variablec. data setd. None of these alternatives is correct.ANS: C PTS: 1 TOP: Descriptive Statistics20. Another name for "observations" isa. viewsb. variablesc. casesd. None of these alternatives is correct.ANS: C PTS: 1 TOP: Descriptive Statistics21. Quantitative dataa. are always nonnumericb. may be either numeric or nonnumericc. are always numericd. None of these alternatives is correct.ANS: C PTS: 1 TOP: Descriptive Statistics22. In a questionnaire, respondents are asked to mark their gender as male or female. Gender is an exampleof aa. qualitative variableb. quantitative variablec. qualitative or quantitative variable, depending on how the respondents answered thequestiond. None of these alternatives is correct.ANS: A PTS: 1 TOP: Descriptive Statistics23. The number of cases will always be the same as the number ofa. variablesb. elementsc. data setsd. dataANS: B PTS: 1 TOP: Descriptive Statistics24. Qualitative dataa. must be numericb. must be nonnumericc. cannot be numericd. may be either numeric or nonnumericANS: D PTS: 1 TOP: Descriptive Statistics25. Qualitative dataa. indicate either how much or how manyb. cannot be numericc. are labels used to identify attributes of elementsd. must be nonnumericANS: C PTS: 1 TOP: Descriptive Statistics26. Ordinary arithmetic operations are meaningfula. only with qualitative datab. only with quantitative datac. either with quantitative or qualitative datad. None of these alternatives is correct.ANS: B PTS: 1 TOP: Descriptive Statistics27. Social security numbers consist of numeric values. Therefore, social security is an example ofa. a quantitative variableb. either a quantitative or a qualitative variablec. an exchange variabled. a qualitative variableANS: D PTS: 1 TOP: Descriptive Statistics28. Temperature is an example ofa. a qualitative variableb. a quantitative variablec. either a quantitative or qualitative variabled. neither a quantitative nor qualitative variableANS: B PTS: 1 TOP: Descriptive Statistics29. For ease of data entry into a university database, 1 denotes that the student is an undergraduate and 2indicates that the student is a graduate student. In this case data area. qualitativeb. quantitativec. either qualitative or quantitatived. neither qualitative nor quantitativeANS: A PTS: 1 TOP: Descriptive Statistics30. Arithmetic operations are inappropriate fora. qualitative datab. quantitative datac. both qualitative and quantitative datad. large data setsANS: A PTS: 1 TOP: Descriptive Statistics31. Income is an example ofa. qualitative datab. either qualitative or quantitative datac. dollar datad. quantitative dataANS: D PTS: 1 TOP: Descriptive Statistics32. Data collected at the same, or approximately the same, point in time area. time series datab. approximate time series datac. crossectional datad. approximate dataANS: C PTS: 1 TOP: Descriptive Statistics33. Data collected over several time periods area. time series datab. time controlled datac. crossectional datad. time crossectional dataANS: A PTS: 1 TOP: Descriptive Statistics34. Statistical studies in which researchers do not control variables of interest area. experimental studiesb. uncontrolled experimental studiesc. not of any valued. observational studiesANS: D PTS: 1 TOP: Descriptive Statistics35. Statistical studies in which researchers control variables of interest area. experimental studiesb. control observational studiesc. non-experimental studiesd. observational studiesANS: A PTS: 1 TOP: Descriptive Statistics36. The summaries of data, which may be tabular, graphical, or numerical, are referred to asa. inferential statisticsb. descriptive statisticsc. statistical inferenced. report generationANS: B PTS: 1 TOP: Descriptive Statistics37. Statistical inferencea. refers to the process of drawing inferences about the sample based on the characteristics ofthe populationb. is the same as descriptive statisticsc. is the process of drawing inferences about the population based on the information takenfrom the sampled. is the same as a censusANS: C PTS: 1 TOP: Descriptive Statistics38. The collection of all elements of interest in a particular study isa. the populationb. the samplingc. statistical inferenced. descriptive statisticsANS: A PTS: 1 TOP: Descriptive Statistics39. A portion of the population selected to represent the population is calleda. statistical inferenceb. descriptive statisticsc. a censusd. a sampleANS: D PTS: 1 TOP: Statistical Inference40. In a sample of 800 students in a university, 240, or 30%, are Business majors. The 30% is an example ofa. a sampleb. a populationc. statistical inferenced. descriptive statisticsANS: D PTS: 1 TOP: Descriptive Statistics41.In a sample of 400 students in a university, 80, or 20%, are Business majors. Based on the aboveinformation, the school's paper reported that "20% of all the students at the university are Business majors." This report is an example ofa. a sampleb. a populationc. statistical inferenced. descriptive statisticsANS: C PTS: 1 TOP: Descriptive Statistics42. Five hundred residents of a city are polled to obtain information on voting intentions in an upcoming cityelection. The five hundred residents in this study is an example of a(n)a. censusb. samplec. observationd. populationANS: B PTS: 1 TOP: Descriptive Statistics43. A statistics professor asked students in a class their ages. On the basis of this information, the professorstates that the average age of all the students in the university is 24 years. This is an example ofa. a censusb. descriptive statisticsc. an experimentd. statistical inferenceANS: D PTS: 1 TOP: Statistical Inference44. The owner of a factory regularly requests a graphical summary of all employees' salaries. The graphicalsummary of salaries is an example ofa. a sampleb. descriptive statisticsc. statistical inferenced. an experimentANS: B PTS: 1 TOP: Descriptive Statistics45. The Department of Transportation of a city has noted that on the average there are 17 accidents per day.The average number of accidents is an example ofa. descriptive statisticsb. statistical inferencec. a sampled. a populationANS: A PTS: 1 TOP: Statistical Inference46. The process of analyzing sample data in order to draw conclusions about the characteristics of apopulation is calleda. descriptive statisticsb. statistical inferencec. data analysisd. data summarizationANS: B PTS: 1 TOP: Descriptive Statistics47. In a post office, the mailboxes are numbered from 1 to 4,500. These numbers representa. qualitative datab. quantitative datac. either qualitative or quantitative datad. since the numbers are sequential, the data is quantitativeANS: A PTS: 1 TOP: Descriptive Statistics48. The average age in a sample of 190 students at City College is 22. As a result of this sample, it can beconcluded that the average age of all the students at City Collegea. must be more than 22, since the population is always larger than the sampleb. must be less than 22, since the sample is only a part of the populationc. could not be 22d. could be larger, smaller, or equal to 22ANS: D PTS: 1 TOP: Descriptive Statistics49.Since a sample is a subset of the population, the sample meana. is always smaller than the mean of the populationb. is always larger than the mean of the populationc. must be equal to the mean of the populationd. can be larger, smaller, or equal to the mean of the populationANS: D PTS: 1 TOP: Descriptive Statistics50. The scale of measurement that is simply a label for the purpose of identifying the attribute of an elementis thea. ratio scaleb. nominal scalec. ordinal scaled. interval scaleANS: B PTS: 1 TOP: Descriptive Statistics51. In a data set, the number of elements will always be the same as the number ofa. independent variablesb. observationsc. data pointsd. dependent variablesANS: B PTS: 1 TOP: Descriptive Statistics52. Which of the following is not a scale of measurement?a. nominalb. ordinalc. intervald. primalANS: D PTS: 1 TOP: Descriptive Statistics53. Which of the following is a scale of measurement?a. ratiob. primalc. divisionald. remedialANS: A PTS: 1 TOP: Descriptive Statistics54. Which scale of measurement can be either numeric or nonnumeric?a. nominalb. ratioc. intervald. None of these alternatives is correct.ANS: A PTS: 1 TOP: Descriptive Statistics55. Which of the following variables use the ratio scale of measurement?a. social security numberb. temperaturec. genderd. incomeANS: D PTS: 1 TOP: Descriptive Statistics56. The weight of a candy bar in ounces is an example ofa. qualitative datab. either qualitative or quantitative datac. weight datad. quantitative dataANS: D PTS: 1 TOP: Descriptive Statistics57. The height of a building, measured in feet, is an example ofa. qualitative datab. either qualitative or quantitative datac. feet datad. quantitative dataANS: D PTS: 1 TOP: Descriptive Statistics58. An interviewer has made an error in recording the data. This type of error is known asa. an experimental errorb. a data acquisition errorc. a non-experimental errord. a conglomerate errorANS: B PTS: 1 TOP: Descriptive Statistics59. Census refers toa. an experimental study to collect data on the entire populationb. an experimental study to collect data on a samplec. a survey to collect data on a sampled. a survey to collect data on the entire populationANS: D PTS: 1 TOP: Descriptive Statistics60. In experimental studies, the variable of interesta. is not controlledb. is controlledc. must be numericald. cannot be numericalANS: B PTS: 1 TOP: Descriptive Statistics61. In observational studies, the variable of interesta. is not controlledb. is controlledc. must be numericald. cannot be numericalANS: A PTS: 1 TOP: Descriptive Statistics62. How many scales of measurement exist?a. 1b. 2c. 3d. 4ANS: D PTS: 1 TOP: Descriptive Statistics63. Which of the following can be classified as quantitative data?a. interval and ordinalb. ratio and ordinalc. nominal and ordinald. interval and ratioANS: D PTS: 1 TOP: Descriptive Statistics64. The sample sizea. can be larger than the population sizeb. is always smaller than the population sizec. can be larger or smaller than the population sized. is always equal to the size of the populationANS: B PTS: 1 TOP: Descriptive Statistics65. A population isa. the same as a sampleb. the selection of a random samplec. the collection of all items of interest in a particular studyd. always the same size as the sampleANS: C PTS: 1 TOP: Descriptive Statistics66. In a random sample of 200 items, 5 items were defective. An estimate of the percentage of defectiveitems in the population isa. 5.0%b. 2.5%c. 200d. 10.0%ANS: B PTS: 1 TOP: Descriptive Statistics67. On a street, the houses are numbered from 300 to 450. The house numbers are examples ofa. qualitative datab. quantitative datac. both quantitative and qualitative datad. neither quantitative nor qualitative dataANS: A PTS: 1 TOP: Descriptive Statistics68. A survey to collect data on the entire population isa. a censusb. a samplec. a populationd. an inferenceANS: A PTS: 1 TOP: Descriptive Statistics69. In Excel, a worksheet that displays the data for the problem and shows the results of the analysis isa. a formula worksheetb. a value worksheetc. an absolute worksheetd. a descriptive worksheetANS: B PTS: 1 TOP: Descriptive Statistics70. In Excel, a worksheet that displays the formulas used to create the results is aa. results worksheetb. formula worksheetc. value worksheetd. sample worksheetANS: B PTS: 1 TOP: Descriptive StatisticsNARRBEGIN: Exhibit 1-1Exhibit 1-1In a recent study based upon an inspection of 200 homes in Daisy City, 80 were found to violate one or more city codes.NARREND71. Refer to Exhibit 1-1. The city manager released a statement that 40% of Daisy City's 2,000 homes are inviolation of city codes. The manager's statement is an example ofa. a censusb. an experimentc. descriptive statisticsd. statistical inferenceANS: D PTS: 1 TOP: Descriptive StatisticsNAR: Exhibit 1-172. Refer to Exhibit 1-1. The Daisy City study described above is an example of the use of aa. censusb. samplec. probabilityd. populationANS: B PTS: 1 TOP: Descriptive StatisticsNAR: Exhibit 1-173. Refer to Exhibit 1-1. The manager's statement that 40% of Daisy City's 2,000 homes are in violation ofcity codes isa. an exactly correct statementb. only an approximation, since it is based upon sample informationc. obviously wrong, since it is based upon a study of only 200 homesd. None of these alternatives is correct.ANS: B PTS: 1 TOP: Descriptive StatisticsNAR: Exhibit 1-1NARRBEGIN: Exhibit 1-2Exhibit 1-2In a sample of 1,600 registered voters, 912, or 57%, approve of the way the President is doing his job.NARREND74. Refer to Exhibit 1-2. The 57% approval is an example ofa. a sampleb. descriptive statisticsc. statistical inferenced. a populationANS: B PTS: 1 TOP: Descriptive StatisticsNAR: Exhibit 1-275. Refer to Exhibit 1-2. A political pollster states: "Fifty-seven percent of all voters approve of thePresident." This statement is an example ofa. a sampleb. descriptive statisticsc. statistical inferenced. a populationANS: C PTS: 1 TOP: Descriptive StatisticsNAR: Exhibit 1-2NARRBEGIN: Exhibit 1-3Exhibit 1-3Part of the data bank of a corporation is shown below.EmployeeNumber Gender DepartmentYears ofExperienceEmployee Rank(1 - 10)YearlySalary23450 Male Accounting 15 10 $ 52,443.00 34568 Female IT 24 7 $111,239.00 23123 Female Personnel 20 4 $ 84,473.00 23007 Male Finance 9 1 $ 47,519.00NARREND76. Refer to Exhibit 1-3. Employee Number is an example of ________ data.a. nominalb. ordinalc. intervald. ratioANS: A PTS: 1 TOP: Descriptive StatisticsNAR: Exhibit 1-377. Refer to Exhibit 1-3. Gender is an example of ________ data.a. nominalb. ordinalc. intervald. ratioANS: A PTS: 1 TOP: Descriptive StatisticsNAR: Exhibit 1-378. Refer to Exhibit 1-3. Years of Experience is an example of ________ data.a. nominalb. ordinalc. intervald. ratioANS: D PTS: 1 TOP: Descriptive StatisticsNAR: Exhibit 1-379. Refer to Exhibit 1-3. Employee Rank is an example of ________ data.a. nominalb. ordinalc. intervald. ratioANS: B PTS: 1 TOP: Descriptive StatisticsNAR: Exhibit 1-380. Refer to Exhibit 1-3. Yearly Salary is an example of ________ data.a. nominalb. ordinalc. intervald. ratioANS: D PTS: 1 TOP: Descriptive StatisticsNAR: Exhibit 1-3NARRBEGIN: Exhibit 1-4Exhibit 1-4In many universities, students evaluate their professors by means of answering a questionnaire. Assumea questionnaire is distributed to a class of 45 students. Students are asked to answer the following:1. Sex2. Race (Black, White, Other)3. Age4. Number of hours completed5. Grade point average6. My instructor is a very effective teacher1 2 3 4 5strongly agree moderately agree neutral moderately disagree strongly disagree NARREND81. Refer to Exhibit 1-4. How many elements are in the above data set?a. 5b. 6c. 3d. 45ANS: D PTS: 1 TOP: Descriptive StatisticsNAR: Exhibit 1-482. Refer to Exhibit 1-4. How many variables are in this data set?a. 3b. 4c. 5d. 6ANS: D PTS: 1 TOP: Descriptive StatisticsNAR: Exhibit 1-483. Refer to Exhibit 4-1. How many observations are in this data set?a. 5b. 6c. 3d. 45ANS: D PTS: 1 TOP: Descriptive StatisticsNAR: Exhibit 1-4PROBLEM1. After graduation ceremonies at a university, six graduates were asked whether they were in favor of(identified by 1) or against (identified by 0) abortion. Some information about these graduates is shown below.Graduate Sex Age Abortion Issue Class RankMarissa F 24 1 1Jason M 22 1 2Wendy F 41 0 3Edward M 38 0 20Jennifer F 25 1 4Tim M 19 0 8a. How many elements are in the data set?b. How many variables are in the data set?c. How many observations are in the data set?d. Which of the above variables (Sex, Age, Abortion Issue, Class rank) are qualitative and whichare quantitative variables?e. Are arithmetic operations appropriate for the variable "abortion issue"?ANS:a. 6b. 4c. 6d. Sex: qualitativeAge: quantitativeAbortion Issue: qualitativeClass Rank: qualitativee. NoPTS: 1 TOP: Descriptive Statistics2. A recent issue of Fortune Magazine reported that the following companies had the lowest sales peremployee among the Fortune 500 companies.Sales per Employee (In $1,000s) Sales RankCompanySeagate Technology 42.20 285SSMC 42.19 414Russel 41.99 480Maxxam 40.88 485Dibrell Brothers 22.56 470a. How many elements are in the above data set?b. How many variables are in the above data set?c. How many observations are in the above data set?d. Name the variables and indicate whether they are qualitative or quantitative.ANS:a. 5b. 2c. 5d. Sales per employee: quantitative; Sales rank: qualitativePTS: 1 TOP: Descriptive Statistics3. The following shows the temperatures (high, low) and weather conditions in a given Sunday for someselected world cities. For the weather conditions, the following notations are used: c = clear; cl = cloudy;sh = showers; pc = partly cloudy.City Hi Lo ConditionAcapulco 99 77 pcBangkok 92 78 pcMexico City 77 57 shMontreal 72 56 pcParis 77 58 cRome 88 68 clToronto 78 61 ca. How many elements are in this data set?b. How many variables are in this data set?c. How many observations are in this data set?d. Name the variables and indicate whether they are qualitative or quantitative.e. For which variables are arithmetic operations appropriate and for which are they notappropriate?ANS:a. 7b. 3c. 7d. Hi: quantitative, Lo: quantitative, Condition: qualitativee. Hi: appropriate, Lo: appropriate, Condition: not appropriatePTS: 1 TOP: Descriptive Statistics4. The following data shows the yearly income distribution of a sample of 200 employees at MNM, Inc.Yearly Income (In $1,000s)Number of Employees20 - 24 225 - 29 4830 - 34 6035 - 39 8040 - 44 10a. What percentage of employees has yearly incomes of $35,000 or more?b. Is the figure (percentage) that you computed in Part a an example of statistical inference? If no,what kind of statistics does it represent?c. Based on this sample, the president of the company said that "45% of all our employees' yearlyincomes are $35,000 or more." The president's statement represents what kind of statistics?d. With the statement made in Part c, can we be assured that more than 45% of all employees'yearly incomes are at least $35,000? Explain.e. What percentage of employees of the sample has yearly incomes of $29,000 or less?f. How many variables are presented in the above data set?g. The above data set represents the results of how many observations?ANS:a. 45%b. No, it is descriptive statistics.c. statistical inferenced. No, this is simply an inference and approximation based on the sample information.e. 25%f. 2g. 200PTS: 1 TOP: Descriptive Statistics5. A recent issue of a national magazine reported that in a national public opinion survey conducted among2,000 individuals, 56% were in favor of gun control, 40% opposed gun control, and 4% had no opinion on the subject.a. What is the sample in this survey?b. Based on the sample, what percentage of the population would you think is in favor of gun control?c. Based on the sample, what percentage of the population would you think have no opinion on thesubject?ANS:a. The 2000 individuals who were approachedb. 56%c. 4%PTS: 1 TOP: Descriptive Statistics6. The following table shows the starting salaries of a sample of recent business graduates.Income (In $1,000s) Number of Graduates15 - 19 4020 - 24 6025 - 29 8030 - 34 1835 - 39 2a. What percentage of graduates in the sample had starting salaries of at least $30,000?b. Of the graduates in the sample, what percentage had starting salaries of less than $25,000?c. Based on this sample, what percentage of all business graduates do you estimate to have startingsalaries of at least $20,000?ANS:a. 10%b. 50%c. 80%PTS: 1 TOP: Descriptive Statistics7. Michael, Inc., a manufacturer of electric guitars, is a small firm with 50 employees. The table belowshows the hourly wage distribution of the employees.Hourly Wages (In Dollars) Number of Employees10 - 13 814 - 17 1218 - 21 2022 - 25 10a. How many employees receive hourly wages of at least $18?b. What percentage of the employees has hourly wages of at least $18?c. What percentage of the employees has hourly wages of less than $14?ANS:a. 30b. 60%c. 16%PTS: 1 TOP: Descriptive Statistics8. The following information regarding the top eight Fortune 500 companies was presented in an issue ofFortune Magazine.Sales $ Millions SalesRankProfits$ MillionsProfitsRankCompanyGeneral Motors 161,315 1 2,956 30 Ford Motor 144,416 2 22,071 2 Wal-Mart Stores 139,208 3 4,430 14 Exxon 100,697 4 6,370 5 General Electric 100,469 5 9,269 3 Int'l Business Machines 81,667 6 6,328 6 Citigroup 76,431 7 5,807 8 Philip Morris 57,813 8 5,372 9 Boeing 56,154 9 1,120 82 AT&T 53,588 10 6,398 4a. How many elements are in the above data set?b. How many variables are in this data set?c. How many observations are in this data set?d. Which variables are qualitative and which are quantitative variables?e. What measurement scale is used for each variable?ANS:a. 10b. 4c. 10d. Sales and Profits are quantitativeSales Rank, and Profits Rank are qualitativee. Sales: ratioSales Rank: ordinalProfits: ratioProfits Rank: ordinalPTS: 1 TOP: Descriptive Statistics9. The following information regarding a sample of seven students is provided.Student Identificationnumber Grade PointAverageClassification Gender Rank inClassAdam 1234 2.89 Senior Male 15 Brandon 8978 2.01 Junior Male 25 Jason 6578 3.97 Freshman Male 3 Marissa 2345 3.98 Sophomore Female 2 Michelle 8901 2.67 Senior Female 18 Wendy 7789 4.00 Senior Female 1 Webster 6780 3.77 Freshman Male 4a. How many elements are in the above data set?b. How many variables are in this data set?c. How many observations are in this data set?d. Which variables are qualitative and which are quantitative variables?e. What measurement scale is used for each variable?。
商务统计试题及答案一、选择题(每题2分,共20分)1. 商务统计的主要目的是:A. 收集数据B. 分析数据C. 做出决策D. 预测未来2. 下列哪项不是描述性统计的内容?A. 均值B. 方差C. 相关性D. 抽样3. 正态分布的特点是:A. 所有数据都集中在中间B. 大部分数据分布在两端C. 数据分布是对称的D. 数据分布是不规则的4. 在商务统计中,相关系数的取值范围是:A. -1 到 1B. 0 到 1C. -∞ 到+∞D. 1 到 105. 以下哪个是假设检验的步骤?A. 确定显著性水平B. 收集数据C. 计算样本均值D. 所有选项都是二、简答题(每题10分,共30分)6. 简述商务统计中的抽样误差和非抽样误差的区别。
7. 解释什么是置信区间,并举例说明其在商务决策中的应用。
8. 描述回归分析在商务决策中的作用。
三、计算题(每题25分,共50分)9. 假设你是一家零售公司的分析师,你收集了以下数据,显示了过去10天的日销售额(单位:千元):120, 130, 110, 140, 150, 160, 170, 180, 190, 200。
请计算:- 均值- 中位数- 方差- 标准差10. 假设你正在分析两个变量X和Y之间的关系,收集到以下数据点(X, Y):(1, 2), (2, 3), (3, 5), (4, 7), (5, 9)。
请计算:- 线性回归方程- 相关系数- 预测当X=6时的Y值答案一、选择题1. C. 做出决策2. D. 抽样3. C. 数据分布是对称的4. A. -1 到 15. D. 所有选项都是二、简答题6. 抽样误差是由于从总体中抽取的样本不能完全代表总体而产生的误差。
非抽样误差可能由数据收集、处理或分析过程中的错误引起,与抽样过程无关。
7. 置信区间是指在一定置信水平下,总体参数可能取值的范围。
例如,在市场研究中,置信区间可以用来估计某个新产品的潜在市场份额。
8. 回归分析可以帮助预测一个变量(因变量)如何依赖于一个或多个其他变量(自变量)。
Practice Test 1 Business Statistics:Multiple Choice: Each is worth two pointsIdentify the letter of the choice that best completes the statement or answers the question.**Skip 15-17,18,20 Ch10-12,13 Material____ 1. The sum of the relative frequencies 频率for all classes will always equala. the sample sizeb. the number of classesc. oned. any value larger than one____ 2. The interquartile range四分位差 isa. the 50th percentileb. another name for the variancec. the difference between the largest and smallest valuesd. the difference between the third quartile and the first quartile____ 3. The standard deviation 标准偏差of a sample of 100 observations观察值 equals 64. The variance of the sample equalsa. 8b. 10c. 6400d. 4,096____ 4. The numerical value数值 of the standard deviation can never bea. larger than the varianceb. Zeroc. Negatived. smaller than the variance____ 5. The set of all possible sample points (experimental outcomes) is calleda. a sampleb. an eventc. the sample spaced. a population____ 6. A random variable 随机变量that can assume假设 only a finite 有限number of values is referred to as a(n)a. infinite sequenceb. finite sequencec. discrete random variabled. discrete probability functionExhibit展示 5-11A local bottling 瓶装company has determined the number of machine breakdowns per month and their respective probabilities asshown below:Number ofBreakdowns Probability0 0.121 0.382 0.253 0.184 0.07____ 7. Refer to Exhibit 5-11. The probability of at least 3 breakdowns in a month is????a. 0.5b. 0.10c. 0.30d. 0.90____ 8. A normal probability distribution概率分布a. is a continuous probability distributionb. is a discrete离散 probability distributionc. can be either continuous or discreted. must have a standard deviation of 1Exhibit 6-6The starting salaries of individuals 个体with an MBA degree are normally distributed with a mean of $40,000 and a standarddeviation of $5,000.____ 9. Refer to Exhibit 6-6. What percentage of MBA's will have starting salaries of $34,000 to $46,000?a. 38.49%b. 38.59%c. 50%d. 76.98%____ 10. Given that Z is a standard normal random variable, what is the value of Z if the area between -Z and Z is 0.901?a. 1.96b. -1.96c. 0.4505d. ±1.65____ 11. Which of the following is not a measure 估计of central location中位值?a. meanb. Median中间值c. varianced. Mode众数____ 12. The descriptive measure of dispersion离差量度 that is based on the concept of a deviation about the mean isa. the rangeb. the interquartile rangec. the absolute 绝对value of the ranged. the standard deviation____ 13. Which of the following symbols represents the mean of the population?a. σ2b. σc. μd.____ 14. Which of the following symbols represents the size of the samplea. σ2b. σc. Nd. n____ 15. If two events are independent, thena. they must be mutually exclusiveb. the sum of their probabilities must be equal to onec. their intersection交集 must be zerod. None of these alternatives is correct..____ 16. Which of the following statements is(are) always true???????a. -1 ≤ P(E i) ≤1b. P(A) = 1 - P(A c)c. P(A) + P(B) = 1d. ∑P ≥ 1____ 17. A measure of the average value of a random variable is called a(n)a. varianceb. standard deviationc. expected valued. coefficient of variation____ 18. Four percent of the customers of a mortgage company default on their payments. A sample of five customers is selected. What is the probability that exactly two customers in the sample will default on their payments?a. 0.2592b. 0.0142c. 0.9588d. 0.7408____ 19. The expected value of a discrete random variable????a. is the most likely or highest probability value for the random variableb. will always be one of the values x can take on, although it may not be the highest probability value forthe random variablec. is the average value for the random variable over many repeats of the experimentd. None of these alternatives is correct.____ 20. Which of the following is not a property of a binomial 二项式experiment?a. the experiment consists of a sequence of n identical trialsb. each outcome can be referred to as a success or a failurec. the probabilities of the two outcomes can change from one trial to the nextd. the trials are independentExhibit 5-9The probability distribution for the daily sales at Michael's Co. is given below.Daily Sales(In $1,000s) Probability40 0.150 0.460 0.370 0.2____ 21. Refer to Exhibit 5-9. The expected daily sales area. $55,000b. $56,000c. $50,000d. $70,000____ 22. For a standard normal distribution, the probability of z 0 isa. zerob. -0.5c. 0.5d. oneExhibit 6-2The weight of football players is normally distributed with a mean of 200 pounds and a standard deviation of 25 pounds.____ 23. Refer to Exhibit 6-2. What percent of players weigh between 180 and 220 pounds?a. 28.81%b. 0.5762%c. 0.281%d. 57.62%Exhibit 6-6The starting salaries of individuals with an MBA degree are normally distributed with a mean of $40,000 and a standard deviationof $5,000.____ 24. Refer to Exhibit 6-6. What is the probability that a randomly selected individual with an MBA degree will get a starting salary of at least $47,500?a. 0.4332b. 0.9332c. 0.0668d. 0.5000Short Answer/Problems1.The following data represent the daily demand (y in thousands of units) and the unit price (x in dollars) for a product.Daily Demand (y) Unit Price (x)47 139 335 544 334 620 815 1630 6a. Compute and interpret the sample covariance协方差 for the above data.b. Compute and interpret the sample correlation coefficient.相关系数2.The daily dinner bills in a local restaurant are normally distributed with a mean of $28 and a standard deviation of $6.a. What is the probability that a randomly selected bill will be at least $39.10?b. What percentage of the bills will be less than $16.90?c. What are the minimum and maximum of the middle 95% of the bills?d. If twelve of one day's bills had a value of at least $43.06, how many bills did the restaurant collect on that day?3.Below you are given a partial computer output based on a sample of 7 observations, relating an independent variable (x) and a dependentvariable (y).Predictor Coefficient Standard ErrorConstant 24.112 8.376x -0.252 0.253Analysis of VarianceSOURCE SSRegression 196.893Error 94.822a. Develop the estimated regression line.b. If you are given that x = 50, find the estimate of y based on your regression equation.c. Determine the coefficient of determination and interpret your answer.Solutions to MC1. ANS:C2.ANS:D3.ANS:D4.ANS:C5.ANS:C6.ANS:C7.ANS:D8.ANS:A9. ANS:D10.ANS:D11. ANS: C12.ANS:D13.ANS: C14.ANS:D15.ANS: D16.ANS:B17.ANS: C18. ANS: B19. ANS: C20.ANS:C21.ANS: B22.ANS:C23.ANS: D24.ANS:C25.ANS: C26. ANS: A27. ANS: B28. ANS: D29. ANS: CSolutions to Short Answer1. ANS:a. -47 (rounded). Since the covariance is negative, it indicates a negative relationship between x and y.b. -0.922. There is a strong negative relationship between x and y.2. ANS:a. 0.0322b. 0.0322c. minimum = $16.24 maximum = $39.06d. 2,0003. ANS:a.= 24.112 + 0.816xb.If x = 50 then = 24.112 + 0.816x 24.1 + 0.82 ( 50 ) = 65.1c. 0.675 So there is a fairly strong positive relationship between x and y.Practice Test 2 Business Statistics:Multiple Choice: Each is worth two pointsIdentify the letter of the choice that best completes the statement or answers the question.____ 1. The sample statistic s is the point estimator ofa. μb. σc.d.____ 2. A sample statistic is an unbiased estimator of the population parameter ifa. the expected value of the sample statistic is equal to zerob. the expected value of the sample statistic is equal to onec. the expected value of the sample statistic is equal to the population parameterd. it is equal to zero____ 3. A property of a point estimator that occurs whenever larger sample sizes tend to provide point estimates closer to the population parameter is known asb. unbiased samplingc. consistencyd. relative estimation____ 4. A random sample of 121 bottles of cologne showed an average content of 4 ounces. It is known that the standard deviation标准差of the contents (i.e., of the population) is 0.22 ounces. In this problem the 0.22 isa. a parameter参数b. a statisticc. the standard error标准误差 of the meand. the average content of colognes in the long run____ 5. A sample of 92 observations is taken from an infinite population. The sampling distribution of is approximately大约a. normal because is always approximately normally distributedb. normal because the sample size is small in comparison to the population sizec. normal because of the central limit theorem中心极限定理d. None of these alternatives is correct.____ 6. As the number of degrees of freedom for a t distribution increases, the difference between the t distribution and the standard normal distributiona. becomes largerb. becomes smallerc. stays the samed. None of these alternatives is correct.____ 7. From a population of 200 elements, a sample of 49 elements is selected. It is determined that the sample mean is 56 and the sample standard deviation is 14. The standard error of the mean isa. 3b. 2c. greater than 2d. less than 2____ 8. Which of the following is(are) point estimator(s)?a. σb. μc. sd. α____B 9. A population characteristic, such as a population mean总体平均值, is calleda. a statisticb. a parameterc. a sampled. the mean deviation___A_ 10. The sample statistic, such as , s, or , that provides the point estimate of the population parameter is known asa. a point estimatorb. a parameterc. a population parameterd. a population statistic____A 11. The fact that the sampling distribution of sample means can be approximated by a normal probability distribution whenever the sample size is large is based on thea. central limit theoremb. fact that we have tables of areas for the normal distributionc. assumption that the population has a normal distributiond. None of these alternatives is correct.____C 12. Random samples of size 17 are taken from a population that has 200 elements, a mean of 36, and a standard deviation of 8. The mean and the standard deviation of the sampling distribution of the sample means area. 8.7 and 1.94c. 36 and 1.86d. 36 and 8____A 13. When constructing a confidence interval for the population mean and a small sample is used, the degrees of freedom for the t distribution equalsa. n-1b. nc. 29d. 30____A_ 14. The collection of all possible sample points in an experiment isa. the sample spaceb. a sample pointc.an experimentd. the population_____D 15. Of five letters (A, B, C, D, and E), two letters are to be selected at random. How many possible selections are there?a. 20b. 7c. 5!d. 10_____B 16. The “Top Three” at a racetrack consists of picking the correct order of the first three horses in a race. If there are 10 horses in a particular race, how many “Top Three” outcomes are there?a. 302,400b. 720c. 1,814,400d. 10_____ C17. Given that event E has a probability of 0.25, the probability of the complement 补足of event Ea. cannot be determined with the above informationb. can have any value between zero and onec. must be 0.75d. is 0.25_____A 18. The symbol ⋃ shows thea.union of eventsb. intersection of eventsc.sum of the probabilities of eventsd. sample space_____B19. If P(A) = 0.38, P(B) = 0.83, and P(A ⋂ B) = 0.57; then P(A ⋃ B) =a. 1.21b. 0.64c. 0.78d. 1.78_____ B20. If P(A) = 0.62, P(B) = 0.47, and P(A ⋃ B) = 0.88; then P(A ⋂ B) =a. 0.2914b. 1.9700c. 0.6700d. 0.2100_____D 21. If P(A) = 0.85, P(A ⋃ B) = 0.72, and P(A ⋂ B) = 0.66, then P(B) =a. 0.15b. 0.53c. 0.28d. 0.15_____D 22. Two events are mutually exclusive ifa. the probability of their intersection is 1b. they have no sample points in commonc. the probability of their intersection is 0.5d. the probability of their intersection is 1 and they have no sample points in commonC 23. If A and B are mutually exclusive events with P(A) = 0.3 and P(B) = 0.5, thenP(A ⋂ B) =a. 0.30b. 0.15c. 0.00d. 0.20_____ C24. If A and B are mutually exclusive events with P(A) = 0.3 and P(B) = 0.5, thenP(A ⋃ B) =a. 0.00b. 0.15c. 0.8d. 0.2____B_ 25. A subset of a population selected to represent the population is aa.subsetb.samplec.small populationd. None of the alternative answers is correct._____A 26. A simple random sample of size n from an infinite population of size N is to be selected. Each possible sample should havea. the same probability of being selectedb. a probability of 1/n of being selectedc. a probability of 1/N of being selectedd. a probability of N/n of being selected_____D 27. A probability distribution for all possible values of a sample statistic is known as aa.sample statisticb.parameterc.simple random sampled.sampling distribution_____D 28. From a population of 200 elements, the standard deviation is known to be 14. A sample of 49 elements is selected. It is determined that the sample mean is 56. The standard error of the mean isa. 3b. 2c. greater than 2d. less than 2_____ D29. From a population of 500 elements, a sample of 225 elements is selected. It is known that the variance of the population is 900. The standard error of the mean is approximatelya. 1.1022b. 2c. 30d. 1.4847Short Answer/ProblemsDirections: Clearly designate your solution to each portion of the questions asked and show yourentire work and method for arriving at the solution.1. The sales records of a real estate agency show the following sales over the past 200 days:b. Assign probabilities to the sample points and show their values.c. What is the probability that the agency will not sell any houses in a given day?d. What is the probability of selling at least 2 houses?e. What is the probability of selling 1 or 2 houses?f. What is the probability of selling less than 3 houses?2. Assume two events A and B are mutually exclusive and, furthermore, P(A) = 0.2 and P(B) = 0.4.a. Find P(A ⋂ B).b. Find P(A ⋃ B).c. Find P(A⎜B).3.You are given the following information on Events A, B, C, and D. P(A) = .4, P(B) = .2, P(C) = .1,P(A ⋃ D) = .6, P(A⎜B) = .3, P(A ⋂ C) = .04, P(A ⋂ D) = .03a. Compute P(D).b. Compute P(A ⋂ B).c. Compute P(A⎜C).d. Compute the probability of the complement of C.e. Are A and B mutually exclusive? Explain your answer.f. Are A and B independent? Explain your answer.g. Are A and C mutually exclusive? Explain your answer.h. Are A and C independent? Explain your answer.4. Consider a population of five weights identical in appearance but weighing 1, 3, 5, 7, and 9ounces.a. Determine the mean and the variance of the population.b. Sampling without replacement from the above population with a sample size of 2 produces ten possiblesamples. Using the ten sample mean values, determine the mean of the population and the variance of .c. Compute the standard error of the mean.5. A population of 1,000 students spends an average of $10.50 a day on dinner. The standarddeviation of the expenditure is $3. A simple random sample of 64 students is taken.a. What are the expected value, standard deviation, and shape of the sampling distribution of the sample mean?b. What is the probability that these 64 students will spend a combined total of more than $715.21?c. What is the probability that these 64 students will spend a combined total between $703.59 and $728.45? Solutions to MC Problems1. ANS: B2ANS:C3.ANS:C4. ANS:A5. ANS:C6. ANS:B7.ANS:D 8.ANS:C9.ANS:B10. ANS:A11. ANS: A12.ANS:C13.ANS: A14.ANS:A15.ANS: D16.ANS:B17.ANS: C18.ANS:A19. ANS: B20.ANS:D21.ANS: B22.ANS:B23.ANS:C24.ANS:C25. ANS: B26. ANS: A27. ANS: D28.ANS: D29. ANS: DShort Answer/ProblemsDirections: Clearly designate your solution to each portion of the questions asked and show yourentire work and method for arriving at the solution.1. ANSWERS:2. ANSWERS:a. 0.0 b. 0.6 c. 0.03ANSWERS:a. 0.23b. 0.06c. 0.4d. 0.9e. No, P(A⎜B) ≠ 0f. No, P(A⎜B) ≠ P(A)g. No, P(A ⋂ C) ≠ 0h. Y es, P(A⎜C) = P(A)4. ANSWERS:a. 5 and 8b. 5 and 3c. 1.7325. ANSWERS:a. 10.5 0.363 normalb. 0.0314c. 0.0794。
Chapter 4: Displaying and Describing Categorical Data – Quiz A Name_________________________A large national retailer of electronics conducted a survey to determine consumer preferences for various brands of digital cameras. The table summarizes responses by brand and gender.1. Identify the variables and tell whether each is categorical or quantitative.2. Find each of the following percentages.a. What percent of the responses were males who prefer Pentax?b. What percent of the male responses prefer Pentax?c. What percent of the consumers who choose Pentax were males?3. What is the marginal distribution of brands?4. Prepare an appropriate chart to display the marginal distribution of brands.5. Write a sentence or two about the conditional relative frequency distribution of the brands among female respondents.Female Male Total Sony Cyber-Shot73 59 132 Kodak – Easy Share 49 47 96 Canon Power Shot 58 33 91 Pentax 37 41 78 Olympus45 28 73 Other Brands86 67 153 Total 348 275 6236. Consider the following side-by-side bar chart for these data:Does the chart indicate that brand preference is independent of gender? Explain.Chapter 4: Displaying and Describing Categorical Data – Quiz A – KeyA large national retailer of electronics conducted a survey to determine consumer preferences for various brands of digital cameras. The table summarizes responses by brand and gender.1. Identify the variables and tell whether each is categorical or quantitative.Gender and Brand; both categorical.2. Find each of the following percentages.a. What percent of the responses were males who prefer Pentax?6.6% (41/623)b. What percent of the male responses prefer Pentax?14.9% (41/275)c. What percent of the consumers who choose Pentax were males?52.6% (41/78)3. What is the marginal distribution of brands?132 for Sony Cyber-Shot, 96 for Kodak-Easy Share, 91 for Canon Power Shot, 78 for Pentax, 73 for Olympus and 153 for other brands.4. Prepare an appropriate chart to display the marginal distribution of brands.Either a bar chart (shown below) or a pie chart is appropriate.Female Male Total Sony Cyber-Shot73 59 132 Kodak – Easy Share 49 47 96 Canon Power Shot 58 33 91 Pentax 37 41 78 Olympus45 28 73 Other Brands86 67 153 Total 348 275 6235. Write a sentence or two about the conditional relative frequency distribution of the brands among female respondents.Among females, 21% prefer Sony, 14.1% prefer Kodak, 16.7% prefer Canon, 10.6% prefer Pentax, and 12.9 % prefer Olympus. The remaining 24.7% of females preferred other brands.6. Consider the following side by side bar chart for the data above:Does the chart indicate that brand preference is independent of gender? Explain. Brand preference does not appear to be independent of gender. Brand preferences seem to differ based on gender.Chapter 4: Displaying and Describing Categorical Data – Quiz B Name_________________________A full service brokerage firm gathered information on how its clients were investing for retirement. Based on age, clients were categorized according to where the largestpercentage of their retirement portfolio was invested. The following table summarized the data.1. Identify the variables and tell whether each is categorical or quantitative.2. Find each of the following percentages.a. What percent of the clients are over age 50 who invests in mutual funds?b. What percent of clients over age 50 invest in mutual funds?c. What percent of the mutual fund investors are over age 50?3. What is the marginal distribution of age?4. Prepare an appropriate chart to display the marginal distribution of age.5. Write a sentence or two about the conditional relative frequency distribution of mode of investment for clients age 50 or younger.Age 50 or Younger Over Age 50 Total Mutual Funds 30 34 64 Stocks 37 45 82Bonds 19 23 42Total 86 102 1886. Consider the following side by side bar chart for these data:Does the chart indicate that mode of investment is independent of age? Explain.Chapter 4: Displaying and Describing Categorical Data – Quiz B – KeyA full service brokerage firm gathered information on how its clients were investing for retirement. Based on age, clients were categorized according to where the largestpercentage of their retirement portfolio was invested. The table following summarized the data.1. Identify the variables and tell whether each is categorical or quantitative.Mode of investment and age; mode of investment is categorical; age is quantitative.2. Find each of the following percentages.a. What percent of the clients are over age 50 who invests in mutual funds?18.1% (34/188)b. What percent of clients over age 50 invest in mutual funds?33.3% (34/102)c. What percent of the mutual fund investors are over age 50? 53.1% (34/64)3. What is the marginal distribution of age?86 clients are age 50 or younger and 102 are over age 50.4. Prepare an appropriate chart to display the marginal distribution of age.Either a bar chart (shown below) or a pie chart is appropriate.Age 50 or Younger Over Age 50 Total Mutual Funds 30 34 64 Stocks 37 45 82Bonds 19 23 42Total 86 102 1885. Write a sentence or two about the conditional relative frequency distribution of mode of investment for clients age 50 or younger.More clients age 50 or younger invested their retirement savings primarily in stocks rather than in any other mode of investment, 35% invested in mutual funds while only 22% invested in bonds.6. Consider the following side by side bar chart for the data above:Does the chart indicate that mode of investment is independent of age? Explain. The way clients invest for retirement does seem to be independent of age. These data provide little indication of a difference in mode of investing for retirement based on clients’ ages at this firm.Chapter 4: Displaying and Describing Categorical Data – Quiz C – Multiple Choice Name_________________________Consider the following to answer questions 1 – 5:A large national retailer of electronics conducted a survey to determine consumer preferences for various brands of digital cameras. The table summarizes responses by brand and gender.1. The percentage of consumers who are male and prefer Pentax isA. 44.1 % (275/623)B. 6.6% (41/623)C. 52.6% (41/78)D. 14.9% (41/275)E. 12.5% (78/623)2. Of the consumers who are male, the percentage who prefer Pentax isA. 44.1 % (275/623)B. 6.6% (41/623)C. 52.6% (41/78)D. 14.9% (41/275)E. 12.5% (78/623)3. Of the consumers who prefer Pentax, what percentage is male?A. 44.1 % (275/623)B. 6.6% (41/623)C. 52.6% (41/78)D. 14.9% (41/275)E. 12.5% (78/623)Female Male Total Sony Cyber-Shot73 59 132 Kodak – Easy Share 49 47 96 Canon Power Shot 58 33 91 Pentax 37 41 78 Olympus45 28 73 Other Brands86 67 153 Total 348 275 623Which of the following statements is (are) true?A. It appears that camera preference and gender are related.B. It appears that camera preference and gender are not independent.C. It appears that camera preference and gender are independent.D. More males than females prefer Canon.E. More females than males prefer Pentax.A. the marginal distribution of brands.B. the conditional distribution of brands.C. the marginal distribution of gender.D. the conditional distribution of gender.E. none of the aboveConsider the following to answer questions 6 - 10:A full service brokerage firm gathered information on how their clients were investing for retirement. Based on age, clients were categorized according to where the largest percentage of their retirement portfolio was invested and shown in the table below.6. The percentage of clients who are over age 50 and invest in mutual funds is A. 53.1% (34/64)B. 33.3% (34/102)C. 18.1% (34/188)D. 34% (64/188)E. 54.3% (102/188)7. Of the clients over age 50, the percentage who invest in mutual funds is A. 53.1% (34/64) B. 33.3% (34/102) C. 18.1% (34/188) D. 34% (64/188) E. 54.3% (102/188)8. Of the clients who invest in mutual funds, the percentage over age 50 is A. 53.1% (34/64) B. 33.3% (34/102) C. 18.1% (34/188) D. 34% (64/188) E. 54.3% (102/188)9. The percentage of clients over age 50 is A. 53.1% (34/64) B. 33.3% (34/102) C. 18.1% (34/188) D. 34% (64/188) E. 54.3% (102/188)Age 50 or YoungerOver Age 50TotalMutual Funds 30 34 64 Stocks 37 45 82 Bonds19 23 42Total 86 102 18810. The pie chart below for these data showsA. the marginal distribution of client age.B. the conditional distribution of client age.C. the conditional distribution of investment type.D. the marginal distribution of investment type.E. the joint distribution of client age and investment type.Chapter 4 – Quiz C – Key1. B2. D3. C4. B5. A6. C7. B8. A9. E10. D。
Chapter 12: Comparing Two Groups – Quiz AName_________________________Data were collected on annual personal time (in hours) taken by a random sample of 16 women and 7 men employed by a medium-sized company. The women took an average of 24.75 hours of personal time per year with a standard deviation of 2.84 hours. The men took an average of 21.89 hours of personal time per year with a standard deviation of 3.29 hours. The Human Resources Department believes that women tend to take more personal time than men because they tend to be the primary child care givers in the family.Personal Time (hours)Women Men25 21 2222 27 2119 29 2425 26 2724 30 1925 27 2324 26 1723 231. Are the assumptions and conditions for carrying out the t-test for two means satisfied? Explain.2. Write the null and alternative hypotheses.3. Based on the test statistic and its P-value, state your conclusion using α = .05.4. Create and interpret a 90% confidence interval.Use the following for questions 5 – 8:A mid-sized company has decided to implement an enterprise resource planning (ERP) system, and management suspects that many of its employees are concerned about the planned implementation. Managers are considering holding informational workshops to help decrease anxiety levels among employees. To determine whether such an approach would be effective, they randomly select 16 employees to participate in a pilot workshop. These employees were given a questionnaire to measure anxiety levels about ERP before and after participating in the workshop. Do the data indicate that anxiety levels about ERP decreases as a result of the workshop?Pre-workshop7 6 9 5 6 7 5 7 6 4 3 2 1 3 4 2anxiety levelPost-workshop4 3 7 3 45 46 5 3 2 2 1 3 4 3anxiety levelDifference-3 -3 -2 -2-2-2-1-1-1-1-10 0 0 0 1 (Post – Pre)5. Are the assumptions and conditions for carrying out the paired t-test satisfied? Explain.6. Write the null and alternative hypotheses.7. Based on the test statistic and its P-value, state your conclusion using α = .05.8. Create and interpret a 90% confidence interval.Chapter 12: Comparing Two Groups – Quiz A – KeyData were collected on annual personal time (in hours) taken by a random sample of 16 women and 7 men employed by a medium-sized company. The women took an average of 24.75 hours of personal time per year with a standard deviation of 2.84 hours. The men took an average of 21.89 hours of personal time per year with a standard deviation of 3.29 hours. The Human Resources Department believes that women tend to take more personal time than men because they tend to be the primary child care givers in the family.Personal Time (hours)Women Men25 21 2222 27 2119 29 2425 26 2724 30 1925 27 2324 26 1723 231. Are the assumptions and conditions for carrying out the t-test for two means satisfied? Explain.Conditions:* Independent group assumption: Women and men are definitely independent groups.* Randomization condition: These are random samples.* Nearly Normal condition: The histograms below show that both sets are unimodal and roughly symmetric.2. Write the null and alternative hypotheses.H0: µ1 - µ2 = 0 and H A: µ1 - µ2 > 03. Based on the test statistic and its P-value, state your conclusion using α = .05.t = 2.02P-value = .0352Because the P-value is low, we reject the null hypothesis. There is evidence of a difference in the average number of hours of personal time taken by women and men. Women take a higher average number.4. Create and interpret a 90% confidence interval.Using 10 degrees of freedom, the critical t-value is 1.812. The 90% confidence interval is (0.30, 5.48). We are 90% confident that, on average, women use between .30 and 5.48 more hours of personal time per year than men.Use the following for questions 5 – 8:A mid-sized company has decided to implement an enterprise resource planning (ERP) system and management suspects that many of its employees are concerned about the planned implementation. Managers are considering holding informational workshops to help decrease anxiety levels among employees. To determine whether such an approach would be effective, they randomly select 16 employees to participate in a pilot workshop. These employees were given a questionnaire to measure anxiety levels about ERP before and after participating in the workshop. Do the data indicate that anxiety levels about ERP decreases as a result of the workshop?Pre-workshop anxiety level7 6 9 5 6 7 5 7 6 4 3 2 1 3 4 2 Post-workshop anxiety level4 3 7 3 45 46 5 3 2 2 1 3 4 3 Difference (Post – Pre)-3 -3 -2 -2-2-2-1-1-1-1-10 0 0 0 15. Are the assumptions and conditions for carrying out the paired t -test satisfied? Explain.Conditions:* Paired data: The data are paired because they are measurements on the sameindividuals both before and after the workshop.* Independence: The anxiety level of any employee is independent of the anxiety level of any other employee, so the differences are independent.* Randomization: This is a random sample from the company.* Nearly Normal condition: The histogram of the differences (below) is unimodal and roughly symmetric.6. Write the null and alternative hypotheses.Let d = Post-workshop anxiety level – Pre-workshop anxiety level.H0: µd = 0 The mean difference in the anxiety levels is zero.H A: µd < 0 The mean difference in the anxiety levels is less than zero.7. Based on the test statistic and its P-value, state your conclusion using α = .05.t = -3.92P-value = .0007With a P-value this small, we can reject the null hypothesis. We have strong evidence that participating in this workshop reduces employee anxiety levels about ERP.8. Create and interpret a 90% confidence interval.With 15 degrees of freedom, the critical t-value is 1.753. The 90% confidence interval is (-1.63, -0.62). We are 90% confident that, on average, participating in this workshop will decrease employee anxiety between .62 and 1.63 points (on the scale).Chapter 12: Comparing Two Groups – Quiz BName_________________________A consumer group was interested in comparing the operating time of cordless toothbrushes manufactured by two different companies. Group members took a random sample of 18 toothbrushes from Company A and 15 from Company B. Each was charged overnight and the number of hours of use before needing to be recharged was recorded. Company A toothbrushes operated for an average of 119.7 hours with a standard deviation of 1.74 hours; CompanyB toothbrushes operated for an average of 120.6 hours with a standard deviation of 1.72 hours. Do these samples indicate that Company B toothbrushes operate more hours on average than Company A toothbrushes?Hours of OperationCompany A Company B121 119 122 120122 121 121 118117 122 121 121120 119 122 123120 119 121 118121 118 119 120118 120 120 124120 123 119117 1181. Are the assumptions and conditions for carrying out the t-test for two means satisfied? Explain.2. Write the null and alternative hypotheses.3. Based on the test statistic and its P-value, state your conclusion using α = .05.4. Create and interpret a 90% confidence interval.Use the following for questions 5 – 8:An army depot that overhauls ground mobile radar systems is interested in improving its processes. One problem involves troubleshooting a particular component that has a high failure rate after it has been repaired and reinstalled in the system. The shop floorsupervisor believes that having standard work procedures in place will reduce the time required for troubleshooting this component. Time (in minutes) required troubleshooting this component without and with the standard work procedure is recorded for a sample of 19 employees. Does this sample indicate that having a standard work procedure in place reduces troubleshooting time?5. Are the assumptions and conditions for carrying out the paired t -test satisfied? Explain.6. Write the null and alternative hypotheses.7. Based on the test statistic and its P-value, state your conclusion using α = .05.8. Create and interpret a 95% confidence interval. Without Standard Work Procedure With Standard Work Procedure Difference Without - With 142 119 23 144 118 26 153 126 27 148 119 29 146 121 25 149 125 24 138 116 22 145 120 25 153 124 29 160 138 22 163 135 28 170 144 26 169 142 27 151 128 23 152 131 21 167 141 26 164 140 24 165 140 25 163 138 25Chapter 12: Comparing Two Groups – Quiz B – KeyA consumer group was interested in comparing the operating time of cordlesstoothbrushes manufactured by two different companies. Group members took a random sample of 18 toothbrushes from Company A and 15 from Company B. Each was charged overnight and the number of hours of use before needing to be recharged was recorded. Company A toothbrushes operated for an average of 119.7 hours with a standarddeviation of 1.74 hours; Company B toothbrushes operated for an average of 120.6 hours with a standard deviation of 1.72 hours. Do these samples indicate that Company B toothbrushes operate more hours on average than Company A toothbrushes?1. Are the assumptions and conditions for carrying out the t -test for two means satisfied? Explain.Conditions:* Independent group assumption: Company A and Company B are twoindependent groups.* Randomization condition: Samples were taken by random selection.* Nearly Normal condition: The histograms below show that both sets areunimodal and roughly symmetric.Hours of Operation Company A Company B 121 119 122 120122 121 121 118117 122 121 121120 119 122 123120 119 121 118121 118 119 120 118 120 120 124 120 123 119 117 1182. Write the null and alternative hypotheses.H0: µ1 - µ2 = 0 and H A: µ1 - µ2 < 03. Based on the test statistic and its P-value, state your conclusion using α = .05.t = -1.488P-value = .0735Because the P-value is fairly high, we fail to reject the null hypothesis. There is not enough evidence to indicate that Company B cordless toothbrushes operate longer on average than those of Company A.4. Create and interpret a 90% confidence interval.Using 30 degrees of freedom, the critical t-value is 1.697. The 90% confidence interval is (-1.93, 0.13). We are 90% confident that, on average, there is no difference in operating hours between toothbrushes from Company A compared to those from Company B.Use the following for questions 5 – 8:An army depot that overhauls ground mobile radar systems is interested in improving its processes. One problem involves troubleshooting a particular component that has a high failure rate after it has been repaired and reinstalled in the system. The shop floor supervisor believes that having standard work procedures in place will reduce the time required for troubleshooting this component. Time (in minutes) required troubleshooting this component without and with the standard work procedure is recorded for a sample of 19 employees. Does this sample indicate that having a standard work procedure in place reduces troubleshooting time?5. Are the assumptions and conditions for carrying out the paired t -test satisfied? Explain.Conditions:* Paired data: The data are paired because they are measurements of troubleshooting time on the same employee.* Independence: The troubleshooting time by any employee is independent of that of other employees, so the differences are independent.* Randomization: We assume these employees are representative of all employees. * Nearly Normal condition: The histogram of the differences is unimodal and somewhat symmetric.Without Standard Work Procedure With Standard WorkProcedure DifferenceWithout -With 142 119 23 144 118 26 153 126 27 148 119 29 146 121 25 149 125 24 138 116 22 145 120 25 153 124 29 160 138 22163 135 28170 144 26169 142 27151 128 23152 131 21167 141 26164 140 24165 140 25 163 138 256. Write the null and alternative hypotheses.Let d = Time without standard work procedure – Time with standard work procedure.H0: µd = 0 The mean difference in the times is zero.H A: µd > 0 The mean difference in the times is greater than zero.7. Based on the test statistic and its P-value, state your conclusion using α = .05.t = 47.4P-value < .0001With a P-value this small, we can reject the null hypothesis. We have strong evidence that having standard work procedures in place reduces troubleshooting time for this component.8. Create and interpret a 95% confidence interval.With 18 degrees of freedom, the critical t-value is 2.101. The 95% confidence interval is (23.99, 26.22). We are 95% confident that having standard work procedures in place reduces troubleshooting time on this component, on average, between 23.99 and 26.22 minutes.Chapter 12: Comparing Two Groups – Quiz C – Multiple Choice Name_________________________Consider the following to answer questions 1 –5:Data were collected on annual personal time (in hours) taken by a random sample of 16 women and 7 men employed by a medium sized company. The women took an average of 24.75 hours of personal time per year with a standard deviation of 2.84 hours. The men took an average of 21.89 hours of personal time per year with a standard deviation of 3.29 hours. The Human Resources Department believes that women tend to take more personal time than men because they tend to be the primary child care givers in the family.1. The correct null and alternative hypotheses (assuming women are group 1 and men are: group 2) areA. H 0: µ1 - µ2 = 0 and H A: µ1 - µ2 < 0.B. H 0: µ1 - µ2 = 0 and H A: µ1 - µ2 ≠ 0.C. H 0: µ1 - µ2 = 0 and H A: µ1 - µ2 > 0.D. H 0: µ1 - µ2 > 0 and H A: µ1 - µ2 < 0.E. None of the above.2. The t -test for two means is appropriate in this situation becauseA. women and men are dependent samples.B. women and men are independent samples.C. women and men are matched samples.D. the observations are paired.E. None of the above.3. The correct value of the test statistic isA. t = 2.02.B. t = - 2.91.C. t = 0.458.D. t = 4.02.E. None of the above.Personal Time (hours)Women Men25 21 2222 27 2119 29 24 25 26 27 24 30 19 25 27 23 24 26 17 23 234. At α = .05A. we reject the null hypothesis.B. we fail to reject the null hypothesis.C. we can conclude that women take a higher average number of hours of personal time per year compared to men.D. Both A and C.E. Both B and C.5. Based on the data, the correct 90% confidence interval for the difference between women and men in the average number of hours of personal time taken per year isA. 0.30 to 5.48 hours.B. -0.50 to 3.21 hours.C. -4.67 to -0.62 hours.D. 1.27 to 6.89 hours.E. None of the above.Consider the following to answer questions 6 - 10:An army depot that overhauls ground mobile radar systems is interested in improving its processes. One problem involves troubleshooting a particular component that has a high failure rate after it has been repaired and reinstalled in the system. The shop floor supervisor believes that having standard work procedures in place will reduce the time required for troubleshooting this component. Time (in minutes) required troubleshooting this component without and with the standard work procedure is recorded for a sample of 19 employees. Does this sample indicate that having a standard work procedure in place reduces troubleshooting time?Without Standard Work Procedure With StandardWorkProcedureDifferenceWithout -With142 119 23 144 118 26 153 126 27 148 119 29 146 121 25 149 125 24 138 116 22 145 120 25 153 124 29 160 138 22 163 135 28 170 144 26 169 142 27 151 128 23 152 131 21167 141 26164 140 24165 140 25163 138 256. Which of the following statements is true?A. This is a one-tailed paired t-test.B. This is a two-tailed test of two independent means.C. This is one-tailed test of two independent means.D. This is a two-tailed paired t-test.E. This is a test of two proportions.7. Assuming that we define our differences as Time without standard work procedure – Time with standard work procedure, the correct alternative hypothesis isA. µd = 0.B. µd < 0.C. µd > 0.D. µd≠ 0.E. None of the above.8. The correct value of the test statistic isA. t = 47.4.B. t = -6.70.C. t = 3.19.D. t = -0.36.E. None of the above.9. The P-value associated with the test statistic isA. 0.321.B. < .0001.C. .05.D. .0233.E. > .0001.10. At α = .05A. we reject the null hypothesis.B. we fail to reject the null hypothesis.C. we can conclude that having standard work procedures in place reduces troubleshooting time for this component.D. Both A and C.E. Both B and C.Chapter 12 – Quiz C – Key1. C2. B3. A4. D5. A6. A7. C8. A9. B10. D。
Chapter 5: Displaying and Describing Quantitative Data – Quiz AName_________________________1. Following is a histogram of salaries (in $) for a sample of U.S. marketing managers. Comment on the shape of the distribution.2. Following is the five-number summary of salaries (in $) for a sample of U.S. marketing managers displayed in question 1.Min Q1 Median Q3 Max46360 6969377020 91750129420a. Would you expect the mean salary for this sample of marketing managers to be higher or lower than the median? Explain.b. Which would be a more appropriate measure of central tendency for these data, the mean or median? Explain.c. Calculate the range.d. Calculate the IQR.3. Suppose the marketing manager who was earning $129,420 got a raise and is now earning $140,000. Indicate how this change would affect the following summary statistics (increase, decrease, or stay about the same):Meana.b. Medianc. Ranged. IQRe. Standard deviation4. The following table shows data on total assets ($ billion) for a small sample of U.S. banks. Prepare a stem and leaf display. Comment on the shape of the distribution.BANK ASSETS ($ billion)Bank of New York 88Regions Financial 80Fifth Third Bank 58State Street Bank and Trust 92Branch Banking and Trust Company 81Chase Bank 70Key Bank 89PNC Bank 845. For the data on total assets ($ billion) for a small sample of U.S. banks provided in the previous question:a. Calculate the mean.b. Calculate the standard deviation.c. Standardize the asset value of Fifth Third Bank (find the z score). Interpret its meaning.6. The following boxplots show monthly sales revenue figures ($ thousands) for a discount office supply company with locations in three different regions of the U.S. (Northeast, Southeast, and West).a. Which region has the highest median sales revenue?b. Which region has the lowest median sales revenue?c. Which region has the most variable sales revenue values? Explain.Chapter 5: Displaying and Describing Quantitative Data – Quiz A – Key1. Following is a histogram of salaries (in $) for a sample of U.S. marketing managers. Comment on the shape of the distribution.The distribution is unimodal and skewed right.2. Following is the five-number summary of salaries (in $) for a sample of U.S. marketing managers displayed in question 1.Min Q1 Median Q3 Max46360 6969377020 91750129420a. Would you expect the mean salary for this sample of marketing managers to be higher or lower than the median? Explain.We would expect the mean salary to be higher than the median because the distribution is skewed right (the sample mean is $82,549).b. Which would be a more appropriate measure of central tendency for these data, the mean or median? Explain.The median is preferred over the mean when the distribution is skewed.c. Calculate the range.$83,060.d. Calculate the IQR.$22,057.3. Suppose the marketing manager who was earning $129,420 got a raise and is now earning $140,000. Indicate how this change would affect the following summary statistics (increase, decrease, or stay about the same):a. MeanIncrease.b. MedianStay the same.c. RangeIncrease.d. IQRStay the same.e. Standard deviationIncrease.4. The following table shows data on total assets ($ billion) for a small sample of U.S. banks. Prepare a stem and leaf display. Comment on the shape of the distribution.BANK ASSETS ($ billion)Bank of New York 88Regions Financial 80Fifth Third Bank 58State Street Bank and Trust 92Branch Banking and Trust Company 81Chase Bank 70Key Bank 89PNC Bank 84Stem-and-Leaf Display: Assets ($ billion)Stem-and-leaf of Assets ($ billion) N = 8Leaf Unit = 1.01 5 81 61 62 7 02 7(3) 8 0143 8 891 9 2The shape of the distribution is skewed left.5. For the data on total assets ($ billion) for a small sample of U.S. banks provided in the previous question:a. Calculate the mean.$80.25 (billion).b. Calculate the standard deviation.$11.27 (billion)c. Standardize the asset value of Fifth Third Bank (find the z score). Interpret its meaning.-1.97 (this value is approximately 2 standard deviations below the mean).6. The following boxplots show monthly sales revenue figures ($ thousands) for a discount office supply company with locations in three different regions of the U.S. (Northeast, Southeast, and West).a. Which region has the highest median sales revenue? Northeast.b. Which region has the lowest median sales revenue? Southeast.c. Which region has the most variable sales revenue values? Explain. West. It has the largest range and IQR.Chapter 5: Displaying and Describing Quantitative Data – Quiz BName_________________________1. Data were collected on the hourly wage ($) for two types of marketing managers: (1) advertising / promotion managers and (2) sales managers. The results were used to create the following histograms.a. Describe the hourly wage distribution for advertising/promotion managers.b. Describe the hourly wage distribution for sales managers.c. Compare the hourly wages for the two types of marketing managers based on the histograms.2. Following is the five number summary of the hourly wages ($) for advertising / promotion managers displayed in question 1.Min Q1 Median Q3 Max19.64 29.3634.18 40.8657.26a. Would you expect the mean salary for this sample of marketing managers to be higher or lower than the median? Explain.b. Which would be a more appropriate measure of central tendency for these data, the mean or median? Explain.c. Calculate the range.d. Calculate the IQR.3. Following is the five number summary of the hourly wages ($) for sales managers displayed in question 1.Min Q1 Median Q3 Max20.94 37.6444.77 49.3467.11Suppose there had been an error and that the lowest hourly wage for sales managers was $18.50 instead of $20.94. Indicate how this change would affect the following summary statistics (increase, decrease, or stay about the same):a.Meanb. Medianc. Ranged. IQRe. Standard deviation4. The following table shows closing share prices (on the first trading day of August, 2007) for a small sample of companies.COMPANY CLOSING SHARE PRICE – 08/073M Dental Products 86.95Tyco Electronics Power Systems 47.45Kyocera America Inc. 94.10Pfizer Inc. 22.39Xerox Company 17.56Northrop Grumman Corporation 75.81Lockheed Martin Maritime Systems 100.17Sony DADC 51.91Matsushita Electronic Components 17.91Foster Wheeler Environmental Corp. 55.67a. Calculate the mean.b. Calculate the standard deviation.c. Standardize the share price for Matsushita Electronic Components (find the z score). Interpret its meaning.5. The following boxplots show the closing share prices for the sample of companies in question 4 on the first trading days in August 2007 and in August 2002.a. For which day was the median closing share price higher?b. For which day were the closing share prices more variable? Explain.c. Which distribution is more symmetric? Explain.6. Following is a time series graph for monthly closing price of 3M Dental Products stock (beginning June 2005).a. Are the closing prices for shares of 3M Dental Products from June 2005 through August 2007 stationary? Explain.b. Would a histogram provide a good summary of these stock prices? Explain.Chapter 5: Displaying and Describing Quantitative Data – Quiz B – Key1. Data were collected on the hourly wage ($) for two types of marketing managers: (1) advertising / promotion managers and (2) sales managers. The results were used to create the following histograms.a. Describe the hourly wage distribution for advertising/promotion managers. Unimodal and right skewed.b. Describe the hourly wage distribution for sales managers.Unimodal and left skewed.c. Compare the hourly wages for the two types of marketing managers based on the histograms.It appears that sales managers earn a higher hourly wage compared toadvertising/promotion managers.2. Following is the five number summary of the hourly wages ($) for advertising / promotion managers displayed in question 1.Min Q1 Median Q3 Max19.64 29.3634.18 40.8657.26a. Would you expect the mean salary for this sample of marketing managers to be higher or lower than the median? Explain.We would expect the mean salary to be higher than the median because the distribution is skewed right (the sample mean is $35.05).b. Which would be a more appropriate measure of central tendency for these data, the mean or median? Explain. .The median is preferred over the mean when the distribution is skewed.c. Calculate the range.$37.62d. Calculate the IQR.$11.503. Following is the five number summary of the hourly wages ($) for sales managers displayed in question 1.Min Q1 Median Q3 Max20.94 37.6444.77 49.3467.11Suppose there had been an error and that the lowest hourly wage for sales managers was $18.50 instead of $20.94. Indicate how this change would affect the following summary statistics (increase, decrease, or stay about the same):a. MeanDecrease.b. MedianStay the same.c. RangeIncrease.d. IQRStay the same.e. Standard deviationIncrease.4. The following table shows closing share prices (on the first trading day of August, 2007) for a small sample of companies.COMPANY CLOSING SHARE PRICE – 08/073M Dental Products 86.95Tyco Electronics Power Systems 47.45Kyocera America Inc. 94.10Pfizer Inc. 22.39Xerox Company 17.56Northrop Grumman Corporation 75.81Lockheed Martin Maritime Systems 100.17Sony DADC 51.91Matsushita Electronic Components 17.91Foster Wheeler Environmental Corp. 55.67a. Calculate the mean.$56.99b. Calculate the standard deviation.$31.43c. Standardize the share price for Matsushita Electronic Components (find the z score). Interpret its meaning.-1.24; the share price is 1.24 standard deviations below the mean.5. The following boxplots show the closing share prices for the sample of companies in question 4 on the first trading days in August 2007 and in August 2002.a. For which day was the median closing share price higher?Aug. 2007b. For which day were the closing share prices more variable? Explain. Aug. 2007; the range and IQR are higher.c. Which distribution is more symmetric? Explain.Aug. 2007, the median line is near the middle of the box.6. Following is a time series graph for monthly closing price of 3M Dental Products stock (beginning June 2005).a. Are the closing prices for shares of 3M Dental Products from June 2005 through August 2007 stationary? Explain.No, an upward trend is evident.b. Would a histogram provide a good summary of these stock prices? Explain. No, because these data are not stationary.Chapter 5: Displaying and Describing Quantitative Data – Quiz C – Multiple Choice Name_________________________Consider the following to answer questions 1 – 4:Following are a histogram and the five number salary for salaries (in $) for a sample of U.S. marketing managers.Min Q1 Median Q3 Max46360 6969377020 917501294201. The shape of this distribution isA. symmetric.B. bimodal.C. right skewed.D. left skewed.E. normal.2. The most appropriate measure of central tendency for these data is theA. median.B. mean.C. mode.D. range.E. standard deviation.3. The IQR for these data isA. $83,060.B. $22.057.C. $69,693D. $77.020E. $14,5664. Suppose the marketing manager who was earning $129,420 got a raise and is now earning $140,000. Which of the following statement is true?A. The mean would increase.B. The median would increase.C. The range would increase.D. Both A and C.E. All of the above.Consider the following to answer questions 5 – 7:The following table shows closing share prices for a small sample of companies. COMPANY CLOSING SHARE PRICE – 08/073M Dental Products 86.95Tyco Electronics Power Systems 47.45Kyocera America Inc. 94.10Pfizer Inc. 22.39Xerox Company 17.56Northrop Grumman Corporation 75.81Lockheed Martin Maritime Systems 100.17Sony DADC 51.91Matsushita Electronic Components 17.91Foster Wheeler Environmental Corp. 55.675. The mean closing share price isA. $31.23B. $44.65C. $56.99D. $62.19E. $75.776. The standard deviation in closing share prices isA. $31.23B. $44.65C. $56.99D. $62.19E. $75.777. The z score for the share price for Matsushita Electronic Components isA. 1.24B. 2.34C. -2.34D. -3.00E. -1.24Consider the following to answer questions 8 – 9:The following boxplots show monthly sales revenue figures ($ thousands) for a discount office supply company with locations in three different regions of the U.S. (Northeast, Southeast, and West).8. Which of the following statements is true?A. The southeast has the lowest sales revenues.B. The southeast has the lowest median sales revenue.C. The west has the lowest mean sales revenue.D. The west has the lowest median sales revenue.E. None of the above.9. Which of the following statements is false?A. The west has the most variable sales revenues.B. The west has the largest IQR.C. The southeast has the smallest IQR.D. The northeast has the most variable sales revenues.E. The southeast has the least variable sales revenues.10. Following is a time series graph for monthly closing stock prices of 3M Dental Products. Which of the following statements is true?A. The data are stationary.B. The data show an upward trend.C. A histogram would provide a good representation of these data.D. Both A and CE. Both B and CCHAPTER 5 Quiz C Business Statistics: A First Course55 Chapter 5 – Quiz C – Key1. C2. A3. B4. D5. C6. A7. E8. B9. D10. BCopyright © 2011 Pearson Education, Inc. Publishing as Addison-Wesley.。