1961_2005年黄河流域极端气候事件变化趋势_陈效逑
- 格式:pdf
- 大小:264.64 KB
- 文档页数:4
近50年黄河流域气温变化特征及背景分析潘攀;祝亚丽;王纪军【期刊名称】《气候与环境研究》【年(卷),期】2014(000)004【摘要】利用1961~2010年黄河流域142个气象观测站的资料,详细分析了近50年黄河流域气温的时空分布和变化特征。
黄河流域四季平均气温均呈现东部高、西部低、南部高、北部低的空间型态。
对流域气温进行经验正交分解,第一模态呈现全流域一致的增温形势,上游增温幅度最大[0.40°C(10 a)-1];第二模态表现为东西部反相变化;第三模态为南北部反相变化。
四季气温随时间变化均呈现上升趋势,升温幅度冬季最大[0.52℃(10 a)-1],其次是春季[0.30°C(10 a)-1]、秋季[0.26°C(10 a)-1]、夏季[0.14°C(10 a)-1]。
进一步分析表明,近50年来,黄河流域的气温增暖除了全球变暖的影响,可能还来自1980年代中期和1990年代后期两次年代际增暖的贡献,这与东亚季风的两次年代际变化时间节点是一致的。
%Spatial-temporal variations of temperature in the Yellow River valley were detailedly analysed by using 142 station observation data from 1961 to 2010. With respect to spatial distribution, the temperature increases from west to east and from north to south. Empirical orthogonal function (EOF) analysis reveals that the principal EOF mode is a consistent warming over the whole valley, with the strongest warming in the upper reaches of the Yellow River [0.40 °C (10 a)-1]. Secondly, the EOF mode shows opposite variations in the eastern and western regions. Thirdly, it shows opposite variations in the southern and northern regions. Thewarming rate is the highest in winter [0.52 °C (10 a)-1], and then spring [0.30 °C (10 a)-1], autumn [0.26 °C (10 a)-1], and summer [0.14 °C (10 a)-1]. Further analysis reveals that, in addition to the global warming impact, the warming in the Yellow River valley during recent 50 years can be attributed to large-scale interdecadal warming in the mid-1980s and the late 1990s. These two interdecadal warming events occurred synchronously with the interdecadal shifts of the East Asian monsoon.【总页数】9页(P477-485)【作者】潘攀;祝亚丽;王纪军【作者单位】河南省气候中心,郑州450003;中国科学院大气物理研究所竺可桢-南森国际研究中心,北京100029;河南省气候中心,郑州450003【正文语种】中文【中图分类】P467【相关文献】1.近50年黄河流域气温和降水量变化特征分析 [J], 刘勤;严昌荣;张燕卿;杨建莹;郑盛华2.于田近50年来平均气温和极端气温的变化特征 [J], 迪丽达尔·艾再提约麦尔; 俞永慧3.都匀市近50年气温变化特征及对农业生产的影响 [J], 罗红;李青建;龚雪鹏4.近50年新乡城乡气温变化特征及热岛效应的研究 [J], 陈雅轩5.近50年高淳二十四节气气温变化特征及突变分析 [J], 孔维财;宋如东;陆一磊;夏晓敏因版权原因,仅展示原文概要,查看原文内容请购买。
1957-2005年河南省降水和温度极端事件变化
余卫东;柳俊高;常军;王纪军
【期刊名称】《气候变化研究进展》
【年(卷),期】2008(4)2
【摘要】利用河南省1957-2005年逐日降水,最高、最低和日平均气温资料,分析了近50 a河南省极端天气事件的变化趋势.结果表明:1957-2005年河南省暴雨日数、极端降水事件和严重干燥事件发生频率都在增加,但其线性趋势并不显著;暴雨和极端降水的变化趋势呈明显的南北差异;异常高温事件增加而异常低温事件减少,暖冬的趋势比较显著;高温日数和低温日数都显著减少,其变化趋势的空间分布具有很好的一致性.
【总页数】6页(P78-83)
【作者】余卫东;柳俊高;常军;王纪军
【作者单位】河南省气象科学研究所,郑州,450003;河南省气候中心,郑州,450003;河南省气候中心,郑州,450003;河南省气候中心,郑州,450003
【正文语种】中文
【中图分类】P467
【相关文献】
1.1960~2010年宁夏降水和温度极端气候事件变化分析 [J], 孔祥伟;黄玉霞;王勇
2.1990-2010年中国极端温度和降水事件的月变化特征 [J], 杜予罡;徐昕;王元
3.河南省1961-2011年极端气温和极端气温事件的时空变化特征 [J], 王丽
4.全球变暖背景下济南及其周边地区极端温度与降水事件变化分析 [J], 焦洋;李彦之;田雪珊;周艺
5.1961—2013年河南省极端降水事件时空变化特征 [J], 赵国永;韩艳;刘明华;侯俊丽;时海萍;刘维真;郭伊利;乔强
因版权原因,仅展示原文概要,查看原文内容请购买。
黄河流域气候变化研究综述黄河流域气候变化研究综述近年来,随着全球气候变暖的加剧,气候变化对人类社会和生态环境产生了越来越大的影响。
作为中国重要的农业生产基地和经济发展中心之一,黄河流域的气候变化成为了研究的热点之一。
本文将综述黄河流域气候变化的过程、特征以及对区域农业、水资源和生态环境等方面的影响。
黄河流域位于中国北方,是中国第二大河流。
根据历史气候数据的分析,黄河流域气候变化主要经历了以下几个阶段:1960年代至1980年代初,黄河流域气温呈现略微下降的趋势;1982年至2001年,气温开始回升,并出现了明显的升高趋势;2002年至今,黄河流域气温快速上升,并且变暖趋势更为显著。
这种气温变化趋势与全球气候变暖一致,且呈现出明显的地域差异。
此外,黄河流域的降水也发生了明显的变化。
研究发现,2002年以来,黄河流域的降水量整体呈现上升趋势,尤以夏季为明显。
而在气候变暖的过程中,黄河流域的降水更加不稳定,出现了频繁的极端天气事件,如暴雨、干旱等。
这种降水变化对黄河流域的水资源和农业生产产生了重要的影响。
黄河流域气候变化对区域农业产生了广泛的影响。
首先,气温上升加速了作物生长周期,提高了作物的产量,但也给农业生产带来了一定的风险。
其次,降水的不稳定性导致农作物遭受水分胁迫,增加了干旱损失和灌溉需求。
此外,气候变化还引发了病虫害的爆发,对农业生产造成了巨大的影响。
水资源是黄河流域的重要资源,而气候变化对水资源的供需关系产生了重要影响。
黄河流域的降雨水量和蒸发量的变化,直接影响了黄河的水量。
随着地表温度的升高,土壤湿度减少,导致土壤储水能力下降。
此外,冰川融化速度的加快也对水资源的供应产生了一定的影响。
所有这些因素使水资源供需矛盾更加突出,加剧了水资源的紧张局势。
气候变化对黄河流域生态环境的影响同样不容忽视。
随着气温的升高和降水的变化,黄河流域的植被分布范围发生了变化。
一些适应干旱环境的植物逐渐向北方迁移,而部分耐寒树种面临着生存的困境。
1961-2005年黄河流域极端气候事件变化趋势
陈效逑;刘立;尉杨平
【期刊名称】《人民黄河》
【年(卷),期】2011(033)005
【摘要】利用黄河流域58个气象站点1961-2005年的逐日平均气温、最高气温、最低气温和逐日降水量数据,采用百分比阈值法定义极端气温和极端强降水事件,计
算气象综合干旱指数(CI),并分析了黄河流域极端气候事件的变化趋势及其空间格局.结果表明:黄河流域极端低温和极端高温天数分别呈减少和增加趋势,平均速率分别
为-3.8d/10a和1.7d/10a;年极端强降水总量的变化趋势存在着明显的区域差异,河源区增加最显著,而中游的黄土高原中、东部减少最显著;干旱天数呈减少趋势,河源区减幅最大,河套-宁夏平原以及鄂尔多斯高原西北部的减幅最小.
【总页数】3页(P3-5)
【作者】陈效逑;刘立;尉杨平
【作者单位】北京大学城市与环境学院,北京,100871;北京大学城市与环境学院,北京,100871;北京大学城市与环境学院,北京,100871
【正文语种】中文
【中图分类】P467
【相关文献】
1.1960-2010年河南省极端气候事件变化趋势 [J], 张延伟;史本林;朱孔来
2.1961-2005年宁夏极端降水事件变化趋势分析 [J], 陈晓光;Declan Conway;陈
晓娟;郑广芬
3.1961-2005年江苏省降水变化趋势 [J], 邱新法;张喜亮;曾燕;武金岗
4.1961-2005年东北地区气温和降水变化趋势 [J], 贺伟;布仁仓;熊在平;胡远满
5.1978-2014年新疆农作物受极端气候事件影响的灾情变化趋势分析 [J], 唐湘玲;吕新;欧阳异能;何瑛
因版权原因,仅展示原文概要,查看原文内容请购买。
近56年中国极端降水事件的时空变化格局卢珊;胡泽勇;王百朋;秦佩;王丽【期刊名称】《高原气象》【年(卷),期】2020(39)4【摘要】基于中国693个地面观测站1961-2016年的逐日降水资料,全面分析了全国和各分区极端降水事件、连续性极端降水事件及其起止时间的时空分布和变化特征。
结果表明,近56年,全国极端降水事件明显增多,极端降水量和极端降水日数呈增加趋势的站点占总站数的68%,且主要集中在东南沿海和西部地区。
华东地区是全国极端降水量增长幅度最大的地区,增速达18. 2 mm·(10a)^-1,西北地区的极端降水日数增速最快,每10年增加0. 37天。
全国平均的连续性极端降水事件表现为不显著的增加趋势,其中仅西北地区的连续性极端降水量和降水频次的增加趋势达到0. 01显著性水平,华北和西南地区的连续性极端降水事件表现为不显著的下降趋势。
全国平均的极端降水事件的开始时间和结束时间分别呈现出明显的提前和推迟趋势,西北、青藏和东北地区极端降水事件的开始时间显著提前,西北地区的结束时间显著推迟,受其影响,西北地区的极端降水事件持续期增长幅度最大达到10.4 d·(10a)^-1。
【总页数】11页(P683-693)【作者】卢珊;胡泽勇;王百朋;秦佩;王丽【作者单位】中国科学院西北生态环境资源研究院寒旱区陆面过程与气候变化重点实验室;陕西省气象局;中国科学院青藏高原地球科学卓越创新中心;中国科学院大学;西安市气象局【正文语种】中文【中图分类】P426.6【相关文献】1.宁夏近50年极端强降水事件的时空变化分析2.近50a三峡库区汛期极端降水事件的时空变化3.中国近50 a极端降水事件变化特征的季节性差异4.1961-2014年中国东部地区夏季极端降水事件时空变化特征5.近60年来百色地区极端降水事件的时空节律变化特征因版权原因,仅展示原文概要,查看原文内容请购买。
“黄河流域气候变化情景研究-快速评估”项目成果简介由北京大学城市与环境学院陈效逑教授和黄河水文水资源科学研究院王玲研究员的研究团队共同承担的“黄河流域气候变化情景研究-快速评估”项目,经过一年的研究探索,取得了一系列研究成果。
气候、水文和社会经济系统的历史数据和未来预测数据分析表明,黄河流域水资源十分脆弱,受到气候变化和社会经济发展的影响显著,流域水平衡的变化将在很大程度上影响流域管理的对策和生态系统的功能。
历史数据统计分析显示:(1)在1961-2005年期间,黄河流域年平均气温的上升速率达到0.3℃/10a,其中,以内流区气温上升最快,各季节升温速率以冬季最快,秋季最慢。
年降水量呈不显著减少的趋势,仅龙门至三门峡区间呈显著减少的趋势(-21.9mm/10a)。
年水面蒸发量的降低速率为35mm/10a,以三门峡至花园口区域的降低速率最快(-91.7mm/10a)。
(2)在1956-2008年期间,黄河流域多年平均天然径流量为582.2亿m3,1990年代和2000年以来明显下降,降幅分别为-11.7%和-13.6%,尤以河口镇-龙门区间最为突出,降雨量变化是影响河川天然径流量的主要因素。
(3)在1953-1980年期间,黄河流域人口年平均增长率为26.1‰,之后降至12.5‰;在1980-2007年期间,黄河流域GDP年均增长率达11.0%。
随着社会经济的发展,黄河流域用水量呈逐步上升的趋势,1962-1989年的年平均增长率为4.9%,1990年代以来保持基本稳定。
未来气候变化和社会经济发展情景下的预测表明:(1)与1961-1990年相比,在气候变化B2情景下,2050年黄河流域年平均气温的增幅将普遍达到2.2℃以上;大部分地区(除黄土高原中西部)的年降水量略有增加,下游一些地区增幅可达40mm以上;年实际蒸发量也以增加为主,上游一些地区的增幅可达50mm 以上。
(2)随着气温的升高和蒸发量的增大,尽管降水量略有增加,但黄河花园口段2050年的年径流量将较历史平均值减少7.5%(气候变化B2情景)。
1961-2005年中国霾日气候特征及变化分析1961-2005年中国霾日气候特征及变化分析近几年,中国的空气质量问题备受关注。
其中,霾天气作为空气污染的一种形式,对人们的健康和生活产生了不可忽视的影响。
为了更好地了解1961-2005年中国霾日的气候特征及其变化情况,本文对相关数据进行了分析,并总结了一些有意义的发现。
首先,我们采用了1961-2005年中国163个气象站的日均霾日数据,对霾日的时空分布进行了统计。
结果显示,在这45年的时间范围内,全国范围内霾日的数量呈逐渐上升的趋势。
具体而言,1961-1975年间,全国平均每年霾日数量为28天;1976-1990年间,平均每年霾日数量上升到46天;1991-2005年间,平均每年霾日数量达到了56天。
这说明了中国霾日的增加趋势。
其次,对于霾日的季节变化特征的分析表明,霾日主要集中在秋季和冬季。
其中,冬季霾日明显多于秋季。
这可能与冬季的气温和天气条件有关,冬季气温低且大气稳定,使得湿度增加,形成了更多的霾天气。
而在夏季和春季,霾日数量较少。
进一步分析城市和农村地区的霾日数据,我们发现城市地区的霾日数量明显多于农村地区。
这可能与城市的工业发展和汽车尾气排放等人为因素有关。
城市的高密度建筑和机动车辆使得空气更加污染,从而导致霾天气的产生增加。
因此,城市地区的空气质量问题更为突出。
此外,对于不同地区的比较,我们发现长江以北地区霾日的数量要多于长江以南地区。
这可能与流动暖湿气流接触之处较多的南方地区较少霾日有一定关联。
而长江以北地区冬季气候严寒,大气稳定,湿度高,因此易形成大范围的霾天气。
最后,对于霾日的年际变化分析,我们发现在1980年代中期以后,中国霾日数量出现了显著增加的趋势。
这可能与中国经济快速发展、工业化进程的加速以及人们对环境保护意识的不断提高有关。
伴随着工业化和城市化的加速进行,大量的废气和颗粒物排放导致空气污染问题加重,从而增加了霾日的发生频率。
河南省1961-2011年极端气温和极端气温事件的时空变化特征王丽【期刊名称】《气象与环境科学》【年(卷),期】2013(036)002【摘要】根据1961-2011年河南省32个气象站逐日最高、最低气温资料,以百分位阈值方法定义极端气温事件的阈值,采用线性倾向估计及Mann-Kendall检验两种方法,对河南省极端气温和极端气温事件的时空变化特征进行了研究.结果表明:1)河南省极端最高气温以0.20℃/10a的速率呈显著降低趋势;极端最低气温以0.42℃/10a的速率呈显著升高趋势,其升高趋势比前者降低趋势更为显著.2)河南省极端高温事件频数与极端低温事件频数分别以2.04天/10a和3.13天/10a的速率显著减少,且后者比前者减少趋势更为显著.3)极端最高气温降低的突变年与极端高温事件频数减少的突变年一致,均为1969年;极端最低气温升高的突变年与极端低温事件频数减少的突变年一致,均为1985年.4)河南省极端最高(低)气温与极端高(低)温事件频数变化趋势呈现明显的季节差异和地区差异.【总页数】6页(P31-36)【作者】王丽【作者单位】中国气象局·河南省农业气象保障与应用技术重点实验室郑州450003;河南省气象台郑州450003【正文语种】中文【中图分类】P423.3+6【相关文献】1.红水河流域1961-2011年极端气温变化特征分析 [J], 田义超;梁铭忠;胡宝清2.河南省极端气温时空变化特征分析 [J], 王铃清3.1958—2012年郑州市极端气温和极端气温事件年际变化特征 [J], 吴燕锋;巴特尔.巴克;阿斯姑力.托合提;加依娜古丽.窝扎提汗;李维;魏小琴;Rasulov H H4.1955-2017年陕西省极端气温事件时空变化特征 [J], 安彬;张淑兰;肖薇薇;孙虎5.1961-2016年河南省极端气温事件变化特征 [J], 赵国永;韩艳;刘明华;徐畅;许凤;侯俊丽因版权原因,仅展示原文概要,查看原文内容请购买。
近50年黄河流域降水量及雨日的气候变化特征常军;王永光;赵宇;李凤秀【期刊名称】《高原气象》【年(卷),期】2014(33)1【摘要】利用1961-2010年黄河流域143个测站降水量和雨日资料,分析了黄河流域年、季降水和雨日的时空变化特征。
结果表明:(1)多年平均年降水量和年雨日空间分布特征均呈北少南多。
(2)年降水量和年雨日变化趋势相一致,二者均呈减少趋势,年降水量负趋势的测站数达81.8%,年雨日负趋势达88.8%,即年雨日较年降水的减少趋势更显著。
(3)在季节变化方面,除冬季外,春、夏和秋季的降水量和雨日都是负趋势,特别是秋季减少最显著。
四季降水量通过显著性水平检验的负趋势站数从多到少依次为秋季>春季>夏季>冬季,雨日则为秋季>夏季>春季>冬季。
(4)流域年降水和年雨日一致突变点为1985-1986年,其降水量及雨日减少主要原因是大气环流发生了变化,1986年以前黄河流域降水和雨日偏多是由于季风较强,使水汽得到有效输送和河套西北部的风向辐合造成的,而突变后降水和雨日减少与季风偏弱、缺乏有效的水汽输送和蒙古至河套的反气旋环流有关。
【总页数】12页(P43-54)【作者】常军;王永光;赵宇;李凤秀【作者单位】中国气象局农业气象保障与应用技术重点开放实验室;河南省气候中心;国家气候中心;南京信息工程大学【正文语种】中文【中图分类】P461【相关文献】1.近60年长沙雨日及降水量的气候变化研究2.近40年浙江省降水量、雨日的气候变化3.安徽省近60年雨日、降水量及雨强的气候变化特征4.近48年西南地区降水量和雨日的气候变化特征5.近50年云南省雨日及降水量的气候变化因版权原因,仅展示原文概要,查看原文内容请购买。
1951年以来黄河流域气温和降水变化特点分析杨特群;饶素秋;陈冬伶【期刊名称】《人民黄河》【年(卷),期】2009(031)010【摘要】在全球变暖的气候背景下,统计分析了1951年以来黄河流域气温和降水的变化情况,结果表明:①从20世纪50年代到70年代,黄河流域的气温比较稳定,80年代以后各区间气温均呈上升趋势,90年代升温明显加快,2000年以后的年平均气温比20世纪50年代普遍升高1 ℃以上;②冬季是黄河流域气温升幅最大的季节,2000年以后的冬季平均气温比20世纪60年代普遍升高2 ℃以上;③黄河流域降水没有统一的年代际变化规律,各区间特点不尽相同;④黄河流域各区间汛期降水量的年代际变化规律与年降水总量的变化规律大致相同;⑤未来两年黄河下游地区可能处在降水较多的时段,兰州-托克托区间降水仍然偏少,兰州以上和黄河中游地区降水大体接近常年.【总页数】2页(P76-77)【作者】杨特群;饶素秋;陈冬伶【作者单位】黄河水利委员会,水文局,河南,郑州,450004;黄河水利委员会,水文局,河南,郑州,450004;黄河水利委员会,水文局,河南,郑州,450004【正文语种】中文【中图分类】P333;TV882.1【相关文献】1.黄河流域季节降水变化特征分析 [J], 陈磊;王义民;畅建霞;魏洁2.1962年以来大同市气温和降水变化及其突变特征研究 [J], 吴宇婧;梁爱民;马义娟;钞锦龙;苏志珠3.江西省1960年以来气温和降水变化趋势分析 [J], 洪霞;陈建萍4.1956—2018年青海省黄河流域降水变化特征分析及预测 [J], 冷雪;庞亮;姜欣彤;董胜5.湖北省1961年以来气温和降水变化趋势及分布 [J], 覃军;王海军因版权原因,仅展示原文概要,查看原文内容请购买。
1961~2010年西北地区极端气候事件变化特征齐月;陈海燕;房世波;余卫国【摘要】利用1961~2010年西北地区131个气象站的逐日平均气温、最高和最低气温及逐日降水资料,分析了西北地区极端气候事件的变化趋势及空间分布特征.结果表明:气候变暖背景下,西北地区近50 a来气温整体呈增加趋势,极端高温事件增多,极端低温事件减少;降水量呈微弱的增加趋势,极端降水事件增多;极端高温日数分别在1982年和1996年发生转折,95%、99%极端低温日数均在1980年前后发生突变,95%、99%极端降水日数分别在2000年和1980年出现转折,这与气温和降水的变化趋势一致.极端低温日数减少的幅度大于极端高温日数增加的幅度,表明气温日较差呈减小趋势,存在非对称性增温特征.空间上,增温率大的区域其极端高温日数增加,极端低温日数显著减少;95%、99%极端降水日数增率大的区域多位于降水量倾向率较高的地区.【期刊名称】《干旱气象》【年(卷),期】2015(033)006【总页数】7页(P963-969)【关键词】极端气候事件;西北地区;菲对称性增温;变化趋势【作者】齐月;陈海燕;房世波;余卫国【作者单位】中国气象局兰州干旱气象研究所,甘肃省干旱气候变化与减灾重点实验室,中国气象局干旱气候变化与减灾重点实验室,甘肃兰州730020;江苏省连云港市灌南县气象局,江苏灌南222500;中国气象科学研究院,生态环境与农业气象研究所,北京100081;中国气象科学研究院,生态环境与农业气象研究所,北京100081;安徽理工大学测绘学院,安徽合肥232001【正文语种】中文【中图分类】P467引言近一个世纪以来,气候系统正经历着以全球变暖为主要特征的显著变化,全球变暖使得水分循环加强、极端气候事件增多、旱涝频率加大,对社会稳定、经济发展和人民生活产生严重影响,极端气候事件已引起人们的广泛关注[1-6]。
IPCC第五次评估报告(AR5)指出,1880~2012年全球海陆表面平均温度呈线性上升趋势,升高了0.85 ℃。
1961—2005年河南盛夏降水特征分析
刘云丰;张博;李沁东
【期刊名称】《科技与创新》
【年(卷),期】2018(000)006
【摘要】利用河南17个测站1961—2005年逐日降水资料,通过趋势分析、Mann-Kendall突变检验、小波分析、EOF(正交分解)对我国河南省7月、8月降水进行了年代际特征分析。
结果表明,近45年来,河南省7月、8月降水量空间分布是东南多西北少,降水量有微弱的上升趋势,且降水量存在较为显著的准2年、准7年的周期振荡现象。
由合成分析可知,东亚夏季风偏东南气流的增强有利于河南地区降水量的增加,而其中一个重要的指标是,极端降水频次空间分布在河南中部地区。
运用EOF分解方法分析,结果表明,第一模态为河南省7月、8月极端降水频次的一致性,第二模态为南北反位相。
此外,极端降水频次呈微弱上升趋势,在20世纪70年代有一次突变,经历了由少到多的过程,且存在准3年、准7年的周期振荡。
【总页数】6页(P26-31)
【作者】刘云丰;张博;李沁东
【作者单位】[1]中国民用航空飞行学院,四川德阳618307;[1]中国民用航空飞行学院,四川德阳618307;[2]四川省西充县气象局,四川南充637200
【正文语种】中文
【中图分类】P468.024
【相关文献】
1.1961~2005年临沂市6月降水及成因探析
2.1961—2005年河南盛夏降水特征分析
3.1961-2005年江苏省降水变化趋势
4.喀什地区1961-2005年降水变化特征
5.1961-2005年东北地区气温和降水变化趋势
因版权原因,仅展示原文概要,查看原文内容请购买。
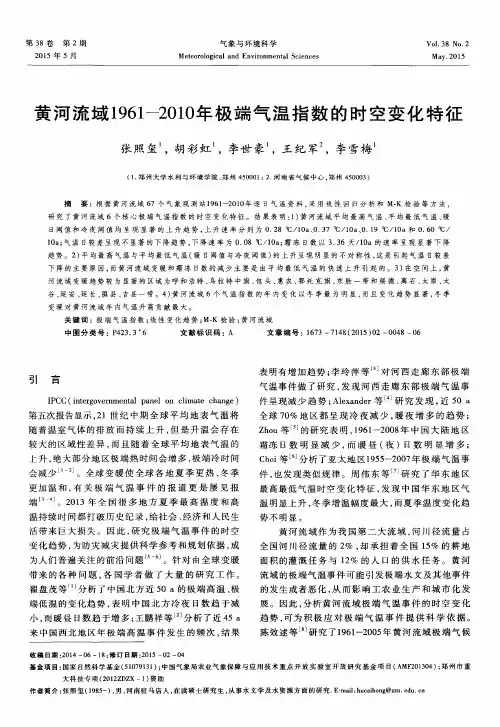
黄河流域1961-2010年极端气温指数的时空变化特征张照玺;胡彩虹;李世豪;王纪军;李雪梅【期刊名称】《气象与环境科学》【年(卷),期】2015(038)002【摘要】根据黄河流域67个气象观测站1961-2010年逐日气温资料,采用线性回归分析和M-K检验等方法,研究了黄河流域6个核心极端气温指数的时空变化特征.结果表明:1)黄河流域平均最高气温、平均最低气温、暖日阈值和冷夜阈值均呈现显著的上升趋势,上升速率分别为0.28℃/10a、0.37℃/10a、0.19℃/10a和0.60℃/10a;气温日较差呈现不显著的下降趋势,下降速率为0.08℃/10a;霜冻日数以3.36天/10a的速率呈现显著下降趋势.2)平均最高气温与平均最低气温(暖日阈值与冷夜阈值)的上升呈现明显的不对称性,这是引起气温日较差下降的主要原因,而黄河流域变暖和霜冻日数的减少主要是由平均最低气温的快速上升引起的.3)在空间上,黄河流域变暖趋势较为显著的区域为呼和浩特、乌拉特中旗、包头、惠农、鄂托克旗、东胜一带和绥德、离石、太原、太谷、延安、延长、隰县、吉县一带.4)黄河流域6个气温指数的年内变化以冬季最为明显,而且变化趋势显著,冬季变暖对黄河流域年内气温升高贡献最大.【总页数】6页(P48-53)【作者】张照玺;胡彩虹;李世豪;王纪军;李雪梅【作者单位】郑州大学水利与环境学院郑州450001;郑州大学水利与环境学院郑州450001;郑州大学水利与环境学院郑州450001;河南省气候中心郑州450003;郑州大学水利与环境学院郑州450001【正文语种】中文【中图分类】P423.3+6【相关文献】1.1961-2010年西双版纳傣族自治州极端气温时空变化特征 [J], 代云川;李丽;吴巩胜;周跃;李雯雯2.河南省1961-2011年极端气温和极端气温事件的时空变化特征 [J], 王丽3.辽河流域近60年极端气温指数时空变化特征分析 [J], 郭峰4.1961—2018年青海高原极端气温指数时空变化特征 [J], 冯晓莉;多杰卓么;李万志;申红艳;陈冀青5.遵义市极端气温指数的时空变化特征 [J], 邹德全;邹承立;田洪进;吴心路;邹象因版权原因,仅展示原文概要,查看原文内容请购买。
1961~2005年南宁灾害性天气气候事件的变化
陈业国;农孟松;陈思蓉
【期刊名称】《广西科学》
【年(卷),期】2009(016)003
【摘要】0.23℃/10a.在全球气候增暖和城市化快速发展的过程中,南宁市的灾害性天气气候事件发生了明显的变化:极端强降水有增加趋势,高温天气明显增多,持续高温天气加剧,雷暴和大风日数明显减少,春季低温阴雨天气减少.南宁市灾害性天气气候事件变化的原因可能与全球气候变暖有关,城市化可能是造成南宁市灾害性天气气候事件变化的主要原因.
【总页数】4页(P353-356)
【作者】陈业国;农孟松;陈思蓉
【作者单位】广西区气象台,广西南宁,530022;广西区气象台,广西南宁,530022;广西区气候中心,广西南宁,530022
【正文语种】中文
【中图分类】P467
【相关文献】
1.1961-2005年黄河流域极端气候事件变化趋势 [J], 陈效逑;刘立;尉杨平
2.中国交通-气象部门协作应对灾害性天气气候事件机制分析 [J], 何吉成;徐雨晴
3.中国交通-气象部门协作应对灾害性天气气候事件机制分析 [J], 何吉成;徐雨晴
4.南宁市极端天气气候事件频率和强度变化 [J], 黄雪松;李艳兰;唐炳莉;丘平珠
5.1953-2005年深圳灾害性天气气候事件的变化 [J], 王明洁;张小丽;朱小雅;陈元昭
因版权原因,仅展示原文概要,查看原文内容请购买。
第33卷第5期人民黄河Vol.33,No.5 2011年5月YELLOW R IVER M ay,2011=重点关注>1961)2005年黄河流域极端气候事件变化趋势陈效逑,刘立,尉杨平(北京大学城市与环境学院,北京100871)摘要:利用黄河流域58个气象站点1961)2005年的逐日平均气温、最高气温、最低气温和逐日降水量数据,采用百分比阈值法定义极端气温和极端强降水事件,计算气象综合干旱指数(CI),并分析了黄河流域极端气候事件的变化趋势及其空间格局。
结果表明:黄河流域极端低温和极端高温天数分别呈减少和增加趋势,平均速率分别为-3.8d/10a和1.7 d/10a;年极端强降水总量的变化趋势存在着明显的区域差异,河源区增加最显著,而中游的黄土高原中、东部减少最显著;干旱天数呈减少趋势,河源区减幅最大,河套-宁夏平原以及鄂尔多斯高原西北部的减幅最小。
关键词:极端气温;极端强降水;气象综合干旱指数;变化趋势;黄河流域中图分类号:P467文献标识码:A do:i10.3969/.j i ssn.1000-1379.2011.05.002全球变暖背景下极端气候事件频发,给人类社会造成了重大的经济损失和人员伤亡,引起了学术界的广泛关注[1-2]。
国内外对极端气候事件的研究主要集中在极端气温(低温和高温)[3-4]和极端降水(暴雨和干旱)[5-7]两方面。
在各种极端气候事件的研究中,关于/极端0的定义主要有两种:一种采用绝对值阈值法[3-4],如定义日最高(低)气温高于35e(低于0e)的日数为高温(低温)日数,定义日降水量大于50mm为暴雨;另一种采用百分比阈值法,如规定所有日降水量的第90、95或99个百分位值为极端强降水阈值[5,8]。
笔者认为第二种定义更为合理,它不仅体现了极端气候事件因地区而异的特征,而且有利于不同区域极端气候事件变化趋势的空间比较。
干旱事件的统计指标有很多,如帕尔默旱度模式[9]、K干旱指数[10]、S指数[11]等。
2006年发布的气象干旱等级国家标准[12]指出,气象综合干旱指数(CI)既反映月和季尺度的降水量异常情况,又反映短时间尺度影响农作物的水分欠缺情况,已在干旱监测和评估业务中广泛使用,故这里采用CI指数研究干旱事件的变化规律。
黄河流域横贯我国中北部,其中上游为温带半湿润、半干旱气候区,河源属高原亚寒带湿润气候区,中、下游基本上属于暖温带半湿润气候区。
黄河水少沙多,水沙异源,而且最近几十年受人类活动和气候变化的影响很大[13]。
黄河流域的极端气候事件可能带来极端水文事件的变化,从而影响工农业生产和城市化发展[14]。
根据黄河流域不同地区自然地理条件和水文气象条件的差异,将黄河流域划分为龙羊峡以上(Ñ)、龙羊峡)兰州(Ò)、兰州)河口镇(Ó)、内流区(Ô)、河口镇)龙门(Õ)、龙门)三门峡(Ö)、三门峡以下(×)7个子区域[15],并以此为空间单元分析黄河流域1961)2005年极端低温、极端高温、极端强降水和干旱的变化趋势及其区域差异,以期揭示水旱灾害的区域差异及其形成机制,因地制宜地应对气候变化和极端气候事件。
1数据来源及其处理方法1.1数据来源数据取自中国气象局国家气象信息中心提供的58个气象站连续逐日气温和降水量序列。
1.2气象数据插值方法计算极端低温、极端高温、强降水、干旱变化趋势的空间分布时,采用了基于G IS技术的高斯-克里格插值法,它是一种基于统计学的插值方法,其基本原理是根据相邻变量的值,利用变异函数揭示的区域化变量的内在联系来估计某个空间变量数值[16]。
数据插值的空间分辨率约为4km@4k m。
1.3极端气候事件的计算方法参考百分比阈值法,将1961)2005年总共16425d的日最低气温累计频率小于5%的事件定义为极端低温,日最高气温累计频率大于95%的事件定义为极端高温,日降水量累计频率大于95%的事件定义为极端强降水事件。
利用逐日最高气温、最低气温和降水量数据,计算出各站点每年的极端气候事件的天数,其中区域特征用区域内所有站点的平均值表示。
气象综合干旱指数的计算式为CI=aZ30+bZ90+c M30式中:Z30、Z90分别为近30d和近90d的标准化降水指数;M30为近30d相对湿润度指数;a、b、c分别为标准化降水系数和相对湿润系数,分别取0.4、0.4、0.8[12]。
根据前期日平均气温和日降水量可以滑动计算出每天的CI指数。
综合气象干旱等级的划分:CI>-0.6为不旱,收稿日期:2010-11-04基金项目:中国-欧盟流域管理项目(A3117)。
作者简介:陈效逑(1958)),男,北京人,教授,博士生导师,研究方向为气候变化和植物物候学。
E-m ai:l cxq@pku.e #3#-1.2<CI [-0.6为轻旱,-1.8<C I [-1.2为中旱,-2.4<CI [-1.8为重旱,CI [-2.4为特旱[12]。
这里将每年的干旱天数确定为该年C I [-1.2的天数。
根据各站点的逐日CI 指数,可以得到各个站点和水资源分区每年的干旱天数。
2 结果分析2.1 极端低温从黄河流域区域平均极端低温强度来看(表1),流域最低值(-25.2e )出现在青藏高原上的区域Ñ,最高值(-9.1e )出现在中、下游交接处的区域×。
分别统计1961)1985年和1986)2005年各区域极端低温出现的年平均天数,可以看出,各区域近20a 极端低温的天数均较之前的25a 明显减少,减少最多的是区域Ó,从平均每年24.6d 减少到11.1d ,减少幅度达55%;减少最少的是区域Õ,减少幅度为26%。
表1 黄河流域各区域极端最低气温的平均强度及其天数分 区平均强度/e 1961)1985年年均天数/d1986)2005年年均天数/dÑ-25.223.213.0Ò-18.821.315.1Ó-18.824.611.1Ô-21.123.912.0Õ-19.321.015.6Ö-12.723.612.5×-9.122.214.0从空间上看,全流域年极端低温天数呈显著减少的线性趋势,平均速率为-3.8d/10a(p <0.05)。
其中,减少最快的区域在河套平原和鄂尔多斯高原西北部一带,平均减少速率超过-5d/10a ,而陇中高原和山西高原北部减少最慢,平均减少速率不足-2.5d/10a(图1)。
图1 黄河流域年极端低温天数线性趋势的空间格局2.2 极端高温与黄河流域区域平均极端低温强度的空间分布大致相同,区域平均极端高温强度以区域Ñ最低,仅为21.5e ,而区域×最高,达到34.8e 。
各区域近20a (1986)2005)极端高温的天数均较之前的25a(1961)1985)明显增加,增加最多的是区域Õ,从平均每年15.4d 增至23.1d ,增幅达50%;增加最少的是区域×(表2)。
在1961)2005年期间,全流域极端高温天数呈增加趋势,平均速率为1.7d /10a(p >0.05),但空间格局比较复杂。
山西和陕西高原之间的局部地区增速最快,为5~7d /10a ,而陇中高原、渭河下游平原,以及中条山和伏牛山一带的增速最慢,为0~1d /10a(见图2)。
总的来说,流域大部分地区极端高温天数的增加速率小于极端低温天数的减少速率。
表2 黄河流域各区域极端最高气温的平均强度及其天数分 区平均强度/e 1961)1985年年均天数/d1986)2005年平均天数/dÑ21.517.320.5Ò27.317.020.9Ó31.517.021.0Ô32.717.220.5Õ33.315.423.1Ö32.917.021.2×34.818.718.8图2 黄河流域年极端高温天数线性趋势的空间格局2.3 极端强降水黄河流域极端强降水阈值以区域×最大,为11mm,而区域Ô最小,只有4.1mm 。
从各区域前后两个时期年极端强降水天数的变化情况看,区域Ñ和Ô天数增加,其他5个区域减少。
其中,区域Ñ从1961)1985年平均每年17.6d 增至1986)2005年平均每年19.5d ,为增幅最大的区域;而区域Ö减少1.6d ,为减幅最大的区域(表3)。
表3 黄河流域各区域极端强降水的阈值及其天数分 区阈值/mm 1961)1985年年均天数/d1986)2005年年均天数/dÑ7.617.619.5Ò7.518.618.2Ó 4.318.518.4Ô4.118.218.5Õ7.118.917.8Ö8.719.117.5×11.018.518.3黄河流域年极端强降水总量(指一年中极端强降水量的总和)增加趋势最为明显的地区主要集中在河源区,增速为12~24mm /10a ;而减少趋势最为明显的地区出现在黄土高原的中、东部,减速为-12mm /10a 以上(图3)。
图3 黄河流域年极端强降水总量线性趋势的空间格局2.4 干 旱从各区域多年平均干旱天数来看,除区域Ô(内流区)外,区域Ñ)区域Ó较小,区域Õ)区域×较大。
在1961)2005年期间,区域×的年干旱天数最多,区域Ñ的年干旱天数最少。
分时段统计结果表明,1961)1975年是黄河流域各区域最为干#4#旱的时段,此后,年干旱天数总体趋于减少。
各区域近15a (1991)2005年)的年平均干旱天数与最初15a (1961)1975年)相比都明显减少,但与中间15a (1976)1990年)相比区域Ó)区域×略有增加(表4)。
表4 各区域分时段年平均干旱天数d分区1961)2005年1961)1975年1976)1990年1991)2005年Ñ34.653.034.416.5Ò50.974.243.535.0Ó65.685.355.556.0Ô70.488.259.963.1Õ62.889.245.753.6Ö69.988.557.264.0×72.6105.056.056.7从空间上看,黄河流域年干旱天数呈明显减少的趋势,其中:河源区的减少速率最大,为-15d/10a ;河套-宁夏平原以及鄂尔多斯高原西北部的减少速率最慢,为-7~-9d/10a(图4)。