Hierarchically-Ordered Electroactive Silica-Polyaniline Nanohybrid
- 格式:pdf
- 大小:1.17 MB
- 文档页数:10

电气自动化专业英语abbreviate 缩写,缩写为abscissa axis 横坐标absolute encoder 绝对编码器ac squirrel cage induction motor 交流笼型感应电动机ac motor 交流环电动机academic 纯理论的accelerometer 加速度测量仪accommodate 适应accutrol 控制器acoustic wave 声波active 有源的active region 动态区域active filter 有源滤波器active component 有功分量active in respect to 相对….呈阻性active(passive) circuit elements 有(无)源电路元件actuate 激励,驱动actuator 执行机构actuator 执行器adjacent 临近的,接近的adjacent 相邻的,邻近的Adjustable-voltage inverter 电压型逆变器admittance 导纳advent 出现air gap 气隙aircraft 飞机air-gap flux 气隙磁通air-gap line 气隙磁化线air-gap flux distribution 气隙磁通分布algebraic 代数的algebraic 代数的algebraical 代数的algorithm 算法algorithmic 算法的align 调整,校准allowable temperature rise 允许温升alloy 合金allude 暗指,直接提到alnico 铝镍钴合金alphabet 字母表alternating current, AC 交流aluminum 铝ambient 环境的ambiguity 模棱两可Ammeter 安培计、电流表ammeter 电流表ampere-turns 安匝(数)amplidyne 微场扩流发电机amplification 扩大Amplitude Modulation AM调幅analog electronics 电力电子学analog-to-digital conversion, ADC 模数转换器analytical 解析的analytical 分析的,分解的angular 角的anode 阳极、正极antenna 天线aptly 适当地,适宜地arbitration 仲裁,公断arc welding 电弧焊armature 电枢armature coil 电枢线圈armature m.m.f wave 电枢磁势波armature 衔铁armature 电枢armature circuit 电枢电路arrangement 结构as a rule of thumb 根据经验asynchronous machine 异步电机attenuate 衰减audio 音频的automatic station 无人值守电站automatic oscillograph 自动示波器automatic Voltage regulator(AVR) 自动电压调整器automobile 汽车automobile starter motor 汽车启动机autonomic 自治的autonomous 匿名的autotransformer 自耦变压器auxiliary 辅助的auxiliary motor 辅助电动机auxiliary 辅助的backlash 啮合间隙,齿隙ballast 镇流器bandwidth 带宽bar code reader 条码阅读器base 基极bearing 轴承bellows 膜盒bilateral circuit 双向电路bimotored 双马达的binary 二进制binary-coded decimal BCDbiphase 双相的bipolar junction transistor(BJT 双极性晶体管bistable circuit 双稳电路blend 混合,调和,配料block diagram 方框图blow (保险丝)烧断bode plot 波特图bolt 螺栓boost 增压boost-buck 升压去磁boredom 讨厌,无趣braking 制动branch circuit 直路breakaway force 起步阻力breakdown 击穿breakdown torque 极限转矩bronze 青铜brush 电刷brute 僵化的buck 补偿bushing 套管bushing 高压套bypass 旁路by-product 副产品calibrate 校正calibration 校准,标定,刻度calibration 标定,标准化call for 需要cam 凸轮cantilever 悬臂capability 容量capacitance effect 电容效应capacitor 电容器capacitor 电容器capacity 容量capsule 封装carbon 碳carbon-filament lamp 碳丝灯泡carrier 载波Cartesian coordinates 笛卡儿坐标系cartridge 盒式保险丝cast-aluminum rotor 铸铝转子cathode 阴极cease 停止,终了centimeter 厘米centrifugal 离心的,离心力centrifugal force 离心力ceramic 陶瓷的chamber 室,腔chao 混乱checksum 检查和chopper circuit 斩波电路circuit components 电路元件circuit parameters 电路参数circuit diagram 电路图circuit branch 支路circuitry 电路,线路circumference 圆周circumnavigate 饶过clamp 夹住,夹紧clamp 夹,钳classic 古典的,经典的,传统的clearance 间隙client-server 客户-服务器client-server model 客户服务器模型clinker-cooler 熟料冷却器closed-loop 闭环■coast 跟踪惯性coaxial 共轴的,同轴的cogging 齿槽效应coil winding 线圈绕组coils 线圈、绕组coincide in phase with 与….同相coincidence 一致,相等collector 集电极]collector 集电极commutation 换向commutation condition 换向状况commutator 换向器commutator 换向器commutator-brush combination 换向器-电刷总线compatible 兼容的complement 补码complex impedance 复数阻抗complex number 复数compound 紧密、结合compound generator 复励发电机compounded 复励compound-wound 复励condominium (国际)共官conductance 电导conductor 导体conduit 导线,导线管cone pulley 塔轮,快慢轮configuration 组态connection 接线端constraint 强制,约束contact 触点contactor 接触器contiguous 邻近的conveyance 运输工具conveyor 传送机copper bar 铜导条copper end rings 铜端环core 铁心corona 电晕,放电corridor 通路corridor 通道,走廊corrosion 腐蚀cost-effective 花费大的counter emf 反电势counter electromotive force、CEMF 反电势counteract 抵抗,抵消,消除counterclockwise 逆时针counterpart 对应物coupling capacitor 结合电容creep 蠕动criteria 标准,判据crude 不精细的,粗略的crystal 晶体crystal 晶体的,水晶,晶体cubicle 立方体culminate 达到极值点culprit 犯罪者cumulative compound 积复励cumulatively compounded motor 积复励电动机Current source inverter 电流型逆变器cutoff 截止,关闭Cyclic Redundancy Check 循环冗余检查cylindrical 圆柱式的damper 减速器dashpot relay 油壶式继电器dashpot 阻尼器DC link 直流环节dc generator 直流发电机dc motor 直流电动机de machine 直流电机decouple 解耦,去除干扰deenergize 不给…通电deflection 挠度、挠曲demagnetization 退磁,去磁demodulation 解调demodulator 解调器demystify 阐明denominator 分母depict 描绘、描写depict 描述depress 压下derivative 导数derive 推倒deteriorate 使….恶化deterioration 损坏,磨损deterioration 变化,降低品质deviation 偏差dial 刻度盘dial 刻度盘,调节控制盘diameter 直径diaphragm 震动膜diaphragm 膜片,挡板diaphragm 膜片diaphragm 膜,隔板dictate 确定differential compound 差复励differential pressure transducer 差压变送器differential equation 微分方程differentiation 微分diode 二极管direct axis 直轴direct axis transient time constant 直轴瞬变时间常数direct-current 直流discrete 离散的displacement 位移displacement current 位移电流dissipate 散发dissipate 浪费distillation 蒸馏distributed system 分布式系统distribution 分配,配电doubly excited 双边励磁drill 钻床due 应得到的dungen 地牢dwelling 住房dynamic response 动态响应dynamic braking 能耗制动dynamic-state operation 动态运行dynamometer 测力计,功率计e.m.f=electromotive fore 电动势eddy 涡流eddy current braking 涡流制动eddy current 涡流effective values 有效值effects of saturation 饱和效应elapse 时间(流逝)elapse 过去,消逝elbow 弯头electric energy 电能electrical stressing 电气应力electrical device 电气设备electrode 电极电焊条electrodynamometer 电测力计electro-hydraulic 电动液压的electrolytic 电解的electromagnetic torque 电磁转矩electromagnetic interference 电磁干扰electromechanical 机电的electronic mail 电子邮件electro-pneumatic 电动气动的elusive 难以捉摸的emitter 发射极emitter 发射管放射器、发射极enclosure 外(机)壳enclosure 机壳enclosure 设备外壳encode 编码encoder 编码器end ring 端环energize 励磁energy converter 电能转换器entity 实体enumerate 列举envision 预见epoch angle 初相角equilibria 平衡equilibrium level 平均值equivalent T–circuit T型等值电路equivalent circuit 等效电路error signal 误差信号error detector 误差检测器error 误差,偏差escalation 升级,提高establishment 组织,部门etiquette 规则excitation system 励磁系统excited by 励磁exciting voltage 励磁电压expedite 加速expel 排出,放出expire 期满,终止exponential 指数external armature circuit 电枢外电路external characteristic 外特性extruded 型材的fabricate 制造faithful 正确的,可靠的fallout 余波,附带结果fasten 固定,连接feasible 可行的feedback system 反馈系统feedback loop 反馈回路feedback 反馈feedback component 反馈元件feedback signal 反馈信号feeder 馈电线,电源线,馈电板feedforward 前馈felt 毡ferromagnetic 铁磁的fidelity 保真度fidelity 重现精度,真实,正确field winding 磁场绕组、励磁绕组field coils 励磁线圈field current 励磁电流field effect transistor(FET) 场效应管field pole 磁极figure of merit 品质因数,优值filter 滤波器fin 飞边fixture 设备,装置]flicker 闪烁,摇曳flip-flop 触发器fluctuation 升降剥动,不规则的变化fluorescent 荧光的,有荧光性的flux density 磁通密度flux linkage 磁链flux per pole 每极磁通forced commutation 强迫换流forced-draft 强制通风forging 锻造form-wound 模绕forward transfer function 正向传递函数forward 转发fraction 分数frame 机座,机壳frequency 频率frequency- domain 频域Frequency Shift Keying(FSK) 移频键控friction 摩擦full load 满载full-duplex 全双工full-load torque 满载转矩furnace 炉fuse 保险丝、熔丝fuse 熔断器,保险丝fuse 熔断器gain 增益gamut 全体,整体gear 齿轮、传动装置general-purpose relay 通用继电器generating 发电generator 发电机generator 发电机generator voltage 发电机电压Geometrical position 几何位置geometry 几何结构glitch 同步glue 胶合,粘贴goggles 护目镜,潜水镜graphite 石墨grinder 磨床grossly 大概,大体上的ground-fault protector (GFP)ground-fault circuit interrupter(GFCI) 接地故障保护器,接地故障断路器gyroscope 陀螺仪half-duplex 半双工hand-wheel 手轮,驾驶盘,操纵盘hardwired 硬接线的harmonic 谐波的havoc 大破坏hazard 危险hazardous 危险的heat sink 散热器heating appliance 电热器hierarchy 阶梯,等级high-gain 高增益high-pass filter 高通滤波器high-performance 高性能的high-volume 大容量hitherto 迄今,至今hockey puck 冰球hoist 起重机horsepower 马力horsepower 马力horseshoe magnet 马蹄形磁铁host 主机humidity 湿度hydraulic 液压传动hydraulic 液力的hydraulic 液压的,液压传动装置hydropower station 水电站hysteresis 磁滞ideal source 理想电源ideological 思想的imaginary part 虚部immunity 抗扰性impedance 阻抗impulse 推动力in parallel with 并联in series with 串联in terms of 根据,在……方面in the vicinity of 在…附近,在…左右in(inch,inches) 英寸incident 入射的increment encoder 增量编码器indicating needle 仪表、指针indispensable 必需的,必不可少的induced current 感生电流induced-draft fan 吸风机induction generator 感应发电机induction coupling 感应耦合induction machine 感应式电机induction machine 感应电机induction motor 感应电动机induction motor 感应电动机induction-disc relay 感应圆盘式继电器inductive component 感性(无功)分量inertia 惯性inertial 惯性的,惯量的inference 干扰infinite voltage gain 无穷大电压增益infrastructure 基础,底层结构inherent 固有的inhibit 禁止initiate 引起,促进injection molding 注模inrush current 涌流instantaneous electric power 瞬时电功率instantaneous mechanical power 瞬时机械功率instruction set 指令集insulation 绝缘insulation 绝缘insulation 绝缘insulator string 绝缘子串intake 吸入integrate 求…的积分integrated circuit 集成电路integration 积分下限integration 积分interactive 交互式interconnection 相互连接interface 接口interface data unit 接口数据单元interfere with 有害于... internal resistance 内阻interoffice 局间的interrupter 断续(流、电、路)器intimately 密切地intimately 紧密地,直接的inventory 存货,清单inventory 存货inverse 倒数inverse time relay 反时限继电器inversion 反相,反转inverting amplifier 反向放大器iron-loss 铁损isolation 隔离、分离、绝缘、隔振isolation transformer 隔离变压器jerk 振动,冲击jog 啮合joint 关节,铰链keyway 键槽killer 迷人的kiln 炉kinematic 运动的,运动学的knob 旋钮、圆形把手knob 钮,圆形把手lable 为……标号lagging(trailing) edge 下降沿laminate 叠制,叠压laminated core 叠片铁芯lamination 叠片latch circuit 锁存电路latching relay 自锁继电器lathe 车床launcher 发生器,启动装置laundry 洗衣房leading edge 上升沿leakage 漏电流leakage reactance 漏磁电抗leakage flux 漏磁通leakage current 漏电流leakage 泄漏left-hand rule 左手定则lever 杆,杠杆lever 手柄,控制杆liable 有责任的light emitting diode 发光二极管light-dimmer 调光lightning shielding 避雷lightning arrester 避雷装置limit switch 限位开关limiter 限幅器line 线电压line trap 限波器linear zone 线性区line-to-neutral 线与中性点间的link 连杆live conductor 带电导体load characteristic 负载特性load-saturation curve 负载饱和曲线locked-rotor 锁定转子locked-rotor torque 锁定转子转矩longitudinal 经度了;纵向的long-shunt 长复励loss 损耗low-pass filter 低通滤波器lubricant 润滑剂、润滑油lubrication 润滑,注油magnetic torque 电磁转矩magnetic amplifier 磁放大器magnetic circuit 磁路magnetic field 磁场magnetic flux 磁通magnetization curve 磁化曲线magnetizing current 磁化电流,励磁电流magnetizing reacance 磁化电抗magneto 磁发电机magnitude 振幅maintenance 维护malfunction 故障manipulations 操作,控制,处理manipulator 机械手,操作器manual control 手动控制margin 余量,裕度mass 物质,块,堆mass-produce 大量生产mature 成熟的means 手段,工具measurand 被测量,被测量对象mechanical rectifier 机械式整流器mechanical stressing 机械应力mechanical rectifier 机械式换向器Megohmmeter 兆欧表merit 优点,长处,指标metallic 金属的meticulous 详细的micrometer 千分尺mid-frequency band 中频带milliammeter 毫安表milling machine 铣床mine minder 矿坑卷扬机mismatch 失配moderate 适度的,适中的modulation 调制modulator 调制器modulus 模moisture 潮湿、湿气moisture 潮气,湿度molecule 分子morally 道德上,道义上motoring 电动机驱动mount 安装multimeter 万用表multiple axis drive 多轴驱动multiplexer 多路转换器mutual flux 交互(主)磁通mutual-inductor 互感narrowband filter 带通滤波器neutral 中性的nevertheless 然而newsgroup 新闻组no load 空载no-load 空载nomenclature 术语nominally 标称nonetheless,none the less 仍然,依然nonvolatile 非挥发的nuisance 障碍,公害number of poles 极数numerator 分子numerical 数值的object-oriented 面向对象的obsolete 废弃的occupancy 占有,占用,居住octal-base 八脚的offset 偏心Ohmmeter 欧姆计、电阻表open-loop 开环operating condition 运行状态operation amplifier 运算放大器operational calculus 算符演算optical fiber 光纤orifice 孔,注孔orifice 侧流板,隔板orthogonal 垂直的,正交的Oscillation 振荡oscillation 振荡oscillatory 振动的,摆动的oscilloscope 示波器outgoing 外出了,离开的out-of-step 不同步的over-current relay 过电流继电器overhauling 检修overload 过载P.D=potential drop 电压降panel 操纵台,面板parity 校验pedal 踏板,踏蹬penetrate 透过,渗透per unit value 标么值percentage 百分数performance characteristic 工作特性peripheral 外设periphery 周围,圆周permanent magnet 永磁体permanent-magnet 永磁permissible 允许的perpendicular 垂直的,正交的perpendicular 垂直的,正交的Personnel 人员、职员pertinent 有关的per-unit value 标么值pharmaceutical 药剂,药品phase 相位(控制)phase displacement 相位差phase reversal 反相phase sequence 相序philosophy 基本原理photosensor 光电传感器pickup current 始动电流piezoelectric 压电的pilot light 信号灯piston 活塞pitch 齿轮pitfall 缺陷pivot 支点pivot 轴,支点,旋转中心pivot 轴,支点plant 装置,设备plate (电)镀plug fuse 插头式保险丝plugging 反向制动plunger 可动铁心,插棒式铁心pneumatic 气动的pneumatic 气动的pneumatic 气动的,气动力学的pointer 指针polarity 极性polarity 极性polarity 极性pole 极点Polyphase 多相(的)polyphase rectifier 多相整流器polyphase rectifier 多相整流器potential transformer 电压互感器potential distribution 电位分布potential transformer 电压互感器potentiometer 电位器power frequency 工频power amplifier 功率放大器power flow diagram 功率流程图prebias 预偏置predominant 主要的,突出的prefix 前缀,把…放在前面premise 上述各点,前言,根据primary cell 原生电池primary 最初的,基本的,初级线圈prime 上撇号prime mover 原动机prime motor 原动机primitive 操作,原型prismatic 棱型的private line 专用线路process of self–excitation 自励过程process 进程profile 轮廓,仿行profile 轮廓prolong 延长propagate 传导、传播propagation 传播,宣传proposition 命题pros and cons 优缺点protective gap 保护性间隙放电protocol 协议protocol data unit 协议数据单元protrude 使伸出,突出proximity 距离quadrant 象限quadruple 四合一quantization 量化r.m.s values=root mean square values 均方根值rack mounting 机架安装radial 径向的radial 径向的,辐射状的radiated 传播random 随机的random-wound 散绕rated 额定的rated torque 额定转矩rating 额定值,标称值,定额ratio 比,比率reaction 电感reactive power 无功功率reactive component 无功分量reactive in respect to 相对….呈感性real part 实部recast 重做receptacle 插座receptacle 插座,插孔rectifier 整流器redundant 多余的redundant 多余的,重复的reference Voltage 基准电压refinement 改进refinement 明确表达regeneration 再生,、后反馈放大regenerative braking 回馈制动regulator 调节器relay 继电器release current 释放电流reluctance 磁阻reluctance 磁阻remarks 附注,要点remote database 远程数据库remote login 远程登陆remote terminal 终端representation 代表,表示reprisal 报复residence 住宅resident program 驻留程序residential 住宅的,居住的resolver 解算器resonance 共鸣resonance 共振restriking 电弧再触发resynchronize 再同步retarding torque 制动转矩retrofit 改型reveal 展现reverse braking 反接制动revolute 旋转的,转动的revolutions per minute 转/分revolutions per second 转/秒revolving magnetic field 旋转磁场RF noise 射频干扰rheostat 变阻器,电阻箱rheostat 变阻器rig 设备right-hand rule 右手定则rigid 刚性的,坚固的riiple 纹动ripple 脉动.robustness 鲁棒性rolling 轧制rolling mill 轧钢机rotating commutator 旋转(整流子)换向器rotating magnetic field 旋转磁场rotor (stator) winding 转子(定子绕组) rotor 转子rotor core 转子铁芯rotor resistance 转子电阻router 路由器rugged 坚固的runout table 输出轨道salient 突出的salient poles 凸极salient-pole 凸极式sampling 采样sampling period 采样周期saturate 使…饱和saturation curve 饱和曲线saturation effect 饱和效应scale 刻度、量程scale 改变比例schematic (电路)原理图符号sealed-off 封的self excited 自励self–excitation process 自励过程self-bias resistor 自偏置电阻self-exciting 自励的self-inductor 自感self-latching 自锁semiconductor 半导体separately 单独励磁地separately excited 他励separately excited 他励的series 串励series excited 串励series-wound 串励service data unit 服务数据单元servo 伺服servomechanism 伺服机构,伺服系统shock 冲击short-circuiting ring 短路环short-shunt 短复励shunt 分流,分路,并联,旁路shunt 并励shunt 分路器shunt excited 并励shunt displacement current 旁路位移电流shunt field 并励磁场shunt-wound 并励signal amplifier 小信号放大器signal-to-noise ration、SNR 信噪比signify 表示silica 硅石、二氧化硅silicon 硅simulate 模拟,方针simultaneous 同时的Single Side Band(SSB) 单边带single-phase 单相的singly excited 单边励磁sinusoidal 正弦的sinusoidal time function 正弦时间函数sinusoidal–density wave 正弦磁密度slip 转差率slip rings 滑环slot 槽,开槽solenoid relay 螺管式继电器solenoid 线圈solenoids 螺线管solid state 固体solid-state relay 固态继电器solt 槽sophisticated 复杂的,完善的spare 备用的spark gap 火花放电隙spatial waveform 空间波形speed regulation 速度调节speed-torque characteristic 速度转矩特性speed-torque curve 转速力矩特性曲线sphere 球体spiral 螺旋形的spring 弹簧spring 弹簧square 平方squeeze 压榨,挤,挤榨squirrel 鼠笼式squirrel cage 鼠笼squirrel-cage 鼠笼式,笼型stabilization network 稳定网络stabilize 使稳定stabilizer 稳定器stabilizing transformer 稳定变压器stand-alone 独立的standby 后备的staor winding 定子绕组starting current 启动电流starting torque 启动转矩static allocation 静态分配stator 定子stator 定子stator 定子steady–state condition 瞬态暂态steady direct current 恒稳直流电steer 驾驶,操纵,引导stepper 步进电机storage battery 蓄电池strain gage 应变计量器strategy 策略stress 应力strip 条,带,(跨接)片strive for 争取structural 结构上的studmounted 拴接式subnet 子网subsequently 其后substantially 主要地,实质上地subtle 微妙的,巧妙的subtract 减去summation 求和,加法summer 加法器summing circuit 总和线路反馈系统中的比较环节switchyard 户外配电装置symmetry 对称synchronous 同步电动机synchronous generator 同步发电机synchronous condenser 同步进相(调相)机synchronous reactance 同步电抗synchronous machine 同步电机synchronous speed 同步转速synchronous speed 同步转速synchroscops 同步指示器synthesis 综合物tachogenerator 测速发电机tachometer 转速计tachometer 测速仪tap 抽头tap 抽头taxonomy 分类学,分类technical specifications 技术条件telemedicine 远程医疗terminal 端子terminal voltage 端电压terminology 术语,专门名词terminology 术语testbed 测试平台the dielectric 电介质theorem 定理therapy 治疗thermal 热的,热量的thermocouple 热电偶thermocouple 热电偶thermometer 温度计third harmonic voltage 三次谐波电压three-phase 三相threshold 门限,阈值threshold 门,界限,阈值throttle 节流阀,风门thumb 检查、查阅thyristor 晶闸管time constant 时间常数time delay 延时time invariant 时不变的time-phase 时间相位timing relay 延时继电器toggle (来回)切换toggle 搬扭,刀闸token 令牌topology 拓扑学toroid 环状物torque 转矩,扭矩trade-off 权衡,折衷trajectory 轨迹transducer 传感器transducer 变送器transformer 变压器transformer 变压器transformer 变压器transient 瞬态的transient response 瞬态响应transistor 电子晶体管transistor 晶体管transistor-to-transistor logic,TTL 晶体管-晶体管逻辑transit 运输translatory 平移的traveling-wave 行波triac 双向可控硅Triac 双向晶闸管trial and error 试错法,试凑法triangular symbol 三角符号trigger 引起,触发trigger 起动装置trigonometric transformations 瞬时值trip coil 跳闸线圈troubleshoot 排除故障truthtable 真值表tuner 调谐器turns 匝数turns ratio 变比、匝比two-way configuration 二线制undervoltage 欠电压unidirectional 单方向的,方向不变的unidirectional current 单方向性电流uninterruptible power supply 不间断电源uninverting amplifer 同相放大器validity 正确性vane 机器的叶,叶片vector equation 向(相)量方程velodyne 伺服积分器vendor 生产厂商ventilation 通风,流通空气vernier 游标尺vibration 振动vibration 震动vicinity 附近,邻近,接近videoconference 可视会议virtual reality 虚拟现实virtually 实际上,实质上virtue 优点viscous 粘稠的viscous friction 粘滞摩擦volatile 挥发的,易失的voltage control system 电压控制系统voltage across the terminals 端电压volt-ampere characteristics 伏安特性Voltmeter 电压表、伏特计voltmeter 电压表wafer 薄片Ward-Leonard system 发电机-电动机组系统watchdog timer 看门狗定时器water-tight 防水Watt-hour 瓦时、瓦特小时watt-hour meter 电度表Wattmeter 瓦特计、电表、功率wattmeter 电力表waveguide 波导、波导管wavy groove 起伏的沟槽wear 磨损,损耗weighted 加权的whilst=whilewide area network 广域网windage 通风wind-driven generator 风动发电机winding 绕组winding 绕组winding loss 绕组(铜)损耗worldwide shared 全球共享的wound-rotor 绕线式wrap 捆,缠,环绕wreak 发泄,报复wrench 扳手wye-connected 星形连接yield 产生,提供yoke 轭zener diode 齐纳二极管zero sequence current 零序电流。

专业英语电路基础characterize描绘…的特征,塑造人物,具有….的特征property 性质,财产equal in magnitude to 在数量(数量级)上等同于convert 转换converter 转换器time rate 时间变化率mathematically 从数学上来讲differen tiate v 区分,区别in honor of 为纪念某人name in honor of为纪念某人而以他命名electromotive force (e m f )电动势voltaic battery 伏打电池,化学电池an element 一个电器元件interpret 口译,解释,说明the potential at point a with respect to point b is点a关于点b的电势Potential difference/voltage 电势差/电压expend 花费,消耗instantaneous 瞬时的,促发的passive sign convention 关联参考方向the law of conservation of energy 能量守恒定律reference polarity 参考极性electron 电子electronic 电子的electric 电的,电动的time-varying 时变的constant-valued 常量的metal lic 金属的be due to 是因为,由于,归功于building block 模块Coulomb库伦,Ampere安培,joule焦耳,Volt伏特,Watt 瓦特,work 功变量u(t),i(t)是电路中最基本的概念。
他们描述了电路中的各种关系。
电荷量的概念是解释电现象的基本原理,电荷量也是电路中最基本的量。
电荷也是构成物质的原子的电器属性,量纲是库伦。
我们从初等物理可以得知所有物质是由基本组成部分原子组成,而原子又包括电子(electron),质子(proton)和中子(neutron)我们都知道电荷e是带负电的电子,在数量上等于1.60210*1019 C, 而质子携带同等电荷量的正电荷,相同数量的质子,电子使原子呈现电中性(neutrally charged)。
离子选择电极法英文简写Ion-Selective Electrode Method (ISEM): An Overview.The ion-selective electrode method (ISEM) is a widely used analytical technique for the determination of specific ions in solutions. It is based on the principle of electrochemical transduction, where the ion concentration is directly converted into an electrical signal. This method finds applications in various fields, including environmental monitoring, clinical diagnostics, and industrial process control.Principle of Ion-Selective Electrodes.Ion-selective electrodes are sensors that have a selective response to a particular ion in a solution. They consist of a sensing membrane that is sensitive to the ion of interest and an internal reference electrode. The sensing membrane is typically made of a material that exhibits a specific affinity for the target ion. When theion contacts the membrane, it interacts with it, resulting in a change in the membrane's electrical properties.This change in electrical properties is measured as a potential difference between the reference electrode and the solution. The potential difference, known as the ion-selective electrode potential, is directly related to the logarithm of the ion concentration according to the Nernst equation. By measuring this potential difference, the concentration of the target ion can be determined.Types of Ion-Selective Electrodes.There are several types of ion-selective electrodes available, depending on the ion being measured. Some common examples include:1. Potassium Ion-Selective Electrode (K+ ISE): Used for the determination of potassium ions in biological samples and environmental waters.2. Sodium Ion-Selective Electrode (Na+ ISE): Utilizedfor sodium ion monitoring in clinical and environmental samples.3. Chloride Ion-Selective Electrode (ClISE): Employed for chloride ion determination in water and biological fluids.These electrodes are designed to be highly selective for their respective ions, minimizing interference from other ions present in the sample.Advantages of Ion-Selective Electrode Method.The ion-selective electrode method offers several advantages over other analytical methods:Selectivity: Ion-selective electrodes are highly specific to their target ions, reducing interference from other ions.Sensitivity: The method can detect low concentrations of ions, making it suitable for trace analysis.Rapid Analysis: Ion-selective electrodes provide rapid results, often within a few minutes.Ease of Use: The method is relatively straightforward and does not require complex sample preparation.Portability: Some ion-selective electrodes are designed for field use, enabling on-site monitoring.Applications of Ion-Selective Electrode Method.The ion-selective electrode method finds applications in various fields:1. Environmental Monitoring: ISEM is used to monitor ions such as chloride, sodium, and potassium in water bodies, assessing water quality and pollution levels.2. Clinical Diagnostics: Ion-selective electrodes are employed in clinical laboratories for the determination of electrolytes like sodium, potassium, and chloride in bloodand urine samples.3. Industrial Process Control: The method is used in industries to monitor ion concentrations in process streams, ensuring product quality and process efficiency.4. Food and Beverage Analysis: ISEM is used to analyze ions in food and beverage samples, such as sodium and chloride content in processed foods.5. Agricultural Research: Ion-selective electrodes are employed to study ion exchange processes in soils and plants, helping understand nutrient uptake and plant growth.Limitations of Ion-Selective Electrode Method.Although the ion-selective electrode method has numerous advantages, it also has some limitations:Interference from Other Ions: Although ion-selective electrodes are designed to be highly selective,interference from other ions can still occur, especially athigh concentrations.Temperature Dependence: The electrode response can be affected by temperature, requiring temperature compensation for accurate measurements.Sensitivity to pH: Some ion-selective electrodes are sensitive to changes in pH, necessitating pH stabilization or adjustment.Limited Lifetime: The sensing membranes of ion-selective electrodes have a limited lifetime and may require periodic replacement.Conclusion.The ion-selective electrode method is a valuable tool for the determination of specific ions in various sample matrices. Its selectivity, sensitivity, and rapidity make it an ideal choice for a wide range of applications, including environmental monitoring, clinical diagnostics, and industrial process control. However, it is important toconsider the limitations of the method and take necessary precautions to ensure accurate and reliable results.。
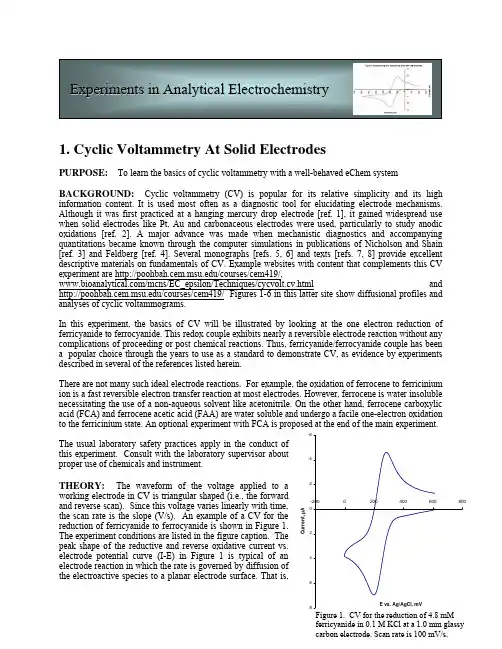
E x p e r i m e n t s i n A n a l y t i c a l E E l e c t r o c h e m i s t r y1. Cyclic Voltammetry At Solid ElectrodesPURPOSE:To learn the basics of cyclic voltammetry with a well-behaved eChem systemBACKGROUND: Cyclic voltammetry (CV) is popular for its relative simplicity and its highinformation content. It is used most often as a diagnostic tool for elucidating electrode mechanisms.Although it was first practiced at a hanging mercury drop electrode [ref. 1], it gained widespread usewhen solid electrodes like Pt, Au and carbonaceous electrodes were used, particularly to study anodicoxidations [ref. 2]. A major advance was made when mechanistic diagnostics and accompanyingquantitations became known through the computer simulations in publications of Nicholson and Shain[ref. 3] and Feldberg [ref. 4]. Several monographs [refs. 5, 6] and texts [refs. 7, 8] provide excellentdescriptive materials on fundamentals of CV. Example websites with content that complements this CVexperiment are /courses/cem419/,/mcns/EC_epsilon/Techniques/cycvolt.cv.html and /courses/cem419/ Figures 1-6 in this latter site show diffusional profiles andanalyses of cyclic voltammograms.In this experiment, the basics of CV will be illustrated by looking at the one electron reduction offerricyanide to ferrocyanide. This redox couple exhibits nearly a reversible electrode reaction without anycomplications of proceeding or post chemical reactions. Thus, ferricyanide/ferrocyanide couple has beena popular choice through the years to use as a standard to demonstrate CV, as evidence by experimentsdescribed in several of the references listed herein.There are not many such ideal electrode reactions. For example, the oxidation of ferrocene to ferriciniumion is a fast reversible electron transfer reaction at most electrodes. However, ferrocene is water insolublenecessitating the use of a non-aqueous solvent like acetonitrile. On the other hand, ferrocene carboxylicacid (FCA) and ferrocene acetic acid (FAA) are water soluble and undergo a facile one-electron oxidationto the ferricinium state. An optional experiment with FCA is prop osed at the end of the main experiment.he usual laboratory safety practices apply in the conduct of HEORY:Tthis experiment. Consult with the laboratory supervisor about proper use of chemicals and instrument.Tworking electrode in CV is triangular shaped (i.e., the forward and reverse scan). Since this voltage varies linearly with time, the scan rate is the slope (V/s). An example of a CV for the reduction of ferricyanide to ferrocyanide is shown in Figure 1. The experiment conditions are listed in the figure caption. The peak shape of the reductive and reverse oxidative current vs. electrode potential curve (I-E) in Figure 1 is typical of an electrode reaction in which the rate is governed by diffusion of the electroactive species to a planar electrode surface. That is,the rate of the electron transfer step is fast compared to the rate at which ferricyanide is transported (diffuses) from the bulk solution to the electrode surface due to a concentration gradient, as ferricyanide is reduced to ferrocyanide. In such a case the peak current, Ip, is governed by the Randle-Sevcik relationshipI p = k n3/2 A D1/2 C bυ½ (1)where the constant k = 2.72 x 10⁵; n is the number of moles of electrons transferred per mole of electroactive species (e.g., ferricyanide); A is the area of the electrode in cm2; D is the diffusion coefficient in cm2/s; C b is the solution concentration in mole/L; and υ is the scan rate of the potential in volt/s.The I p is linearly proportional to the bulk concentration, C b, of the electroactive species, and the square root of the scan rate, υ 1/2. Thus, an important diagnostic is a plot of the Ip vs. υ 1/2. If the plot is linear, it is reasonably safe to say that the electrode reaction is controlled by diffusion, which is the mass transport rate of the electroactive species to the surface of the electrode across a concentration gradient. The thickness, δ, of the "diffusion" layer can be approximated by δ ~ [D t]1/2, where D is the diffusion coefficient and t is time in seconds. A quiet (i.e. unstirred solution) is required. The presence of supporting electrolyte, such as KNO3 in this example, is required to prevent charged electroactive species from migrating in the electric field gradient.Another important diagnostic for characterizing the electrode reaction is the value of the peak potential, E p. When the rate of electron transfer is fast, the E p value will be independent of the scan rate; indicating a reversible electrode reaction. Then the difference between the anodic peak potential, E pa, and the cathodic, E pc value will be equal to 57 mV/n. The thermodynamically reversible potential, E o, is found at E0.85. That is, 85% of the way-up the I-E wave to E p. This value should also be independent of the scan rate. There are a few issues to consider -To compare your E0.85 value with values listed in books, it must be corrected since youused an Ag/AgCl reference electrode rather than the Normal Hydrogen Electrode (NHE)that was used when the Standard Values of Electrode Potentials, E o, were defined fromthe Nernst expression.Also the measured electrode potential must be corrected if there is a significant solutionresistance (ohmic) between the working and reference electrode. The measured potentialthen contains an additional component, E (ohmic) =i R. It is best to minimize thepossibility of such i R by use of a high background electrolyte concentration (ions thatcarry the current in the solution) and/or by placing the tip of the reference electrode closeto (but not touching) the surface of the working electrode.The electrode reaction during the scan from +600 mV to 0.0 mV isFe III(CN)63- + e-Æ Fe II(CN)64-E o = 0.361 V vs. NHE at 25ºC (2)The electrode potential, E, is thermodynamically determined by the Nernst relationship(3)E = E o + (0.0591/n) log (a ox/a R)where a ox is the activity of the oxidized species, ferricyanide in the present case, and a R is the activity of the reduced species, ferrocyanide. Experimentally, the activity is affected by the presence of other ions. For practicality, we therefore define a “formal potential” that uses concentration in mole/L rather than activity, which we do not know. The Nernst becomesE = E o’ + (0.0591/n) log [C ox/C R] (4)The “formal” potential, E o’, depends on the nature of electrolytes in the solution as seen in this list of Formal Potentials for ferri/ferrocyanide in aqueous solutions at 25ºC vs. NHE:E o’ valuesFe(CN)6 3- + e- = Fe(CN)64-0.1 M HCl 0.56 V1.0 M HCl 0.71 VHClO40.72 V1.0MThe potential, E, at any point along the I-E wave should reflect the concentration of the ferricyanide and ferrocyanide at the electrode surface in the presence of whatever background electrolyte you are using.Irreversibility is when the rate of electron transfer is sufficiently slow so that the potential no longer reflects the equilibrium activity of the redox couple at the electrode surface. In such a case, the E p values will change as a function of the scan rate. The computer-controlled potentiostat has algorithms to evaluate the I p and E P values, calculate the area under the I-E curves (the integrated charge), and compute an estimated electron transfer rate constant. A unique feature of an electrochemical reaction is that a "reversible" electrode reaction at low scan rates can become "irreversible" at high scan rates. Why is this? [Click on “Concepts” on the home page for additional discussion of fundamentals.]EXPERIMENTEquipment•Obtain instructions on the use of a 3-electrode potentiostat from your laboratory instructor.•Electrochemical cell and electrodeso A 3 - 4 mm diameter (planar) glassy carbon or Pt working electrodeo Pt auxiliary electrodeo Ag/AgCl reference electrodeo Small volume electrochemical cello Polishing kit•Volumetric flasks with ground glass stoppers and pipettesChemical SolutionsA.100 ml of 1.0 M KNO3B.100 ml stock solution of 10 mM potassium ferricyanide [K3Fe(CN)6] in 0.1. M potassium nitrate[KNO3]C.An unknown concentration of potassium ferricyanide solution provided by instructor (optional).Procedure1.Polishing: Prepare the working glassy carbon electrode by first lightly polishing the electrodesurface with 1 μm or smaller particles of alumina (wet) on a flat polishing plate. Wash the electrode carefully with pure water to remove any alumina. If a sonicator is available, fill a small beaker with pure water, place the electrode (tip down) and sonicate for 1 minute. Remove, rinse with pure water and touch the edges of the tip with Kimwipe or clean tissue paper but do not touch the electrode surface.2.Prepare 1, 2, 5 and 8 mM ferricyanide in 0.1 M KNO3 in 50 ml volumetric flasks.3.To run background scan, insert the electrodes (GC, reference Ag/AgCl and Pt auxiliary) and fillthe cell with 0.1 M KNO3 until the ends of the electrodes are immersed. Add stirring bar and turn ON the magnetic stirrer to stir the solution so that there is homogeneity of concentration from the surface of the electrode to the bulk solution. After the stirrer is turned OFF, if any tiny gasbubbles should be adhering to the bottom of the electrodes, lightly tap the electrode to dislodge them. If a stirrer is not used, wait ~ 2 minutes before each scan to allow equilibration of the bulk concentration with that at the electrode surface.4.Run a CV scan from an initial potential (E i) of + 600 mV to 0.0 mV and then back to + 600 mV ata scan rate of 100 mV/s. Repeat the scan after stirring the solution for 10-15 seconds andallowing the solution to quiet. The two voltammograms should match each other within 2-3 %.If not, re-polish the GC electrode and rerun.5.Run duplicate CVs on each ferricyanide solution (1, 2, 8 and 10 mM) at the scan rate of 100mV/s.6.Run duplicate CVs on the 2 mM ferricyanide solution at scan rates of 20, 50, 200 and 500 mV/s.bel and save each CV with the “save function” if using a computerized potentiostat or print outa hardcopy of what you want to save.REPORT (Data Analysis and Discussion):Consult with your laboratory instructor about the content and format of your report for this experiment. The following are suggestions and considerations regarding the content.Note: With computerized potentiostats you may be able to use Math function to determine E p and I p values. Similarly, the I p values can often be corrected for the background charging current.1.Write a short summary of what you did in this experiment, noting any deviations or substitutionsin the procedure. Show example cyclic voltammograms.2.Plot I p vs. concentration of ferricyanide. It should be linear (background corrected?). Determinethe concentration of the unknown sample of ferricyanide from this calibration plot.3.Determine the E o’ value from the voltammograms. If the values vary with the scan rate, plot themversus the scan rate and extrapolate to obtain the E o’ at zero scan rate. Compare this value with the tabulated formal potential of ferri/ferrocyanide in 0.1 M HCl.4.Tabulate the difference between E pc and E pa values – are they close to the theoretical value for areversible electrode reaction? If not, can you account for the deviation?5.Plot I pa and I pc vs. ν1/2, and from the slope, determine the value of the diffusion coefficient (mustmeasure the electrode area). How does your value compare to the literature one of 0.62 x 10⁻⁵ cm2/s? Should there be a difference in the diffusion coefficient between ferricyanide and ferrocyanide? If so, why?6.The I pc/I pa = 1 for a diffusion controlled reversible electrode reaction. [Note: the baseline needs tobe extrapolated by drawing the best straight line so that the I pc and I pa can be corrected for the background solution] Do you get unity for this ratio from your CV experiments?7.There is a current decrease at ~ 100 mV past I pc or I pa due to the concentration of the speciesbeing electrolyzed going to zero at the electrode surface. This condition is similar to that found in chronoamperometry where the rate is diffusion controlled. Under such a condition, the current decreases as a function of 1/[t]1/2. Do a plot of I vs. t1/2, starting at ~ 60 mV past E p and see if you get a linear plot. Does the same condition apply also to the anodic wave?8.Calculate δ at I p of a CV at a scan rate of 100 mV/s, assuming t = 0 occurs at the start of the risingportion of the CV wave. This value of δ is only a rough approximation but will give you a "feel"for dimensions of the diffusion layer thickness.REFERENCES1.W. Kemula, Z. Kublik, Nature, 182 (1958) 793.2.R. N. Adams, Electrochemistry at Solid Electrodes, 1968, Published by Marcel Dekker, Inc.3.R. S. Nicholson, I. Shain, Theory of Stationary Electrode Polarography. Single Scan and CyclicMethods Applied to Reversible, Irreversible, and Kinetic Systems, Anal. Chem., 36 (1964) 706.4.S. W. Feldberg, A General Method for Simulation, Vol. 3 in Electroanalytical Chemistry Series,Marcel Dekker, N.Y., 1969.5. D. K. Gosser, Jr., Cyclic Voltammetry: Simulation and Analysis of Reaction Mechanisms, VCHPublishers, 1993.6.J. Bard, L. R. Faulkner, Electrochemical Methods: Fundamentals and Applications, 2nd Ed., JohnWiley and Sons, Inc., 2001,7. D. T. Sawyer, Wm. R. Heineman and J. M. Beebe, Chemistry Experiments for InstrumentalMethods, J. Wiley & Sons, 1984, Chapter 4.8.H. A. Strobel & Wm. R. Heineman, Chemical Instrumentation: A Systematic Approach, 3rd Ed.,John Wiley & Sons, 1989, Chapter 26.OPTIONAL EXPERIMENTS:1.Run CV of ferricyanide with a Pt working electrode in place of glassy carbon. Oxygen is reducedmore readily at Pt than GC so the scan should not go below 0.0 V. Which electrode gave results closest to what is expected for a reversible electrode reaction? How close to the theoretical value of I p did you get for the reduction of ferricyanide?2.Run CVs of ferrocene carboxylic acid (FCA, concentration at 3–5 mM) in pH 7 buffer containing0.1M KNO3. FCA is water soluble as the carboxylate ion. It undergoes a nearly ideal one-electron transfer reaction without any complications. The E p separation between the E pa and E pc should be close to the theoretical value. Do scan rate studies and tabulate E pa, E pc, (E pa + E pc)/2, and the I pa and I pc (corrected for baseline) in your report. Comment on FCA’s electron transfer reversibility compared to ferri/ferrocyanide.The F.W. of FCA is 230.04. It can be purchased in small quantities from Sigma Aldrich chemicals. Please read the manufacturers label about care in handling.An example CV for the oxidation of FCA at a GC electrode is shown in Figure 2.-4-3-2-1120200400600800E vs. Ag/AgCl, mV Curre nt,µAFigure 2. CV for the oxidation of 2 mM ferrocene carboxylic acid at pH 7. Scan rate is 100 mV/s。

Highly ordered monocrystalline silver nanowire arraysG. Sauer, G. Brehm, S. Schneider, K. Nielsch, R. B. Wehrspohn et al.Citation: J. Appl. Phys. 91, 3243 (2002); doi: 10.1063/1.1435830View online: /10.1063/1.1435830View Table of Contents: /resource/1/JAPIAU/v91/i5Published by the American Institute of Physics.Related ArticlesHighly ordered self-assembled nanoscale periodic faceting in GaAs(631) homoepitaxial growthAppl. Phys. Lett. 101, 073112 (2012)Diameter dependent optical emission properties of InAs nanowires grown on SiAppl. Phys. Lett. 101, 053103 (2012)Hole spectra and conductance for quantum wire systems under Rashba spin-orbit interactionJ. Appl. Phys. 110, 113705 (2011)Structural and optical properties of m-plane GaN/AlGaN quantum wires grown by metalorganic chemical vapor depositionAppl. Phys. Lett. 99, 113106 (2011)Vibronic coupling in quantum wires: Applications to polydiacetyleneJ. Chem. Phys. 135, 054906 (2011)Additional information on J. Appl. Phys.Journal Homepage: /Journal Information: /about/about_the_journalTop downloads: /features/most_downloadedInformation for Authors: /authorsHighly ordered monocrystalline silver nanowire arraysG.Sauer,G.Brehm,and S.SchneiderInstitute of Physical and Theoretical Chemistry,University Erlangen-Nuremberg,Egerlandstrasse3,D-91058Erlangen,GermanyK.Nielsch,R.B.Wehrspohn,a)J.Choi,H.Hofmeister,and U.Go¨seleMax-Planck-Institute of Microstructure Physics,Weinberg2,D-06120Halle,Germany͑Received18September2001;accepted for publication15November2001͒Highly ordered silver nanowire arrays have been obtained by pulsed electrodeposition in self-ordered porous alumina templates.Homogeneousfilling of all the pores of the alumina template is achieved.The interwire distance is about110nm corresponding to a density of silver nanowires of61ϫ109in.Ϫ2and the diameter can be varied between30and70nm.The silver wires are monocrystalline with some twin lamella defects and grow perpendicular to the͗110͘direction.The previously encountered difficulty to obtain100%filling of the alumina pores is discussed in the framework of electrostatic instabilities taking into account the different potential contributions during electrodeposition.To obtain homogeneouslyfilled pore membranes,a highly conductive metal containing electrolyte,a homogeneous aluminum oxide barrier layer,and pulsed electrodeposition are a prerequisite.©2002American Institute of Physics.͓DOI:10.1063/1.1435830͔I.INTRODUCTIONWe report on the preparation of ordered silver nanowire arrays obtained by pulsed electrodeposition in porous alu-mina.Nearly100%filling of the nanometer sized pores with silver has been obtained.The difficulty of achieving a homo-geneousfilling is based on instabilities occurring during growth of the highly conducting silver nanowires.In other publications concerningfilling of nanopores with silver the problem of the homogeneity of thefilling is not addressed and it can be deduced from the data that only a very low filling fraction has been achieved.1–3Furthermore,so far most people dealing with thefilling of porous materials used disordered alumina,track-etched polycarbonate-membranes, or other disordered pore arrays as templates,4–6which even in case of homogeneous porefilling would yield disordered wire arrays with a large dispersion in the pore diameter.Pos-sible applications for such ordered wire arrangement include photonic crystals7and surface enhanced Raman spectroscopy ͑SERS͒.8Other applications might be based on the sharp size distribution of the wire dimensions replicating the high order of the template.After dissolving the alumina matrix,these wires can be either used as conducting nanowires in nanode-vices or as templates for hollow cylinders similar to hollow spheres.9This article is organized as follows.Wefirst report on the porous alumina template preparation.Then we will present thefilling procedure and characterize the silver nano-wire arrays.Finally we discuss the instabilities occurring during silver nanowire growth in the framework of a linear stability analysis.II.TEMPLATE PREPARATIONHexagonally ordered porous alumina templates havebeen prepared via a two-step anodization process,which isreported in detail elsewhere.10–12Briefly,afirst long-durationoxidation of high purity aluminum and subsequent completedissolution of the formed porous alumina leads to patternedaluminum substrates.The surface keeps the regular hexago-nal texture,formed during thefirst oxidation process by self-assembly,which acts as a mask for the second anodization ͑Fig.1͒.After the second oxidation,an ordered nanopore array is obtained.The diameter and depth of the pores aswell as the distance between them and the degree of orderingdepends critically on the anodization parameters.Typical pa-rameters used in this work are0.3M oxalic acid,U oxϭ40V, and Tϭ2°C.To obtain homogeneous electrodeposition intothe pores in thefinal step it is highly necessary to previouslyreduce the alumina barrier thickness at the pore bottom.Thethinning is achieved by chemical etching and/or by currentlimited anodization steps.13First,isotropic chemical porewidening reduces the barrier thickness and increases the porediameter.Then,the sample is oxidized several times for10–15min using constant current conditions,reducing thecurrent after each step by a factor of2.The anodizationpotential decreases slowly with decreasing barrier thickness.The thinning is stopped when the anodization potentialreaches a value of6to7V,which is equivalent to a barrierlayer thickness of about10nm.Further thinning might causethe oxide structure to peel off of the aluminum substrateduring the deposition.Applying current limited anodizationsteps not only results in a thinning of the barrier oxide,butalso in a modification of the pore structure.The originallystraight pores branch out at the formation front because thepore density is inversely proportional to the square of theanodizing potential͑Fig.1͒.14,15The splitting up of the poresa͒Author to whom correspondence should be addressed;electronic mail:wehrspoh@mpi-halle.deJOURNAL OF APPLIED PHYSICS VOLUME91,NUMBER51MARCH200232430021-8979/2002/91(5)/3243/5/$19.00©2002American Institute of Physicsinto the barrier layer leads to the formation of several nucle-ation sites in each pore at the beginning of the electrodepo-sition.Since the potential drop at the deposition interface depends critically on the barrier thickness,it has to be highly uniform.This is achieved by our thinning process described above.III.ELECTRODEPOSITIONThe pores are filled with silver under constant current conditions adopting the concept of pulsed electrodeposition.To achieve homogeneous filling of the pores,the choice of a suitable electrolyte is crucial.In order to avoid corrosive attack of the alumina template,the p H of the electrolyte has to be adjusted between 4and 8.16Therefore it is hardly pos-sible to work with cyanide containing silver baths,which generally require a higher p H.To supply the deposition in-terface sufficiently fast with metal ions the concentration of electroactive silver species has to be as high as possible,otherwise hydrogen evolution can become dominant.Fur-thermore,pulsed electrodeposition through an insulating bar-rier layer requires high negative polarization (U pulse as high as Ϫ8V ͒.Consequently,the electrolyte must not contain other electroactive species like,e.g.,nitrate ions,which also might react in side reactions under these conditions.Finally,stability analysis shows ͑see below ͒that the conductivity in the electrolyte has to be quite high to obtain uniform depo-sition into the pores.Based on these considerations the choice of a suitable electrolyte is not trivial.As the presence of nitrate ions and other electroactive species is excluded silver sulfate ͑8.5g/l ͒was chosen as the silver ion source.Diammoniumhydrogencitrate ͑200g/l ͒was added to ensure a high conductivity and to adjust the p H value to around 4.5.Furthermore,diammoniumhydrogencitrate has the function of a repairing agent as it favors the formation of stable alu-mina during the positive polarization in the pulse sequence͑see below ͒.Finally,the electrolyte contained potassiumthio-cyanate ͑105g/l ͒,which was necessary to dissolve precipi-tated silver salt through complexation.The pulsed elec-trodeposition consists of modulated pulses in the millisecond range ͑Fig.2͒.During each pulse of negative current (t pulse ϭ6ms,I pulse ϭ15mA/cm 2),silver is deposited at the pore bottom.A relatively high current density is applied in order to increase the number of nucleation sites in each pore.12After the deposition pulse,another pulse with positive polar-ization (t pulse ϭ6ms,U pulse ϭ6V ͒was applied to discharge the capacitance of the barrier layer and to interrupt the elec-tric field at the deposition interface immediately.The posi-tive pulse also repairs discontinuities in the barrier oxide,an important mechanism especially at the beginning of the elec-trodeposition.The current for this second pulse is also lim-ited to I max ϭ15mA/cm 2.To avoid depletion of the silver ions at the deposition interface,the ion concentration has to recover before the next double pulse is applied.Introducing a delay time t off of typically 0.4–1s is sufficient to ensure the restoration of a high silver concentration at the pore bottom before the subsequent deposition pulse appears.This im-proves the homogeneity of the deposition and prevents ex-cessive hydrogen evolution.During the electrodeposition,the potential required to ensure the desired current density is measured for each pulse.Hence the electrodeposition can easily be followed via a potential versus pulse number plot ͑Fig.3͒.Generally,the plot can be divided into three regions.At the beginning of the filling process the electrons have to tunnel through the barrier oxide before they react with the silver ions and nucleation takes place at numerous sites in each pore.The surface available for electrodeposition is quite large.Further electrodeposition leads to a filling of the branched structure and thus the electrochemically active sur-face area decreases,accompanied by an increase in the depo-sition potential ͑first region ͒.When the depositedsilverFIG.1.Schematic diagram describing the fabrication of a highly ordered porous alumina matrix and the preparative steps necessary for the subse-quent filling of the structure.The Al substrate is prestructured by a long-time anodizing until the pores arrange in a hexagonal lattice.Then the aluminum oxide is selectively removed.Starting from a prestructured Al substrate,a highly ordered alumina pore structure is obtained in a second anodization step.Afterwards,the barrier layer is thinned and the pores are widened by isotropic chemical etching.For further thinning of the barrier layer two current-limited anodization steps are used and dendrite pore formation oc-curred at the barrier layer.Then,the pores are filled by pulsed electrodepo-sition withsilver.FIG.2.Current and potential transients during electrodeposition.First a current-limited negative pulse t pulse is applied to deposit Ag.Then a positive pulse is applied to discharge the capacitance of the alumina barrier layer.The cycle is repeated after t off in order to avoid depletion of metal ions near the deposition interface.reaches the beginning of the straight part of the pores the increase in the deposition potential slows down distinctly,but still proceeds ͑second region ͒.The decreasing silver con-centration in the pore channel can be made responsible for a gentle increase in the deposition potential in this region,but it cannot explain the significant rise of more than one volt.The filling of the pores continues until the deposition poten-tial drops or exhibits some noise ͑third region ͒,which is due to an increase of the electroactive surface arising from silver deposition on top of the porous alumina matrix.Although the significant increase in the deposition potential,especially in the second region,is not completely understood yet,the po-tential versus pulse number plot at least allows one to follow and control the filling process.Additionally the charge can be calculated from the measured data and thus allows one to estimate the degree of pore filling and to control the wire length.IV.CHARACTERIZATIONThe filled alumina templates were examined by scanning electron microscopy ͑SEM ͒to determine the degree of pore filling and the extension of the silver nanowires.By etching the filled porous structure from the top,nanowires ending somewhat below the membrane surface became observable for scanning electron microscopy ͑SEM ͒examination.Etch-ing of the samples was performed by Ar sputtering with an ion mill ͑Gatan Duo Mill 600͒and led to a funnel-shaped excavation in the surface.The depth of the hole was corre-lated with the etching time.Figure 4shows two top view micrographs and one side view micrograph of a highly or-dered alumina pore structure filled with silver.The pore di-ameter is approximately 35nm and the interpore distance is 110nm.The thickness of the porous layer is approximately 2m.Figure 4͑a ͒was taken before etching the sample.In some pores,the silver nanowires reached the pore opening and excessive electrodeposition yielded three-dimensional growth of silver particles on top of the matrix structure ͑bright spots ͒.In most of the remaining ͑not completely filled ͒pores,the top of the nanowires can be seen ͑different gray levels indicate different levels of residual pore depth ͒.Figure 4͑b ͒shows the same sample after etching the initially 2m thick porous structure by about 200nm.As can be seen clearly,almost every pore is filled with silver to this level indicating fluctuations in the height of the filling of less than 10%.The same information can be obtained from Fig.4͑c ͒.Simple cutting of an ͑unthinned ͒substrate with wire cutting pliers leads to a fracture of the rigid alumina layer.Most of the pores are filled with silver wires ͑bright sticks ͒to at least 90%in height.The lack of wires in some of the pores as well as the presence of twisted and ruptured wires can easily be explained by the mechanical stress evolving during the process of the cleavage of the alumina membrane.Crystallinity and surface configuration of the silver wires were further analyzed by high-resolution transmission elec-tron microscopy ͑HRTEM ͒.After dissolving the alumina ma-trix such wires have been placed on electron microscopy copper grids covered by a thin carbon film.Although ar-ranged randomly on the carbon film,the silver wires tendtoFIG.3.V oltage-pulse-number curve during the filling process of porous alumina with Ag.In regime I the dendride-like nucleation pores are filled with Ag.The potential increases due to a reduction of the deposition area.In regime II the silver wires grow and the potential increases slightly.In regime III the silver wires reach the top of the alumina template and the noise and slight potential drop are due to the uncontrolled increase in depositionarea.FIG.4.SEM micrographs of a silver-filled alumina membrane.͑a ͒Top view of an unthinned sample,͑b ͒top view of the same sample approximately 200nm underneath the initial surface,and ͑c ͒side view of a fracture.align parallel in groups because of capillary forces acting during evaporation of the solvent.Figure 5shows a HRTEM image of a segment of two adjacent wires touching each other along a nearly horizontal line.From selected area elec-tron diffraction these silver wires are found to be single crys-talline.Nevertheless,they contain a certain extent of lattice defects such as twin boundaries and stacking faults.While the wire in the lower part of Fig.5does not exhibit lattice defects in the frame of this image,the upper wire has three planar defects that may be recognized as narrow bands of stronger contrast running obliquely across the wire.Their structures are shown in more detail in the boxes beneath.From the course of the lattice plane fringes seen here,and reflected also by the diffractogram ͑Fourier transform ͒of the image given in the circular inset,the ͗110͘zone axis of the silver lattice is deduced to be perpendicular to the wire axis.The wires have generally a face-centered-cubic ͑fcc ͒lattice,which was also confirmed by x-ray diffraction analysis.They do not show indications of neither oxide coverage nor incor-poration.V.DISCUSSIONAs mentioned in the Introduction,most studies have not discussed the achieved degree of filling of the pores with either silver 1–3or other metals like Au,17Co,18–21Fe,22or Ni.23In the present work we demonstrated that under very specific conditions of pulsed electrodeposition,one can ob-tain a nearly 100%homogeneous filling of pore arrays also with silver.In a former publication we have shown that it is indeed possible to fill homogeneous nickel and cobalt into porous alumina.13Now we are presenting a model to explain the physical reasons underlying this process.The key ingredients of our model are a thin homogeneous barrier layer,pulsed elec-trodeposition,and a highly conducting electrolyte.Figure 6shows a schematic diagram of the equivalent electrical cir-cuit applicable during pulsed electrodeposition.Starting from the current source,there is a resistance in the aluminum sub-strate (R s ),then all the pores are in parallel consisting of a thin interfacial oxide layer (R i ),the deposited metal (m ),and the electrolyte (e ).Finally,there is a common resis-tance of the electrolyte in the electrochemical cell (R e ).For a stability analysis,we can neglect the potential drop in the aluminum substrate and the electrolyte since they are simple series resistances and do not contribute significantly to the instability.The first instability arises from the fact that the alumina barrier layer at the pore bottom is not uniform.If it would be uniform,then it would represent an overall series resistance like R e or R s .However,due to the electrochemi-cal process,there are always fluctuations in the barrier layer thickness.Therefore as already pointed out by Zagiel et al.,24the barrier layer thickness and therefore the overall potential drop iR i should be as small as possible compared to the potential drop across e and m .This is the reason for thin-ning the alumina barrier layer to typically 10nm.However,this still results in a significant contribution to the potential drop of ϳ6V in the barrier layer compared to a few tenths mV for the electrolyte solution ͑Table I ͒.Therefore and be-cause of the rectifying nature of the barrier layer,we have applied a self-limiting current process by using pulsed elec-trodeposition.During the 6ms negative pulses,all of the metal ions in the pore are deposited due to the high current.Thus once all the ions have been deposited in one specific pore,the current flow is reduced and other pores with a slightly thicker barrier layer take over the current.A uniform filling of the pore bottom is achieved and the impact of fluc-tuations of R i is reduced due to a time dependent electrolyte resistivity e ͑t ͒.During the positive pulse,the capacitanceofFIG.5.HRTEM image of a segment of two adjacent silver nanowires.The upper one exhibits three planar defects shown in more detail in the box below.The diffractogram ͑circular inset ͒reflects the lattice relation between the twin lamella ‘‘T’’and wirematrix.FIG.6.Schematic diagram of the electric circuit during pulsed electrodepo-sition.TABLE I.Resistivities ͑at 38°C ͒of some metals and electrolytes used in this work and similar work in literature.MaterialResistivity in ⍀cmnickel ͑bulk ͒ 6.3ϫ10Ϫ6silver ͑bulk ͒1.4ϫ10Ϫ6nickel Watts-bath electrolyte 14Metzger Co bath 77Xu Ni bath500silver containing electrolyte ͑this work ͒5.2the barrier layer is discharged.Moreover,as pointed out by Dobrev et al.,25the use of positive pulses leads to monocrys-talline nanowires.They speculate that during the positive pulse,a certain amount of current will lead to the preferential dissolution of the defect rich metal deposit of the previous negative pulse,thus promoting monocrystalline growth.Another electrostatic instability arises during the growth of the silver wires.Since the Ag nanowires are always more conductive than the electrolyte,smallfluctuations in the length of the wire will be enhanced and will lead to nonuni-form growth.Similar to the case of pore growth in highly resistive p-type silicon,this effect can be described by a linear stability model.Following Wehrspohn et al.,26,27we can define a instability coefficient␣␣ϭeϪmeϩqR iϩm q,͑1͒where q is thefluctuation wavenumber͑in cmϪ1).If␣is negative,the metal wire front grows uniformly,i.e.,thefill-ing is homogeneous.If␣is positive,the metal wire front will in general be unstable and an inhomogeneousfilling willoccur.The inverse1/␣represents the typical length for which one silver wire will start to grow faster in one porethan in the others.To obtain a homogeneousfilling becauseof negative␣,the resistivity of the electrolyte must be lower than that of the metal wire.Such a condition is unrealistic forany metal since the conductivity of pure metals͑ϳ⍀cm͒is a few orders of magnitude higher than that of concentratedelectrolytes(ϳ10⍀cm͒.The only possibility tofill a thinlayer of porous alumina rather homogeneously is therefore toincrease1/␣so that it is larger than the membrane thickness. This means the onset of the instability will not occur belowthis critical thickness and a homogeneousfilling is possible.SincemӶe,the critical thickness1/␣simplifies to1/␣ϭ1/qϩR i/e.For qϷ105cmϪ1,R iϷ36⍀cm2for a cur-rent density Iϭ15mA/cm2and a porosity of9%,eϷ10⍀cm,1/␣is limited by the term R i/e,i.e.,interface or barrier-layer limited.Thus the barrier layer thickness is pro-portional to the critical thickness1/␣and the conductivity of the electrolyte is inversely proportional to1/␣.This under-lines the importance of using highly conductive electrolytes like Watts-bath-type electrolytes in the case of Ni and Co nanowires.Indeed,the Xu group28and the Metzger group29 both obtain very good Nifilling degrees in alumina pore arrays applying these rules.Xu uses barrier layer thinning, pulsed electrodeposition,and high temperature deposition to increase the mobility of the ions in the organic electrolyte.28 Metzger uses pulsed electrodeposition,barrier layer thinning, and also highly conducting electrolytes.However,in both studies,the resistivities are much higher than for the Watts-bath type electrolyte used in our work.13Therefore instabili-ties have to be compensated in these groups by decreased pulse duration.However,a drawback of the latter strategy is that a thicker barrier layer has to be used to reduce the dis-charge time of the barrier layer capacitance.The thicker bar-rier layer leads to significantly higher overpotentials during deposition and to a worse crystallinity of the nanowires.29VI.CONCLUSIONSA highly efficient method of depositing silver into the nanochannels of ordered porous alumina is presented.Nearly 100%of the pores werefilled with silver and only small fluctuations in the growth rate in different pores were ob-served.The silver nanowires are monocrystalline with some twin-lamella defects.The growth direction is perpendicular to the͗110͘direction.The wire diameter can be varied from 30to70nm depending on how the alumina template is pre-pared.Based on a linear stability analysis,we have modeled the electrochemicalfilling behavior.To obtain homoge-neouslyfilled pore membranes,a homogeneous aluminum oxide barrier layer,pulsed electrodeposition,and a highly conductive electrolyte are a prerequisite. ACKNOWLEDGMENTSThe authors thank S.Hopfe for the SEM sample prepa-rations and Dr.H.-N.Lee for the x-ray measurements.1Q.Zhang,Y.Li,D.Xu,and Z.Gu,J.Mater.Sci.Lett.20,925͑2001͒. 2I.Mikuslkas et al.,Opt.Mater.17,343͑2001͒.3F.Mu¨ller,A.D.Mu¨ller,M.Kro¨ll,and G.Schmid,Appl.Surf.Sci.171, 125͑2001͒.4X.Jiang et al.,J.Mater.Chem.11,1775͑2001͒.5V.M.Cepak and C.R.Martin,J.Phys.Chem.B102,9985͑1998͒.6N.F.Jana et al.,mun.͑Cambridge͒7,617͑2001͒.7H.van der Lem and A.Moroz,J.Opt.2,395͑2000͒.8G.Sauer͑unpublished͒.9F.Caruso,R.A.Caruso,and H.Mo¨hwald,Chem.Mater.11,3309͑1999͒. 10H.Masuda and K.Fukuda,Science268,1466͑1995͒.11H.Masuda,K.Yada,and A.Osaka,Jpn.J.Appl.Phys.,Part237,L1340͑1998͒.12O.Jessensky,F.Mu¨ller,and U.Go¨sele,Appl.Phys.Lett.72,1173͑1998͒. 13K.Nielsch,F.Mu¨ller,A.-P.Li,and U.Go¨sele,Adv.Mater.12,582͑2000͒. 14F.Keller,M.S.Hunter,and D.L.Robinson,J.Electrochem.Soc.100,411͑1953͒.15A.-P.Li,F.Mu¨ller,A.Birner,K.Nielsch,and U.Go¨sele,J.Appl.Phys. 84,6023͑1998͒.16P.P.Mardilovich,yadinov,N.I.Mazurenko,and R.Paterson,J. Membr.Sci.98,143͑1995͒.17X.Y.Zhang et al.,J.Mater.Chem.11,1732͑2001͒.18H.Zeng,M.Zheng,R.Skomski,D.J.Sellmyer,Y.Liu,L.Menon,and S. Bandyopadhyay,J.Appl.Phys.87,4718͑2000͒.19A.Kazadi Mukenga Bantu et al.,J.Appl.Phys.89,3393͑2001͒.20T.Thurn-Albrecht,J.Schotter,G.A.Ka¨stle,N.Emley,T.Shibauchi,L. Krusin-Elbaum,K.Guarini,C.T.Black,M.T.Tuominen,and T.P.Rus-sell,Science290,2126͑2000͒.21H.Q.Cao,Z.Xu,H.Sang,D.Sheng,and C.Y.Tie,Adv.Mater.13,121͑2001͒.22Y.Peng,H.-L.Zhang,S.-L.Pan,and H.-L.Li,J.Appl.Phys.87,7405͑2000͒.23P.M.Paulus,F.Luis,M.Kro¨ll,G.Schmid,and L.J.de Jongh,J.Magn. Magn.Mater.224,180͑2001͒.24A.Zagiel,P.Natishan,and E.Gileadi,Electrochim.Acta35,1019͑1990͒. 25D.Dobrev,J.Vetter,N.Angert,and R.Neumann,Appl.Phys.A:Mater. Sci.Process.69,233͑1999͒.26R.B.Wehrspohn,J.-N.Chazalviel,and F.Ozanam,J.Electrochem.Soc. 145,2958͑1998͒.27R.B.Wehrspohn,F.Ozanam,and J.-N.Chazalviel,J.Electrochem.Soc. 146,3309͑1999͒.28A.J.Yin,J.Li,W.Jian,A.J.Bennett,and J.M.Xu,Appl.Phys.Lett.79, 1039͑2001͒.29M.Sun,G.Zangari,M.Shamsuzzoha,and R.M.Metzger,Appl.Phys. Lett.78,2964͑2001͒.。


W. Nernst, Ann. Phys. (Leipzig) 267 (1887) 760. 760 W. Nern t关于金属板中的磁性所唤醒的电动势,热量通过金属板流动目录关于金属板中的磁性所唤醒的电动势,热量通过金属板流动 (1)1.序言 (2)2.设备说明 (2)3.测量经横向效应的方法。
(4)4.横向效应的一般信息 (5)5.对各个金属的横向影响。
(7)6.测量结果概述。
(11)8. 纵向效应 (15)9.测量结果调查 (17)10.扭转纵向出力。
(19)11,其他一些尝试。
(19)12.附录: (20)1.序言教授v。
在户外,有时对霍尔现象进行实验性研究,我很荣幸能成为我倍受尊敬的老师的雇员,观察到了新的现象,我们称之为“ h hermomagnetis chen”当磁化的金属板在正确的方向和热梯度的方向上流过热电流时,会在金属化的金属板上产生占据的电动势1)因此,我们发现,在垂直于磁场力线的金属板上,一方面两个等温线,另一方面位于同一热流线上的两个点具有电势差,并且性质明显不同。
前者-“ Transsersaleffect”一大约与场的强度成比例,并与其方向相通;后者-“ longitudinaleffect”-来自场的方向。
场大小的平方独立且平衡,而场大小的平方基本上取决于板的尺寸和热量,后者与板的形状无关,并且仅取决于电极的温度。
我们当然检测到了铋,锑,镍,钴和铁中的横向变形,并且在某种意义上它是与铁一起发生的,那个通过在替代磁场的电流方向上旋转90°来使加热梯度的方向达到水平,以使板中的电势降均匀。
对于其他四种金属,他的方向则相反。
仅铋显示出纵向效应,并且它以各种铋形式发生,有时在某种意义上,有时在与河水流动方向相反的方向上发生。
两种效应均与电极线的性质无关,并且当前随着电场的激发而发生。
下面将描述我为进一步追求这个目的而在维尔茨堡大学物理实验室进行的研究, F. Kohlrauc教授给了我机会。
Annu.Rev.Fluid Mech.1997.29:27–64Copyright c1997by Annual Reviews Inc.All rights reserved ELECTROHYDRODYNAMICS:The Taylor-Melcher Leaky Dielectric ModelD.A.SavilleDepartment of Chemical Engineering,Princeton University Princeton,New Jersey 08544KEY WORDS:electrified drops and jets,suspensions,interface charge,bulk chargeA BSTRACTElectrohydrodynamics deals with fluid motion induced by electric fields.In the mid 1960s GI Taylor introduced the leaky dielectric model to explain the behavior of droplets deformed by a steady field,and JR Melcher used it extensively to develop electrohydrodynamics.This review deals with the foundations of the leaky dielectric model and experimental tests designed to probe its usefulness.Although the early experimental studies supported the qualitative features of the model,quantitative agreement was poor.Recent studies are in better agreement with the theory.Even though the model was originally intended to deal with sharp interfaces,contemporary studies with suspensions also agree with the theory.Clearly the leaky dielectric model is more general than originally envisioned.INTRODUCTIONThe earliest record of an electrohydrodynamic experiment is in William Gilbert’s seventeenth century treatise de Magnete ,which describes the formation of a conical shape upon bringing a charged rod above a sessile drop (Taylor 1969).Nineteenth-century studies of drop dynamics revealed how radially directed forces stemming from interfacial charge offset surface tension (Rayleigh 1882),but until the 1960s most work focused on the behavior of perfect conduc-tors ,(mercury or water)or perfect dielectrics (apolar liquids such as benzene).This began to change following studies on poorly conducting liquids—leaky dielectrics —by Allan &Mason (1962).Another branch of electrohydrody-namics,electrokinetics,deals with the behavior of charged particles in aqueous electrolytes (Saville 1977,Russel et al 1989).However,there are signifi-cant differences between the behavior of electrolytes and leaky dielectrics.In electrolytes,electrokinetic phenomena are dominated by effects of interface270066-4189/97/0115-0027$08.00A n n u . R e v . F l u i d M e c h . 1997.29:27-64. D o w n l o a d e d f r o m w w w .a n n u a l r e v i e w s .o r g b yB e i j i n g F o r e s t r y U n i v e r s i t y o n 03/16/11. F o r p e r s o n a l u s e o n l y .28SA VILLEcharge derived from covalently bound ionizable groups or ion adsorption.Near a surface charged in this fashion,a diffuse charge cloud forms as electrolyte ions of opposite charge are attracted toward the interface.A concentration gradient forms so that diffusion balances electromigration.Then,when a field is im-posed,processes in this diffuse layer govern the mechanics.In electrokinetics,applied field strengths are small,a few volts per centimeter,whereas in elec-trohydrodynamics the fields are usually much larger.With perfect conductors,perfect dielectrics,or leaky dielectrics,diffuse layers associated with equilib-rium charge are usually absent.Accordingly,development of the two subjects proceeded more or less independently.Nevertheless,the underlying processes share many characteristics.Most obvious is that electric charge and current originate with ions;therefore,charge may be induced in poorly conducting liq-uids even though equilibrium charge is absent.The different treatments began to merge with the appearance of Taylor’s 1966paper on drop deformation and Melcher &Taylor’s review of the topic (1969).Applications of electrohydrodynamics (EHD)abound:spraying,the disper-sion of one liquid in another,coalescence,ink jet printing,boiling,augmenta-tion of heat and mass transfer,fluidized bed stabilization,pumping,and polymer dispersion are but a few.Some applications of EHD are striking.For example,EHD forces have been used to simulate the earth’s gravitational field during con-vection experiments carried out during a space shuttle flight (Hart et al 1986).In this application,combining a radial electric field with a temperature gradient between concentric spheres engenders polarization forces that mimic gravity.One of the more unusual appearances of EHD involves the blue haze found above heavily forested areas.BR Fish (1972)provides experimental evidence to support his proposition that the haze derives from waxy substances sprayed into the atmosphere from the tips of pine needles by high fields accompanying the overhead passage of electrified clouds during thunderstorms.This review concentrates on what has come to be known as the leaky dielectric model to elucidate its structure and describe its experimental foundations.For insight into other aspects of EHD,one or more of the many reviews or monographs 1may be consulted (Arp et al 1980,Melcher 1972,1981,Tobazeon 1984,Crowley 1986,Chang 1987,Bailey 1988,Scott 1989,Ptasinski &Kerkhof 1992,Castellanos 1994,Atten &Castellanos 1995).In its most elementary form the leaky dielectric model consists of the Stokes equations to describe fluid motion and an expression for the conservation of current employing an Ohmic conductivity.Electromechanical coupling oc-curs only at fluid-fluid boundaries where charge,carried to the interface by1Dependingon the keywords used,computer literature surveys turn up hundreds of papers onEHD since the 1960s.A n n u . R e v . F l u i d M e c h . 1997.29:27-64. D o w n l o a d e d f r o m w w w .a n n u a l r e v i e w s .o r g b yB e i j i n g F o r e s t r y U n i v e r s i t y o n 03/16/11. F o r p e r s o n a l u s e o n l y .ELECTROHYDRODYNAMICS 29conduction,produces electric stresses different from those present in perfect dielectrics or perfect conductors.With perfect conductors or dielectrics the elec-tric stress is perpendicular to the interface,and alterations of interface shape combined with interfacial tension serve to balance the electric stress.Leaky dielectrics are different because free charge accumulated on the interface mod-ifies the field.Viscous flow develops to provide stresses to balance the action of the tangential components of the field acting on interface charge.This review is organized as follows:First the model is outlined to identify approximations and potential pitfalls.Then experimental and theoretical results for two prototypical geometries—drops and cylinders—are surveyed.This dis-cussion will establish the status of the leaky dielectric model where forces are confined to a sharp boundary.In closing,recent results on motion produced by EHD body forces are surveyed to indicate how the model has been extended to new situations.BALANCE LAWSThe differential equations describing EHD arise from equations describing the conservation of mass and momentum,coupled with Maxwell’s equations.To establish a context for the approximations inherent in the leaky dielectric model,it is necessary to look on a deeper level.Then the leaky dielectric model arises naturally through a scale analysis.As noted earlier,the hydrodynamic model consists of the Stokes equations without any electrical forces;coupling to the electric field occurs at boundaries,so forces from the bulk free charge must be negligible.Moreover,the electric field is solenoidal.The next section examines how to establish conditions under which these approximations are appropriate.Scale Analysis and the Leaky Dielectric ModelUnder static conditions,electric and magnetic phenomena are independent since their fields are uncoupled (Feynman et al 1964).Insofar as the characteristic time for electrostatic processes is large compared to that for magnetic phe-nomena,the electrostatic equations furnish an accurate approximation.When external magnetic fields are absent,magnetic effects can be ignored com-pletely.From Maxwell’s equations,the characteristic time for electric phenom-ena,τc ≡εεo /σ,can be identified as the ratio of the dielectric permeability 2(εεo )and conductivity 3(σ).For magnetic phenomena the characteristic time,τM ≡µµo σ 2,is the product of the magnetic permeability,µµo ,conductivity,and the square of a characteristic length.Transport process time-scales,τP ,arise2Therationalized Meter-Kilogram-Second-Coulomb (MKSC)system of units will be used.3The conductivity will be defined explicitly in terms of properties of the constituent ions.Forthe present note simply that conductivity has the dimensions of Siemans per meter,i.e.,C 2-s/kg-m 3.A n n u . R e v . F l u i d M e c h . 1997.29:27-64. D o w n l o a d e d f r o m w w w .a n n u a l r e v i e w s .o r g b yB e i j i n g F o r e s t r y U n i v e r s i t y o n 03/16/11. F o r p e r s o n a l u s e o n l y .30SA VILLEfrom viscous relaxation,diffusion,oscillation of an imposed field,or motion of a boundary.Slow processes are defined as those where τP ≥τC τM .The second inequality can be rearranged to (ε/µ)1/2εo /σ (µo εo )1/2,and since (µo εo )−1/2is equal to the speed of light,3×108m/s, (µo εo )1/2is very small for our systems.For the electrostatic approximation to apply on a millimeter-scale,the electrical relaxation time,εεo /σ,must be longer than 10−12s.The inequality is satisfied easily because the conductivity is seldom larger than one micro-Siemans per meter for liquids of the sort under study here.Accordingly,the electrical phenomena are described by ∇·εεo E =ρe (1)and∇×E =0.(2)E is the electric field strength,and ρe is the local free charge density.Boundary conditions derived from Equations 1and 2using the divergence theorem and a pill-box system spanning a portion of a boundary show that the tangential components of E are continuous and the normal component jumps by an amount proportional to the free charge per unit area,q ,that is, εεo E ·n =q .(3)Here (·) denotes the jump,“outside–inside,”of (·)across the boundary,and n is the local outer normal.Electrostatic phenomena and hydrodynamics are coupled through the Maxwell stress tensor.A simple way of seeing the relationship between Maxwell stresses and the electrical body force is to suppose that electrical forces exerted on free charge and charge dipoles are transferred directly to the fluid.For a dipole charge Q with orientation d the force is (Q d )·∇E .With N dipoles per unit volume,the dipole force is P ·∇E ;P ≡N Q d defines the polarization vector.The Coulomb force due to free charge is ρe E ,so the total electrical force per unit volume is ρe E +P ·∇E .This force can be transformed into the divergenceof a tensor,∇·[εεo EE −12εεo E ·E δ],using Equations 1and 2.The tensor becomes the Maxwell stress tensor,σM ,εεo EE −12εεo1−ρε ∂ε∂ρ T E ·E δ,upon inserting the isotropic influence of the field on the pressure (Landau &Lifshitz 1960).A n n u . R e v . F l u i d M e c h . 1997.29:27-64. D o w n l o a d e d f r o m w w w .a n n u a l r e v i e w s .o r g b yB e i j i n g F o r e s t r y U n i v e r s i t y o n 03/16/11. F o r p e r s o n a l u s e o n l y .ELECTROHYDRODYNAMICS 31Using the expression for the electrical stress produces the equation of motion for an incompressible Newtonian fluid of uniform viscosity,ρD uDt=−∇p +∇·σM +µ∇2u .(4)Alternatively,upon expanding the stress tensor the electrical stresses emerge as body forces due to a non-homogeneous dielectric permeability and free charge,along with the gradient of an isotropic contribution,ρD uDt =−∇ p −12εo ρ ∂ε T E ·E−12εo E ·E ∇ε+ρe E +µ∇2u .(5)For incompressible fluids,the expression in brackets can be lumped together as a redefined pressure.EHD motions are driven by the electrical forces on boundaries or in the bulk.The net Maxwell stress at a sharp boundary has the normal and tangential components [σM ·n ]·n =12εεo (E ·n )2−εεo (E ·t 1)2−εεo (E ·t 2)2[σM·n ]·t i =q E ·t i(6)after absorbing the isotropic part of the stress into the pressure as noted above.It is understood that t i represents either of two orthogonal tangent vectors embed-ded in the surface.Denoting a characteristic field strength as E o and balancing the tangential electrical stress in Equation 6against viscous stress yields a ve-locity scale of q E o /µ=εo E 2o/µ.The same scale appears when the normal stress or the bulk electrical forces are used.With εo E 2oas a scale for pressure,Equation 5can be cast in dimensionless form asτµτP ∂u∂t +Re u ·∇u =−∇p −12E ·E ∇ε+[∇·(εE )]E +∇2u .(7)Here the symbols represent dimensionless variables with lengths scaled by andtime by the process scale τP ;Re is a Reynolds number,ρ u o /µ≡ρεo 2E 2o/µ2,when the electrohydrodynamic velocity scale is used for u o .Choosing ρ=103kg /m 3,µ=1kg/m-s, =10−3m,and E o =105V /m gives Re ≈10−4and a viscous relaxation time,τµ≡ 2ρ/µ,of 1ms approximately.For a dielectric constant of 4and a conductivity of 10−9S/m the electrical relaxation time,εεo /σ,is 35ms.Equation 1shows how the field is altered by the presence of free charge.In liquids,charge is carried by ions,so species conservation equations must beA n n u . R e v . F l u i d M e c h . 1997.29:27-64. D o w n l o a d e d f r o m w w w .a n n u a l r e v i e w s .o r g b yB e i j i n g F o r e s t r y U n i v e r s i t y o n 03/16/11. F o r p e r s o n a l u s e o n l y .32SA VILLEincluded to complete the description.Free charge density and ion concentration are related asρe=kez k n k .(8)Here e is the charge on a proton and z k is the valence of the k th species whose concentration is n k .Note that some of the species may be electrically neutral,that is,z k =0.Molecules and ions are carried by the flow and move in response to gradients in the electrochemical potential.If we denote the mobility of the k th species by ωk ,the species conservation equation is ∂n k+u ·∇n k =∇·[−ωk ez k n k E +ωk k B T ∇n k ]+r k ,k =1,...,N .(9)Here k B is Boltzmann’s constant,and T is the absolute temperature.The first term on the right represents ion migration in the electric field,the second de-scribes transport by diffusion,and the third denotes production due to chemical reactions since the neutral species act as a source for ions in the bulk.With a single ionic species,N =1and r 1=0;for a binary,z -z electrolyte,N =3.In the first case,ions are produced by reactions at electrodes—this is called unipolar injection .With a z -z electrolyte,ions are produced at the electrodes and by homogeneous reactions within the fluid.Here attention is focused on liquids with charge from a single 1-1electrolyte so that there are two homoge-neous reactions.A forward reaction producing positive and negative ions from dissociation of the neutral species as(neutral species ,k =1,z 1=0)→(cation ,k =2,z 2=1)+(anion ,k =3,z 3=−1)(10a)with a rate per unit volume,k +n 1,proportional to the concentration of species 1.The recombination reaction is(cation ,k =2,z 2=1)+(anion ,k =3,z 3=−1)→(neutral species ,k =1,z 1=0)(10b)with a rate of k −n 2n 3.The rate constants k +and k −are specific to the ions,neutral species,and solvent;the rate of production of cations or anions is k +n 1−k −n 2n 3.Thus,−r 1=r 2=r 3=k +n 1−k −n 2n 3(11)This situation contrasts sharply with that for strong electrolytes where neutral species are dissociated fully and reaction terms absent.Because ionic reactionsA n n u . R e v . F l u i d M e c h . 1997.29:27-64. D o w n l o a d e d f r o m w w w .a n n u a l r e v i e w s .o r gb y B e i j i n g F o r e s t r y U n i v e r s i t y o n 03/16/11. F o r p e r s o n a l u s e o n l y .ELECTROHYDRODYNAMICS 33are fast,it is convenient to imagine that the reactions are almost at equilibrium.At equilibrium,the local rate of reaction is zero,so K ≡k +/k −=n 2n 3/n 1.This complicates matters because at equilibrium one of the conservation laws must be discarded to avoid an overdetermined system.To scale the problem consistently,note that the concentrations of the two ionic species will be much smaller than the concentration of the neutral con-stituent.Accordingly,it is convenient to use different concentration scales.Neutral species concentrations are scaled with a bulk concentration denoted as n 0and ionic concentrations with √Using ω0as a mobility scale (any one of the three mobilities)and k +n 0as a reaction rate scale produces the conservation law for the neutral species,τD τP ∂n 1∂t+Pe u ·∇n 1=ω1∇2n 1−Da [n 1−n 2n 3](12a)and for each ionic species,τD τP ∂n k∂t+Pe u ·∇n k =β∇·[−z k n k ωk E ]+ωk ∇2n k+Dan 0K[n 1−n 2n 3],k =2,3.(12b)The new symbols represent a characteristic diffusion time,τD ≡ 2/ω0k B T ;a Peclet number,Pe ≡ u o /ω0k B T ≡ 2εo E 2o/µω0k B T (the ratio of the rates of ion transfer by convection to diffusion);a dimensionless field strength,β≡ eE o /k B T ;and a Damkoler number,Da ≡k + 2/ω0k B T (the ratio of a characteristic diffusion time to a characteristic reaction time).The reaction term can be eliminated from Equation 12b using Equation 12a to obtainτD τP ∂∂t n k + n 0K n 1 +Pe u ·∇ n k +n 0Kn 1=β∇·[−z k n k ωk E ]+∇2 ωk n k +ω1nK n 1 ,k =2,3.(12c)To compute local concentrations for systems in local reaction equilibrium,Equation 12c is used with k =2and k =3,along with the equation for re-action equilibrium obtained from Equation 12a for Da 1.Equations 12c for k =2and k =3can be combined to furnish an expression for the dimensionless charge density,ρe =(n 2−n 3),τD τP ∂∂tρe+Pe u ·∇ρe=β∇·[−(n 2ω2+n 3ω3)E ]+∇2[ω2n 2+ω3n 3].(13)A n n u . R e v . F l u i d M e c h . 1997.29:27-64. D o w n l o a d e d f r o m w w w .a n n u a l r e v i e w s .o r g b yB e i j i n g F o r e s t r y U n i v e r s i t y o n 03/16/11. F o r p e r s o n a l u s e o n l y .34SA VILLEFrom Equations 1and 13the characteristic charge relaxation time can now be identified (in dimensional form)as εεo /e 2(ω2n 2+ω3n 3)≡εεo /σ.To guide simplification of these equations,the magnitudes of the various groups are estimated for small ions with a characteristic radius 4,a ,of 0.25nm using the Stokes-Einstein relation,(6πµa )−1,for the mobility.Then Pe ≈105,β≈103,and the diffusion time τD ≈106s.Estimating the size of the other di-mensionless groups will require knowledge of the dissociation-recombination reactions.The equilibrium constant,K ,is estimated from the Bjerrum-Fouss theory of ion association (Fouss 1958,Moelwyn-Hughes 1965,Castellanos 1994)as inK =3π4a 3exp−e 28πa εεo k B T .(14)while the recombination rate constant (Debye 1942)k −=4πe 2(ω2+ω3)o(15)gives a forward rate constant of k +=k −K .(16)Using the data already introduced,K ≈1017m −3and k −≈10−18m 3/s so k +≈10−1s.Accordingly,Da ≈105.To estimate the concentration of charge carriers,we use an expression for the conductivity of a solution with monovalent ions derived from a single 1-1electrolyteσ=e 2(ω2n 2+ω3n 3).(17)For a conductivity of 10−9S/m with 0.25nm ions,n 2=n 3=1020m −3(≈10−7moles/liter),so n 1=1024m −3(≈10−3mol/liter).Thus,n 0/K ≈107and Da/K ≈107.To complete the simplification we need to know the charge density.Equation 1in dimensionless form is ∇·E =ρe =z (n 2−n 3);(18) ≡εεo E o /e √n 0K .Using the numerical values already defined, ≈10−4,suggesting the fluid is electrically neutral on the millimeter length scale.For4For comparison,the radius of a sodium ion in water is 0.14nm.The size of the charge carryingions in apolar liquids is largely a matter of speculation,but the presence of traces of water makes it likely that the charge carriers are larger than the bare ions.A n n u . R e v . F l u i d M e c h . 1997.29:27-64. D o w n l o a d e d f r o m w w w .a n n u a l r e v i e w s .o r g b yB e i j i n g F o r e s t r y U n i v e r s i t y o n 03/16/11. F o r p e r s o n a l u s e o n l y .ELECTROHYDRODYNAMICS 351Equation 13yields the classical Ohm’s law approximation in dimen-sionless form,∇·[(z )2n 2(ω2+ω3)]E =0(19)as long as Pe /β 1.With the numerical magnitudes given thus far,Pe /β≈10−2,prompting the approximation expressed by Equation 19.To complete the description,charge conservation at the interface must be investigated.Here it is convenient to start with Equation 9and integrate across an interface with the provision that there are no surface ing the s-subscript to denote surface concentrations and operators,and ignoring any special transport processes such as lateral surface diffusion,leads to∂n k s ∂t+u ·∇s n k s =n k sn ·(n ·∇)u + −ωk ez k n k E +ωk k B T ∇n k ·n .k =2,3.(20)∇s ·()is the surface divergence,and n k s are surface concentrations.The terms on the right stand for changes in concentration due to dilation of the surface and transport to the surface by electromigration and diffusion.Adding the two equations,weighing each by the valence and the charge on a proton,gives ∂q∂t+u ·∇s q =q n ·(n ·∇)u + −e 2(ω2n 2+ω3n 3)E ·n +k B T ∇(e ω2n 2−e ω3n 3) ·n .(21)Next Equation 21is put in dimensionless form using εo E o as a surface charge scaleτc τP ∂q∂t +τc τF [u ·∇s q −q n ·(n ·∇)u ]= −(ω2n 2+ω3n 3)E ·n +1β∇(ω2n 2−ω3n 3) ·n .(22)A new time scale,the convective flow time τF ≡ /u F ,appears here.For β 1,the diffusion term can be ignored and conduction balanced against charge relaxation and convection.For steady motion,charge convection bal-ances conduction when τC /τF is O(1).Summary Equations for Leaky Dielectric ModelTo summarize,the leaky dielectric electrohydrodynamic model consists of the following five equations.The derivation given here identifies the approxima-tions in the leaky dielectric model.Except for the electrical body force terms,A n n u . R e v . F l u i d M e c h . 1997.29:27-64. D o w n l o a d e d f r o m w w w .a n n u a l r e v i e w s .o r g b yB e i j i n g F o r e s t r y U n i v e r s i t y o n 03/16/11. F o r p e r s o n a l u s e o n l y .36SA VILLEit is essentially the model proposed by Melcher &Taylor (1969).τµP ∂u+Re u ·∇u =−∇p −12E ·E ∇ε+∇·(εE )E +∇2u&∇·u =0(7 )∇·σE =0(19 )τc τP ∂q ∂t +τcτF [u ·∇s q −q n ·(n ·∇)u ]= −σE ·n (22 ) εE ·n =q (3 )[σM ·n ]·n =12ε(E ·n )2−ε(E ·t 1)2−ε(E ·t 2)2[σM·n ]·t i =q E ·t i(6)Note that the equations are written in dimensionless variables using the scales defined in the text.The equation of motion is for nonhomogeneous fluids with electrical body forces.The hydrodynamic boundary conditions,continuity of velocity and stress,including the viscous and Maxwell stress,are assumed.Primes denote dimensionless forms of the parent equations.Electrokinetic EffectsAlthough Equation 19may be adequate for millimeter-length scales,it would fail if free charge on the Debye scale,κ−1≡ εεo B 2 (z k )2k produces important mechanical effects.As noted earlier,charged interfaces attract coun-terions in the bulk fluid and repulse co-ions on the Debye length scale.Electric and hydrodynamic phenomena on this scale are responsible for the ubiquitous behavior of small particles in electrolytes,so it is natural to ask whether similar effects might be important here.In fact,Torza et al (1971)suggested that such effects could be responsible for the lack of agreement between the theory and their experiments on fluid globules.To see whether the lack of agreement is due to electrokinetic effects we can use the numerical data already put forth.This leads to the following estimates:κ−1≈10−7m , ≈1,Pe ≈10−3,Da ≈10−4,Da /K ≈10−1and β=10−1.Accordingly,on the Debye scale the relation between charge and field is represented by Equation 18while the species conservation equations 12A n n u . R e v . F l u i d M e c h . 1997.29:27-64. D o w n l o a d e d f r o m w w w .a n n u a l r e v i e w s .o r g b yB e i j i n g F o r e s t r y U n i v e r s i t y o n 03/16/11. F o r p e r s o n a l u s e o n l y .becomeτD P ∂n 1=ω1∇2n 1(23a)τD τP ∂n k∂t=β∇·[−z k n k ωk E ]+ωk ∇2n k+Dan 0K[n 1−n 2n 3],k =2,3.(23b)These equations are clearly more complex than those for Ohmic conduction,which omits entirely any accounting for individual species.Is this complex-ity necessary?In the following sections,experimental and theoretical results based on the leaky dielectric model are reviewed for several prototypical prob-lems so as to assess the model’s effectiveness and the extent to which more detailed treatments taking account of diffuse layer effects are warranted.To date,none of the experimental studies show major electrokinetic effects despite the indications of the scale analysis.FLUID GLOBULESDrop Motion in External FieldsAllan &Mason (1962)encountered paradoxical behavior when non-conducting drops suspended in non-conducting liquids were deformed by a steady elec-tric field.Conducting drops became prolate,as expected,but non-conducting drops often adopted oblate configurations.Oblate shapes were completely un-expected since analyses of static configurations predict prolate deformations,irrespective of the drop conductivity.Drop deformations can be analyzed with several methods.O’Konski &Thacher (1953)used an energy method;Allan &Mason (1962)balanced electrical and interfacial tension forces.For small deformations of conducting drops in dielectric surroundings,either procedure givesD =916a εεo E 2∞γ.(24)Here E ∞is the strength of the applied field,a is the drop radius,and γisinterfacial tension.The deformation,D ,is the difference between the lengths of the drop parallel and transverse to the field divided by the sum of the two.Given that the drop is a conductor,it is easy to see why the shape is prolate since the pressures inside and outside the drop are uniform,initially,with the difference balanced by interfacial tension and the sphere’s curvature,2γ/a .Therefore,non-uniform electric stresses must be balanced by interfacial tension on theA n n u . R e v . F l u i d M e c h . 1997.29:27-64. D o w n l o a d e d f r o m w w w .a n n u a l r e v i e w s .o r g b yB e i j i n g F o r e s t r y U n i v e r s i t y o n 03/16/11. F o r p e r s o n a l u s e o n l y .deformed surface.Since the sphere induces a dipole into the incident field,charge on the sphere’s equipotential surface varies as cos ϑ;ϑbeing measured from the direction of the field.The field normal to the surface varies in a similar fashion.Accordingly,the electric stress at the surface varies as cos 2ϑ,pulling the drop in opposite directions at its poles.Dielectric drops in dielectric surroundings also become prolate in steady fields,irrespective of the dielectric constants of the two fluids,that is,D =916a εεo E 2∞γ(ˆε−ε)2(ˆε+2ε)2(25)with circumflexes denoting properties of the drop fluid (O’Konski &Thacher 1952,Allan &Mason 1962).Here deformation results from polarization forces since free charge is absent and the electric stresses are normal to the surface.Allan &Mason’s (1962)anomalous results led Taylor (1966)to discard the notion that the suspending fluids could be treated as insulators.Although the suspending fluids were poor conductors (σ<10−9S/m)Taylor recognized that even a small conductivity would allow electric charge to reach the drop interface.With perfect dielectrics,the interface boundary condition (see Equation 3)sets the relation between the normal components of the field to ensure that there is no free charge.For leaky dielectrics,charge accumulates on the interface to adjust the field and ensure conservation of the current when the conductivities of the adjacent fluids differ.The action of the electric field on surface charge provides tangential stresses to be balanced by viscous flow.Taylor used the charge calculated from a solenoidal electric field to compute the electric forces at the interface of a drop and then balanced these stresses with those calculated for Stokes flow.This procedure led to a discriminating function to classify deformations as prolate or oblate:=S (R 2+1)−2+3(S R −1)2M +35M +5.(26)Here S ≡ε/ˆε,R ≡ˆσ/σ,and M ≡µ/ˆµ.Prolate deformations are indicated when >1,and oblate forms are indicated when <1.Qualitative agreement between theory and experiment was found in nine of the thirteen cases studied by Allan &Mason (1962).In the other four (prolate)cases,ambiguities in electrical properties hampered a test of the theory.According to Taylor’s leaky dielectric model,tangential electric stresses cause circulation patterns inside and outside the drop.As further confirma-tion of the theory,McEwan and de Jong 5photographed tracer particle tracks in and around a silicone oil drop suspended in a mixture of castor and corn oils.Toroidal circulation patterns were observed,in agreement with the theory.5McEwan&de Jong’s photos are presented in an addendum to Taylor’s paper (1966).A n n u . R e v . F l u i d M e c h . 1997.29:27-64. D o w n l o a d e d f r o m w w w .a n n u a l r e v i e w s .o r g b yB e i j i n g F o r e s t r y U n i v e r s i t y o n 03/16/11. F o r p e r s o n a l u s e o n l y .。

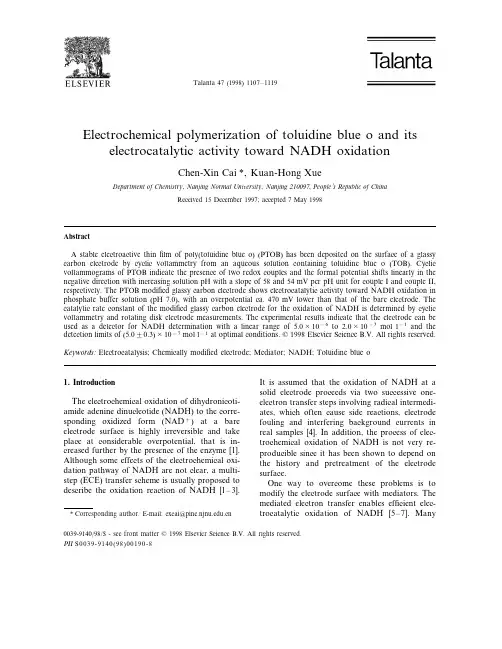
Talanta47(1998)1107–1119Electrochemical polymerization of toluidine blue o and its electrocatalytic activity toward NADH oxidationChen-Xin Cai*,Kuan-Hong XueDepartment of Chemistry,Nanjing Normal Uni6ersity,Nanjing210097,People’s Republic of ChinaReceived15December1997;accepted7May1998AbstractA stable electroactive thinfilm of poly(toluidine blue o)(PTOB)has been deposited on the surface of a glassy carbon electrode by cyclic voltammetry from an aqueous solution containing toluidine blue o(TOB).Cyclic voltammograms of PTOB indicate the presence of two redox couples and the formal potential shifts linearly in the negative direction with increasing solution pH with a slope of58and54mV per pH unit for couple I and couple II, respectively.The PTOB modified glassy carbon electrode shows electrocatalytic activity toward NADH oxidation in phosphate buffer solution(pH7.0),with an overpotential ca.470mV lower than that of the bare electrode.The catalytic rate constant of the modified glassy carbon electrode for the oxidation of NADH is determined by cyclic voltammetry and rotating disk electrode measurements.The experimental results indicate that the electrode can be used as a detector for NADH determination with a linear range of5.0×10−6to2.0×10−3mol l−1and the detection limits of(5.090.3)×10−7mol l−1at optimal conditions.©1998Elsevier Science B.V.All rights reserved. Keywords:Electrocatalysis;Chemically modified electrode;Mediator;NADH;Toluidine blue o1.IntroductionThe electrochemical oxidation of dihydronicoti-amide adenine dinucleotide(NADH)to the corre-sponding oxidized form(NAD+)at a bare electrode surface is highly irreversible and take place at considerable overpotential,that is in-creased further by the presence of the enzyme[1]. Although some effects of the electrochemical oxi-dation pathway of NADH are not clear,a multi-step(ECE)transfer scheme is usually proposed to describe the oxidation reaction of NADH[1–3].It is assumed that the oxidation of NADH at a solid electrode proceeds via two successive one-electron transfer steps involving radical intermedi-ates,which often cause side reactions,electrode fouling and interfering background currents in real samples[4].In addition,the process of elec-trochemical oxidation of NADH is not very re-producible since it has been shown to depend on the history and pretreatment of the electrode surface.One way to overcome these problems is to modify the electrode surface with mediators.The mediated electron transfer enables efficient elec-trocatalytic oxidation of NADH[5–7].Many*Corresponding author.E-mail:cxcai@0039-9140/98/$-see front matter©1998Elsevier Science B.V.All rights reserved. PII S0039-9140(98)00190-8C.-X.Cai,K.-H.Xue/Talanta47(1998)1107–1119 1108compounds,when modified on the electrode sur-face,were found to enhance the electron transfer rate and reduce the overpotential for the oxida-tion of NADH[8–23].These compounds include adsorbed aromatic compounds containing cate-chol functionalities and adsorbed phenoxazines [15–21],conducting organic salt[22],and nickel hexacyanoferrate[23]ing the cyclic voltam-metry and scanning electrochemical microscopy (SECM),Grundig et al.[24]studied the NADH oxidation on the composite electrodes,containing N-methyl phenazine(NMP+)methosulfate,1-methoxy-5-methyl phenazine(M-NMP+)metho-sulfate and Meldola blue etc.Electrocatalytic oxidation of NADH at the conducting polymers modified electrodes were also reported recently [25–33].Among the many mediators,the conducting polymers have certain advantages.Karyakin et al.[29]reported that the long-term operational sta-bility of poly(methylene blue)film was much higher than that of the adsorbed mediator.More-over,electropolymerization yields modified elec-trode with a three-dimensional distribution of mediators.Such an electrode should be preferable because of the much larger catalytic response of polymer coatings than monolayers,the catalytic activity and sensitivity can be improved and miniaturization for in vivo sensor devices should also be possible.Many compounds have even been found to mediate the electron transfer for NADH oxida-tion,there is still a great deal of interest in the development of new materials for the electrocata-lytic oxidation of NADH or especially alternative approaches for immobilization of the mediator on the electrode surface in order to further lower the overpotential for NADH oxidation and also to find more efficient and stable chemically modified electrodes for the electrocatalytic oxidation of NADH.In the previous paper,we have reported the electrocatalysis of NADH at a glassy carbon elec-trode modified with poly(azure I)(PAI)[34]and poly(nile blue A)(PNB)[35].The aim of the present work was to investigate the electropoly-merization of the toluidine blue o(TOB,the structure is shown in Scheme1),characterize of poly(toluidine blue)(PTOB)and test the electro-catalytic activity of PTOB toward NADH oxida-tion.The experimental results indicated that the PTOBfilms have two redox couples,which were similar to the PAI[34]and PNB[35],in the potential range of−0.6to+0.4V,suggesting the existence of two redox reaction processes.The electrocatalytic activity of the PTOBfilms(couple II)for electrooxidation of NADH is more effi-cient than that of PAI and PNBfilms.2.Experimental2.1.ChemicalsNADH and toluidine blue o(cat.no.119444, dye content 85%)were obtained from Sigma and Merck,respectively.They were used as re-ceived without further purification.All other chemicals were of analytical grade.The0.1mol l−1phosphate buffer(pH7.0)solution was al-ways employed.The electropolymerization of TOB was performed in0.1mol l−1Britton–Robinson(B–R)buffer solution(pH9.7).The composition of the B–R solution is a liter of water containing3.92g H3PO4,2.40g CH3COOH and2.47g H3BO3.The0.1mol l−1NaOH solu-tion was used to control the solution at different pH’s.Water,twice distilled from a quartz appara-tus,was used in all experiments.2.2.ApparatusA three-electrode system with a coiled platinum wire serving as the counter electrode,a saturated calomel electrode(SCE)as a reference electrode and a PTFE-shrouded glassy carbon electrode(5 mm diameter)as the working electrode was em-ployed.The working electrode was polished with metallographic abrasine paper(6c,Shanghai,Scheme1.C.-X.Cai,K.-H.Xue/Talanta47(1998)1107–11191109China)firstly,then progressively withfine slurries of1,0.5and0.05m m alumina in order to obtain a mirror-like surface.After thorough rinsing,the electrode was cleaned in an ultrasonic bath,first with ethanol andfinally with doubly distilled wa-ter.Prior to use,the electrode was treated electro-chemically by a continuous cyclic potential sweep from−0.5to1.5V at sweep rate50mV s−1in phosphate buffer solution(pH7.0)until a stable voltammogram was obtained(this process was completed in about10min).A PAR M270electrochemical system(EG&G) was used to carry out the electrochemical experi-ments.Rotating disk electrode measurements were carried out with a PAR M616disk electrode system(EG&G)using a glassy carbon electrode(4 mm diameter).The stability of the PTOBfilm was tested using a ZF-3potentiostat programmed by a ZF-4waveform generator and an LZ3-204 recorder(Shanghai,China)was used to record the cyclic voltammograms.A type501thermostat (Shanghai,China)was used to control the experi-mental temperature to2590.1°C.2.3.ProceduresThe electropolymerization of TOB was carried out by cyclic voltammetry in the potential range of−0.6to1.2V at a sweep rate of100mV s−1 in B–R buffer solution(pH9.7).The monomer concentration was usually5×10−4mol l−1.The film thickness was dependent on the number of ually,the PTOBfilm was formed by cycling the potential in above potential range for 30min,this corresponds to a surface coverage,G, of about6.8×10−10mol cm−2.After the PTOB film had formed on the electrode surface,the electrode was rinsed thoroughly with water,and dipped into the buffer solution to test its electro-chemical responses and examine the electrocata-lytic activity toward NADH oxidation in the potential range of−0.6to+0.4V.All tested solution were deaerated by passing through highly pure nitrogen for20min before the electrochemical experiments,and a continuous flow of nitrogen was maintained over the sample solution during experiments.3.Results and discussion3.1.Electropolymerization of TOB and electrochemical responses of the PTOB modified glassy carbon electrodeThe cyclic voltammetry was used to form the PTOB,this allows the potential range necessary for electrode modification to be determined more readily than the other methods,for example,the constant potential technique.Furthermore,mod-ification can be recognized and monitored easily by the progressive nature of the cyclic voltammet-ric curves.The cyclic voltammograms taken in TOB aqueous solution indicate the formation of the PTOBfilm on the electrode surface(Fig.1).The potential sweep range,especially the upper limit, is the most important factor for preparing the PTOB modified electrode.If the potential sweep is confined within the region of−0.6to+0.4V,a simple cyclic voltammogram corresponding to the redox reaction of TOB with the formal potential of−0.26V is observed(Fig.1A).This steady state cyclic voltammogram persists indefinitely provided that the anodic upper potential is not taken too positive.The potential sweep in this potential range results in no substantialfilm formation.However,electropolymerization was observed when the value of anodic upper potential reached 1.2V.During this process,the redox peaks corre-sponding to the redox reaction of TOB monomer decrease quickly with an increase of the scan number.A new redox peak appears around0V in the cyclic voltammogram(Fig.1B).The peak currents increase with successive scanning,indi-cating an increase in the quantity of electroactive species on the electrode.With increasing the scan number,the anodic peak potential shifted in the positive and cathodic peak potential in the nega-tive direction,respectively.These peaks cannot be related to a monomer redox couple.These indi-cated that electropolymerization of TOB has taken place on the electrode surface and formed the PTOBfilms.The effect of the solution pH on the PTOBfilms growth was studied.The results indicated that the rate of thefilms growth in-C.-X.Cai,K.-H.Xue/Talanta47(1998)1107–11191110Fig.1.Cyclic voltammograms of5×10−4mol l−1TOB at glassy carbon electrode in0.1mol l−1B–R buffer solution(pH9.7) at100mV s−1.Scan limits,−0.6to+0.4V(A)and−0.6to+1.2V(B).creased with an increase of the buffer solutionpH.If the electrode is subsequently removed fromthe cell,rinsed with water,and placed in phos-phate buffer solution(pH7.0)containing noTOB,two couples with well-defined redox peakscan be observed(Fig.2).The peak currents of thetwo redox couples are linearly proportional to thescan rates(shown in the inset of Fig.2),confirm-ing a surface confined redox couples.The formalpotential,E0%,which is taken as the mid-point of the anodic and cathodic potential,is−277and5mV for couple I and couple II,respectively,at ascan rate of20mV s−1.The values of the E0% shift slightly in the negative direction with an increase of the scan rate.These values change to −292and−3mV,respectively,at a scan rate of 100mV s−1.The separations between the anodic and cathodic peaks are41and72mV for couple I and couple II,respectively,at a scan rate of20 mV s−1.The value of separations are increased with increasing scan rates.We tried several washing procedures to elimi-nate the monomer-type redox activity.Washing thoroughly with buffer solution,treatment in an ultrasonic bath or cycling in buffer solution did not affect the redox peaks.This indicated that the monomer type redox peaks cannot be explained through the inclusion of the TOB monomer into the PTOBfilms.If the redox couple I were causedC.-X.Cai,K.-H.Xue/Talanta47(1998)1107–11191111 Fig.2.Cyclic voltammograms of PTOB modified glassy carbon electrode in0.1mol l−1phosphate buffer solution(pH7.0)at scan rate of(a)20,(b)40,(c)60,(d)80and(e)100mV s−1.The inset shows the plot of the cathodic current versus scan rates for redox couple I(A)and II(B).by the inclusion of the monomer into the PTOB films,the redox peaks would decrease after wash-ing thoroughly the modified electrode with buffer solution.Furthermore,long time ultrasonication can remove the PTOB from the electrode surface because the two couples of redox peaks decrease simultaneously.Bauldreay and Archer[36]studied polymerized mechanism of thionine,nile blue etc.According to their results,the initial step for the TOB polymer-ization is one-electron oxidation of NH2group and forms a cation radical when the potential is scanned to1.2V.The unpaired electron can be delocalization through the TOB molecule,but the unpaired electron may be sited with high proba-bility on either amine group and at position ortho to them[36].Radical dimerization can occur via carbon–nitrogen coupling routes as shown in Scheme2.The oxidation of the NH2group in the dimer can occur again,the polymerization can take place readily to form the PTOB.From the structure of PTOB,thefilm contains monomer units and each monomer unit retains its electroactive heterocyclic nitrogen atom.More-over,the PTOBfilm also contains the nitrogen bridges between monomer units.These nitrogen bridges should be electroactive like those in polyanilinefilms.The redox potential for the hete-rocyclic nitrogen atom and the nitrogen bridges must be different.So,two couple of redox peaks appeared on the cyclic voltammograms of PTOB (as shown in Fig.2).Because the formal potential of redox couple I is closed to that for redox reaction of TOB monomer,we ascribe the redoxC.-X.Cai,K.-H.Xue/Talanta47(1998)1107–1119 1112Scheme2.couple I to the redox reaction of the monomer units existed in PTOBfilm,the redox couple II to redox reaction of the nitrogen bridges. Karyakin et al.[37]also obtained two redox couples in studying the polymer of methylene blue modified glassy carbon electrode.They pointed out that the monomer-type conjugation may be present in the polymer of methylene blue.They also ascribed the redox couple at negative redox couple,which corresponds to the redox peaks I in the present case,to the monomer-type redox activity.3.2.Stability of PTOBThe PTOB modified electrode was rather durable,i.e.they withstood removal from the solution and washing with distilled water.The stability of the PTOB was also examined by repet-itive scans the modified glassy carbon electrode in the potential range of−0.6to+0.4V in phos-phate buffer solution(pH7.0).For thefirst few scans(aboutfive cycles),the peak currents de-crease on the continuous scanning.Then,no changes in height and separation of cyclic voltam-metric peaks were observed after6h repetitive scans(more than500cycles).The modified elec-trode showed no appreciable loss of electroactiv-ity after storing in the phosphate buffer solution for1week.3.3.pH dependence of PTOBIn order to test the effects of solution pH on the electrochemical behaviour of PTOB,the voltammetric responses of a PTOB modifiedC.-X.Cai,K.-H.Xue/Talanta47(1998)1107–11191113 glassy carbon electrode were obtained in solu-tions of pH’s varying from2.6to10.2.Fig.3shows the cyclic voltammograms of the PTOB inthree solutions of different pH.All the cyclicvoltammograms have two redox couples.As canbe seen in Fig.3,the anodic and cathodic peakpotential for two redox couples are pH depen-dent,they shift in the negative direction with anincrease of the solution pH.The formal poten-tials of two redox couples shift to the negativedirection with the slope of58and54mV perpH unit for couple I and couple II(not shownhere),respectively,which is very close to theanticipated Nernstian value of59mV.It cantherefore be concluded that an equal number ofelectrons and protons is involved in the twoelectrode reactions.Fig.4.Cyclic voltammograms of PTOB modified glassy car-bon electrode in0.1mol l−1phosphate buffer solution(pH7.0)in the absence(a)and presence(b)of1.0×10−3mol l−1NADH.Scan rate:50mV s−1,surface coverage G=6.8×10⁻¹⁰mol cm−2.Fig. 3.Cyclic voltammograms of glassy carbon electrode modified with PTOB in0.1mol l−1B–R buffer solution at pH value of(a)6.8,(b)4.8and(c)2.6.Scan rate:50mV s−1.3.4.Electrochemical oxidation of NADH at PTOB modified electrodeOne of the objectives of our study was the development of a modified electrode capable of the electrocatalytic oxidation of NADH.Since the poly(azure I)[34],poly(nile blue A)[35]and poly(methylene blue)[29]have been proved to act as active electron-transfer mediators for the elec-trocatalytic oxidation of NADH,it was expected that PTOB covered glassy carbon electrode may similarly be used to catalyze the oxidation of NADH.In order to test the electrocatalytic activ-ity of the PTOBfilm,the cyclic voltammograms were obtained in the absence and presence of NADH,and the curves are presented in Fig.4.In the absence of NADH(Fig.4a),two couples of well-behaved redox peaks for PTOBfilm on the electrode can be observed.Upon the addition of 1.0×10⁻³mol l−1NADH,there is a great en-hancement of the anodic current and almost no cathodic current is observed in the return wave for redox couple II(Fig.4b),which indicates a strong electrocatalytic effect.Simultaneously,the anodic peak potential shifts to the positive direc-C.-X.Cai,K.-H.Xue/Talanta47(1998)1107–11191114Table1The formal potentials(versus SCE)of PTOB,PAI,PMB and PNBfilm(at scan rate of20mV s−1)E0%(II)mV−1Solution pHPolymer E0%(I)mV−1Reference7.05−256This work PTOB[34]7.0PAI−267−70[29]8.5−80−300PMB a6.8[35]PNB−404−67a The value of the PMB was obtained at scan rate of1mV s−1.tion by about50mV after addition of NADH, indicating a kinetic limitation existing in the reac-tion between PTOBfilms and NADH.The anodic peak potential for the oxidation of NADH at PTOB modified electrode is about+80mV, while NADH is oxidized at about+550mV at an unmodified glassy carbon electrode under iden-tical conditions.A decrease in overpotential of approximately470mV is achieved.A small enhancement of the anodic currents for the redox couple I was found after addition of NADH compared with the voltammogram in a buffer solution without NADH,indicating that the electrocatalytic activity of the redox couple I is small.The different electrocatalytic activity to-ward NADH oxidation between the redox couple I and II is probably due to the difference of the formal potential existing between couple I and II. The redox couple II is more efficient for NADH oxidation than the redox couple I because the formal potential of couple II is much more posi-tive than that of couple I[5].Comparing the electrocatalytic activity of the PTOBfilms(couple II)toward NADH electrooxi-dation with that of PAI[34],PNB[35]and poly(-methylene blue)(PMB)[29],one canfind that the PTOBfilm is more efficient because the electro-catalytic current for NADH electrooxidation is larger in the case of PTOB.This can be explained again through the different formal potential among them,the formal potential(couple II)of the PTOBfilm is more positive than that of PAI [34],PNB[35]and PMB[29].The formal poten-tial of these polymerizedfilms is shown in Table 1.The amount of the PTOB modified on the glassy carbon electrode surface(G)can be con-trolled by the scan number during the electrpoly-merization process of TOB.The surface coverage, G,can be calculated from the following equation G=Q/nFA(1) where Q is the amount in coulombs of consumed charge obtained from integrating the peak area in cyclic voltammograms under the background cor-rection,the other symbols have their usual mean-ings.Although the surface of the glassy carbon electrode is microscopically rough,it is difficult to estimate the roughness factor,so in all calcula-tions,the geometric area of the electrode was employed.The effect of G on the electrocatalytic peak current(for couple II)for NADH oxidation was studied.The catalytic current increases with increasing G up to about6.0×10−10mol cm−2 (for 1.0×10⁻³mol l−1NADH),whereas the catalytic current levels off for the G above the 6.0×10⁻¹⁰mol cm−2.Based on these results and in order to ensure that the electrocatalytic current for NADH oxidation at PTOB modified electrode was independent of the G,a value of6.8×10−10 mol cm−2,which corresponds to about30min cycling the glassy carbon electrode in TOB solu-tion in the potential range of−0.6to1.2V(100 mV s−1),was employed in the following experiments.Fig.5shows the cyclic voltammograms of PTOB modified glassy carbon electrode at various scan rates obtained in0.1mol l−1phosphate buffer solution(pH7.0)containing 1.0×10⁻³ mol l−1NADH.It can be noted in Fig.5that the catalytic oxidation peak potential(peak II)for NADH shifts slightly to positive potentials with increasing the scan rate,suggesting a kinetic limi-tation existing in the reaction process between theC.-X.Cai,K.-H.Xue/Talanta47(1998)1107–11191115PTOBfilm and NADH.The oxidation currents for NADH increase linearly with the square root of the scan rate,suggesting that at sufficient over-potential the reaction is transport limited. These results show that the overall electrochem-ical oxidation of NADH at the PTOB modified glassy carbon electrode might be controlled by the diffusion of NADH in solution and the cross-ex-change process between NADH and the redox site of the PTOB.Andrieux and Saveant[38]derived a relation between the peak current and the con-centration of the substrate for the case of slow scan rate and large k,where k is the catalytic reaction rate constant between the PTOB and NADH in the present case.i cat=0.496nFA D1/261/2c*(nF/RT)1/2(2)where D and c*are the diffusion coefficient (2.4×10⁻⁶cm2s−1[2])and the bulk concentra-tion of the NADH,respectively,and the other symbols have their usual meanings.Low values of k result in the values of the coefficient lower than 0.496.For low scan rates(2to10mV s−1),a average value of this coefficient was found to be 0.38for a PTOB modified electrode with a cover-age of G=6.8×10⁻¹⁰mol cm−2.According to the approach of Andrieux and Saveant,an aver-age value of k could be calculated to(2.490.2)×103l mol−1.s−1.This reaction rate is controlled by both the kinetic process between NADH and the PTOBfilms and the mass transfer process of the NADH in solution.3.5.Rotating disk electrode measurements Kinetic parameters also obtained from rotating disk electrode(RDE)measurements,which were carried out by sweeping the potential at2mV s−1 from−0.20to+0.35V(for peak II).The catalytic current,which taken as the plateau cur-rent under the background correction at the low scan rate for each rotational speed,for NADH oxidation at the PTOB modified electrode was measured in phosphate buffer solution(pH7.0) containing1.2×10−3mol l−1NADH.The re-sults are shown in Fig.6.The currents increase with increasing rotational speed.A plot of i Cat versus 1/2was found to be nonlinear,and the lack of linearity suggests that the reaction is lim-ited by kinetics and not by transport limitations. The catalytic currents i Cat corresponding to the mediated reaction is a function of the Levich current i Lev representing the mass transfer of NADH in the solution and the kinetic current i K corresponding to the electron cross-exchange be-tween NADH and the PTOB redox site.The value of k can be obtained from the Koutecky–Levich plot using the following expression[39]: 1/i Cat=1/i Lev+1/i K(3) andi Lev=0.62nFA D2/3w−1/6c* 1/2(4) i K=nFA k G c*(5)Fig. 5.Cyclic voltammograms of glassy carbon electrode modified with PTOB in0.1mol l−1phosphate buffer solution (pH7.0)containing1.0×10−3mol l−1NADH at scan rate of (a)20,(b)40,(c)60,(d)80and(e)100mV s−1.C.-X.Cai,K.-H.Xue/Talanta47(1998)1107–11191116Fig.6.Levich plot for the oxidation of NADH at a PTOB modified glassy carbon electrode in0.1mol l−1phosphate buffer solution (pH7.0)with a G=6.8×10⁻¹⁰mol cm−2and the NADH concentration of1.2×10−3mol l−1.The inset shows the plot of1/i versus1/ 1/2(Kouctecky–Levich plot).where c*is the bulk concentration of NADH, is the rotational speed,w is the kinematic viscos-ity,G is the surface coverage of PTOB,k is the catalytic reaction rate constant between the PTOB and NADH and all other parameters have their usual meanings.The Koutecky–Levich plot,ob-tained from the data in the main panel of Fig.6, is shown in the inset of Fig.6.Such a plot shows the anticipated linear dependence between the1/ i Cat and the1/ 1/2.From the intercept of the plot, the value of the k was found to be(1.890.3)×103l mol−1s−1,which is similar to that deter-mined from cyclic voltammetric measurements. The value of k,which was obtained by using RDE method,was decreased as the NADH con-centration increased(the data are shown in Table 2).The value of k is larger than that obtained at PNB modified electrode[35]and is the same order as that at PAI[34].A similar observation,the k decreased with increasing of the NADH concentration,has been previously reported for the electrooxidation of NADH at electrodes modified with different me-diators[16,17,40].In order to rationalize such a concentration dependence of the rate constant, Gorton et al.[17]has suggested that the process involves a charge transfer complex between NADH and the mediator in a mechanism similar to Michaelis–Menten kinetics.Although we have not explored this specific aspect in this study,it is plausible that a similar mechanism might be operative.3.6.Calibration of NADH detection at PTOB modified electrodeTo optimize the response of PTOB modified electrode for NADH determination,the effect ofTable2The electrocatalytic rate constant(k)at various NADH con-centration2.51.02.01.5 3.5 103C NADH/mol l−1 3.01.51.70.831.12.2 1.210−3k/l mol−1s−1C .-X .Cai ,K .-H .Xue /Talanta 47(1998)1107–11191117Fig.7.Effect of solution pH on the electrocatalytic current for NADH oxidation at PTOB modified electrode.current changes with solution pH and reaches a maximum value between pH 6.8and 8.3.It de-creases markedly with increase in pH above 8.5.So,the solution pH 7.0was selected in NADH determination.The steady-state current of oxidation NADH at PTOB modified glassy carbon electrode was mea-sured amperometrically in phosphate buffer solu-tion (pH 7.0).The applied potential is +0.1V.Once the background current has decayed to a constant value,the NADH was added.After stirred briefly,the steady-state currents was recorded.The dependence of the steady-state cur-rents (under background correction)on NADH concentration is shown in Fig.8.The response currents depends linearly on NADH concentra-tion in the range of 5.0×10⁻⁶to 2.0×10⁻³mol l −1.At higher concentration,the steady-state cur-rents appears to be a levelling off,this probably due to the kinetic limitations.The detection limits is (5.090.3)×10−7mol l −1(at S /N =3).The value is similar to the result obtained by Abrun ˜a et al.[30],using flow injection method,at glassy carbon electrode midified with films derived from 3,4-dihydroxybenzaldehyde (5.0×10⁻⁷molsolution pH on the electrocatalytic activity of the electrode toward NADH oxidation was examined.The results are shown in Fig.7.The catalyticFig.8.The dependence of the catalytic current,obtained at PTOB modified electrode in 0.1mol l −1phosphate buffer solution (pH7.0),on NADH concentration.C.-X.Cai,K.-H.Xue/Talanta47(1998)1107–1119 1118dm−3),but one order larger than the result ob-tained by Dong and Chi[9],also usingflow in-jection,at glassy carbon electrode modified with polypyrrolefilms contained methylene blue(4.0×10⁻⁸mol dm−3).The lower detection limits are expected to be obtained at the PTOB modified glassy carbon electrode underflow injection con-ditions,because theflow injection method pos-sesses a much higher current sensitivity than cyclic voltammetry.The results indicate that the PTOB modified glassy carbon electrode is an excellent detector for NADH,because a wide linear range and low detection limits can be achieved.The re-producibility was examined by using separately prepared PTOB modified electrode to determine 1.0×10⁻³mol l−1NADH ten times,an average of11.6m A was obtained,the relative standard de-viation was2.8%,which shows the modified elec-trode can be used to determine NADH precisely.4.ConclusionsThe oxidation of the toluidine blue o(TOB)on glassy carbon electrode gives rise to stable redox active electropolymerizedfilms.Cyclic voltam-mograms of the resulting poly(toluidine blue o) (PTOB)indicate the presence of two couple of redox reactions with the formal potential of −277and5mV for redox couple I and II, respectively,at scan rate of20mV s−1.The formal potential shifts toward negative direction with increasing the solution pH with a slope of58 and54mV per pH unit for couple I and couple II respectively,which is very close to the anticipated Nernstian dependence of59mV per pH unit.The PTOB modified glassy carbon electrode exhibits electrocatalytic activity toward NADH oxidation and the electrode can be used as a detector for NADH determination with a linear range of 5.0×10⁻⁶to 2.0×10³mol l−1and detection limits of(5.090.3)×10−7mol l−1(at S/N=3). References[1]J.Moiroux,P.J.Elving,J.Am.Chem.Soc.102(1980)6533.[2]W.J.Blaedel,R.G.Haas,Anal.Chem.42(1970)918.[3]B.W.Carlson,ler,J.Am.Chem.Soc.105(1983)7453.[4]P.J.Elving,W.T.Bresenahan,J.Moiroux,Z.Samec,Bioelectrochem.Bioenerg.9(1982)365.[5]L.Gorton,J.Chem.Soc.Faraday Trans.182(1986)1245.[6]I.Katakis,E.Domı´nguez,Mikrochim.Acta126(1997)11.[7]M.Jesus Lobo,A.J.Miranda,P.Tunon,Electroanalysis9(1997)191.[8]E.Lorenzo,L.Sanchez, F.Pariente,J.Tirado,H.D.Abrun˜a,Anal.Chim.Acta309(1995)79.[9]Q.Chi,S.Dong,Analyst119(1994)1063.[10]K.Essaadi,B.Keita,L.Nadjo,J.Electroanal.Chem.367(1994)275.[11]M.Somasundrum,J.Hall,J.V.Bannister,Anal.Chim.Acta295(1994)47.[12]E.Katz,T.Lotzbeyer,D.D.Schlereth,W.Schuhmann,H.L.Schmidt,J.Electroanal.Chem.373(1994)189.[13]K.Hajizadeh,H.T.Tang,H.B.Halsall,W.R.Heineman,Anal.Lett.24(1991)1453.[14]B.Persson,L.Gorton,J.Electroanal.Chem.292(1990)115.[15]B.Persson,J.Electroanal.Chem.287(1990)61.[16]L.Gorton,G.Johansson,A.Torstensson,J.Electroanal.Chem.196(1985)81.[17]L.Gorton,A.Torstensson,H.Jaegfeldt,G.Johansson,J.Electroanal.Chem.161(1984)103.[18]H.Jaegfeldt,A.Torstensson,L.Gortona,G.Johansson,Anal.Chem.53(1981)1979.[19]H.Jaegfeldt,T.Kuwana,H.Johansson,J.Am.Chem.Soc.105(1983)1805.[20]F.Ni,H.Feng,L.Gorton,T.M.Gorton,Langmuir6(1990)66.[21]L.Gorton,G.Bremle,E.Csoregi,G.Jonsson-Pettersson,B.Persson,Anal.Chim.Acta249(1991)43.[22]W.J.Albery,P.N.Bartlett,-mun.(1984)234.[23]B.F.Yon,C.R.Lower,Anal.Chem.59(1987)2111.[24]B.Grundig,G.Wittstock,U.Rudel, B.Strehlitz,J.Electroanal.Chem.395(1995)143.[25]N.F.Atta,A.Galal,A.E.Karago¨zler,H.Zimmer,J.F.Rubinson,H.B.Mark Jr.,mun.(1990)1347.[26]F.Xu,H.Li,S.J.Cross,T.F.Guarr,J.Electroanal.Chem.368(1994)221.[27]T.Ohsaka,K.Tanaka,K.Tokuda,J.Chem.Soc.Chem.Commun.(1993)222.[28]M.Somasundrum,J.V.Bannister,J.Chem.Soc.Chem.Commun.(1993)1629.[29]A.A.Karyakin,E.E.Karyakina,W.Schuhmann,H.L.Schmidt,S.D.Varfolomeyev,Electroanalysis6(1994) 821.[30]F.Pariente,E.Lorenzo,H.D.Abrun˜a,Anal.Chem.66(1994)4337.[31]B.Persson,H.S.Lee,L.Gorton,T.Skotheim,P.Bartlett,Electroanalysis7(1995)935.。

【免费下载】材料科学与⼯程基础英⽂版第五版课后习题Homework 11.1 What are materials? List eight commonly encountered engineering materials. Answer1.1: Materials are substances of which something is composed or made. Steels, aluminum alloys, concrete, wood, glass, plastics, ceramics and electronic materials.1.2 What are the main classes of engineering materials?Answer1.2: Metallic, polymeric, ceramic, composite, and electronic materials are the five main classes.1.3 What are some of the important properties of each of the five main classes of engineering materials?Answer1.3:Metallic Materialsmany are relatively strong and ductile at room temperaturesome have good strength at high temperaturemost have relatively high electrical and thermal conductivitiesPolymeric Materialsgenerally are poor electrical and thermal conductorsmost have low to medium strengthsmost have low densitiesmost are relatively easy to process into final shapesome are transparentCeramic Materialsgenerally have high hardness and are mechanically brittlesome have useful high temperature strengthmost have poor electrical and thermal conductivitiesComposite Materialshave a wide range of strength from low to very highsome have very high strength-to-weight ratios (e.g. carbon-fiber epoxy materials)some have medium strength and are able to be cast or formed into a variety of sha (e.g. fiberglass-polyester materials)some have useable strengths at very low cost (e.g. wood and concrete)Electronic Materialsable to detect, amplify and transmit electrical signals in a complex mannerare light weight, compact and energy efficient1.8 What are nanomaterials? What are some proposed advantages of using nanomaterials over their conventional counterparts?Answer1.8: Are defined as materials with a characteristic length scale smaller than 100 nm. The length scale could be particle diameter, grain size in a material, layer thicknessin a sensor, etc. These materials have properties different than that at bulk scale or at themolecular scale. These materials have often enhanced properties and characteristicsbecause of their nano-features in comparison to their micro-featured counterparts. Thestructural, chemical, electronic, and thermal properties (among other characteristics) are often enhanced at the nano-scale. Homework 2Chapter 3, Problem 4What are the three most common metal crystal structures? List five metals that have each of these crystal structures. Chapter 3, Solution 4The three most common crystal structures found in metals are: body-centered cubic (BCC), face-centered cubic (FCC), and hexagonal close-packed (HCP). Examples of metals having these structures include the following.BCC: vanadium, tungsten, niobium, and chromium.iron,α-FCC:copper, aluminum, lead, nickel, and silver.HCP:magnesium, zinc, beryllium, and cadmium.titanium,α-Chapter 3, Problem 5For a BCC unit cell, (a) how many atoms are there inside the unit cell, (b) what is the coordination number for the atoms, (c) what is the relationship between the length of the side a of the BCC unit cell and the radius of its atoms, and (d) APF = 0.68 or 68%Chapter 3, Solution 5(a) A BCC crystal structure has two atoms in each unit cell. (b) A BCC crystal structure has a coordination number of eight . (c) In a BCC unit cell, one complete atom and two atom eighths touch each other along the cube diagonal.4.R =Chapter 3, Problem 6For an FCC unit cell, (a) how many atoms are there inside the unit cell, (b) What is the coordination number for the atoms, (c) , and (d) what is the atomic packing factor?24Ra =Chapter 3, Solution 6(a) Each unit cell of the FCC crystal structure contains four atoms. (b) The FCC crystal structure has acoordination number of twelve . (d) By definition, the atomic packing factor is given as:volume of atoms in FCC unit cellAtomic packing factor volume of the FCC unit cell=These volumes, associated with the four-atom FCC unit cell, are and 33416433atoms V R R ππ??==3unit cell V a =where a represents the lattice constant. Substituting,a=3unit cell V a ==The atomic packing factor then becomes,316APF (FCC unit cell)3R π??== =0.74Chapter 3, Problem 7For an HCP unit cell (consider the primitive cell), (a) how many atoms are there inside the unit cell, (b) What is the coordination number for the atoms, (c) what is the atomic packing factor, (d) what is the ideal c/a ratio for HCP metals, and (e) repeat a through cconsidering the “larger” cell.Chapter 3, Solution 7The primitive cell has (a) two atoms/unit cell; (b) The coordination number associated with the HCP crystal structure is twelve . (c)the APF is 0.74 or 74%; (d) The ideal c/a ratio for HCP metals is1.633; (e) all answers remain the same except for (a) where the new answer is 6.Homework 3Chapter 3, Problem 25Lithium at 20?C is BCC and has a lattice constant of 0.35092 nm. Calculate a value for the atomic radius of a lithium atom in nanometers.Chapter 3, Solution 25For the lithium BCC structure, which has a lattice constant of a= 0.35092 nm, the atomic radius is,R ===0.152 nmChapter 3, Problem 27Palladium is FCC and has an atomic radius of 0.137 nm. Calculate a value for its lattice constant a in nanometers. Chapter 3, Solution 27Letting a represent the FCC unit cell edge length and Rthe palladium atomic radius,4 or R a ====0.387 nm Chapter 3, Problem 31 Draw the following directions in a BCC unit cell and list the positioncoordinates of the atoms whose centers are intersected by the direction vector:(a ) [100](b ) [110](c ) [111]Chapter 3, Solution 31Error! Reference source not found.(a) Position Coordinates:(b) Position Coordinates:(c) Position Coordinates: (0, 0, 0), (1, 0, 0) (0, 0, 0), (1, 1, 0) (0, 0, 0), (1, 1, 1)Chapter 3, Problem 32Draw direction vectors in unit cells for the following cubic directions:(a ) 111(b ) 110(c ) 121(d ) 113Chapter 3, Solution 32Chapter 3, Problem 462132 , b c =-=of this plane? Chapter 3, Solution 46Given the axial intercepts of (?, -?, ?), the reciprocal intercepts are:11313,, 2.2x y z ==-=Multiplying by 2 to clear the fraction, the Miller indices are .(634)y [11x = +1y = -1z = -1x = +1y = -1z = 0(a)(b)[110] x = -? y = 1(c)Dividing by 3, x = – ? y = – ?(d)Chapter 3, Problem 50Determine the Miller indices of the cubic crystal plane that intersects the following position coordinates:1122(, 0, ); (0,0,1); (1,1,1).Chapter 3, Solution 50First locate the three position coordinates as shown. Next, connect points a and b and extend the line to point d . Complete the plane by connecting point d to c and point c to b . Using (1, 0, 1) as the plane origin, x = -1, y = 1 and z = –1.The intercept reciprocals are thus 1111,1, 1.x y z =-==- The Miller indices are .(111)a(?, 0, ? )。
外文出处:Farhadi, A. (2008). Modeling, simulation, and reduction of conducted electromagnetic interference due to a pwm buck type switching power supply. Harmonics and Quality of Power, 2008. ICHQP 2008. 13th International Conference on, 1 - 6.Modeling, Simulation, and Reduction of Conducted Electromagnetic Interference Due to a PWM Buck Type Switching Power Supply IA. FarhadiAbstract:Undesired generation of radiated or conducted energy in electrical systems is called Electromagnetic Interference (EMI). High speed switching frequency in power electronics converters especially in switching power supplies improves efficiency but leads to EMI. Different kind of conducted interference, EMI regulations and conducted EMI measurement are introduced in this paper. Compliancy with national or international regulation is called Electromagnetic Compatibility (EMC). Power electronic systems producers must regard EMC. Modeling and simulation is the first step of EMC evaluation. EMI simulation results due to a PWM Buck type switching power supply are presented in this paper. To improve EMC, some techniques are introduced and their effectiveness proved by simulation.Index Terms:Conducted, EMC, EMI, LISN, Switching SupplyI. INTRODUCTIONFAST semiconductors make it possible to have high speed and high frequency switching in power electronics []1. High speed switching causes weight and volume reduction of equipment, but some unwanted effects such as radio frequency interference appeared []2. Compliance with electromagnetic compatibility (EMC) regulations is necessary for producers to present their products to the markets. It is important to take EMC aspects already in design phase []3. Modeling and simulation is the most effective tool to analyze EMC consideration before developing the products. A lot of the previous studies concerned the low frequency analysis of power electronics components []4[]5. Different types of power electronics converters are capable to be considered as source of EMI. They could propagate the EMI in both radiated and conducted forms. Line Impedance Stabilization Network (LISN) is required for measurement and calculation of conducted interference level []6. Interference spectrum at the output of LISN is introduced as the EMC evaluation criterion []7[]8. National or international regulations are the references forthe evaluation of equipment in point of view of EMC []7[]8.II. SOURCE, PATH AND VICTIM OF EMIUndesired voltage or current is called interference and their cause is called interference source. In this paper a high-speed switching power supply is the source of interference.Interference propagated by radiation in area around of an interference source or by conduction through common cabling or wiring connections. In this study conducted emission is considered only. Equipment such as computers, receivers, amplifiers, industrial controllers, etc that are exposed to interference corruption are called victims. The common connections of elements, source lines and cabling provide paths for conducted noise or interference. Electromagnetic conducted interference has two components as differential mode and common mode []9.A. Differential mode conducted interferenceThis mode is related to the noise that is imposed between different lines of a test circuit by a noise source. Related current path is shown in Fig. 1 []9. The interference source, path impedances, differential mode current and load impedance are also shown in Fig. 1.B. Common mode conducted interferenceCommon mode noise or interference could appear and impose between the lines, cables or connections and common ground. Any leakage current between load and common ground couldbe modeled by interference voltage source.Fig. 2 demonstrates the common mode interference source, common mode currents Iandcm1 and the related current paths[]9.The power electronics converters perform as noise source Icm2between lines of the supply network. In this study differential mode of conducted interference is particularly important and discussion will be continued considering this mode only.III. ELECTROMAGNETIC COMPATIBILITY REGULATIONS Application of electrical equipment especially static power electronic converters in different equipment is increasing more and more. As mentioned before, power electronics converters are considered as an important source of electromagnetic interference and have corrupting effects on the electric networks []2. High level of pollution resulting from various disturbances reduces the quality of power in electric networks. On the other side some residential, commercial and especially medical consumers are so sensitive to power system disturbances including voltage and frequency variations. The best solution to reduce corruption and improve power quality is complying national or international EMC regulations. CISPR, IEC, FCC and VDE are among the most famous organizations from Europe, USA and Germany who are responsible for determining and publishing the most important EMC regulations. IEC and VDE requirement and limitations on conducted emission are shown in Fig. 3 and Fig. 4 []7[]9.For different groups of consumers different classes of regulations could be complied. Class Afor common consumers and class B with more hard limitations for special consumers are separated in Fig. 3 and Fig. 4. Frequency range of limitation is different for IEC and VDE that are 150 kHz up to 30 MHz and 10 kHz up to 30 MHz respectively. Compliance of regulations is evaluated by comparison of measured or calculated conducted interference level in the mentioned frequency range with the stated requirements in regulations. In united European community compliance of regulation is mandatory and products must have certified label to show covering of requirements []8.IV. ELECTROMAGNETIC CONDUCTED INTERFERENCE MEASUREMENTA. Line Impedance Stabilization Network (LISN)1-Providing a low impedance path to transfer power from source to power electronics converter and load.2-Providing a low impedance path from interference source, here power electronics converter, to measurement port.Variation of LISN impedance versus frequency with the mentioned topology is presented inFig. 7. LISN has stabilized impedance in the range of conducted EMI measurement []7.Variation of level of signal at the output of LISN versus frequency is the spectrum of interference. The electromagnetic compatibility of a system can be evaluated by comparison of its interference spectrum with the standard limitations. The level of signal at the output of LISN in frequency range 10 kHz up to 30 MHz or 150 kHz up to 30 MHz is criterion of compatibility and should be under the standard limitations. In practical situations, the LISN output is connected to a spectrum analyzer and interference measurement is carried out. But for modeling and simulation purposes, the LISN output spectrum is calculated using appropriate software.基于压降型PWM开关电源的建模、仿真和减少传导性电磁干扰摘要:电子设备之中杂乱的辐射或者能量叫做电磁干扰(EMI)。
电化学专业词汇锂离子电池Stoichiometry 化学计量学Cyclability 循环特性Rate capability 倍率性能Life-span 寿命The state of the art 目前的工艺水平Overall assessment 综合评价Basis for 为…打基础Rational selection 合理的选择辅助动力混合电动车(Power-Assist Hybrid Electric Vehicles ,包括HEV和FCV);插电式混合电动车(Plug-in Hybrid Electric Vehicles ,包括PHEV 和FCV)纯电动车(Battery Electric Vehicles ,包括各类EV)R&D (research and development),指在科学技术领域,为增加知识总量(包括人类文化和社会知识的总量),以及运用这些知识去创造新的应用进行的系统的创造性的活动,包括基础研究、应用研究、试验发展三类活动。
可译为“研究与开发”、“研究与发展”或“研究与试验性发展”。
DOE 美国能源部Passivation 钝化Hydrophobic 疏水性Lipophobic 疏酯性Solvophobic 疏溶剂的Aggregate 聚集Micelle 胶团微团Fluorosurfactant 氟表面活性剂Impermeable 不可渗透的Electrolyzer 电解槽Redox flow battery 氧化还原液流电池Intrinsic 本质的固有的Novel approach 新方法Delocalization 离域移位Steric shield 空间屏蔽Nucleophilic attack 亲核攻击Spur 鼓舞马刺刺激鞭策Resurgence 复活再现New platform 新平台Fuel flexibility 燃料灵活性Cusp 风口浪尖Power generator 电力发电机Forklift 铲车Stumbling block 绊脚石Methanol 甲醇Formic acid 甲酸Dimethyl ether 二甲醚Performance decline 绩效下滑Peroxide 过氧化物过氧化氢Chloromethylation氯甲基化Aromatic polymer 芳族聚合物Styrene 苯乙烯Quaternization 碱化反应Benzylchloride 氯化苄Tertiary amine 叔胺Quaternary 四进制的四元的Ammonium 铵Tether 范围Linkage 连接Facile 温和的灵巧的Monomer 单体Precursor 前驱体Brominated 溴化Benzylhalide 苄基氯Subsequent 随后的Backbone 支柱中坚Bucket 水桶Susceptible 易受。
Hybrid nickel hexacyanoferrate/polypyrrole composite as mediator for hydrogen peroxide detection and its applicationin oxidase-based biosensorsPablo A.Fiorito,Susana I.Co´rdoba de Torresi *Departamento de Quı´mica Fundamental,Instituto de Quı´mica,Universidade de Sa ˜o Paulo,C.P.26077,05513-970Sa ˜o Paulo (SP),BrazilReceived 25August 2004;received in revised form 2November 2004;accepted 10January 2005Available online 23May 2005AbstractThe synthesis and electrochemical characterization of a new organic/inorganic hybrid material was performed by combining polypyrrole and a hexacyano metalate (nickel hexacyanoferrate (NiHCNFe))aiming to obtain an electrocatalyst for H 2O 2reduction in the presence of either Na +or K +ions.The use of this material as a redox mediator in an oxalate biosensor based on the immo-bilization of oxalate oxidase enzyme was also discussed.The electrochemical properties of the hybrid material were investigated by using impedance measurements and compared with those of the nickel hexacyanoferrate film alone.The electrocatalytic properties of the hybrid for reducing H 2O 2,in the presence of both Na +and K +ions,are higher than those of the NiHCNFe film due to the presence of polypyrrole chains that enhances the electronic conductivity of the material.Ó2005Elsevier B.V.All rights reserved.1.IntroductionThe importance of electrochemical biosensors has in-creased in the last decade due to the combined advanta-ges offered by the specificity of biochemical recognition and the simplicity of electrochemical transduction [1–3].Most commercially available electrochemical biosensors use a specific group of oxido-reductase enzymes as the biological recognition element.Some of these enzymes oxidize their specific substrates in the presence of molec-ular oxygen leading to the formation of hydrogen perox-ide as a side product.The final signal can be generated by the electrochemical detection of H 2O 2produced on the course of the reaction.However,the high positive working electrode potentials required to H 2O 2detection,leads to interference from reducting species such asascorbic or uric acids and ing elect-rocatalysts that allow monitoring H 2O 2level at lower potentials can obviate this drawback.For example,elec-trochemically deposited Prussian blue (PB)proved to be an excellent catalyst for H 2O 2reduction at low poten-tials [4–7].When deposited onto an electrode,PB can be reduced to Prussian white that can electrochemically reduce H 2O 2according to Eqs.(1)and (2),all this pro-cess occurring at ca.0.0V vs Ag/AgCl/Cl À.Fe 4½Fe ðCN Þ6 3PBþ4e Àþ4K þ!Fe 4K 4½Fe ðCN Þ6 3PWð1ÞFe 4K 4½Fe ðCN Þ6 3PWþ2H 2O 2!Fe 4½Fe ðCN Þ6 3PBþ4OH Àþ4K þð2ÞDuring the redox reactions of hexacyano metalates,the charge balance is carried out by the insertion/ejection of alkali-metal counter-cations [8–11].In the specific case of PB,this charge balance can be only done by K +ex-change,due to the fact that the crystalline structure does0022-0728/$-see front matter Ó2005Elsevier B.V.All rights reserved.doi:10.1016/j.jelechem.2005.01.039*Corresponding author.Tel.:+551130912350;fax:+551138155579.E-mail addresses:storresi@p.br ,storresi@p.br (S.I.Co´rdoba de Torresi)./locate/jelechemJournal of Electroanalytical Chemistry 581(2005)31–37Journal ofElectroanalyticalChemistrynot allow theflux of alkaline-metal counter-ions others than K+[12].This is due to the fact that all alkaline ions (Na+.Rb+,Cs+and even Li+)present hydrodynamic ra-dius bigger than the interstitial place in the PB network. As Na+is present in most humanfluids such as blood, urine,etc.,the disappearance of PB electroactivity in electrolytes containing Na+is a serious problem that must be overcome if thefinal goal of research is to em-ploy PB as eletrocatalyst for building biosensors.Nickel(II)hexacyanoferrate(II)(NiHCNFe)is a Prussian blue analog,where Fe+3ions are replaced by Ni+2.This compound exhibits attractive redox proper-ties in terms of charge compensation.NiHCNFe is char-acterized by well-defined,reversible and reproducible responses in supporting electrolytes containing not only potassium but also other alkali-metal cations such as lithium,sodium,rubidium or cesium[13–16].The struc-tures of both,oxidized and reduced forms are,contrarily to Prussian blue,open enough to allow theflux of alkali metals counter-ions of different sizes.In the present work the preparation of an organic/inor-ganic hybrid composed by polypyrrole and NiHCNFe and its ability to catalyze H2O2reduction in aqueous elec-trolytes containing Na+,is presented.The hybrid ap-proach allows the development of new materials based on the combination of organic and inorganic species in a attempt to obtain some reinforcement or synergy be-tween them[17].In this case,the conducting polymer was introduced with the aim of improving the mechanical and electrochemical characteristics of thefilms.The com-posite can be formed by cyclic voltammetry in solutions containing nickel(II),hexacyanoferrate(III)and pyrrole.Examples of hybrid organic/inorganicfilms have been already reported in the literature.Kulesza et al.[18,19] have presented the formation of a polyaniline/NiHCNFe hybrid.An important feature in this kind of materials is that conducting polymers are electronic conductors in the potential range where NiHCNFe is electroactive; therefore,charge propagation across the NiHCNFe cen-ters is supposed to be facilited improving,in this way,the electrocatalytic properties of the hexacyanometalate compound.Our ultimate goal is to produce robustfilms, capable of efficiently catalyzing the electroreduction of H2O2in aqueous electrolytes containing both,Na+and K+.The application of this material for building up suit-able,reliable and stable oxalate biosensors is also pre-sented in this paper as an application of the material in oxidase-based amperometric devices.2.Experimental2.1.MaterialsAll chemicals were reagent grade and were used without further purification.All solutions were pre-pared using ultra pure water(Elga System UHQ, 18M X cmÀ1).2.2.InstrumentationCyclic voltammetry(CV),chronoamperometry(CA) and impedance spectroscopy(EIS)experiments were performed with an Autolab PGSTAT30(Eco Chemie) electrochemical system,equipped with a FRA2fre-quency response analyzer module and driven by GPES 4.7and FRA4.7softwares.All potentials are referred to a Ag/AgCl/ClÀ(sat)electrode,while a platinum foil was employed as the auxiliary electrode.As working electrode a glassy carbon(GC)electrode(BAS,3mm diameter),was used.2.3.NiHCNFe/polypyrrole hybrid depositionThe NiHCNFe/polypyrrolefilms were deposited onto the working electrode by applying triangular potential sweeps(at0.1V sÀ1)in theÀ0.3to0.9V potential range in solutions containing5·10À3mol LÀ1K3Fe(CN)6+ 5·10À3mol LÀ1NiCl2+0.1mol LÀ1KCl+0.1mol LÀ1 HCl+5·10À3mol LÀ1pyrrole.In the text,we will refer to this electrode as GC/NiHCNFe/Ppy.2.4.NiHCNFe depositionThin NiHCNFefilms were prepared by applying tri-angular potential sweeps(0.1V sÀ1)in theÀ0.3to0.9V potential range in a solution containing5·10À3 mol LÀ1K3Fe(CN)6+5·10À3mol LÀ1NiCl2+0.1 mol LÀ1KCl+0.1mol LÀ1HCl.In the text we will re-fer to this electrode as GC/NiHCNFe.2.5.Prussian blue depositionThin Prussian bluefilms were prepared by polarizinga GC electrode(/=3mm,BAS,A=0.0707cm2)at0.40V in an aqueous2.5·10À3mol LÀ1FeCl3+2.5·10À3mol LÀ1K3Fe(CN)6+0.10mol LÀ1KCl+0.10 mol LÀ1HCl solution.After deposition thefilm was activated in a0.10mol LÀ1KCl+0.10mol LÀ1HCl solution by applying50triangular potential cycles in theÀ0.20to0.60V potential range.2.6.Amperometric measurementsAmperometric response of modified electrodes to H2O2additions were made in a conventional three-elec-trode electrochemical cell(5ml)containing stirred elec-trolytes(HCl0.1mol LÀ1+KCl0.1mol LÀ1or HCl 0.1mol LÀ1+NaCl0.1mol LÀ1).Before the successive H2O2additions,the electrode was polarized at the oper-ating potential till the stabilization of the background current.32P.A.Fiorito,S.I.Co´rdoba de Torresi/Journal of Electroanalytical Chemistry581(2005)31–372.7.Oxalate biosensor preparationOxalate biosensors were prepared by immobilizing oxalate oxidase(Sigma)onto a CG electrode modified with a NiHCNFe,NiHCNFe/PPy or PBfilms by putt-ing a drop(6l L)of a solution containing2.4mg mLÀ1 of enzyme and a drop(3l L)of glutaraldehyde(2.5%) solution on the top of the electrode.The solvent was al-lowed to evaporate at room temperature.Tests of bio-sensorÕs response to oxalate were made by triplicate in a conventional three-electrode electrochemical cell (5mL)containing a stirred succinate buffer solution (0.10mol LÀ1,pH3.8)as electrolyte.Before the succes-sive oxalate additions,the electrode was polarized at the operating potential till the stabilization of the back-ground current.3.Results and discussion3.1.Electrochemical synthesisFig.1shows j/E potentiodynamic profiles recorded during the electrochemical synthesis of the NiHCNFe/ PPy hybridfilm(a);the electrochemical growing of a NiHCNFefilm(b)and a PPyfilm(c)are also shown for comparison.It can be observed that the voltammo-gram of the hybridfilm exhibits all the electrochemical features of both individual components.Upon cycling, the increasing of peaks corresponding to polypyrrole (at ca.0.0and0.9V)and also those related to NiHCNFe redox couples(at ca.0.5and0.6V),are ob-served.This fact indicates the simultaneous deposition and a homogeneous distribution of both components in thefilm.It must be pointed out,as already described in literature[20],that polymerization of polypyrrole is an oxidative process that takes place during the positive potential scans,while nickel hexacyanoferrate is electro-deposited during negative potentials cycles,where ferri-cyanide is reduced to ferrocyanide[21,22].On the other hand,an electrostatic interaction between both compo-nents is expected related to the cationic character of PPy chains and the negative charge of NiHCNFe complex.Regarding mechanical properties of both NiHCNFe and NiHCNFe/PPyfilms,it must be pointed out that the polymeric matrix makes adherent and very stablefilms while NiHCNFe ones dissolve after long cycling.3.2.Electrochemical characterizationAiming to characterize the electronic and transport properties of NiHCNFe/PPy hybridfilm,electrochemi-cal impedance experiments were performed.Fig.2 shows Nyquist plots of the imaginary vs.the real part of the impedance for both,NiHCNFe complex(Fig.2(a))and the hybrid material(Fig.2(b)).These exper-iments were run at0.0V;this value was chosen because corresponds to the potential region where NiHCNFe is in the reduced form being capable of mediating H2O2 reduction,without the interference of any reducing spe-cies.For both systems,the intersection at high frequen-cies on the real axis corresponds to the electrolyte resistance.This element is easily observed in Fig.2(b) because the impedance values attained for the hybrid material are smaller than for NiHCNFefilm.The diameter of the semicircle observed at high frequencies is related to the resistance of the charge transfer reac-tion(Rct)and the electronic resistance of thefilm (Rf).The frequency of the maximum of the semicircle is related to the interfaces andfilm capacities[23,24].A big difference between the values of these resistances can be inferred from thefigure;13k X for NiHCNFeP.A.Fiorito,S.I.Co´rdoba de Torresi/Journal of Electroanalytical Chemistry581(2005)31–3733(Fig.2(a))and40X for the hybrid material(Fig.2(b)). This fact indicates that PPy must be‘‘connecting’’in some way,NiHCNFe particles to produce an increase in the charge transfer rate.Moreover,by analyzing the impedance diagrams at low frequencies,it is ob-served the typical shape expected for infinite diffusion for NiHCNFefilm(Fig.2(a))[23,24]andfinite diffu-sion for the hybrid material(Fig.2(b)).The diffusional process occurring at low frequencies is related to the ionic movement inside thefilm to compensate charge andfinite diffusion means that the reaction front ad-vances all across thefilm thickness.Considering that in both casesfinite or infinite diffusion processes are observed in the same frequency range,it can be in-ferred that the ionic transport inside the hybridfilm is faster than inside the NiHCNFe one.With these data in mind,two possible structures for the hybrid film can be speculated as those shown in schemes pre-sented in Fig.3:a conductive PPyfilm with NiHCNFe particles homogenously distributed within it,or a lay-ered structure of NiHCNFe particles sandwiched be-tween conducting PPy domains.In order to elucidate which kind of structure is formed some electrochemical experiments,were performed.Fig.4(a)shows the elec-trochemical response obtained when a hybridfilm is cycled until1.0V in order to overoxidize the polypyr-role matrix.As it is well known[25,26],when PPyfilms are polarized at high anodic potentials in aqueous solu-tion,nucleophilic attack is produced with the subse-quent loss of conductivity and electroactivity[27].It can be observed in thefigure the decrease of all peaks of the voltammogram but,after long cycling,peaks corresponding to PPy couples(at0.2and1.0V)disap-pear while those corresponding to NiHCNFe couples remain.For the sake of comparison,a‘‘sandwich-type’’hybridfilm was prepared by depositing alterna-tively and separately PPy and NiHCNFefilms until obtaining an arrangement of three PPy/NiHCNFe bilayers.This electrode was cycled and results are shown in Fig.4(b).As it can be seen,upon long cycling until1.0V,this electrode loss almost all electroactivity and peaks corresponding to the inorganic compound completely disappear.This is a simple experiment thatFig.3.Schematic representation of two possible NiHCNFe/PPy hybrid structure:(a)three-dimensional network with homogeneous NiHCNFe and PPy distribution.(b)Sandwich-type Ni HCNFe and PPy layer by layer structure.34P.A.Fiorito,S.I.Co´rdoba de Torresi/Journal of Electroanalytical Chemistry581(2005)31–37puts in evidence that the structure of the hybridfilm must be close to that depicted in scheme(a)of Fig.3.3.3.Electrocatalytic properties of the hybridfilmFig.5shows the analytical curves obtained after suc-cessive additions of H2O2solution to KCl(a)and NaCl (b)electrolytes,with both NiHCNFefilms and the hy-brid NiHCNFe/PPy,performed at0.0V.For the sake of comparison,results obtained for both electrolytes with a Prussian blue(PB)modified electrode,are also depicted in thefigure.As already shown in the literature [5,28,29],in the presence of K+ions,Prussian bluefilms exhibit an excellent performance(sensitivity340.9 l A mmolÀ1L cmÀ2)when compared with the hybrid electrode(88.33l A mmolÀ1L cmÀ2)and the NiHCNFe film(9.61l A mmolÀ1L cmÀ2).When the analytical tests are performed in the presence of Na+ions(Fig. 5(b))the electrocatalytic properties of PB are completely lost(1.55l A molÀ1L cmÀ2)while the hybrid electrode shows a very good and reliable response(66.54l A molÀ1L cmÀ2).The PB loss of activity is related to structure hindrance as already discussed in the introduc-tion part of this paper.This characteristic confirms the hybrid electrode as a suitable material for building amperometric biosensors based on oxidase enzymes. At this point it is important to note that the catalytic activity of the hybrid electrode is higher than that corre-sponding to the NiHCNFefilm and this fact must be re-lated to the higher electronic conductivity of the hybrid due to the presence of polyrrolefilm.In order to confirm this statement,the polypyrrole matrix of the hybrid elec-trode was overoxidized aiming to diminish the electronic conductivity of this material.Fig.6(a)shows the electro-chemical impedance diagram obtained for a hybridfilm after being cycled until1.0V to overoxidize the PPy ma-trix.As it can be seen,by comparing with Fig.2(b),the diameter of the high frequency semicircle increases indi-cating a higherfilm and charge transfer resistance that lead to the loss of the electrocatalytic properties.This can be inferred from Fig.6(b)where the analytical curves obtained with the hybrid electrode,before and after being overoxidized,are compared.This is an evi-dence that the better performance of the hybrid elec-trode is closely related to the electronic conductivity of poly(pyrrole)matrix.3.4.Oxalate biosensor based on NiHCNFe/PPy hybridThe determination of oxalic acid is of considerable significance,especially in clinical diagnosis.Nowadays, oxalic acid is determined in the diagnosis and therapeu-tic monitoring of hyperoxaluria[30];for this purpose, amperometric biosensors are an attractive alternative method due to specificity,simple use and the possibility of performing analysis without any pre-treatment of the sample.It was already reported that the combination ofP.A.Fiorito,S.I.Co´rdoba de Torresi/Journal of Electroanalytical Chemistry581(2005)31–3735Prussian blue and oxalate oxidase(OOX)in an oxalate biosensor allows reliable and sensitive oxalate detection [31].However,this configuration has a serious draw-back,due to the fact that the PB losses its electroactivity in the presence of Na+,avoiding the utilization of this kind of biosensors in urine oxalate determination.This problem can be avoided by using NiHCNFe/PPy instead PB.Fig.7shows the analytical curves of a NiHCNFe/ PPy based biosensor operating in electrolytes containing both,K+and Na+cations,recorded at0.0V in the0.05–0.45mmol LÀ1concentration range.As can be ob-served,the biosensor was able to detect oxalate,showing sensitivities of39.03and21.78l A mmolÀ1L cmÀ2oper-ating in electrolytes containing Na+and K+,respec-tively.These sensitivity values are high enough to perform reliable oxalate determination and it is interesting to compare these values with those obtained for a PB based biosensor:while a sensitivity of76.94l A mmolÀ1L cmÀ2is obtained in K+electrolytes,this value falls to 4.66l A mmolÀ1L cmÀ2in a Na+containing solution.In order to verify the behaviour of the system,the Michaelis–Menten constant(K M)kinetic parameter was evaluated by employing the Lineweaver–Burk graph[32].A value of1.9·10À3mol LÀ1for the K M was obtained.Although the apparent constant value obtained is higher than those for OOX in solution [33](1.1·10À4mol LÀ1),Michaelis–Menten constant values for OOX in the range from1.3·10À1to1.6·10À4mol LÀ1have been informed in the literature[34–38]for different procedures of immobilization.The in-crease in K M for OOX may be attributed to the mass transfer limitations of the substrate to access the immo-bilized enzyme[39]and also to the modification of the quaternary structure of the actives sites of the enzyme [40].4.ConclusionsThe synthesis of a new organic/inorganic hybrid material was performed by combining polypyrrole and an hexacyano metalate(NiHCNFe)aiming to obtain an electrocatalyst for H2O2reduction in the presence of either Na+or K+ions.The use of this material as a redox mediator in an oxalate biosensor based on the immobilization of oxalate oxidase enzyme was also dis-cussed.The electrochemical properties of the hybrid material were investigated and compared with those of the nickel hexacyanoferratefilm alone.The electrocata-lytic properties of the hybrid are higher than the NiHCNFefilm due to the presence of polypyrrole chains that enhance the electronic conductivity of the material.36P.A.Fiorito,S.I.Co´rdoba de Torresi/Journal of Electroanalytical Chemistry581(2005)31–37The hybrid NiHCNFe/PPy is a good electrocatalyst for H2O2reduction in the presence of both Na+and K+ions showing not only a high sensitivity but also a low detection limit of ca.0.1mmol LÀ1.This allows the combination with oxidase enzymes in order to build reliable and robust amperometric biosensors. AcknowledgmentsFinancial support of Brazilian Agencies FAPESP, CNPq and CAPES is gratefully acknowledged.One of us(P.A.F.)thanks FAPESP(Proc.No.01/04957-0) for the scholarship granted.References[1]ardovic,I.Kruhak,D.Ikekovik,V.Rumenjak,alcec,B.S.Grabaric,Anal.Chim.Acta350(1997)91.[2]J.Wang,Q.Chen,Anal.Chem.66(1994)1007.[3]F.Palmisano,G.Zambonin, D.Centonze,M.Quinto,Anal.Chem.74(2002)5913.[4]A.A.Karyakin,E.E.Karyakina,L.Gorton,Talanta43(1996)1597.[5]A.A.Karyakin,O.V.Guitelmacher,E.E.Karyakina,Anal.Chem.67(1995)2419.[6]A.A.Karyakin, E.E.Karyakina,L.Gorton,J.Electroanal.Chem.456(1998)97.[7]R.Koncki,Crit.Rev.Anal.Chem.32(2002)79.[8]K.Itaya,I.Uchida,V.D.Neff,Acc.Chem.Res.19(1986)162.[9]B.D.Humphrey,S.Sinha, A.B.Bocarsly,J.Phys.Chem.91(1987)586.[10]A.L.Crumbliss,P.S.Lugg,N.Morosoff,Inorg.Chem.23(1984)4701.[11]G.Horanyi,G.Inzlet,P.J.Kulesza,Electrochim.Acta35(1990)811.[12]A.A.Karyakin,Electroanalysis13(2001)813.[13]K.Bacskai,K.Martinusz,E.Czirok,G.Inzelt,P.J.Kulesza,M.A.Malik,J.Electroanal.Chem.385(1995)241.[14]S.Sinha,B.D.Humphrey,A.B.Bocarsly,Inorg.Chem.23(1984)203.[15]S.Zamponi,M.Berrettoni,P.J.Kulesza,K.Miecznikowski,M.A.Malik,O.Makowski,R.Marassi,Electrochim.Acta48 (2003)4261.[16]M.A.Malik,K.Miecznikowski,P.J.Kulesza,Electrochim.Acta45(2000)3777.[17]P.Gomez-Romero,Adv.Mater.13(2001)163.[18]P.J.Kulesza,K.Miecznikowski,M.A.Malik,M.Galkowski,M.Chojak,K.Caban,A.Mieckowski,Electrochim.Acta46(2001) 4065.[19]P.J.Kulesza,K.Miecznikowski,M.Chojak,M.A.Malik,S.Zamponi,R.Marassi,Electrochim.Acta46(2001)4371. [20]S.Sadki,P.Schottland,N.Brodie,G.Sabouraud,Chem.Soc.Rev.29(2000)283.[21]K.M.Jeerage,W.A.Steen, D.T.Schwartz,Chem.Mater.14(2002)530.[22]S.-M.Chen,Electroanal.Chem.521(2002)29.[23]M.A.Vorotyntsev,L.I.Daikhin,M.D.Levi,J.Electroanal.Chem.364(1994)37.[24]C.Gabrielli,H.Takwnouti,O.Haas,A.Tsukada,J.Electroanal.Chem.302(1991)59.[25]N.C.Foulds,C.R.Lowe,J.Chem.Soc.,Faraday Trans.82(1986)1259.[26]F.Palmisano,P.Centonze,A.Guerrieri,Biosens.Bioelectron.8(1993)393.[27]J.B.Schlenoff,H.Xu,J.Electrochem.Soc.139(1992)2397.[28]I.L.Mattos,L.Gorton,Quim.Nova24(2001)200.[29]M.P.OÕHalloran,M.Pravda,G.G.Guilbault,Talanta55(2001)605.[30]D.M.Wilson,R.R.Liedtke,Clin.Chem.37(1991)1229.[31]P.A.Fiorito,S.I.Cordoba de Torresi,Talanta64(2004)649.[32]D.Voet,J.Voet(Eds.),Biochemistry,second ed.,Wiley,NewYork,1995,p.351.[33]T.Cass,F.S.Ligler,Immobilized Biomolecules in Analysis:aPractical Approach,Oxford University Press,New York,1998,p.127.[34]M.A.S.Amini,J.J.Vallon,C.Bichon,Anal.Lett.22(1989)43.[35]M.A.S.Amini,J.J.Vallon,Anal.Chim.Acta299(1994)75.[36]thika,K.V.Inamdar,U.Tarachand,B.B.Singh,K.G.Raghavan,Anal.Lett.28(1995)425.[37]C.S.Pundir, C.S.P.Satyapal,N.K.Kuchhal,Clin.Chem.39(1993)1750.[38]M.Sharma,M.Thakur,P.Chandran, C.S.Pundir,J.Plant,Biochem.Biotechnol.9(2000)123.[39]S.Luo,D.R.Walt,Anal.Chem.61(1989)1069.[40]S.Parkinson,W.L.Sheldon,ker,P.A.Smith,Clin.Chem.33(1987)1203.P.A.Fiorito,S.I.Co´rdoba de Torresi/Journal of Electroanalytical Chemistry581(2005)31–3737。
动力电池和电机电控英语术语汇总动力电池和电机电控英语术语汇总Document number:WTWYT-WYWY-BTGTT-YTTYU-2018GT [单体]电池?cell原电池?primary cell蓄电池?secondary cell电池battery燃料电池?fuel cell锂电池?lithium cell熔融盐电池?molten salt cell碱性电池alkalinecell固体电解质电池?solid electrolyte cell非水电解质电池?non aqueous cell指示电池?pilot cellOEM电池 OEM battery替换电池?replacement battery储备电池?reserve cell应急电池?emergency battery缓冲电池?buffer battery; back-up battery电压标准电池?standard voltage cell韦斯顿电压标准电池Weston standard voltage cell 激活?activation未激活的?inactivated全密封电池?hermetically /sealed cell 极板?plate涂膏式极板?pasted plate极群?plate group负极板?negative plate正极板?positive plate管式极板?tubular plate极群组?plate pack极板对?plate pair隔离物?spacer隔板(plate)separator阀?valve电池外壳?cell can电池槽cell case电池盖cell lid电池封口剂?lid sealing compound 整体电池?monobloc battery整体槽 monobloc container边界绝缘体?edge insulator外套 jacket[单体电池]电极(cell)electrode端子 terminal端子保护套?terminal protector;terminal cover 负极端子?negative terminal正极端子?positive terminal电极的活性表面?active surface of an electrode 阳极?anode阴极?cathode电解质?electrolyte电解质爬渗?electrolyte creep电解质保持能力?electrolyte containment泄漏?leakage活性物质?active material活性物质混合物?active material mix电池组合箱?battery tray输出电缆?output cable连接件?connector矩形(的)prismatic圆柱形电池?cylindrical cell扣式电池 button cell; coin cell电化学反应?electrochemical reaction电极极化?electrode polarization反极polarity reversalcell reversal结晶极化?crystallization polarization活化极化?activation polarization阳极极化?anodic polarization阴极极化?cathodic polarization浓差极化?concentration polarization; mass transfer polarization 欧姆极化ohmic polarization反应极化reaction polarization阳极反应?anodic reaction阴极反应?cathodic reaction副反应?side reaction; secondary reaction;容量(电池的)capacity(for cells or batteries)额定容量?rated capacity剩余容量?residual capacity体积(比)容量?volumetric capacity温度系数?temperature coefficient(of the capacity)质量(比)容量?gravimetric capacity面积(比)容量?areic capacity电池能量?battery energy(电池)体积(比)能量volumic energy(related to battery) (电池)放电?discharge(of a battery)放电电流?discharge current放电率?discharge rate短路电流(电池的)short-circuit current(related to cells or batteries)自放电?self discharge放电电压(电池的)discharge voltage(related to cells or batteries)闭路电压?closed circuit voltage负载电压(拒用)on load voltage (deprecated)初始放电电压?initial discharge voltage初始闭路电压?initial closed circuit voltage初始负载电压(拒用)initial on load voltage(deprecated)终止电压?end-of-discharge voltage; final voltage; cut-off voltage; end-point voltage 标称电压?nominal voltage 开路电压(电池的)open-circuit voltage(related to cells or batteries)开路电压温度系数temperature coefficient of the open-circuit voltage比特性?specific characteristic荷电保持能力?charge retention容量保持能力?capacity retention表观内阻?internal apparent resistance剩余活性物质?residual active mass使用质量?service mass并联?parallel connection并串联?parallel series connection串联?series connection串并联?series parallel connection标称值?nominal value电池耐久性?battery endurance贮存试验?storage test使用寿命?service life贮存寿命?storage life; shelf life连续工作试验?continuous service test金属-空气电池air metal battery碱性锌-空气电池alkaline zinc air battery碱性锌-二氧化锰电池alkaline zinc manganese dioxide battery 锌-氧化银电池zinc silver oxide battery中性锌-空气电池neutral electrolyte zinc air battery氯化锌电池?zinc chloride battery锌-碳电池?zinc carbon battery诸如勒克朗谢电池或氯化锌电池之类的原电池。
Hierarchically-Ordered Electroactive Silica-Polyaniline Nanohybrid: A Novel Material with Versatile PropertiesMANESH KALAYIL MANIAN,1GOPALAN ANANTHA IYENGAR,1,2KWANG-PILL LEE,1,2NAM HEE KIM,1KOMATHI SHANMUGASUNDARAM,1SEONG HO KANG31Department of Chemistry Graduate School,Kyungpook National University,Daegu702-701,South Korea2Department of Nanoscience and Nanotechnology,Kyungpook National University,Daegu702-701,South Korea3Department of Applied Chemistry,College of Applied Science,Kyung Hee University,Yongin-si,Gyeonggi-do446-701, South KoreaReceived1December2009;accepted11July2010DOI:10.1002/pola.24245Published online in Wiley Online Library().ABSTRACT:Poly(trimethoxy silylpropylaniline),a nanoporous (pore diameter of2.4nm),electroactive(stable reversible redox characteristics),electrochromic(yellow atÀ0.10V,blue green atþ0.50V,and dark green atþ0.70V),and pH-sensitive, silica–polyaniline(PANI)hybrid material(designated as KGM-1) has been synthesized in powder form by a simple one-pot chemical synthesis as well as a‘‘thin nanolayered film’’by cyclic voltammetry.High-resolution transmission image of KGM-1informs that the particles are spherical,with diameters in the range of0.5–1.5l m.X-ray diffraction pattern of pristine KGM-1confirms the combined presence of ordered silica net-work and PANI chains.The surface area of calcined KGM-1is 40m2/g($15times higher than KGM-1),and the average pore size is 2.4nm.The N2adsorption features also inform that PANI is present as a uniform layer within the pores of silica and because of that the silica pores are not completely blocked.The reversible redox transitions in PANI units and nanoporosity of KGM-1are effectively used for the electro-driven loading/release of DNA or adenosine50-triphosphate. V C2010Wiley Periodicals,Inc.J Polym Sci Part A:Polym Chem 48:4537–4546,2010KEYWORDS:electroactive;nanocomposites;nanoporous;nano-technology;polyaniline;silicasINTRODUCTION Organic–inorganic hybrid materials have attracted research interest in fundamental and applied fields.1–3 Hybrid nanomaterials,consisted of a conducting polymer(CP) within the porous silica combine the special properties of an inor-ganic matrix(chemical stability,morphology,tunable porosity,op-tical transport,and mechanical strength)with electrical and/or electronic properties of CPs.These materials have a wide range of applications,such as sensors,4,5microelectronics,or photonics.6–9 Since Kresge et al.10reported the synthesis of M41S family of sili-cates(like MCM-41),a variety of ordered mesoporous silica-based materials have become available to host molecules of various sizes (small organic to polymer),shapes,and functionalities.The first report on the preparation of silica–CP hybrid material has been made by Wu and Bein11using in situ polymerization of aniline within the channels of porous aluminum silicate.Studies have then been extended for the inclusion of CP within the channels of mesoporous materials.12–15Silica–CP hybrids have been synthe-sized by polymerization of CP on the surface of silica,16in situ hy-drolysis and condensation of tetraethyl orthosilicate in solution of CP or on the surface of CP.17Functional nanohybrid materials hav-ing hierarchically ordered chains of CP within the nanoporous inorganic matrix are expected to find diversified applications in fields such as drug delivery,sensors,nanodevices,and so forth.10,18As an important material in the family of CPs,polyaniline(PANI) has attracted intensive research because of its promising electri-cal,electrochemical,and optical properties.19Reports are avail-able on the encapsulation of PANI or PANI derivatives within pores of MCM-41.20–24Chemical anchoring of silica nanopar-ticles onto PANI chains has been reported through electrocopoly-merization of aniline.25Electrochemical reactive insertion has been used for the preparation of PANI–silica composite.26Nano-composites of mesoporous MCM-41and PANI have been pre-pared.27CPs are suited for the programmed uptake or release of biomolecules(drugs,DNA,adenosine50-triphosphate[ATP], viruses,etc.).We envisage that an effective electro-driven drug uptake or release is feasible for a nanoarchitectured CP hosted within a porous,rigid,and inorganic frame like silica network. The preparation of silica–PANI nanohybrids is hampered by few challenges and obstacles,in terms of extent of encapsu-lation of a CP within the silica pores,structural alignment within the channels,and periodicity of functionalities.The encapsulation of a lower extent of PANI chains and lack ofAdditional Supporting Information may be found in the online version of this article.Correspondence to:K.-P.Lee(E-mail:kplee@knu.ac.kr) Journal of Polymer Science:Part A:Polymer Chemistry,Vol.48,4537–4546(2010)V C2010Wiley Periodicals,Inc.periodicity of arrangements of PANI chains within the silica channel have been earlier notified.28A simple method for the preparation of silica–PANI hybrid with the possibility to obtain as thin film is highly warranted.Recently,self-assembly has emerged as a powerful technique for controlling structure and properties of ensembles of or-ganic/inorganic particles.In recent reviews,Ariga et al. described the details of two-dimensional nano architectonics based on self-assembly at an interface.29,30Several silica-based functional nanomaterials have been prepared by self-assembly approach.31A versatile PANI-catalyzed silicification route has been established for synthesizing functional nanomaterials.32A novel and simple strategy has been established for the prepara-tion of fluorescent nanoparticles by self-assembly of conjugated polymer onto the core-shell Ag@SiO2.33A multifunctional nano-composite incorporating cadmium selinide quantum dots and iron oxide(Fe3O4)nanoparticles within silica nanotube matrix has been prepared based on self-assembly of preformed func-tional nanoparticles.34Herein,we report the facile one-pot synthesis of poly N-[3-(tri-methoxy silyl)propyl]aniline,a silica–PANI hybrid material (designated as KGM-1).KGM-1has several special features, such as nanoporosity,periodically arranged PANI units within silica nanochannels,electroactivity,electrochromic behavior, and drug-loading capabilities.EXPERIMENTALMaterialsN-[3-(Trimethoxy silyl)propyl]aniline(TMSPA),ammonium persulfate(APS),and b-naphthalene sulfonic acid(b-NSA) were purchased form Aldrich(St.Louis,MO).Prepartion of KGM-1(Chemical Method)A solution of TMSPA(50m M)was prepared in b-NSA(50 m M),and the solution was stirred for2h.Ten milliliters of 0.5M APS was added dropwise to TMSPA solution with con-stant stirring at5 C.A dark green-colored precipitate(poly N-[3-(trimethoxy silyl)propyl]aniline doped b-NSA,KGM-1) was obtained.The precipitate was washed with distilled water and dried in vacuum oven at60 C.KGM-1was treated with an aqueous solution of ammonia(pH %9)under stirring for6–8h to obtain neutral(dedoped)form of KGM-1.The reaction mixture was filtered and washed with distilled water.The blue powder(neutralized KGM-1)collected by filtration was further purified by refluxing in methyl alcohol. The KGM-1neutralized was dried at60–80 C for8h.KGM-1 (neutralized)was calcined at540 C,and a white powder (KGM-1,calcined)was collected.Prepartion of Conventional PANIA solution of aniline(50m M)was prepared in b-NSA(50m M). Ten milliliters of0.5M APS solution was added dropwise to ani-line solution with constant stirring at5 C.The precipitate,con-ventional PANI,was washed with distilled water and dried in vacuum oven at60 C.Preparation of KGM-1Thin Film(Electrochemical Method)Cyclic voltammetry measurements were made by using EG and G PAR283Potentiostat/Galvanostat.A solution of TMSPA(50 m M)in b-NSA was electropolymerized in a three-electrode cell assembly consisting of indium tin oxide(ITO)-coated glass plate, Ag/AgCl(sat),and platinum wire as working,reference,and coun-ter electrodes,respectively,by reversibly cycling the potentials in the range between0.0V andþ1.0V.A green-colored film(KGM-1)was deposited on the surface of ITO electrode.Cyclic voltam-mogram(CV)of KGM-1film was recorded in1M NSA at scan rate of100mV/s to evaluate its electroactivity.The thickness of KGM-1film was evaluated by graphical integration of area under the cyclic voltammetric curves.CharacterizationMorphology and Structure of KGM-1(Powder)The particle morphology of KGM-1powder was investigated using high-resolution transmission electron microscope (HRTEM;Jeol,JEM-ARM1300S)with a field emission electron gun operated at1250kV.X-ray diffraction(XRD)patterns of the samples were collected using a D8-Advanced Bruker AXS dif-fractometer using Cu-a K radiation.N2adsorption–desorption isotherms(Brunauer–Emmett–Teller)were recorded using a Quantachrome Autosorb-1with nitrogen as the adsorbate at77 K.The samples were degassed for2h at200 C in vacuum before measurement.UV-vis spectra were recorded using Shi-madzu UV-2101spectrophotometer at room temperature in the range of300–800nm.Surface area and pore sizes were deter-mined using Quantachrome,Nova2000,Germany.Pore sizes were obtained from adsorption branches of N2adsorption–de-sorption isotherms(Brunauer–Emmett–Teller).Fourier trans-form infrared spectrometer(FTIR;Jasco,IR-610)was used to record the spectra using KBr pellets.Thermogravimetric analy-sis(TGA;Seiko,TMA120,Japan)of the samples was made at a heating rate of10 C/min under a nitrogen atmosphere over a temperature range of30–800 C.Conductivity was determined at room temperature by a standard four-probe van der Pauw method using Accent,HL5500,UK.The powders was pressed into6-mm pellet at6MPa and used for conductivity measure-ment.Elemental analyzer(Carlo,Erba1106)was used to deter-mine the elemental compositions.Electrochromism and Spectroelectrochemistryof KGM-1FilmKGM-1film of desired thickness was deposited on ITO (working electrode)as detailed above using cyclic voltamme-try.The experiments were done in quartz cuvette of1cm path length by assembling cell with ITO,Ag/AgCl,and plati-num wire as working,reference,and counter electrodes, respectively.UV-vis spectra were recorded concomitantly by applying potentials in the rangeÀ0.1V to0.7V.The Home-Made Total Internal ReflectionFluorescence MicroscopyThe basic experimental set-up of the home-made total inter-nal reflection fluorescence microscope(TIRFM)for the direct observations of individual single DNA molecules on the sub-strates was similar to that described elsewhere.35,36Briefly,JOURNAL OF POLYMER SCIENCE:PART A:POLYMER CHEMISTRY DOI10.1002/POLAa TIRFM with a nanometer precision positioning controller (Digital Bio Technology Co.,Ltd.,Seoul,South Korea)was constructed using a transmitted all-side polished dove prism (BK7,15mm;63mm;15mm,n ¼1.522,Korea Electro-Optics Co.,Ltd.,South Korea).The TIRFM optics was incor-porated into an upright Olympus BX51microscope (Olympus Optical Co.,Ltd.,Shinjuku-Ku,Tokyo,Japan)along with a DIC slider (U-DICT,Olympus).An oil-type 100Âobjective lens (Olympus UPLFL 100Â/1.3N.A.,W.D.0.1)was used.A CCD camera (Cascade 512B,Photometrics,Tucson,AZ)was mounted on the top of the microscope.The CCD exposure time was 100ms.A 488-nm notch filter (Korea Electro Optics,South Korea)and a 520-nm barrier filter (Olympus Optical Co.,Ltd.)was used to carry out the TIRFM study.An argon ion laser at 488nm with a 40-mW output (model 532-LAP-431-220;Melles Griot,Irvin,CA)was used as the excitation source for TIRFM.A film of KGM-1($400nm thickness)was coated onto the sur-face of ITO and placed on an all-side polished dove prism.The KGM-1($400nm thickness)-coated ITO plate and prism were index-matched with a drop of immersion oil (ImmersolTM 518F,Zeiss,n ¼1.518).The laser beam was then directed through the prism toward the protein chip/media interface.The angle of incidence,i ,was slightly greater than 72 .Toreduce photobleaching,a Uniblitz mechanical shutter (model LS3Z2;Vincent Associates,Rochester,NY)was used to block the laser beam when the camera was off.MetaMorph 7.0soft-ware (Universal Imaging Co.,Downing Town,PA)was used for image collection and data processing.Potential (À0.4or þ0.8V)was applied to KGM-1film-coated ITO electrode ($400nm thickness)using a high-voltage power supply (E3612A,Agilent).RESULTS AND DISCUSSIONSynthesis of KGM-1involves sequential reactions:oxidation of aniline units in TMSPA,hydrolysis of silanol units,and polymerization (Scheme 1).The one-pot synthesis is simple compared with conventional preparation of silica–CP hybrid materials.In the conventional methods,initial functionaliza-tion of silica walls and postsynthetic reactions were required.In such cases,the extent of loading of the poly-meric chains solely depended on the functionalization step.However,the present one-pot methodology avoids the tedi-ousness in the multistep procedure for the preparation of silica–PANI hybrid (Scheme 1).Generally,MCM type honey comb structures are formed by the sol–gel synthesis involv-ing organosilicate precursors through self-assembly of amphiphilic surfactants.However,preparation of KGM-1doesSCHEME 1Mechanism of KGM-1formation.(A)Spherical micelles of NSA-TMSPA self-assembly.(B)Simultaneous polymerization and condensation.(C)Polyaniline within the nanochannel of silica.ARTICLEnot involve a long-chain surfactant.In the present method, b-NSA,having a hydrophobic naphthalene unit and a sulfo-nate head group,was used to prepare KGM-1.NSA plays the roles of a micelle-directing agent for the formation of KGM-1 and a dopant for PANI chains.The mechanism of formation of KGM-1involves sequential stages;self-assembly of TMSPA molecules over the spherical micelles of NSA(through electrostatic interactions between the-NH2group in TMSPA and SO3Àgroup in NSA),oxidation of-NH2groups,polymerization of aniline units,hydrolysis of -OMe groups,and silicate formation through condensation of -OH groups(Scheme1).The aromatic amine groups in TMSPA catalyze the hydrolysis.37The mechanism of forma-tion of KGM-1is similar to the biological production of silica.38Thus,KGM-1contains the silicate network as well as the covalently linked and periodically ordered PANI chains (Scheme1).KGM-1can be converted into neutralized and calcined materials as follows.The as-prepared KGM-1is a b-NSA-doped(green colored)material.Deprotonation of PANI chains in KGM-1was performed by treatment with aqueous NH3.KGM-1transformed into neutralized(blue colored)ma-terial.Neutralization is accompanied by dedoping of PANI chains through removal of protons.The neutralized KGM-1 was subjected to calcination to obtain calcined KGM-1.PANI chains within the silica pores were decomposed by calcina-tion.KGM-1,KGM-1(neutralized),and KGM-1(calcined) were characterized independently.XRD pattern of pristine KGM-1confirms the combined pres-ence of ordered silica network and PANI chains.Small-angle XRD pattern of KGM-1[Fig.1(A)]exhibits the characteristic diffraction peaks assignable to a hexagonal symmetry of meso-porous structures.A strong reflection peak d(100)(2h¼2.9) with three small peaks d(110)(2h¼3.3),d(200)(2h¼5.9),and d(210)(2h¼6.6)indicates regular,hexagonal array of uniform channels of mesoporous structure with long-range order and good textural uniformity.The corresponding d spacing values for hkl planes(100),(110),(200),and(210)are29.47,26.59, 14.78,and13.28Å,respectively.It should be remembered that the XRD patterns reported by Kresge et al.10for MCM-type mesoporous materials show peaks with d-spacing values at2h ¼2.24 (39.8),3.92 (22.9),4.45 (19.8),and5.89 (14.9)for 100,110,200,and210planes,respectively.The comparision between the diffraction peak intensity and peak width informs that the scattering domain size and the pore structures are uniform and ordered as similar to MCM type materials reported earlier.XRD pattern of KGM-1[Fig.1(A),inset]also displays a peak around26 and a shoulder around30 that are characteristics of amorphous PANI.The intensities of peaks and pattern of higher-order diffraction peaks are slightly differ-ent compared with ordered silica structure.The difference in XRD pattern may be attributed to the presence of PANI chains within the silica pores.Importantly,PANI chains are covalently interlinked(grafted)to the silica walls.The interplanar spacing (d100)of KGM-1(29.4Å)is relatively higher than that of MCM-41prepared with surfactants having an aliphatic chain length longer than10.39The crystalline domain size of KGM-1 is lower than the conventional PANI.40HRTEM image of KGM-1[Fig.1(B)]informs that the par-ticles are spherical,with diameters in the range of0.5–1.5l m[Fig.1(B)(a)].The existence of amorphous PANI in the pores of silica is evident[Fig.1(B)(c)].HRTEM images of calcined KGM-1[Fig.1(B)(b),(d),(e)]indicate the presence of well-defined,uniform,and ordered nanometer-scale pores.Similar observation was noticed for porous MCM-41 having well-ordered hexagonal array.41,42Calcination of KGM-1destroys a portion of PANI chains present within the silica nanochannels and improves the contrast.As a result, the nanoscale architecture in the silica pores is visible.It is clear that the KGM-1has hexagonal-shaped ordered nano-pores[Fig.1(B)(e)].The elemental composition of KGM-1is as follows:72.11At%of C,1.29At%of N,10.27At%of Si,and4.34At%of S.KGM-1has a Si:N ratio of7.96,a value much higher than that of TMSPA($2.0),documenting the presence of three-dimensional silica network in KGM-1 (Scheme1).FTIR spectrum of pristine KGM-1(a),neutralized KGM-1(b), and calcined KGM-1(c)are presented in Figure2.FTIR spec-tra of KGM-1,its neutralized form,and calcined form show the typical vibration bands of the silica framework.The band around1085cmÀ1and the shoulder around1220cmÀ1are assigned to the asymmetric Si-O-Si stretching modes.43The intensity of Si-O-Si peak increased on calcination of KGM-1 at540 C,indicating the presence of silica in KGM-1.FTIR spectrum of KGM-1displays bands around1590and1500 cmÀ1and are assigned to C¼¼N and C¼¼C stretching of qui-noid and benzenoid units in PANI chains.44The relative peak intensities ratio between C¼¼C($1550cmÀ1)and C¼¼N ($1590cmÀ1)stretching bands is the index of dopability for PANI chains in KGM-1.The ratios of intensities of C¼¼C stretching to C¼¼N stretching band(I C¼¼C/I C¼¼N)are compared between pristine KGM-1and neutralized KGM-1.The I C¼¼C/ I C¼¼N ratio of KGM-1(neutralized)is much higher($1.6) compared with pristine KGM-1($1.15)than as-prepared KGM-1.The higher ratio of I C¼¼C/I C¼¼N for KGM-1(neutralized) indicates that PANI chains are dedoped on deprotonation by treatment with ammonia.45These observations goes well with the UV-vis results discussed later.As can be observed, after heating KGM-1in vacuum at540 C,the peaks account-ing for PANI chain greatly diminished in intensity or were nearly absent.Calcination of KGM-1resulted in the decompo-sition of PANI chains in KGM-1.46Calcination of KGM-1at 540 C makes complete decomposition of PANI chains,leav-ing porous silica as white powder.These results offer strong evidences for the combined presence of silica and PANI units in KGM-1.Further,the presence of PANI in KGM-1is evident from TGA results.Figure3shows the thermograms of pristine KGM-1 (curve a),neutralized KGM-1(curve b),and calcined KGM-1 (curve c).TGA of pristine KGM-1shows a three-step weight changes(Fig.3,curve a).A very small weight loss($2%)was witnessed below100 C because of evaporation of water, which indicated the purity of KGM-1($98%).The second weight loss($20%)between270and410 C is attributed toJOURNAL OF POLYMER SCIENCE:PART A:POLYMER CHEMISTRY DOI10.1002/POLAthe removal of b-NSA(dopant)from the PANI chains in KGM-1and low-molecular-weight PANI that could be generated by partial fragmentation of PANI chains in KGM-1at these tem-perature ranges.47The third stage weight change($35%) that begins around470 C and extends upto610 C corre-sponds to the decomposition of PANI chains in KGM-1.How-ever,neutralized KGM-1shows only a two-step weight loss. The sharp and prominent weight loss($70%)between220 and280 C is possibly attributed to the decomposition of low-molecular-weight PANI.48The absence of dopant weight loss and the increased amount of weight loss($70%)at low temperature ranges(220–280 C)indicate that deprotonated PANI chains in KGM-1are susceptible for degradation to result in low-molecular-weight fragments.The weight loss ($5%)between410and540 C informs the decomposition of residual PANI units in KGM-1(neutralized).Thermograms of calcined KGM-1(curve c)do not show any significant weight changes upto600 C.This reveals that KGM-1is con-verted to silica on calcination.UV-vis spectra(Fig.4)of pristine KGM-1(curve a)and KGM-1 (neutralized)(b)are presented.Both spectra reveal the characteristic electronic bands of PANI in KGM-1.TheFIGURE1(A)Low-angle XRD pattern of KGM-1. Inset:Wide-angle pattern of KGM-1.(B)HRTEM image of KGM-1(a)and KGM-1(calcined)(b). High-magnification image of KGM-1(c)and KGM-1(calcined)(d).(e)Magnified image of the boxed area in(d).ARTICLEspectrum of KGM-1(curve a)exhibited three bands around 320,520,and 600nm.The bands around 320and 520nm are assigned to p -p *transition and polaron-p *transi-tions,respectively.The band around 600nm corresponds to transition from the p state of undoped PANI chains.For the pristine KGM-1,the peak intensity of polaronic band (520nm)is much higher than the p state of undoped PANI chains.In the UV-vis spectrum of KGM-1(neutral-ized)(curve b),the band corresponding to polaron transi-tion ($520nm)diminished in intensity and the band cor-responding to undoped state ($600nm)increased in intensity.The changes in electronic bands between KGM-1and KGM-1(neutralized)clearly revealed that PANI chains in KGM-1are dedoped by neutralization.Calcined KGM-1does not show any spectral bands in the region 300–800nm(spectrum not shown).This could be due to the loss of PANI chains in KGM-1on calcination.The N 2adsorption–desorption studies of KGM-1,KGM-1(neutralized),and KGM-1(calcined)(Fig.5)reveal the typi-cal IV-type adsorption as defined by IUPAC.49KGM-1is nano-porous as evident from N 2adsorption–desorption measure-ments.KGM-1has a pore diameter of 2.4nm,a pore volume of 1.6Â10À2cm 3/g,and a surface area of 40m 2/g.The pores are narrow,indicating that PANI is formed within silica pores as determined from Brunauer–Emmett–Teller isotherm and Barrett–Joyner–Halenda method.50,51The wider wall thickness (6.11nm)arises from the hydrolysis of silicate through three-dimensional cross-linking processes.The much higher wall thickness for KGM-1(74Å)corroborates with the higher Si:N ratio.KGM-1has a definite proportion of S,with S:N ratio as 0.36.These results corroborates with the formation of three-dimensional silica network and doped state of PANI chains in KGM-1.The conductivity (8Â10À4S/cm)of KGM-1is lower compared with conventional PANI.KGM-1exhibits H1-type narrow hysterisis loop,with a change in adsorption around P /P 0¼0.20.The surface area and pore size of KGM-1are 49m 2/g and 2.7nm,respec-tively.Calcined KGM-1exhibits the H1-type narrow hysterisis loop,characteristic of materials having uniform pores with open cylindrical geometry.52The surface area of calcined KGM-1is 640m 2/g ($16times higher than KGM-1),and the average pore size is 3.54nm.Thus,N 2adsorption features also inform that PANI is present as an uniform layer within the pores of silica and because of that the silica pores are not completely blocked.If PANI is formed heterogeneously in the cylindrical pores of silica,the channels in silica would be plugged.A broad hysterisis in N 2adsorption isotherm could be resulted.On neutralization of KGM-1,the b -NSA ions that exist as dopants to PANI units are removed.As a result,a slight increase in the surface area was noticed.However,on calcination,organic portions (PANI)of the hybridmaterialsFIGURE 2FTIR spectrum of KGM-1(a),KGM-1(neutralized)(b),and KGM-1(calcined)(c).[Color figure can be viewed in the online issue,which is available at.]FIGURE 3Thermograms of KGM-1(a),KGM-1(neutralized)(b),and KGM-1(calcined)(c).[Color figure can be viewed in the online issue,which is available at.]FIGURE 4Electronic properties of KGM-1(a)and KGM-1(neu-tralized)(b).[Color figure can be viewed in the online issue,which is available at .]JOURNAL OF POLYMER SCIENCE:PART A:POLYMER CHEMISTRY DOI 10.1002/POLAare removed,and a significant increase in surface area and pore size are observed.Nanolayer KGM-1films of defined thickness were deposited by cyclic voltammetry.CVs recorded for the layer by layer deposition of KGM-1onto ITO are presented [Fig.6(A)].The progressive increase in the peak current values at the an-odic peaks around $0.50V and $0.60V,and reduction waves at $0.40V and $0.60V,informs the continuous build up of electroactive KGM-1.The redox peaks ($0.50and 0.60V)are assigned to the reversible conversion of leuco emeraldine (LE)to emeraldine (E)and E to pernigra-niline (P)type structure of the PANI units in KGM-1.The conversion of LE to E form of PANI occurs at a much lower potential ($0.1–0.3V).However,for KGM-1,interconversion of LE to E occurs at a $0.50V.The difference is attributed to the presence of insulating silica frame work.CVs [Fig.6(A)]recorded at various potential cycles during the deposition of KGM-1film inform that the thickness of the film was around $15nm at the end of second potential cycle and gradually increased by 80–100nm per potential cycle.The film of KGM-1exhibits stable and reversible redox characteristics [Fig.6(A),inset].UV-vis spectroelectrochemical studies were performed for the film of KGM-1[Fig.6(B),inset]to investigate the electro-chromic changes of KGM-1.KGM-1film showed multiple color changes with applied potential (Table 1).Spectroelec-trochemical studies reveal that KGM-1exhibits a reversible electrochromic behavior with a change in color from yellow at À0.10V to yellow green at þ0.50V and to dark green at þ0.70V.To the best of our knowledge,this is the first reporton the electrochromic behavior of silica–PANI hybrid nano-structured material.Electrochemical characteristics [Fig.6(A)]and N 2adsorp-tion–desorption measurement (Fig.5)revealed that KGM-1could exhibit reversible redox transitions that correspond to PANI and nanoporous,respectively.These features are effec-tively used for the electro-driven loading/release of DNA or ATP [Fig.6(C)].We have recorded the fluorescence images of chromophore-tagged DNA 53by applying potentials at the film of KGM-1for probing the loading/release of DNA mole-cules (Supporting information S1).At þ0.80V,the major proportion of DNA molecules are loaded within the nano-pores of KGM-1,and the DNA molecules are rarely seen at the film surface.At þ0.80V,PANI chains linked to silica net-work exist in E state,and DNA molecules are pulled within the nanochannel of silica as the dopant.And,at the far nega-tive potential (À0.4V),majority of DNA molecules are found at the surface of ITO/KGM-1electrode because of the release of DNA from the nanochannels (Supporting information S1).Electrochemically stimulated release of ATP has been moni-tored at PANI-ATP films.54Results indicated that ATP mole-cules loaded within films of CPs leached out to the environ-ment (medium).However,the rigid silica frame work and nanoporous nature of KGM-1provide stable environment for the biomolecules.KGM-1exhibits a stable and reproducible electrochemical response for the loading/release of DNA.In the absence of KGM-1film,the DNA molecules are found throughout the surface of ITO electrode irrespective of the applied potentials.Further,we hypothecate that the DNA-loaded KGM-1could be conjugated with othertargetingFIGURE 5(A)Nitrogen adsorption–desorption isotherm for KGM-1(a),KGM-1(neutralized)(b),and KGM-1(calcined)(c).(B)Pore size distribution of KGM-1(a),KGM-1(neutralized)(b),and KGM-1(calcined)(c).ARTICLE。