Eco-Environmental Vulnerability Evaluation in the Yellow River Basin, China
- 格式:pdf
- 大小:772.76 KB
- 文档页数:12
第11卷 第2期中 国 地 质 调 查Vol.11 No.22024年4月GEOLOGICALSURVEYOFCHINAApr.2024doi:10.19388/j.zgdzdc.2024.02.12引用格式:刘淼,刘义,苗志加,等.沁河流域上游沁源县生态地质脆弱性评价与分区[J].中国地质调查,2024,11(2):97-107.(LiuM.LiuY,MiaoZJ,etal.EcologicalgeologicalvulnerabilityassessmentandzoningofQinyuanCountyintheupperreachesofQinheRiverBasin[J].GeologicalSurveyofChina,2024,11(2):97-107.)沁河流域上游沁源县生态地质脆弱性评价与分区刘淼1,2,3,刘义1,2,3,苗志加2,许凯然1,2,史佩东1,2(1.中国地质调查局廊坊自然资源综合调查中心,河北廊坊 065000;2.河北地质大学,河北省高校生态环境地质应用技术研发中心,河北石家庄 050031;3.中国地质大学(北京),北京 100083)摘要:沁河流域作为黄河中游重要支流,研究其生态保护修复工作对黄河流域实现高质量发展具有重要意义。
根据生态地质调查工作成果,选取了地质背景和自然环境相关的11项影响沁源县生态地质脆弱性的主要因素,构建了评价指标体系,利用地理信息系统,采用层次分析法建立的评价模型,开展了沁源县生态地质脆弱性评价与分区,对不同的生态地质脆弱性分区,提出了具有针对性的生态保护修复分类施策建议。
结果表明:沁源县生态地质轻度脆弱区域主要分布于沁河及其支流河谷,面积占比为1.1%;中度脆弱区域主要分布于王陶乡西部至灵空山镇西北部一带、郭道镇东部至法中乡北部一带,面积占比为81.16%;高度脆弱区域主要分布于县域北部王和镇—郭道镇—官滩乡一带及县域中南部李元镇—灵空山镇一带,面积占比为17.74%;无极脆弱区域。
生态环境英文Ecological EnvironmentIntroductionThe ecological environment refers to the complex system of living organisms, their interaction with one another, and their interaction with the physical environment. It encompasses the balance and harmony between various species and their habitat. The study of the ecological environment is crucial for understanding how ecosystems function and how human activities impact the natural world. This document aims to provide an overview of the ecological environment, its importance, and the threats it faces.Importance of the Ecological EnvironmentThe ecological environment plays a vital role in supporting life on Earth. It is responsible for several essential ecosystem services, including air purification, water regulation, pollination, and soil fertility. These services are fundamental for human well-being and economic development. For example, forests act as carbon sinks, absorbing greenhousegases and mitigating climate change. Wetlands play a crucial role in filtering water and preventing flooding. Furthermore, diverse ecosystems provide habitats for countless species, contributing to biodiversity and genetic resources.Threats to the Ecological EnvironmentUnfortunately, the ecological environment is facing numerous threats, primarily driven by human activities. One of the most significant challenges is habitat destruction and fragmentation. Deforestation, urbanization, and infrastructure development result in the loss of natural habitat for many species. This loss leads to a decrease in biodiversity and disrupts ecosystem functions. Additionally, pollution, including air, water, and soil pollution, poses a severe threat to the ecological environment. It not only harms wildlife but also affects human health.Climate change is another critical threat to the ecological environment. Rising temperatures, changing precipitation patterns, and extreme weather events have far-reaching impacts on ecosystems. They can cause shifts in species distribution, alter the timing of seasonal events, and lead to the extinction of vulnerable species. Furthermore, overexploitation of natural resources, such as overfishing andillegal wildlife trade, negatively impacts the ecological environment.Conservation and Restoration EffortsTo mitigate the threats to the ecological environment, conservation and restoration efforts are essential. Conservation aims to protect and manage ecosystems and species, ensuring their sustainable use for future generations. Protected areas, such as national parks and nature reserves, play a crucial role in preserving biodiversity and promoting ecological balance.Additionally, sustainable development practices are paramount. This includes adopting renewable energy sources, promoting eco-friendly agriculture practices, and implementing sustainable forestry management. Efficient waste management and reducing the use of single-use plastics also contribute to protecting the ecological environment.Restoration efforts are crucial for reversing the damage caused to ecosystems. This involves reforesting degraded areas, restoring wetlands, and rehabilitating polluted sites. Conservation organizations and governments work togetherto implement restoration projects and monitor their effectiveness.Education and Public AwarenessRaising public awareness about the importance of the ecological environment is essential for fostering a sense of responsibility and promoting sustainable lifestyles. Educational programs, public campaigns, and environmental awareness events play a crucial role in disseminating knowledge about the ecological environment and encouraging individuals to take action. Furthermore, incorporating environmental education into school curricula enables younger generations to understand the value of the ecological environment and become environmental stewards.ConclusionThe ecological environment is a complex and interconnected system that supports all life on Earth. It is essential for providing vital ecosystem services and maintaining biodiversity. However, human activities pose significant threats to the ecological environment. Protecting and restoring ecosystems, adopting sustainable development practices, and raising public awareness are necessary forensuring a healthy and sustainable environment for future generations. By taking proactive measures, we can mitigate the damage caused and preserve the ecological environment for the well-being of all species.。
Environmental protection is a global issue that has garnered increasing attention in recent years.The concept of green light in environmental protection refers to the promotion and implementation of sustainable development practices.Here is an essay on the subject:In the modern world,the pursuit of economic growth has often come at the expense of our environment.However,the tide is turning as more and more people recognize the importance of sustainable living.The term green light in the context of environmental protection symbolizes the goahead for ecofriendly practices that ensure the health of our planet for future generations.The Importance of Environmental ProtectionEnvironmental protection is crucial for maintaining the balance of ecosystems.It involves preserving natural resources,reducing pollution,and promoting biodiversity.The consequences of neglecting environmental concerns are dire,including climate change, loss of habitats,and extinction of species.Sustainable PracticesSustainable practices are the cornerstone of the green light approach.These practices include recycling,reducing waste,conserving energy,and supporting renewable energy sources.By adopting such practices,we can lessen our carbon footprint and contribute to a healthier planet.Green TechnologiesAdvancements in green technology provide innovative solutions to environmental challenges.Solar panels,wind turbines,and electric vehicles are examples of technologies that have been given the green light as they offer cleaner alternatives to traditional energy sources.Legislation and PoliciesGovernments around the world are enacting legislation and policies to support environmental protection.These measures include regulations on industrial emissions, incentives for green businesses,and education programs to raise awareness about the importance of sustainability.Individual ResponsibilityEach individual has a role to play in environmental protection.By making conscious choices such as using public transportation,reducing water usage,and supporting ecofriendly products,we can collectively make a significant impact on the environment.The Future of Environmental ProtectionThe future of environmental protection lies in the continued commitment to sustainable practices and the development of innovative solutions.As more people and organizations embrace the green light,we can hope for a cleaner,healthier,and more sustainable world.In conclusion,the green light in environmental protection is a beacon of hope for our planet.It represents the collective effort to preserve and protect our environment for the benefit of all living beings.By embracing this approach,we can ensure a brighter and greener future.This essay highlights the significance of environmental protection and the role of sustainable practices,green technologies,legislation,and individual responsibility in achieving a healthier planet.。
高考英语快速提⾼阅读能⼒之⾼频主题词块速记——生态环保类词汇【导语】近年来,生态环保话题阅读一直是高考英语出题大热点,历年来高考英语真题的语篇多涉及生物学话题/动植物话题/环境保护话题/新能源话题,所以对于词汇基础薄弱的同学来说,首要就是扩充生态环保类词汇,快速提升阅读水平。
本文以此为出发点,分类总结了热门高频词汇,以阅读的逻辑思维编排,方便同学们快速准确记忆词汇,另配有同步话题阅读练习,搭配词汇进行语境刺激,加深同学们对词汇的理解,从而脱离死记硬背式的记忆方法。
【关键词】高考高频词,快速提高阅读能力,灵活记忆单词一、生物学/生态eco system n.生态系统eco-表示“生态”eco-balance n.生态平衡eco-friendly adj.对环境友好的eco logy n.生态学eco logic al adj.生态的-al为形容词后缀bio log ist n.生物学家bio logic al生物上的creature n.生物species n.物种diversi ty n.多样性diverse adj.多样的species diversity物种多样性bacteria n.细菌generation n.代5G中的Gsoil n.土壤fertilizer n.肥料二、环境问题greenhouse effect温室效应atmosphere n.大气层/氛围emission n.排放sustainable adj.可持续的climate change气候变化vehicle n.交通工具三、物质资源substitute n.替代品storage n.存储store→stor age仓储shortage n.缺乏short→short age短缺be lacking in缺乏lacking adj.缺乏的consume v.消耗consum ption n.消耗consumer n.消耗者energetic adj.有精力的fuel n.燃料petrol/gasoline n.汽油gas n.天然气electricity n.电electronic adj.电子的(设备仪器等)electric adj.通电的material n.材料四、污染物质poisonous adj.有毒的poison→poiso nous pesticide n.杀虫剂release v.释放(气体等/未公开的资源)carbon n.碳carbon dioxide二氧化碳五、危机disappear v.消失disappear ance n.消失displace v.流离失所dis-+place没有地方survive v.存活surviv al→surviv or幸存者separate v.分隔,分离separate from population n.种群数量co exist v.共存co-表示“共同”come into existence开始形成trap v.&n.困住/陷阱potential adj.潜在的/潜能result in=contribute to导致result from=due to由于threat en v.威胁threat→threaten ed→threaten ing tough situation艰难的处境struggle v.&n.挣扎,斗争dis tribute v.分散dis-表示“否定”六、政府举措policy n.政策launch v.发布(政策)monitor v.监测/监视figure out=make sense弄清楚/使有意义explore v.探索explore→explo rationconstruct v.建设construct→construc tion reconstruct v.重建contribute v.贡献contribute to贡献/导致remove v.去除get rid of去除replace v.替代take the place of取代process n.过程,进程investigate v.调查investi gation n.调查forecast=predict v.预测harmony n.和谐degrade v.降解apply to适用于strategy n.战略restrict v.限制restric tion n.限制limit v.&n.限制limi tation n.限制prevent v.阻止七、应对方法evolve v.进化evolu tion n.进化break down分解gene n.基因gene tic adj.基因的food chain食物链food supply食物供给supply chain供应链come into effect生效efficiency n.效率efficie nt adj.有效率的productivity n.生产率produc tive adj.多产的behavi or n.行为behave v.行为表现得solution n.解决方法adaptation n.适应八、常用表达increase v.&n.增加improve v.提升grow v.增长promote v.促进decrease v.减少(不及物)decline v.衰退reduce v.减少(及物)reduc tion n.减少rapidly adv.快速地swiftly adv.快速地dramatically adv.急剧地slimly adv.稍微地steady/stable adj.稳定的estimate v.估计over estimate/under estimate v.高估/低估evaluate v.估计accurate=precise adj.精确的accuracy n.精确calculate v.计算accumulate v.累计multi ply v.乘multi-表示“多重”multiculturala vast/wide range of很大范围内的a large amount of大量的(接不可数)quantities of许多plenty of大量的plent iful adj.丰富的,众多的a great deal of大量的varieties of大量/不同种类的vary→various→variety massive大量的。
长江上游安宁河流域生态环境脆弱性遥感监测邵秋芳;彭培好;黄洁;刘智;孙小飞;邵怀勇【摘要】为了解安宁河流域生态环境脆弱性情况,以卫星遥感图像作为主要信息源,以人口密度、国内生产总值、土地利用、土壤类型、高程、坡度、气温、降水、植被指数作为评价指标,综合运用地理信息系统技术和投影寻踪算法,构建空间投影寻踪模型,进而对安宁河流域生态环境脆弱性进行评价。
以分析结果为依据,将研究区生态环境脆弱性划分为5个等级,分别是重度脆弱、中度脆弱、轻度脆弱、微度脆弱和潜在脆弱。
研究结果表明,研究区生态脆弱性整体上属中等脆弱等级。
由于生态环境保护政策的实施和地区人民对于生态环境保护意识的提高,研究区2013年相对于1993年,生态环境总体有所改善。
%In this study, the authors used satellite remote sensing image as the primary source of information while collecting additional data, and selected some indicators as assessment indexes such as population density, gross domestic product ( GDP) , land use, soil type, elevation, slope, temperature, precipitation, and vegetation index. Eco-environment vulnerability of Anning River Basin was evaluated by using the space projection pursuit model built by GIS technology and the projection pursuit algorithm. According to analytical results, eco-environmental vulnerability degrees in the study area were divided into five grades, i. e. , heavy, medium, light, slight and potential. Through analyzing the evaluation results of environmental vulnerability in 1993 and 2013, the ecological vulnerability of the study area was moderate vulnerability on the whole. Due to the enforcement of the national policy and the improvement of people’s awareness of environmental protection,the overall ecological environment was improved from 1993 to 2013 in the study area.【期刊名称】《国土资源遥感》【年(卷),期】2016(028)002【总页数】7页(P175-181)【关键词】安宁河流域;生态环境脆弱性;投影寻踪模型;地理信息系统(GIS);遥感(RS)【作者】邵秋芳;彭培好;黄洁;刘智;孙小飞;邵怀勇【作者单位】成都理工大学旅游与城乡规划学院,成都 610059;成都理工大学旅游与城乡规划学院,成都 610059;四川省地质调查院,成都 610081;四川省地质调查院,成都 610081;成都理工大学旅游与城乡规划学院,成都 610059;成都理工大学旅游与城乡规划学院,成都 610059【正文语种】中文【中图分类】TP79安宁河流域地处青藏高原向四川盆地西缘山地过渡地带,是长江上游重要生态屏障,在四川省生态安全建设中具有重要生态地位;但由于流域海拔高、自然条件差、地质构造复杂、坡陡谷深,其生态环境先天脆弱,加之矿业、水电、林业及农牧业等资源长期不合理开发和利用导致其生态屏障功能不仅未能充分发挥,相反使其成为生态环境问题突出的区域。
关于生态环境保护的六级英语作文Title: The Urgency and Significance of Ecological Environment Protection.In today's rapidly evolving world, the issue of ecological environment protection has become increasingly crucial. With the escalating global concern for climate change, biodiversity loss, and environmental pollution,it's high time we recognized the urgency and significance of safeguarding our fragile ecosystem.To begin with, let's delve into the current state of our environment. The rampant industrialization and urbanization have led to a significant rise in greenhouse gas emissions, resulting in global warming and its catastrophic consequences. The melting of polar ice caps, rising sea levels, and the increasing severity of natural disasters are just a few examples of the consequences we are facing. Moreover, the unchecked exploitation of natural resources has led to the depletion of forests, wetlands,and other crucial habitats, posing a threat to biodiversity.The ecological imbalance caused by these anthropogenic activities has not only affected the natural world but also our own health and well-being. Air pollution, water scarcity, and soil degradation are just a few of the many challenges we face. These environmental issues have adirect impact on our health, food security, and economic development.In light of these challenges, it's essential to implement sustainable development strategies thatprioritize environmental protection. Governments, businesses, and individuals must work together to create a sustainable future. One of the key steps.。
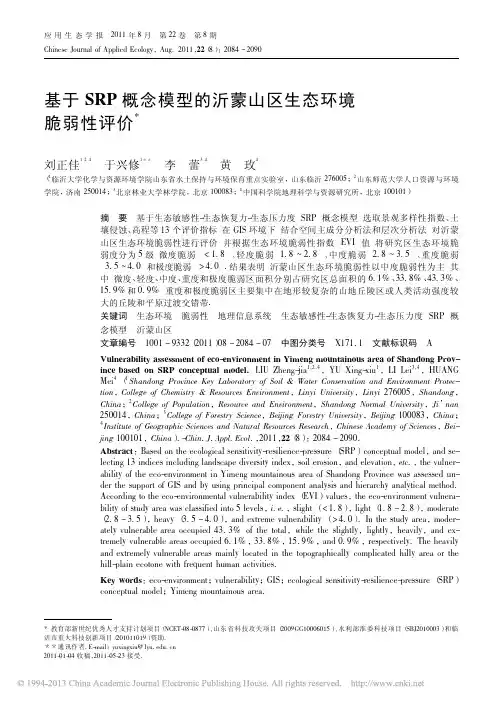
应用生态学报2011年8月第22卷第8期Chinese Journal of Applied Ecology,Aug.2011,22(8):2084-2090基于SRP概念模型的沂蒙山区生态环境脆弱性评价*刘正佳1,2,4于兴修1**李蕾3,4黄玫4(1临沂大学化学与资源环境学院山东省水土保持与环境保育重点实验室,山东临沂276005;2山东师范大学人口资源与环境学院,济南250014;3北京林业大学林学院,北京100083;4中国科学院地理科学与资源研究所,北京100101)摘要基于生态敏感性-生态恢复力-生态压力度(SRP)概念模型,选取景观多样性指数、土壤侵蚀、高程等13个评价指标,在GIS环境下,结合空间主成分分析法和层次分析法,对沂蒙山区生态环境脆弱性进行评价,并根据生态环境脆弱性指数(EVI)值,将研究区生态环境脆弱度分为5级:微度脆弱(<1.8)、轻度脆弱(1.8 2.8)、中度脆弱(2.8 3.5)、重度脆弱(3.5 4.0)和极度脆弱(>4.0).结果表明:沂蒙山区生态环境脆弱性以中度脆弱性为主,其中,微度、轻度、中度、重度和极度脆弱区面积分别占研究区总面积的6.1%、33.8%、43.3%、15.9%和0.9%,重度和极度脆弱区主要集中在地形较复杂的山地丘陵区或人类活动强度较大的丘陵和平原过渡交错带.关键词生态环境脆弱性地理信息系统生态敏感性-生态恢复力-生态压力度(SRP)概念模型沂蒙山区文章编号1001-9332(2011)08-2084-07中图分类号X171.1文献标识码AVulnerability assessment of eco-environment in Yimeng mountainous area of Shandong Prov-ince based on SRP conceptual model.LIU Zheng-jia1,2,4,YU Xing-xiu1,LI Lei3,4,HUANGMei4(1Shandong Province Key Laboratory of Soil&Water Conservation and Environment Protec-tion,College of Chemistry&Resources Environment,Linyi University,Linyi276005,Shandong,China;2College of Population,Resource and Environment,Shandong Normal University,Ji’nan250014,China;3College of Forestry Science,Beijing Forestry University,Beijing100083,China;4Institute of Geographic Sciences and Natural Resources Research,Chinese Academy of Sciences,Bei-jing100101,China).-Chin.J.Appl.Ecol.,2011,22(8):2084-2090.Abstract:Based on the ecological sensitivity-resilience-pressure(SRP)conceptual model,and se-lecting13indices including landscape diversity index,soil erosion,and elevation,etc.,the vulner-ability of the eco-environment in Yimeng mountainous area of Shandong Province was assessed un-der the support of GIS and by using principal component analysis and hierarchy analytical method.According to the eco-environmental vulnerability index(EVI)values,the eco-environment vulnera-bility of study area was classified into5levels,i.e.,slight(<1.8),light(1.8-2.8),moderate(2.8-3.5),heavy(3.5-4.0),and extreme vulnerability(>4.0).In the study area,moder-ately vulnerable area occupied43.3%of the total,while the slightly,lightly,heavily,and ex-tremely vulnerable areas occupied6.1%,33.8%,15.9%,and0.9%,respectively.The heavilyand extremely vulnerable areas mainly located in the topographically complicated hilly area or thehill-plain ecotone with frequent human activities.Key words:eco-environment;vulnerability;GIS;ecological sensitivity-resilience-pressure(SRP)conceptual model;Yimeng mountainous area.*教育部新世纪优秀人才支持计划项目(NCET-08-0877)、山东省科技攻关项目(2009GG10006015)、水利部淮委科技项目(SBJ2010003)和临沂市重大科技创新项目(201011019)资助.**通讯作者.E-mail:yuxingxiu@lyu.edu.cn2011-01-04收稿,2011-05-23接受.生态环境脆弱性是生态系统在特定时空尺度下对于外界干扰所具有的敏感反应和自恢复能力,是自然属性和人类经济行为共同作用的结果[1-2].对区域生态环境脆弱性进行评价,不仅对保护区域生态环境具有重要意义,而且对区域资源合理利用及区域可持续发展等也有重要的理论和现实意义[3].我国在脆弱生态环境研究方面的起步较晚,始于20世纪80年代,但发展较快.1996年提出的“可持续发展纲要”、2000年提出的“西部大开发战略”、2006年国家“十一五”规划纲要中提出的“国土主体功能区划”等都对脆弱生态环境的研究工作起到了很大的推动作用.经过近30年的努力,国内学者在脆弱性评价方面逐步形成了以模糊判定分析方法[4]、景观生态学方法[5-6]、人工神经网络法[7]、主成分分析法[8]、综合评价法[9]和层次分析法[10-11]等为核心知识的一系列评价方法,并取得了诸多重要的研究成果.由于研究区以及反映脆弱性角度的差异,使脆弱性评价方法以及指标体系构建尚无统一范式,因此,在脆弱性定量评价模型及参数筛选方法方面还需进一步研究.生态敏感性-生态恢复力-生态压力度(SRP)概念模型是基于生态系统稳定性的内涵而构建[12].其模型结构较全面地体现了生态脆弱性的综合方面,已在环渤海地区[13]、川西滇北农林牧交错带[14]等地区的脆弱性评价研究中有所应用.然而,在以往的研究中,存在因子筛选方法单一、权重确定方法的主观性等问题,在一定程度上限制了该模型的应用发展.沂蒙山区是北方土石山区的典型代表,具有土壤表层疏松、夹杂石砾、土层浅薄、土壤涵蓄水能力低、人口密度大的特点.生态退化成为制约该地区可持续发展的重要因素[15].虽然有学者[16-17]对该区域生态环境脆弱性研究有所涉及,但所采用的分析指标局限于反映土壤侵蚀作用下的生态质量退化,在描述复杂的生态环境脆弱特征方面不够深刻.因此,本研究以SRP概念模型为依据筛选评价指标,通过空间主成分分析法和层次分析方法确定各参评因子权重,评价了沂蒙山区的生态环境脆弱性,并揭示其空间格局特征,以期为沂蒙山区生态环境研究与保护提供科学依据.1研究地区与研究方法1.1研究区概况沂蒙山区(34ʎ23'14ᵡ—36ʎ18'38ᵡN,116ʎ40'41ᵡ—119ʎ11'36ᵡE)位于山东省中南部(图1).研究区面图1研究区位置示意图Fig.1Sketch map of location of the study area.积28804.5km2,海拔20 1156m,丘陵山地面积占70%左右,土壤以棕壤和褐土为主.该区属暖温带大陆性气候,四季分明,气候温暖.1.2数据来源及预处理分辨率为90m的2007年数字高程模型(digital elevation model,DEM)数据来自国际科学数据服务平台提供的SRTM数据产品,分辨率为1km的2000年植被分类数据和2009年土壤类型数据来自于中国科学院地理科学与资源研究所数据中心.景观多样性指数通过植被分类数据得到[18-19],计算公式如下:H=-∑mi=1Piln Pi(1)式中:H为多样性指数;Pi为景观类型i的面积百分比;m为景观类型的数目.植被覆盖度以1998—2004年各旬归一化植被指数(NDVI)求平均计算得到[20],公式如下:f=NDVI-NDVIminNDVImax-NDVImin(2)式中:f为多年旬平均植被覆盖度;NDVI为多年旬平均归一化植被指数;NDVImax、NDVImin分别为多年旬平均NDVI的最大值和最小值.高程、坡度、坡向基于DEM数据提取;土壤数据由土壤类型数据提取;气象数据(包括年均降水量、年均气温和年均相对湿度)通过气象站多年(1981—2006年)数据求平均,再利用Kriging法插值得出;1981—2006年植被净初级生产力(NPP)通过生态过程机理模型(CEVSA模型)[21-22]计算得到;研究区2000年土壤侵蚀数据利用RUSLE模型[23]计算得到;人口密度和GDP密度数据源于58028期刘正佳等:基于SRP概念模型的沂蒙山区生态环境脆弱性评价2000年全国1km栅格的人口密度和GDP密度数据.所有数据均栅格化为1km.1.3研究方法1.3.1评价指标的选择SRP模型是基于生态环境脆弱性定义的模型,该模型包括3个因子:生态敏感性、生态恢复力和生态压力度.生态敏感性因子包含地形因子、地表因子、气象因子和土壤侵蚀强度,其中,地形因子又包含高程、坡度和坡向;地表因子包括景观多样性指数、植被覆盖度、土壤类型;气象因子包括年均降水量、年均气温、年均相对湿度;土壤侵蚀强度由土壤侵蚀各因子经RUSLE模型计算后转化而来.生态恢复力指生态系统受到扰动时的自身恢复能力,与其内部结构的稳定性有关,研究中用NPP表征.生态压力度指生态系统受到外界干扰及其产生的生理效应,一般为人口活动压力和经济活动压力,分别用人口密度和GDP密度表示[13].为减少评价指标之间的相关性,避免指标重复而影响评价的精确性,本研究使用主成分分析法对初选的评价指标进行筛选.首先用ArcGIS栅格计算器对初选指标进行标准化处理,再使用GRID模块下的Makestack命令和Princomp函数完成空间主成分分析(表1).在主成分分析法中,一般选取累积贡献率大于85%的几个主成分作为计算指标.本研究选取前5个主成分作为指标对研究区生态脆弱性进行分析.主成分的计算公式如下:Fi =α1iX1+α2iX2+…+α13iX13(3)表1各主成分的特征值、贡献率和累积贡献率Table1Eigenvalues,contribution rates and accumulated contribution rates of principal components主成分Principal component特征值Eigenvalue(ˑ10-2)贡献率Contributionrate(%)累积贡献率Accumulatedcontribution rate(%)18.2731.631.62 5.0619.350.93 3.8214.665.54 3.5713.679.25 1.69 6.585.66 1.02 3.989.5 70.78 3.092.5 80.68 2.695.1 90.55 2.197.2 100.45 1.798.9 110.160.699.5 120.070.399.8 130.060.2100式中:Fi为第i主成分;α1i,…,α13i分别为第i主成分各因子对应的特征向量(表2);X1为年均温度;X2为土壤类型;X3为坡度;X4为年均降水量;X5为人口密度;X6为NPP;X7为景观多样性指数;X8为年均相对湿度;X9为GDP密度;X10为土壤侵蚀强度;X11为高程;X12为坡向;X13为植被覆盖度.由表2可以看出,第1主成分中,景观多样性指数、年均温度的贡献较大,可以看作景观多样性指数、年均温度共同反映生态环境脆弱性的综合指标;第2主成分中,土壤类型的贡献较大,远超过了其他指标,可以单独看成是土壤因素的影响;第3主成分中,土壤侵蚀强度的贡献较大,其次是坡向,可将其看成是反映土壤侵蚀强度和坡向的综合指标;第4主成分中,高程贡献较大,将高程作为该主成分的评价指标;第5主成分中,植被覆盖和GDP密度的贡献远超过其他指标,可将其作为反映植被覆盖和GDP的综合指标.1.3.2指标量化分级在ArcGIS中,利用Reclassify 函数,采用Natural Breaks(Jenks)法把主成分分析后的综合指标再各分为5级.第1主成分中,景观多样性指数和年均温度是主要因素,所以按数值由大到小分为1 5级;第2主成分中,根据土壤可蚀性大小顺序(华北地区典型土壤类型K值[24]:石质土为0.23、沙土为0.29、棕壤为0.31、褐土为0.32、潮土为0.34),土壤类型数值由大到小分为1 5级;第3表2各主成分对应的特征向量Table2Eigenvectors of the principal components特征向量Eigenvector主成分Principal component12345α10.46-0.03-0.100.470.03α2-0.050.98-0.030.02-0.01α30.04-0.130.000.000.00α40.08-0.06-0.030.10-0.01α50.140.02-0.25-0.460.11α6-0.360.010.070.31-0.08α7-0.59-0.100.04-0.22-0.13α80.14-0.01-0.310.15-0.02α90.380.030.44-0.05-0.50α100.090.020.640.050.38α11-0.27-0.02-0.110.610.05α120.160.00-0.46-0.05-0.10α130.080.00-0.04-0.070.75a1 a13:年均温度、土壤类型、坡度、年均降水量、人口密度、NPP、景观多样性指数、年均相对湿度、GDP密度、土壤侵蚀强度、高程、坡向、植被覆盖度的特征向量Eigenvector of annual average temperature,soil type,slope,annual average precipitation,population density,NPP,landscape diversity index,annual average relative humidity;GDP densi-ty,soil erosion intensity,elevation,slope aspect,vegetation coverage.6802应用生态学报22卷表3综合指标等级Table 3Level of aggregative indicator等级Level 主成分Principal component1234510.24 0.690.62 0.95-0.60 -0.28-0.20 0.120.37 0.7420.00 0.240.42 0.62-0.28 -0.150.12 0.220.25 0.373-0.14 0.000.31 0.42-0.15 -0.010.22 0.320.14 0.254-0.31 -0.140.06 0.31-0.01 0.130.32 0.460.01 0.145-0.66 -0.31-0.17 0.060.13 0.840.46 0.84-0.52 0.01主成分中,以土壤侵蚀为主,其数值由大到小分为5 1级;第4主成分中,以高程为主,其数值由大到小分为5 1级;第5主成分中,以GDP 和植被覆盖为主,其数值由大到小分为1 5级(表3).1.3.3指标权重的确定本研究采用层次分析法(AHP )确定综合评价指标的权重[25].首先,根据前5个主成分的贡献率,确定各主成分之间的重要性.依据层次分析法的重要性标度方法及表1中的累积贡献率,对各主成分的评比给出数量标度,并得到5个主成分的两两对应关系.然后,在Excel 软件中通过AHP 计算出主成分1 5的权重分别为0.48、0.21、0.12、0.12、0.07.最后进行一致性检验,检验结果为随机一致性比率(CR )=0.01<0.1,具有满意的一致性,表明各指标权重的计算结果合理.1.3.4脆弱性评价根据各评价指标及其权重,参照Wang 等[26]提出的脆弱生态环境定量评价方法,建立沂蒙山区生态环境脆弱性评价的数学模型,计算研究区每个像元的脆弱性指数,计算公式如下:EVI =∑ni =1w i f i (4)式中:EVI 为生态环境脆弱性指数;w i 为评价指标的权重;f i 为评价指标的等级.2结果与分析2.1沂蒙山区生态环境脆弱性分级沂蒙山区生态环境脆弱性指数(EVI )值在1.0 4.6,平均值为(2.97ʃ0.65)(图2).其中,1.8、2.8、3.5和4.0是频率分布较多的4个EVI 值[26],依据这4个EVI 值将研究区生态脆弱性分为5级:微度脆弱(<1.8)、轻度脆弱(1.8 2.8)、中度脆弱(2.8 3.5)、重度脆弱(3.5 4.0)和极度脆弱(>4.0).各分级具有以下特征,微度脆弱:生态系统稳定、多以平原为主、植被状况较好;轻度脆弱:生态系统相对稳定、低矮丘陵面积较大、植被状况较好;中度脆弱:多为丘陵平原或山地丘陵交错带、人口密度较大、生态系统相对不稳定且抗干扰性较差;重度脆弱:主要分布在山区或人口密度较大的平原地区、生态系统不稳定、抗干扰性差、土壤侵蚀较严重;极度脆弱:生态系统不稳定、抗干扰性差、土壤侵蚀严重、工业污染影响严重.2.2沂蒙山区生态环境脆弱性的空间分布沂蒙山区生态环境脆弱性以中度脆弱为主,总体的脆弱性较高(表4).该区93.9%的地区具有不同程度的脆弱性,中度和中度以上脆弱区的面积比例为60.1%,轻度、中度和重度脆弱区面积比例较大,分别为33.8%、43.3%和15.9%.生态环境微度、轻度脆弱区主要分布在沂蒙山区西部;中东部地区以中度脆弱性为主,重度和极度脆弱区主要分布在研究区北部、中部和东南部;在蒙阴县南部、费县南部和莒南县南部等区域,生态环境极度脆弱区面积较大(图3).图2沂蒙山区生态环境脆弱性指数(EVI )值的分布Fig.2Distribution of EVI values in Yimeng Mountains Area.表4沂蒙山区各生态环境脆弱等级的面积及比例Table 4Area and proportion of each eco-environmentalvulnerability level in Yimeng Mountains Area脆弱性等级Evaluation levelEVI 值EVI value 面积Area (ˑ103km 2)占总面积比例Percentage of total area微度Slight <1.8 1.76 6.1轻度Light 1.8 2.89.7333.8中度Moderate 2.8 3.512.4743.3重度Heavy 3.5 4.0 4.5915.9极度Extreme>4.00.250.978028期刘正佳等:基于SRP 概念模型的沂蒙山区生态环境脆弱性评价平原地区的生态环境脆弱性以轻度和中度为主,微度和重度次之;丘陵地区以中度脆弱性为主,轻度和重度脆弱性次之;在山地地区,重度脆弱性区域占山区总面积的比例较大,其次为中度和轻度脆弱性区域(图4).极度脆弱性地区主要集中在丘陵与山地或平原与丘陵过渡带,原因可能在于此地带内人口密度较高,人类活动强度相对剧烈,导致了生态系统的退化.2.3沂蒙山区生态环境脆弱性成因分析沂蒙山区西部、沂南县东北部和莒县西部等地的生态环境脆弱性以微度和轻度脆弱为主(图3),是研究区生态环境较好的地区,这些地区地势相对平坦,平均海拔在100m 以下,植被状况较好,生态系统稳定.这些地区生态环境较好,其原因可能与多年来实施的水土保持工程、生态修复项目和河道治理工程等措施有密切关系.蒙阴县南部、费县南部、枣庄市东北部、苍山县图3沂蒙山区生态环境脆弱度的空间分布Fig.3Spatial distribution of the eco-environmental vulnerabili-ty in Yimeng Mountains Area.Ⅰ:微度Slight ;Ⅱ:轻度Light ;Ⅲ:中度Moderate ;Ⅳ:重度Heavy ;Ⅴ:极度Extreme.下同The samebelow.图4研究区不同地貌类型的生态环境脆弱性面积分布Fig.4Distribution of eco-environmental vulnerability area in different physiognomy types of the study area.北部、莒南县南部、临沭县中东部、郯城县中东部等地是研究区生态环境极度脆弱的区域(图3).蒙阴县南部、费县南部、枣庄市东北部、苍山县北部和莒南县南部位于沂蒙山区中北部,该地区地形复杂、土层贫瘠、植被覆盖度低、经济水平落后、石漠化严重、土壤侵蚀严重,是导致该地区生态环境极度脆弱的主要原因.沂蒙山区南部虽然地形平坦,但人类活动强度较大,人口增长迅速.临沭、郯城两地的人口分别由1999年的61.28和96.45万增加到2005年的64和98.1万,近年来仍保持持续增加的趋势,加速了城镇化的进程.此外,这些地区自然生态系统类型较单一,多以农田为主,沂河、沭河两岸小型企业的工业废水及生活污水的排放等对生态系统的干扰和破坏较大.1999年,临沂市年工业废水的排放总量为10909.31ˑ104t ,2002年则达到了15223.37ˑ104t.本文主成分分析结果表明,土壤侵蚀、植被覆盖和GDP 等这些与人为活动较密切的指标[27]对生态脆弱性格局具有强烈影响.因此,人类活动影响强度的增加、经济的快速发展以及薄弱的生态环境保护意识是造成研究区部分区域生态环境极度脆弱的重要原因之一.平邑县、费县、蒙阴县、沂南县、沂水县、沂源县等地的地形较复杂,土壤侵蚀严重,加之不合理的土地利用方式,使其生态环境差异显著,故生态环境脆弱性存在明显的空间异质性.3结论以SRP 概念模型为依据,选择指标评价区域生态环境脆弱性,由于较全面地考虑了生态环境脆弱性的内涵,且结合了主成分分析和层次分析两种数学方法的优点,使研究结果更合理.然而,该方法在指标权重的确定方面还存在一些主观因素,今后应进一步改善.生态退化已成为制约沂蒙山区可持续发展的重要原因之一[16,27].缺乏持续的支持力度是生态建设和保护的最大难题,需要加大这方面的投入,还需积极引导农户调整不合理的生产方式.另外,还应加强以下几方面的工作:尽快制定水土流失与环境保育的规划,积极开展小流域综合治理工作,落实生态环境重度和极度脆弱区的退耕还林还草工作;积极调整产业结构,引进高新技术,大力发展循环经济,依靠科技兴农;积极引进和发展生态恢复技术,加快生态环境恢复的步伐;依靠GIS 和RS 技术,建立生态8802应用生态学报22卷监测和管理系统,及时掌握区域生态环境动态变化特征及未来变化趋势,以便更好地为沂蒙山区生态可持续发展服务.生态环境脆弱性格局主要受景观多样性指数、温度、土壤类型、土壤侵蚀和高程等因素影响,今后应进一步揭示上述因素对脆弱性空间分布的作用机理.致谢感谢华中农业大学马骞博士对本文提出宝贵意见.参考文献[1]Huang B-R(黄宝荣),Ouyang Z-Y(欧阳志云),Zhang H-Z(张慧智),et al.Assessment of eco-envi-ronmental vulnerability of Hainan Island,China.ChineseJournal of Applied Ecology(应用生态学报),2009,20(3):639-646(in Chinese)[2]Zhang X-N(张笑楠),Wang K-L(王克林),Zhang W(张伟),et al.The quantitative assessment of eco-environment vulnerability in Karst regions of NorthwestGuangxi.Acta Ecologica Sinica(生态学报),2009,29(2):749-757(in Chinese)[3]Bi X-L(毕晓丽),Ge J-P(葛剑平).Vegetation water conservation effect in the Jinghe River basin:An analy-sis based on topography and soil type.Chinese Journalof Ecology(生态学杂志),2009,28(1):95-101(in Chinese)[4]Ran S-H(冉圣宏),Jin J-J(金建君),Xue J-Y(薛纪渝).Assessment of vulnerable ecological regions:Theory and methodology.Journal of Natural Resources(自然资源学报),2002,17(1):117-122(in Chi-nese)[5]Lu D-A(卢冬爱),Tan S-C(谈树成),Xia J-S(夏既胜).Analysis on the ecological vulnerability of DaliCity based on its landscape pattern and sensitivity to soiland water loss.Yunnan Geographic Environment Re-search(云南地理环境研究),2009,21(2):92-96(in Chinese)[6]Liu Y-F(刘艳芬),Zhang J(张杰),Ma Y(马毅),et al.Changes of wetland landscape pattern ineastern Yellow River delta nature reserve from1995to1999.Chinese Journal of Applied Ecology(应用生态学报),2010,21(11):2904-2911(in Chinese)[7]Li S-C(李双成),Wu S-H(吴绍洪),Dai E-F(戴尔阜).Assessing the fragility of ecosystem using artificialneural network model.Acta Ecologica Sinica(生态学报),2005,25(3):621-626(in Chinese)[8]Wang SY,Liu JS,Yang CJ.Eco-environmental vulner-ability evaluation in the Yellow River basin,China.Pedosphere,2008,18:171-182[9]Fan Z-W(樊哲文),Liu M-S(刘木生),Shen W-Q (沈文清),et al.GIS-based assessment on eco-vulner-ability of Jiangxi Province.Journal of Geo-InformationScience(地球信息科学学报),2009,11(2):202-208(in Chinese)[10]Li L,Shi ZH,Yin W,et al.A fuzzy analytic hierarchy process(FAHP)approach to eco-environmental vulner-ability assessment for the Danjiangkou Reservoir area,China.Ecological Modelling,2009,220:3439-3447[11]Huang PH,Tsai JS,Lin WT.Using multiple-criteria decision-making techniques for eco-environmental vul-nerability assessment:A case study on the Chi-Jia-WanStream watershed,Taiwan.Environmental Monitoringand Assessment,2010,168:141-158[12]Liu X-W(柳新伟),Zhou H-C(周厚诚),Li P(李萍),et al.A conceptual analysis of ecosystem stability.Acta Ecologica Sinica(生态学报),2004,24(11):2635-2640(in Chinese)[13]Lu Y-L(卢亚灵),Yan L(颜磊),Xu X-G(许学工).Ecological vulnerability assessment and spatialauto-correlation analysis over the Bohai Rim Region.Resources Science(资源科学),2010,32(2):303-308(in Chinese)[14]Qiao Q(乔青),Gao J-X(高吉喜),Wang W(王维),et al.Method and application of ecological frangi-bility assessment.Research of Environmental Sciences(环境科学研究),2008,21(5):117-123(in Chi-nese)[15]Liu Q-J(刘前进),Yu X-X(于兴修).Vertical land-scape pattern on soil erosion intensity in the rocky areaof northern China:A case study in the Yimeng Moun-tainous Area,Shandong.Geographical Research(地理研究),2010,29(8):1471-1483(in Chinese)[16]Wang Y-P(王延平),Liu X(刘霞),Yao X-Y(姚孝友),et al.AHP analysis of soil and water conserva-tion ecological fragility assessment in Yimeng MountainArea of Huaihe River valley.Science of Soil and WaterConservation(中国水土保持科学),2010,8(3):20-27(in Chinese)[17]Sun X-M(孙秀美),Sun X-H(孙希华),Feng J-H (冯俊华).Sensitivity appraisal for soil erosion in theYimeng Mountainous Area.Bulletin of Soil and WaterConservation(水土保持通报),2007,27(3):84-92(in Chinese)[18]Fu B-J(傅伯杰).Landscape diversity analysis and mapping.Acta Ecologica Sinica(生态学报),1995,15(1):345-350(in Chinese)[19]Song Y-Q(宋豫秦),Cao M-L(曹明兰).Landscape ecological security assessment of Beijing City based onRS and GIS.Chinese Journal of Applied Ecology(应用98028期刘正佳等:基于SRP概念模型的沂蒙山区生态环境脆弱性评价生态学报),2010,21(11):2889-2895(in Chi-nese)[20]Li D-K(李登科),Fan J-Z(范建忠),Wang J(王娟).Change characteristics and their causes of fraction-al vegetation coverage(FVC)in Shaanxi Province.Chi-nese Journal of Applied Ecology(应用生态学报),2010,21(11):2896-2903(in Chinese)[21]Tao B(陶波),Li K-R(李克让),Shao X-M(邵雪梅),et al.Temporal and spatial pattern of net primaryproduction of terrestrial ecosystems in China.Acta Geo-graphica Sinica(地理学报),2003,58(3):372-380(in Chinese)[22]Cao M,Prince SD,Small J,et al.Remotely sensed in-terannual variations and trends in terrestrial net primaryproductivity1981-2000.Ecosystems,2004,7:233-242[23]Li X-S(李晓松),Ji C-C(姬翠翠),Zeng Y(曾源),et al.Dynamics of water and soil loss based on re-mote sensing and GIS:A case study in Chicheng Countyof Hebei Province.Chinese Journal of Ecology(生态学杂志),2009,28(9):1723-1729(in Chinese)[24]Men M-X(门明新),Zhao T-K(赵同科),Peng Z-P (彭正萍),et al.Study on the soil erodibility based onthe soil partical-size distribution in Hebei Province.Sci-entia Agricultura Sinica(中国农业科学),2004,37(11):1647-1653(in Chinese)[25]Zhou R(周锐),Li Y-H(李月辉),Hu Y-M(胡远满),et al.Protection regionalization of Houshi ForestPark based on landscape sensitivity.Chinese Journal ofApplied Ecology(应用生态学报),2009,20(3):665-672(in Chinese)[26]Wang XD,Zhong XH,Liu SZ,et al.Regional assess-ment of environmental vulnerability in the Tibetan Plat-eau:Development and application of a new method.Journal of Arid Environments,2008,72:1929-1939[27]Ma Q(马骞),Yu X-X(于兴修),Liu Q-J(刘前进),et al.Research on dynamic change of soil erosiondistribution and its controlling factors in Yimeng Moun-tainous Area of China.Scientia Agricultura Sinica(中国农业科学),2010,43(22):4652-4662(in Chi-nese)作者简介刘正佳,男,1986年生,硕士研究生.主要从事遥感和GIS在生态环境中的应用研究.E-mail:lzj7sdjn@ 126.com责任编辑杨弘0902应用生态学报22卷。
生态环境保护方面的英语English:Ecological environment protection is of vital importance for the sustainable development of human society. It involves the conservation and rational use of natural resources, the prevention and control of pollution, the protection of biodiversity, and the promotion of environmental education and awareness. To achieve these goals, it requires the joint efforts of government, industry, and individuals. The government needs to establish and enforce strict environmental laws and regulations, invest in environmental infrastructure, and promote sustainable development policies. Industries must implement cleaner production technologies, reduce emissions, and adopt eco-friendly practices. Individuals should also take responsibility for their own actions, such as reducing waste, conserving energy, and participating in environmental activities. Only through comprehensive and coordinated efforts from all sectors of society can we ensure the long-term health and vitality of our planet.中文翻译:生态环境保护对于人类社会的可持续发展至关重要。
英文作文生态环境The Importance of Ecological EnvironmentThe ecological environment is the foundation of our existence and the source of our sustenance. It encompasses the natural resources, biodiversity, and the interactions between organisms and their surroundings. The health and integrity of our ecological environment are crucial for our survival and well-being.Firstly, the ecological environment provides us with essential resources such as clean air, water, and soil. These resources are vital for our daily lives and agricultural production. Without clean air and water, our health will be severely compromised. Similarly, fertile soil is essential for growing crops and sustaining our food supply.Secondly, the ecological environment supports a diverse range of species, including plants, animals, and microorganisms. Biodiversity is crucial for the stability and resilience of ecosystems. It ensures that there are multiple species that can adapt to changes in the environment and provide essential services such as pollination, nutrient cycling, and disease control.However, the ecological environment is facing numerous threats from human activities. Deforestation, pollution, and climate change are just a few examples of the ways we are damaging our natural world. These actions have led to the loss of habitats, the extinction of species, and the degradation of ecosystems.Therefore, it is crucial that we take action to protect and restore our ecological environment. We need to adopt sustainable practices that minimize our impact on the environment. This includes reducing our carbon emissions, conserving natural resources, and promoting biodiversity. We also need to raise awareness about the importance of the ecological environment and encourage everyone to play a role in its preservation.In conclusion, the ecological environment is integral to our survival and well-being. It provides us with essential resources and supports a diverse range of species. However, it is facing numerous threats from human activities. It is our responsibility to protect and restore the ecological environment for future generations.。
Dear Editors and Reviewers,Thank you for your letter and comments on our manuscript titled “Temporal variability in soil moisture after thinning in semi-arid Picea crassifolia plantations in northwestern China” (FORECO_2017_459). These comments helped us improve our manuscript, and provided important guidance for future research.We have addressed the editor’s and the reviewers’comments to the best of our abilities, and revised text to meet the Forest Ecology and Management style requirements. We hope this meets your requirements for a publication.We marked the revised portions in red and highlighted them yellow in the manuscript. The main comments and our specific responses are detailed below:Editor:Please explain how the results in this paper are significantly different from those in Zhu, X., He, Z.B., Du, J., Yang, J.J., Chen, L.F., 2015. Effects of thinning on the soil moisture of the Picea crassifolia plantation in Qilian Mountains. Forest Research. 28, 55–60.)Response:We apologize for our earlier lack of clarity about the differences between our study and those in “Zhu, X., He, Z.B., Du, J., Yang, J.J., Chen, L.F., 2015. Effects of thinning on the soil moisture of the Picea crassifolia plantation in QilianMountains. Forest Research. 28, 55–60”(named “previous article” below). Specifically, we found three main differences in the temporal variability and hydrological responses of soil moisture between our study and the “previous article”.First, the scope of data analysis and use were different:T he “previous article”just applied the one growing season data (from June 28th to October 25th 2013) from the natural forest and the plantations with no thinning and thinned in 20% intensity. In addition, the “previous article” also has not considered the effect of 40% thinning on the soil moisture of the Picea crassifolia plantation. However, in the present study, we applied four years data (from June 27th2012 to October 30th2015 in HD and NF; from January 1th 2014 to October 29th 2015 in MD and LD) from the natural forest and the plantations with no thinning, thinned in 20%, and thinned in 40% intensity to analysis the temporal variability and hydrological responses of soil moisture in semi-arid Picea crassifolia plantations in northwestern China.Second, the content of the research was different: The “previous article”only considered the spatial and temporal dynamic changes of soil moisture, but did not involve the inter-annual, and seasonal dynamic changes of the soil moisture. In the present study, however, not only did we considered the effects of thinning on the spatial and temporal dynamic changes,the inter-annual changes, and seasonal dynamic changes of the soil moisture; but we also considered the changes in soil hydrological response after thinning.Our goals were to understand the changes in soil hydrological response and soil moisture dynamics, and to determine whether thinning management can effectively improve the state of soil moisture in the subalpine Piceacrassifolia plantations in the Qilian Mountains.Third, the research purpose and the result were also different: The mainly purpose of the “previous article”was to preliminary explore the thinning on the plantation forest soil moisture, and they found that the intermediate thinning can significantly increase soil moisture content at the depth of 60 cm. However, they didn’t point out that which or what the thinning intensity or plantation density can be benefit to sustainability of planted forests in these water-limited regions. In this study, not only we did confirmed that the intermediate thinning can significantly increase soil moisture content at the deep soil layer, but we also found that high planting density was the main cause of severe soil moisture deficits in the long-term, and it could be mitigated by 20 - 40% thinning (~3139 trees ha-1).In addition, by investigating the effect of thinning on the soil hydrological response, we found that soil hydrological response may be temporarily modified by thinning according to changes in canopy structure, precipitation properties, and antecedent soil moisture conditions. Soil moisture in natural forest rapidly infiltrated into deep soil, which greatly improved the efficiency of precipitation use. Thinning significantly increased the capacity for soil infiltration, and moderate thinning intensity may be conducive to deep soil-water recharge. Further, according to the global circulation prediction models and trend analysis results and weather patterns, deep VSWC may increase if precipitation patterns shift to produce larger but less frequent rainfall events during the growing season, and this change will benefit growth of the vegetation planted at higher density in this semi-arid region.Reviewer 1I found the topic very interesting. The scientific (experimental) set-up is valid and the data is presented clearly, and analyzed in detail. My detailed comments are all in the attached pdf-file.Response: Thank you for your encouraging remarks and valuable comments. We corrected our text according to your comments submitted in the attached pdf-file. Our responses to your comments are as follows:Comments in attached pdf-file1. Keywords: maybe re-consider “Rainfall”Response:We fully agree that it is necessary to re-consider “Rainfall”in the Keywords section. In addition, the statement of “Rainfall” was corrected as “Soil hydrological response” (L31).2. Ln. 37: Expand, i.e. why are these specific regions water-limited.Response: We apologize for our earlier lack of clarity. To increase clarity, we havere-written this sentence accordingly, and we have corrected “Grassland afforestation is critical in efforts to prevent wide-spread land degradation in arid and semi-arid regions of China (Chen et al., 2008a; Yang et al., 2014). However, sustainability of planted forests is severely limited by soil moisture conditions. Soil moisture is fundamental to sustainability in water-limited ecosystems (Newman et al., 2006; Yang et al., 2014).” as “Grassland afforestation is critical in efforts to prevent wide-spread land degradation in arid and semi-arid regions of China (Chen et al., 2008a; Yang et al., 2014), where rainfall is the main source of soil moisture, and where many vegetation restoration projects were implemented (Li, 2004). However, soil moisture is the most crucial factor to sustainability of planted forests in these water-limited ecosystems (Newman et al., 2006; Yang et al., 2014). (L35-40)”.3. Ln. 47: What is meant by “statistical moments of soil moisture, such as mean and variance”?Response: It is meant that changes to canopy structure due to large-scale clearings or intermediate disturbance events may lead to changes in the mean and the variance of the soil moisture. We amended our text to clarify, and now it reads: “Changes to forest canopy structure due to large-scale harvesting may lead to changes in soil properties, residual tree growth, and the mean and the variance of the soil moisture (Chen et al., 1993; Olchev et al., 2009; He et al., 2013; Kaarakka et al., 2014).” (L48-51).4. Ln. 60: add “ecosystems” (instead of cosystem)Response:The statement of “cosystem” was corrected as “ecosystems” (L62).5. Ln. 68: change “determining” to “affecting”Response:The statement of “determining” was corrected as “affecting” (L71).6. Ln. 71: Expand this sentence a bit. Growing season –where? At the studied region/area?Response: To increase clarity, we have re-written this sentence accordingly (L71-75). And our studied region/area is also experiencing this precipitation patterns, with larger but less frequent rainfall events during the growing season, and more frequent extreme hydrological events.7. Ln. 74–80: Heisler-White, He et al. and Sun et al. →showed where, in what type of ecosystem, how does it relate to the studied one, i.e. elaborate more on how these studies relate to the current one.Response:That was an excellent suggestion, and we have made revisions according to your comments (L78-80, L83, L85-86).The study of Heisler-White et al. (2008)provides a background knowledge of the supply of the precipitation on soil profile. The studies of He et al. (2012) and Sun et al. (2015)investigated the soil moisture dynamics of typical ecosystems (forestland, shrubland, grassland, and meadows) in response to precipitation, which can provide a reference for our research.提供背景知识,了解降水对土壤的补给情况;He et al. and Sun et al.的研究研究了祁连山天然植被(林地、草地和灌丛)的土壤水分情况,是本文章研究的基础。
怎样应对环境变化英语作文Title: Strategies for Adapting to Environmental Changes。
In today's rapidly changing world, environmental changes pose significant challenges to individuals, communities, and nations. Whether it's climate change, pollution, or natural disasters, adapting to these changesis crucial for our survival and sustainable development. Here are some strategies to effectively cope with environmental changes:1. Raise Awareness: Increasing public awareness about environmental issues is essential. Through education, campaigns, and media, people can better understand the causes and impacts of environmental changes. This awareness encourages individuals to take proactive steps to mitigate their environmental footprint and support policies aimed at addressing these issues.2. Implement Sustainable Practices: Adoptingsustainable practices in daily life is key to minimizing environmental impacts. This includes reducing energy consumption, conserving water, practicing waste reduction and recycling, and choosing eco-friendly products. By making these small changes, individuals contribute to a healthier planet and reduce their vulnerability to environmental changes.3. Promote Green Technologies: Investing in and promoting green technologies can help mitigate the effects of environmental changes. Renewable energy sources such as solar, wind, and hydroelectric power offer cleaner alternatives to fossil fuels, reducing greenhouse gas emissions and air pollution. Additionally, advancements in technology can improve resource efficiency and enhance resilience to environmental hazards.4. Support Environmental Policies: Advocating for and supporting policies that protect the environment is crucial at both local and global levels. Governments play a vital role in implementing regulations, incentives, andinitiatives to address environmental challenges. Byparticipating in advocacy efforts, individuals can influence decision-makers to prioritize sustainability and allocate resources to environmental protection.5. Build Resilience: Developing resilience to environmental changes is essential for communities and societies. This involves implementing measures such as disaster preparedness, infrastructure improvements, and land-use planning to minimize risks and enhance adaptive capacity. Building resilient communities ensures they can withstand and recover from environmental shocks more effectively.6. Foster International Cooperation: Environmental challenges transcend borders, requiring collective action on a global scale. International cooperation and collaboration are essential for addressing issues like climate change, biodiversity loss, and pollution. By working together, nations can share knowledge, resources, and technology to tackle environmental problems more effectively.7. Adaptation and Innovation: Embracing adaptation and innovation is critical in navigating uncertain environmental futures. This includes developing new technologies, practices, and strategies to adapt to changing environmental conditions. Innovation drives progress in sustainability and enables societies to thrive in the face of environmental challenges.In conclusion, adapting to environmental changes requires a multifaceted approach involving awareness, sustainable practices, technological advancements, policy support, resilience building, international cooperation, and innovation. By implementing these strategies, individuals and communities can mitigate the impacts of environmental changes and move towards a more sustainable and resilient future.。
生态系统脆弱性评价技术指南英文回答:Assessing the vulnerability of ecosystems is crucial for understanding their resilience and capacity to withstand disturbances. There are various techniques and guidelines available to evaluate ecosystem vulnerability, and it is important to choose the most appropriate ones based on the specific characteristics of the ecosystem being studied.One commonly used technique is the Vulnerability Assessment and Resilience Index (VARI), which integrates various indicators such as species diversity, habitat fragmentation, and ecosystem services to assess the vulnerability of an ecosystem. By analyzing these indicators, researchers can identify the key factors contributing to the vulnerability of an ecosystem and develop strategies to mitigate them.Another important aspect of ecosystem vulnerability assessment is the consideration of both natural and human-induced factors. For example, climate change cansignificantly impact the vulnerability of ecosystems by altering temperature and precipitation patterns, leading to shifts in species distribution and habitat loss. Human activities such as deforestation, pollution, and overexploitation of resources can also increase the vulnerability of ecosystems by degrading their natural habitats and reducing biodiversity.In my experience, I have used these techniques toassess the vulnerability of a mangrove ecosystem in Southeast Asia. By analyzing factors such as sea level rise, land use change, and pollution levels, we were able to identify the most vulnerable areas within the ecosystem and prioritize conservation efforts. This information wascrucial for developing sustainable management strategies to protect the mangrove ecosystem and ensure its long-term resilience.Overall, ecosystem vulnerability assessment is acomplex and multidisciplinary process that requires a combination of scientific knowledge, data analysis, and stakeholder engagement. By using the right techniques and guidelines, researchers can effectively evaluate the vulnerability of ecosystems and take proactive measures to protect them for future generations.中文回答:评估生态系统的脆弱性对于了解其韧性和抵御干扰的能力至关重要。
Ecological Environment: Our SharedResponsibilityIn the 21st century, the ecological environment has become a global concern. With the rapid pace of industrialization and urbanization, the natural world is facing unprecedented challenges. Climate change, pollution, deforestation, and loss of biodiversity are among the many issues that threaten the sustainability of our planet. It is crucial that we, as individuals and communities, take action to protect and restore the ecological environment. The first step towards achieving this goal is to raise awareness about the importance of environmental conservation. Education and public outreach programs can help instill a sense of responsibility towards nature. By understanding the intricacies of the ecosystem and the role of each species, we can appreciate the value ofbiodiversity and the need to conserve it.Moreover, we must adopt sustainable practices in our daily lives. Simple actions like reducing water waste, conserving energy, and using eco-friendly products can significantly reduce our carbon footprint. Encouraging theuse of renewable energy sources like solar and wind power can also contribute to a greener future.Governments and international organizations must play a pivotal role in environmental protection. Stringent environmental laws and policies can help mitigate the impact of industrial activities on the environment. International cooperation is also crucial in addressing global environmental challenges like climate change.Businesses also have a responsibility to operate sustainably. Adopting green business practices can not only reduce environmental degradation but also lead to cost savings and enhanced brand reputation. Companies can invest in clean technology, implement resource-efficient production methods, and encourage employees to participate in environmental conservation initiatives.In conclusion, protecting the ecological environment is a shared responsibility that requires the collective effort of individuals, communities, governments, businesses, and international organizations. By raising awareness, adopting sustainable practices, enacting environmental laws, andencouraging green business practices, we can ensure a sustainable future for ourselves and the planet.**生态环境:我们共同的责任**21世纪,生态环境已成为全球关注的焦点。
八年级下册英语6单元笔记Unit 6: Environmental protectionI. Vocabulary1. Pollution (n) - the presence in or introduction into the environment of a substance or thing that has harmful or poisonous effects2. Environment (n) - the surroundings or conditions in which a person, animal, or plant lives or operates3. Global warming (n) - a gradual increase in the overall temperature of the earth's atmosphere generally attributed to the greenhouse effect caused by increased levels of carbon dioxide4. Renewable energy (n) - energy from a source that is not depleted when used, such as wind or solar power5. Deforestation (n) - the action of clearing a wide area of trees6. Endangered species (n) - a species of animal or plant that is seriously at risk of extinction7. Eco-friendly (adj) - not harmful to the environmentII. Grammar1. Present Perfect Tense- Form: have/has + past participle- Use: for actions that happened at an unspecified time in the pastExample: She has visited Paris twice.2. Passive Voice- Form: be + past participle- Use: to emphasize the action rather than the personExample: The work will be finished by Monday.III. Reading Comprehension1. Read the article about pollution and answer the following questions:- What is pollution?- How does pollution affect the environment?- What are some ways to reduce pollution?IV. Writing1. Write a paragraph about your personal efforts to protect the environment.Example: I try to reduce my carbon footprint by using public transportation instead of driving a car. I also recycle plastic, paper, and glass materials to reduce waste.V. Listening1. Listen to a conversation about renewable energy and answer the questions:- What are some examples of renewable energy sources?- What are the advantages of using renewable energy?VI. Speaking1. Discuss with a partner the importance of protecting endangered species.Example: Endangered species play a crucial role in maintaining the balance of the ecosystem. It is our responsibility to protect them from extinction.VII. Project1. Create a poster about environmental protection and present it to the class. Include information about pollution, renewable energy, deforestation, and endangered species.By studying and practicing the vocabulary, grammar, reading comprehension, writing, listening, speaking, and project activities in Unit 6, students will gain a better understanding of the importance of environmental protection and develop the skills necessary to contribute to a sustainable future.。
宁夏南部山区生态环境脆弱性评价陈红翔;赵永涛【摘要】The eco-environmental vulnerability of Ningxia south mountain areas was evaluated through establishment of eco-environmental vulnerability evaluation index system and selection of pressure-state-response ing this method,assessment unit ecological vulnerability relative score was gained for each,and grades of ecological vulnerability were gained with Arcgis software.Conclusions show that vulnerability grades of unit are mainly medium or strong values,Yuanzhou District and Longde County are medium-vulnerable regions,Jingyuan,Haiyuan,Xiji and Pengyang County belong to strong-vulnerable regions.%通过建立生态环境脆弱性评价指标体系,选择压力-状态-响应模型,对宁夏南部山区生态环境进行了定量评价,得到了各个评价单元的生态脆弱性相对强弱得分,同时运用Arcgis软件对区域的生态脆弱性进行分级.结论表明,评价单元脆弱性主要集中在强脆弱性和中脆弱性之间,其中原州区和隆德县为强脆弱区,泾源县、海原县、西吉县、彭阳县属于中脆弱区.【期刊名称】《宁夏工程技术》【年(卷),期】2011(010)003【总页数】3页(P252-254)【关键词】生态脆弱性;层次分析;数据标准化【作者】陈红翔;赵永涛【作者单位】中国科学院寒区旱区环境与工程研究所,甘肃兰州730000;宁夏大学资源与环境学院,宁夏银川750021;宁夏大学资源与环境学院,宁夏银川750021【正文语种】中文【中图分类】X826生态脆弱性评价已经成为当今全球变化与可持续发展研究中的热点问题,我国是世界上生态脆弱区分布面积最大、脆弱生态类型最多、生态脆弱性表现最明显的国家之一.加强生态脆弱区生态功能保护,增强生态环境现状的监测和管理力度,促进生态脆弱区经济和环境的和谐发展,实现人与自然的协调发展,是贯彻落实科学发展观,牢固树立生态文明观念,促进经济、社会又好又快发展的必然要求[1].按照自然地理和社会经济发展特点,宁夏分为北部引黄灌区、中部干旱带和南部山区三大区域.南部黄土丘陵区以广种薄收的粗放生产方式为主,水土流失严重,灾害频繁,生态环境十分脆弱,是宁夏最贫困的地区,也是宁夏扶贫攻坚和生态移民工作的重点区域.为了更好地了解宁夏南部山区生态环境现状,为生态移民工程的实施提供参考,本文对宁夏南部山区生态环境脆弱性进行了定量化评价.1 宁夏南部山区概况1.1 自然概况宁夏南部山区系宁夏回族自治区南部丘陵、山地、盆地的统称,一般亦称为西海固地区,包括固原市所辖的4县一区(原州区、彭阳县、西吉县、隆德县、泾源县)和中卫市的海原县(图1),总面积21 389.68 km2,占全区总面积的32%.2009年底有人口189.8万人,占全区总人口的32%,其中回族92.19万人,占本区回族人口的44%.图1 宁夏南部山区地理范围宁夏南部山区地处中国第二地势阶梯,黄土高原西部,气候与水文由半湿润向半干旱和干旱区过渡;植被由森林向干草原、荒漠草原过渡;土壤由黑垆土向灰钙土过渡;气候属温带大陆性气候类型,具有“春迟、夏短、秋早、冬长”的特征;年平均气温 5~8℃,昼夜温差大;年平均降水量200~600 mm.南部阴湿低温,北部干旱,大气降水、地表水和地下水量少质差;自然灾害种类多,且发生频繁,危害严重.1.2 社会经济概况宁夏南部山区是全国主要贫困地区之一,目前仍以自给半自给经济为主,耕作粗放,广种薄收,靠天吃饭,经济落后,产业结构单一,主要以农业生产为主.农民收入主要来源于农业,产业结构的低层次和农业生产的低效率导致区域经济发展十分缓慢,地方财政十分薄弱.2 生态环境脆弱性评价指标体系的构建2.1 指标体系的构建及权重根据科学性、综合性、主导因素、系统性、区域完整性、可操作性原则构建指标体系[2-5],采用层次分析法确定评价指标的权重[6-7](表1).表1 宁夏南部山区生态环境脆弱性评价指标体系及权重注:括号内数据为权重.指标层山地比例D1(0.4)森林盖度D2(0.4)降水量D3(0.2)平均风速D4(1.0)年均温D5(0.4)无霜期D6(0.3)>10℃积温D7(0.3)农作物面积D8(1.0)草场面积D9(1.0)人口密度D10(1.0)人均产值D11(0.3)人均水资源D12(0.3)产业结构D13(0.4)准则层水土流失敏感度C1(0.6)风力侵蚀指数C2(0.4)组织指数C3(0.7)活力指数C4(0.2)功能指数C5(0.1)人口压力C6(0.4)经济发展指数C7(0.6)分目标层生态敏感度指数B1(0.50)生态弹性度指数B2(0.25)生态压力度指数B3(0.25)总目标层生态脆弱度A2.2 指标标准化本研究采用极大值标准化法对统计数据进行标准化处理(表2).其中,与脆弱度正相关的指标见式1,与脆弱度负相关的指标见式2.Tij为各指标的标准化值;Tij,0为第i个地区第j个指标的原始值;Tij,max为第j个指标在所有地区中的极大值[6].2.3 生态脆弱性计算结果生态脆弱度指数的计算方法采用综合指数法,将生态敏感度指数(ES)、生态弹性度指数(EE)和生态压力度指数(EP)作为生态脆弱性(EF)评价的3个基本判定指标.计算公式为其中,I为指数值;Bi为指标标准值;Wi为指标权重[7].具体计算结果见表3.3 生态脆弱性综合评价在参照前人研究成果的基础上,结合研究区的情况,依据脆弱性得分将生态环境脆弱性划分为5个等级(表4)[7].计算结果表明,评价单元脆弱性主要集中在强脆弱性和中脆弱性之间,其中原州区和隆德县为强脆弱区,泾源县、海原县、西吉县和彭阳县属于中脆弱区.按照脆弱性得分从强到弱排序如下:原州区>隆德县>泾源县>海原县>西吉县>彭阳县.宁夏南部山区生态脆弱性空间分布具有以下规律:(1)大部分县区生态环境具有不同程度的脆弱性,以高度及中度脆弱度水平为主.各县区内生态脆弱度的差异更多体现了自然成因方面对生态脆弱性的作用,各县区内自然因素差异越大,则生态脆弱度的差异也就越大;反之,自然因素差异越小,则生态脆弱度在各县区内的差异也就越小.表2 宁夏南部山区各县数据标准化结果指标山地比例森林盖度降水量平均风速年均温无霜期>10℃积温农作物面积人口密度草场面积人均产值人均水资源产业结构指标与脆弱度关系正相关负相关正相关正相关负相关负相关负相关负相关正相关负相关正相关负相关正相关原州区0.830 0.724 0.605 0.828 0.724 0.129 0.1360.135 0.801 0.439 1.000 0.322 0.615西吉县0.260 0.889 0.632 0.586 0.889 0.174 0.322 0.018 0.809 0.801 0.618 1.000 0.677隆德县0.833 0.443 0.843 0.621 0.443 0.187 0.372 0.759 1.000 0.931 0.700 0.425 0.684泾源县1.000 0.000 1.000 0.862 0.000 0.148 0.372 0.891 0.618 0.934 0.685 0.627 1.000彭阳县0.330 0.676 0.543 0.483 0.676 0.000 0.000 0.534 0.574 0.621 0.7350.485 0.677海原县0.267 0.959 0.767 1.000 0.959 0.000 0.097 0.000 0.404 0.000 0.547 0.433 0.419表3 宁夏南部山区生态脆弱性评价得分指标ES EE EP EF原州区0.78 0.67 0.83 0.65西吉县0.59 0.58 0.71 0.54隆德县0.66 0.53 0.82 0.62泾源县0.70 0.64 0.73 0.57彭阳县0.50 0.64 0.66 0.52海原县0.79 0.71 0.46 0.56表4 生态脆弱性等级划分<0.2微脆弱性脆弱性得分脆弱性等级>0.8极脆弱性0.6~0.8强脆弱性0.4~0.6中脆弱性0.2~0.4轻脆弱性(2)从生态脆弱度的空间分布上看,高度脆弱区主要分布在研究区的中部,其余为中度脆弱区.这种生态脆弱度的空间分布与研究区的地形地貌分布规律具有较强的相关性,脆弱度较高区域的地貌类型以山地和丘陵为主,中等脆弱度区域的地貌类型则大多为山塬.该结果再次说明,地形地貌是形成该区域生态环境空间分异的主导因素,海拔、坡度和地貌等影响水热因子在该区域内的再分布,进而影响土壤、植被的类型与分布,并最终反映出人类在该区域内的资源开发和土地利用活动明显受到地形地貌等自然因素的控制.(3)从评价结果看,研究区内强脆弱区的隆德县生态弹性度最差,即生态恢复力差,在遭到外界干扰时不容易恢复原来的状态,原因是该区域多深谷陡坡,地形复杂,坡向多变,降雨丰沛且集中,再加上人口密度大,土地的承载力已接近饱和,造成了生态的基质性脆弱度较高,人地关系矛盾日益加剧,生态环境日益脆弱.而农田水利基础设施差,水源短缺,土壤涵养水能力低等原因都造成了研究区中部的脆弱度明显高于周围地区[8].【相关文献】[1]徐广才,康慕谊,贺丽娜,等.生态脆弱性及其研究进展[J].生态学报,2009,27(4):67-72.[2]乔青,高吉喜,王维,等.生态脆弱性综合评价方法与应用[J].环境科学报,2008,16(4):46-48.[3]戴亚南,彭检贵.江苏海岸带生态环境脆弱性及其评价体系构建[J].海洋学研究,2009,18(2):36-40.[4]杨建平,杨建平,丁永建,等.长江黄河源区生态环境脆弱性评价初探[J].中国沙漠,2007,27(6):120-124.[5]蔡海生,刘木生,李凤英,等.生态环境脆弱性静态评价与动态评价[J].江西农业大学学报,2009,31(1):19-22.[6]蔡海生,张学玲,周丙娟.生态环境脆弱性动态评价的理论与方法[J].中国水土保持,2009,36(4):91-93.[7]陶和平,高攀,钟祥浩.区域生态环境脆弱性评价——以西藏“一江两河”地区为例[J]. 山地学报,2006,24(6):761-768.[8]米文宝.西海固地区可持续发展中的生态环境问题及对策[J].中国人口·资源与环境,2000,10(3):102-106.。
美国环境技术评估指南美国这环境技术评估指南啊,我跟你说,就像一本天书,又厚又复杂。
我第一次拿到的时候,就瞅着那密密麻麻的字,感觉像一群小蚂蚁在纸上爬呢。
我在这行也混了有些年头了,啥大风大浪没见过。
可这指南,就像个捉摸不透的主儿。
我办公室那老张,眼睛都快贴到书上了,还一边看一边嘟囔:“这写的都是啥呀,比我老婆的心思还难猜。
”老张那脸皱得像个核桃,头发乱得像鸡窝,眼睛里满是疑惑和无奈。
我就寻思啊,这环境技术评估,本是个好事儿。
就像给咱这环境治病似的,你得有个好指南当药方子啊。
可这指南里那些专业术语,什么“环境影响因子量化”“生态系统服务功能评估指标体系”,听着就头疼。
我跟隔壁部门的小李聊天,小李是个刚毕业的大学生,满脑子新想法。
我就说:“小李啊,你看这指南里的这些词儿,你能明白不?”小李挠挠头说:“大哥,我在学校学过,可这指南里写得也太绕了,我都怀疑我是不是真学过。
”我在看这指南的时候,周围那环境也好像变得压抑起来。
办公室里那台老空调,呼呼地吹着热风,吹得我心里更烦。
那灯光啊,白晃晃的,照在指南上,感觉那字儿都更刺眼了。
不过呢,这指南虽然难搞,但咱也不能就这么被它难住。
我就跟我们小组的人说:“兄弟们,咱就把这指南当成一个大怪兽,咱得一点一点把它打败。
”小王就笑了,说:“哥,这怪兽可不好对付啊。
”我瞪了他一眼说:“怕啥,咱这么多人呢,一人咬它一口,也把它咬死了。
”我们就开始研究,找那些以前做过的案例来看。
有的案例里啊,那些数据就像一团乱麻,你得一根一根地理顺。
我看着那些数据,感觉自己像个侦探,要从这堆乱麻里找出真相。
有时候找着找着,发现一个新的线索,就高兴得像中了彩票似的。
可有时候呢,又走进了死胡同,那心情就像掉进了冰窟窿,拔凉拔凉的。
Pedosphere18(2):171–182,2008ISSN1002-0160/CN32-1315/Pc 2008Soil Science Society of ChinaPublished by Elsevier Limited and Science PressEco-Environmental Vulnerability Evaluation in the Yellow River Basin,China∗1WANG Si-Yuan1,2,LIU Jing-Shi1and YANG Cun-Jian31Institute of Tibetan Plateau Research,Chinese Academy of Sciences,Beijing100085(China).E-mail:w siyuan@ 2Institute of Electronics,Chinese Academy of Sciences,Beijing100080(China)3Centre of RS and GIS Applications,Sichuan Normal University,Chengdu610066(China)(Received January15,2007;revised November13,2007)ABSTRACTUsing remote sensing(RS)data and geographical information system(GIS),eco-environmental vulnerability and its changes were analyzed for the Yellow River Basin,China.The objective of this study was to improve our understanding of eco-environmental changes so that a strategy of sustainable land use could be established.An environmental numerical model was developed using spatial principal component analysis(SPCA)model.The model contains twelve factors that include variables of land use,soil erosion,topography,climate,and ing this model,synthetic eco-environmental vulnerability index(SEVI)was computed for1990and2000for the Yellow River Basin.The SEVI was classified into six levels,potential,slight,light,medium,heavy,and very heavy,following the natural breaks classification. The eco-environmental vulnerability distribution and its changes over the ten years from1990to2000were analyzed and the driving factors of eco-environmental changes were investigated.The results show that the eco-environmental vulnerability in the study area was at medium level,and the eco-environmental quality had been gradually improved on the whole.However,the eco-environmental quality had become worse over the ten years in some regions.In the study area,population growth,vegetation degradation,and governmental policies for eco-environmental protection were found to be the major factors that caused the eco-environmental changes over the ten years.Key Words:eco-environmental vulnerability,geographic information system(GIS),remote sensing(RS),spatial prin-cipal component analysis,Yellow River BasinCitation:Wang,S.Y.,Liu,J.S.and Yang,C.J.2008.Eco-environmental vulnerability evaluation in the Yellow River Basin,China.Pedosphere.18(2):171–182.INTRODUCTIONThe ecosystem of the Yellow River Basin has degraded owing to both the global change and popula-tion growth.Environmental problems,such as grassland degeneration,sandy desertification,and water erosion,have seriously affected sustainable development of the region(Ding,2003).Many studies have been conducted on eco-environment within the Yellow River Basin with a focus on part of the basin or a tributary(e.g.,Xu and Cheng,2002;Lu et al.,2003;Li et al.,2006;Zheng,2006).Studies on eco-environmental vulnerability at larger and even the basin scale are essential to understanding the patterns of land use and soil erosion and to formulating measures for the management of the entire basin.However,studies on eco-environmental vulnerability taking the basin as a whole were very few.The term vulnerability is used differently in many contexts,from medicine to poverty and deve-lopment literature.In eco-environmental studies,the concept of vulnerability is often derived from the social sciences,but there is no general agreement of how to define vulnerability in an environmental impact assessment(Kvarner et al.,2006).The general definition from the IPCC(2001),i.e.,the degree to which a system is susceptible to,or unable to cope with,adverse effects of climate changes,including climate variability and extremes,is useful because this definition includes both the traditional elements ∗1Project supported by the National Key Basic Research Support Foundation of China(973Program)(No.2005CB422003) and the National Natural Science Foundation of China(No.40571037).172S.Y.WANG et al. of an impact assessment(i.e.,potential impacts of a system to exposures),and adaptive capacity to cope with the potential impacts of global changes(Turner et al.,2003).Assessment of vulnerability is important as it enables identification of areas or resources at risk,and the threats posed by the diminution or loss of such resources that will threaten future sustainable development.How to effectively analyze the eco-environmental vulnerability is critical to geographical and eco-environmental management over a basin.Though it is a relatively new research area,eco-environmental vulnerability trend evaluation has been developed rapidly in recent years and may provide useful in-formation about ecological and environmental background information for environmental restoration. Investigators have developed many methods for such studies,such as comprehensive evaluation method (Li et al.,2005),indices weight method(IWM)(Li et al.,2001),and analytical hierarchy process(AHP) (Klungboonkrong and Taylor,1998;Li et al.,2005).However,these methods depend on experts’evalu-ation to weigh the importance of factors,and the level of experts influences thefinal evaluation results directly.For example,the AHP method needs to establish a weight system so that the comprehensive function for eco-environment can be effectively assessed.Determining the weight of each index is very important for the assessment.Recently,remote sensing(RS)and geographic information system(GIS)have been used as powerful tools for geo-environmental evaluation in support of land use planning.Satellite images are especially valuable because they provide frequently updated maps in inaccessible areas or areas that contain rapidly changing landforms(Chuvieco,1999).Satellite remote sensing provides multi-spectral and multi-temporal data that can be used to quantify the type,amount,and location of land use changes (Liu and Buheaosier,2000;Honnay et al.,2003).Most recently,satellite remote sensing has often been integrated into a GIS.The integration of RS with GIS provides an excellent framework for data capture, storage,synthesis,measurement,and analysis,all of which are essential to eco-environmental analysis (Anthony and Li,1998).In order to provide an objective result for eco-environmental vulnerability evaluation,a new environmental numerical evaluation model was developed and applied using RS and GIS in this study.Under the support of RS and GIS,the study took the whole basin as an integrated system.The objectives of this study were to:1)develop an environmental numerical evaluation model supported by GIS,2)to establish a synthetic eco-environmental vulnerability index(SEVI)using spatial principal component analysis(SPCA),and3)to analyze spatial distribution and temporal changes of eco-environmental vulnerability.MATERIALS AND METHODSStudy areaThe Yellow River is the second largest river in China and originates in the northern part of the Bayankala Mountains in Qinghai Province.It is5464km long,andflows through seven provinces, Qinghai,Sichuan,Gansu,Shaanxi,Shanxi,Henan,and Shandong,and two autonomous regions,Ningxia and Inner Mongolia(Yang et al.,1999).Its annual runoffis about688×108m3,59%of which comes from the upper reaches and33%from the middle reaches,the Loess Plateau.About90%of the sediment in the Yellow River originated from the soil erosion on the Loess Plateau.The Yellow River Basin, located in the northwestern part of China,extends about10degrees of latitude(32–42◦N)and23 degrees of longitude(96–119◦E),with a total area of more than794000km2and a population of107 million.Climate of the basin is characterized by continental monsoon with annual average temperature of1–8◦C in northwest and12–14◦C in southeast.Annual precipitation ranges from300mm in northwest to700mm in southwest.Most of the basin is located in temperate semi-arid zones.Due to its unique geological and geomorphologic characteristics,major social and environmental challenges of this basin include easily erodable sediment,severe rainstorm events,rapid population increase,irrational land use, and the highest soil erosion rate in the world.ECO-ENVIRONMENTAL VULNERABILITY EVALUATION173Data acquisition and standardizationThere are many factors that affect eco-environmental quality,including natural factors and human factors.It is important and essential to select appropriate factors for eco-environmental evaluation. Investigators have used many factors in eco-environmental evaluation studies(Giaoutzi and Nijkamp, 1993;Molden and Billharz,1997),with land use/land cover and soil erosion being most frequently used(IGBP,1993;Selman,1996).It is true that land is a key resource for human activities and en-vironmental changes are deeply embedded in how land is used,especially in agricultural regions.In order to synthetically analyze eco-environmental vulnerability in the Yellow River Basin,twelve factors were initially selected after the observation of afield work by considering the climate condition,land use/land cover,soil and water losses,terrain and physiognomy situation in the basin,including land use/land cover,soil erosion,climate factors,and topography factors.Based on the analysis,the eco-environmental factors of the Yellow River Basin were divided into three groups:land resource conditions, water-heat meteorological conditions,and topographical conditions(Table I).It should be noted that this selection was not exhaustive,and that only those salient factors for which information is of great significance were considered.Although interrelated,each factor had a different role in eco-environmental development.For example,land use,soil erosion,and vegetation cover may be more important in pro-TABLE IFactors used in assessing eco-environmental vulnerability in the Yellow River BasinGroup Factor Value Definition and major impact on eco-environment Data acquisitionLand Land use Land use/land cover over land surfaces Interpreted from Landsat resource thematic mapper(TM)images conditions Soil erosion Soil erosion by rainfall over a period of time,Interpreted from Landsatwhich influences plant growth and eco-envi-TM imagesronmental changesNormalized0–255Vegetation cover over land surfaces Calculated from nationaldifference oceanographic and atmosphericvegetation administration-advancedindex very high resolution(NDVI)radiometer)(NOAA/AVHRR)imagesWater-heat Average−10–25◦C Annual average temperature,which influences Observed and calculated by meteo-temperature plant spatial distribution weather stationsrological>10◦C0–5300Annual accumulated temperature for days with Observed and calculated by conditions accumulated average temperatures≥10◦C,which strongly weather stations temperature influences plant growth>0◦C0–9000Annual accumulated temperature for days with Observed and calculated byaccumulated average temperatures≥0◦C,which strongly weather stationstemperature influences plant growthAverage0–1600mm Annual average precipitation,which strongly Observed and calculated byprecipitation influences plant growth weather stationsAverage0–100Annual average evaporation,which strongly Observed and calculated byevaporation influences soil moisture and plant growth weather stationsIndex of−60–120Moisture status,which strongly influences Observed and calculated bymoisture soil moisture weather stationsTopogra-Elevation50–5000m Height above average sea level of the Yellow Calculated from digitalphical Sea,which is very important in deriving other elevation model(DEM) conditions factors listed in the table because of its influ-ence on temperature,precipitation,and soilSlope0◦–90◦Slope gradient influences the overall movement Calculated from DEMgradient offlow down slope and the amount of solarradiation received at a siteSlope0–360◦Situation from convex(positive)to concave Calculated from DEMaspect(negative),which influences soil moisture174S.Y.WANG et al. moting environmental sustainability,while climate factors and topography factors play a more important role in influencing eco-environmental quality.Values of all factors used in the study were derived from a digital elevation model(DEM),Landsat thematic mapper(TM)images,national oceanographic and atmospheric administration-advanced very high resolution radiometer(NOAA/AVHRR)images, climate stations orfield survey(Table I).Finally,all data were projected using the Albers projection system,which includes parameters of the1st standard parallel of25.0000,the2nd standard of47.0000, the central meridian of105.0000,and the Krasovsky ing ArcGIS software,all data were transferred to100m×100m raster data.Due to great differences and different units among values of assessment factors,it was difficult to evaluate the eco-environmental status using these factors indirectly.Their values must be standardized to reflect a uniform measurement system across all factors for eco-environmental evaluation.The original values of each factor were standardized by the following equation:Y ij=x ij−x min,jx max,j−x min,j×10(1)where Y ij represents the standardized value of factor j of grid i,varying from0to10,x ij representsthe measured value of factor j of grid i,and x min,j and x max,j represent minimum and maximum value of factor j of grid i,respectively.Spatial principal component analysis and vulnerability classificationHow to convert data of climate condition,land use/land cover,soil and water losses,and landform into an integrated evaluation index is crucial for environmental evaluation and often remains difficult to solve(Munda et al.,1994).The principal component analysis(PCA)is designed to transform the original variables into new,uncorrelated variables(axis),namely,the principal components,which are linear combinations of the original variables.The new axes lie along the directions of maximum variance. PCA provides an objective way offinding indices of this type so that the variation in the data set can be accounted for as concisely as possible(Shaw and Wheeler,1985).The principal components(PCs) provide information on the most meaningful parameters,which describe the whole data set affording data reduction with minimum loss of original information.PCA can be expressed as:Y i=a i1x1+a i2x2+a i3x3+···+a im x m(2) where Y is the component score,a is the component loading,x is the measured value of a variable,i isthe component number,and m is the total number of variables.Spatial principal component analysis(SPCA)is constructed to transform the data attributes in a multiband spatial data into a new multivariate attribute space whose axes are rotated with respect to the original space.The axes in the new space are uncorrelated.The result of SPCA is a multiband new spatial data set with the same number of bands as the original data.Thefirst principal component will have the greatest variance,the second will show the second most variance not described by thefirst, and so forth.Many times thefirst three to four layers(PCs)of the resulting data represent over95 percent of the total variance so that the remaining layers of the principal components may be dropped. SPCA has certain advantages over the conventional orthogonal functions,since they are not of any predetermined form,but are developed as unique functions from the data matrix.This is particularly useful if nothing is known in advance about the existence or nature of the component patterns(Li et al., 2006).So in this study the SPCA was used to evaluate eco-environmental vulnerability.The formulae of SPCA evaluation are:E=r1Y1+r2Y2+r3Y3+···+r n Y n(3) where E is the eco-environmental synthetic evaluation index,r is the contribution ratio of the principalECO-ENVIRONMENTAL VULNERABILITY EVALUATION175 component,Y is the principal component,and n is the number of principal components retained,andr i=λimi=1λi(4)where r i is the contribution ratio of the i th principal component,andλi is the eigenvalue of the i th principal component.Results computed from the SPCA model were continuous values and classified into several classes standing for different eco-environmental vulnerability levels.The classification is crucial to the evalua-tion,so it should be objective and logical.The natural breaks classification(NBC)is a graphical tool to explore statistical distribution of the classes and clusters in the attribute space.Because the classes are based on natural grouping inherent in the data,NBC can identify break points by picking the class breaks that group similar values and maximize the differences between classes,and the features are divided into classes whose boundaries are set where there are relatively big jumps in the data values. This study applied the NBC to discrete computed values through analyzing natural properties of the computed values to line out dividing points between clusters.With this standard,eco-environmental vulnerability was graded into six levels defined as potential,slight,light,medium,heavy,and very heavy levels,and each level was characterized by typical features,as shown in Table II.TABLE IIEco-environmental vulnerability classification in the Yellow River BasinEvaluation level Number SEVI a)Feature descriptionPotential I<2.8Stable ecosystem,super high anti-interference ability,rich soil,rich water and heat,and good vegetation coverSlight II 2.8–4.1Relatively stable ecosystem,high anti-interference ability,rich soil,rich water andheat,and relatively good vegetation coverLight III 4.1–5.8Relatively stable ecosystem,relatively high anti-interference ability,infertile soil,and relatively poor vegetation coverMedium IV 5.8–7.2Relatively unstable ecosystem,low anti-interference ability,bad-quality soil,andpoor vegetation coverHeavy V7.2–9.0Unstable ecosystem,low anti-interference ability,deteriorated soil,and poorvegetation coverVery heavy VI>9.0Extremely unstable ecosystem,low anti-interference ability,and severe water andsoil lossesa)SEVI represents the synthetic eco-environmental vulnerability index calculated using spatial principal component analysis model.RESULTS AND DISCUSSIONEco-environmental vulnerability evaluation in2000Based on the correlations between the twelve selected factors for eco-environmental vulnerability evaluation,they were classified into three groups(Table I):Group1,the factors which all reflected climate-environmental changes and were calculated using observed data of the weather stations;Group 2,the factors which reflected topography-environmental changes and were calculated using the DEM; and Group3,the factors which synthetically reflected the status of land cover in the basin and were obtained from Landsat TM images and NOAA/AVHRR images.First,the factors in Group1were related to the water-heat meteorological conditions.In order to further evaluate the climatic influences on eco-environment,synthetic climatic environmental index (SCEI)was calculated using the SPCA model.The principal components(PCs)with eigenvalues greater than0.7were extracted with PC loading rotated for the maximum variance.A total of two PCs were extracted,which accounted for93.63%of the total variance(Table III).Second,the factors in Group176S.Y.WANG et al.2were related to topographical conditions.To further evaluate the topographical influences on eco-environment,synthetic topographical environmental index(STEI)was calculated by means of the SPCA method.A total of two PCs were extracted,which accounted for83.17%of the total variance.Finally, the factors in Group3together with SCEI and STEI were selected for evaluating the eco-environmental vulnerability.Synthetic eco-environmental vulnerability index(SEVI)was calculated using the SPCA model.The principal components(PCs)with eigenvalues greater than1were extracted with the PC loading rotated for the maximum variance.A total of two PCs were extracted,which accounted for 89.21%of the total variance.Linear formulae for computing SCEI,STEI,and SEVI were shown as follows:SCEI=Climatic Princ6c1×0.6468+Climatic Princ6c2×0.2895(5)where Cimatic Princ6c1is thefirst PC,Climatic Princ6c2is the second PC,and0.6468and0.2895are the contribution ratios of thefirst and second PCs;STEI=Dem princ3c1×0.4754+Dem princ3c2×0.3563(6)where Dem Princ3c1is thefirst PC,Dem princ3c2is the second PC,and0.4754and0.3563are the contribution ratios of thefirst and second PCs;SEVI=Env Princ5c1×0.6350+Env Princ5c2×0.2571(7)where Env Princ5c1is thefirst PC,Env Princ5c2is the second PC,and0.6350and0.2571are the contribution ratios of thefirst and second PCs.TABLE IIIEigenvalues and contribution ratios in the spatial principal component(PC)analysis for eco-environmental vulnerability evaluation in2000in the Yellow River BasinIndex of PC1PC2PC3evaluation a)Eigen-Contri-Accumulated Eigen-Contri-Accumulated Eigen-Contri-Accumulatedvalue bution contribution value bution contribution value bution contribution ratio ratio ratio ratio ratio ratio%%%SCEI 1.6541564.6864.680.7402628.9593.630.16269 6.37100STEI0.6337947.5447.540.4749535.6383.170.2243716.83100SEVI 3.4027763.5063.50 1.3779425.7189.210.5781910.79100a)SCEI:synthetic climatic environmental index;STEI:synthetic topographical environmental index;SEVI:synthetic eco-environmental vulnerability index.Using these formulae,the synthetic eco-environmental vulnerability index of the Yellow River Basin was calculated.According to the standard mentioned above,SEVI was classified to generate corre-sponding results shown in Fig.1.Table IV shows the statistics of synthetic eco-environmental vulner-ability evaluation in the Yellow River Basin.From Fig.1and Table IV,it could be seen that the eco-environmental vulnerability was at medium level for the study area as a whole.In2000,the two largest vulnerable zones were the lightly and potentially vulnerable zones,which accounted for24.09% and21.16%,and were mainly distributed in the west and south of the Yellow River Basin,including Qinghai Province and part of Shanxi and Henan provinces.In these regions there was a good vegetation cover and the intensity of soil erosion was weak and slight.In the meantime,the slightly vulnerable zone accounted for18.94%,and the moderately vulnerable zone accounted for18.15%.The very heavily vulnerable zone only accounted for a very small proportion of1.79%,and was mainly distributed in the east-north of the Yellow River Basin,especially concentrated in the municipality of Inner Mongolia and Shanxi Province.ECO-ENVIRONMENTAL VULNERABILITY EVALUATION177Fig.1Spatial distribution of eco-environmental vulnerability in2000in the Yellow River Basin.TABLE IVStatistics of synthetic eco-environmental vulnerability evaluation in2000in the Yellow River BasinEco-environment vulnerability level Number of grids Area Percentagekm2Potential16736816736821.16 Slight14980914980918.94Light19057719057724.09 Medium14357014357018.15 Heavy12547612547615.86Very heavy1415814158 1.79Sum790958790958100.00 Changes in eco-environmental vulnerability in ten yearsUsing the same SPCA model as for the year2000,the eco-environmental vulnerability in1990was computed.The eco-environmental vulnerability changes were evaluated for the ten years from1990to 2000(Fig.2;Table V).Statistical analysis indicated that areas of the potentially vulnerable zone,slightly vulnerable zone,and moderately vulnerable zone all increased in2000compared with1990(Table V). The potentially vulnerable zone increased from9.20%to21.16%,which was the fastest among all zones. The moderately vulnerable zone increased by3.04×104km2,and the slightly vulnerable zone increased by5.90×103km2.However,the lightly,heavily,and very heavily vulnerable zones decreased by1.21×105,3.69×103and7.51×103km2,respectively.Overall,it should be noted that the eco-environmental quality had been gradually improved as a whole,but in some regions the eco-environmental quality became worse in the ten years(Fig.2b).In the middle of the1990s,increasing attention was paid to eco-environmental restoration and agricultural sustainable development in the Yellow River Basin by the Chinese central government.On the national policy level,there were a number of campaigns on soil erosion control and actions on comprehensive eco-environmental management.The central government also continuously andfinancially supported a number of programs to research,demonstrate,and extend the efficient and effective example models of soil and water conservation.These campaigns and programs had led to widespread re-vegetation,implementation of conservation tillage,dryland farming(water saving agriculture),and building terraces and dams,resulting in a great progress in soil erosion control and eco-environmental restoration.All of these factors improved the eco-environment on the whole.But it is also noted that with human activity aggrandized,forestland and grassland decreased and built-up land expanded in some regions,all of which made the eco-environmental quality worse.Eco-environmental vulnerability and its changes for different administrative zones The eco-environmental vulnerability was also computed for each county after the SEVI map was178S.Y.WANG et al.Fig.2Spatial distribution of eco-environmental vulnerability in1990(a)and its changes in the ten years from1990to 2000(b)in the Yellow River Basin.TABLE VChanges of eco-environmental vulnerability in the ten years from1990to2000in the Yellow River BasinEco-environment Area Percentage of area vulnerability level20001990Change20001990km2Potential167368729129445621.169.20 Slight149809143909590018.9418.17 Light190577311397−12082024.0939.31 Medium1435701131663040418.1514.28 Heavy125476129164−368815.8616.30 Very heavy1415821670−7512 1.79 2.73overlaid on the county boundary map.Fig.3shows the eco-environmental vulnerability levels and changes for each county in the Yellow River Basin.The vulnerability was heavy in the east-north counties while it was relatively light in the west and south counties(Fig.3b).For example,in Fugu, Huangjinqi,Wushenqi,Dingbian,Shenmu,Lingxian,and Etuokeqi counties the vulnerability levels were heavy,which reflected that the eco-environment was worse in these counties than the other counties.At the same time,it could be seen that the vulnerability levels changed for different counties.In Tongxin, Zizhou,Alashanzuoqi,and Jiangxian counties,the eco-environmental vulnerability levels decreased by one grade,showing that in these regions human activity was aggrandized,forestland and grassland decreased,and soil and water losses were more severe.But in Huining,Dingxi,Zhongning,Huachi,and Qingyang counties,the eco-environmental vulnerability levels increased by one grade,suggesting that in these regions the eco-environment had been ameliorated to a certain extent.ECO-ENVIRONMENTAL VULNERABILITY EVALUATION179Fig.3Spatial distribution of eco-environmental vulnerability in2000(a)and its changes in the ten years from1990to 2000(b)for different counties in the Yellow River Basin.Driving forces of eco-environmental vulnerability changesThe results of the eco-environmental vulnerability and its changes in the Yellow River Basin showed that eco-environmental quality had been gradually improved for the whole basin,but in some regions the eco-environmental quality became worse in the ten years from1990to2000.There were many factors affecting the eco-environmental vulnerability of the Yellow River Basin,such as structural geology, meteorological conditions,sediment discharge,human activity,and forest degradation,among others. But for the ten years from1990to2000,the driving forces of the eco-environmental vulnerability changes were the rapid population growth,governmental policy,and vegetation degradation.In the Yellow River Basin grassland degeneration,sandy desertification,and soil erosion had seriously affected the sustainable development of eco-environment.Soil erosion is particularly one of the key factors that affect the eco-environmental changes(Ding,2003).Natural processes of erosion may level and move substances controlled by physical factors.Human activities may have enhanced the erosion processes.Soil erosion on the Yellow River Basin was a combination of natural erosion and accelerated erosion(Shi and Shao,2000).The accelerated erosion arose from cultivation,uncontrolled development, overgrazing,mining,road construction,and other human activities.In the middle of the1990s,the total population of the Yellow River Basin was97.8million,but in the end of the1990s,the total population was107million,and the ratio of peasant population to the total population was76.58%. The average annual growth rate was1.88%infive years.To meet the demand of food supplies for the increasing population,more and more forestland and grassland had been reclaimed into farmland.This put high pressure on the environment and resulted in imprudent land use practices including careless water management,which obviously were the culprit of deforestation,high levels of soil erosion,and depletion of water resources.So the rate of vegetation coverage decreased from61.77%to60.93%.Zheng et al.(1993)studied the characteristics of natural erosion in woodlands and accelerated erosion after。