3D Reconstruction of Outdoor Environments
from Omnidirectional Range and Color Images
Toshihiro ASAI,Masayuki KANBARA,Naokazu YOKOYA
Graduate School of Information Science,Nara Institute of Science and Technology,
8916-5Takayama,Ikoma,Nara630-0192,Japan
ABSTRACT
This paper describes a3D modeling method for wide area outdoor environments which is based on integrating omnidirectional range and color images.In the proposed method,outdoor scenes can be e?ciently digitized by an omnidirectional laser range?nder which can obtain a3D shape with high-accuracy and an omnidirectional multi-camera system(OMS)which can capture a high-resolution color image.Multiple range images are registered by minimizing the distances between corresponding points in the di?erent range images.In order to register multiple range images stably,the points on the plane portions detected from the range data are used in registration process.The position and orientation acquired by the RTK-GPS and the gyroscope are used as initial value of simultaneous registration.The3D model which is obtained by registration of range data is mapped by the texture selected from omnidirectional images in consideration of the resolution of the texture and occlusions of the model.In experiments,we have carried out3D modeling of our campus with the proposed method. Keywords:3D reconstruction,wide outdoor environment,omnidirectional sensor
1.INTRODUCTION
3D models of outdoor environments can be used in a number of?elds such as site simulation,human navigation and virtual walk-through.However,such3D models are often made manually with high costs,so recently automatic3D modeling methods have been widely investigated;for example,3D shape estimation from an image sequence1,2,3,4,5and3D measurement of outdoor environments by a laser range?nder6,7,8,9,10.The merit of the former is that the method can reconstruct a3D model with only camera.However,since it is di?cult for vision-based methods to reconstruct a3D model with high accuracy,the approaches are not suitable for3D modeling of wide area outdoor environments.On the other hand,the latter can widely measure the shape of object with high accuracy.Thus it is useful for wide area outdoor environments.
This paper describes a3D reconstruction method for wide area outdoor environments.In this paper,in order to measure the wide outdoor environments,we use an omnidirectional laser range?nder which can measure the distances from the sensor to objects with high accuracy and an omnidirectional multi-camera system(OMS) which can capture a wide-angle high-resolution https://www.doczj.com/doc/5f11163795.html,ing the two omnidirectional sensors,the wide outdoor environments can be digitized e?ciently.Note that the omnidirectional range and color images are acquired approximately at the same position to register both of the images geometrically.
The problem in modeling using a range?nder is registration of multiple range data.In most conventional methods for registration of multiple range data,the ICP algorithm15is often used.In the method,the distance between corresponding points in paired range data is de?ned as an error,and the transformation matrix is calculated so that the error is minimized.Therefore,to apply the ICP algorithm,it is necessary for a pair of range data to include overlapped regions.Since outdoor environments are complex,many occlusions occur and there are objects which cannot be measured by the range?nder stably.In order to solve this problem,Gunadi et al.11register local range data acquired on the ground into a global range data acquired from the sky.Zhao et al.8and Fr¨u h et al.12acquire the range data and estimate the position and orientation of the range?nder while it is moving.In these methods,the precision of the generated model is determined by the precision of the sensor position and orientation.Since these methods need to measure the sensor position and orientation under a motion,it is di?cult to measure them accurately.
E-mail:{toshih-a,kanbara,yokoya}@is.naist.jp
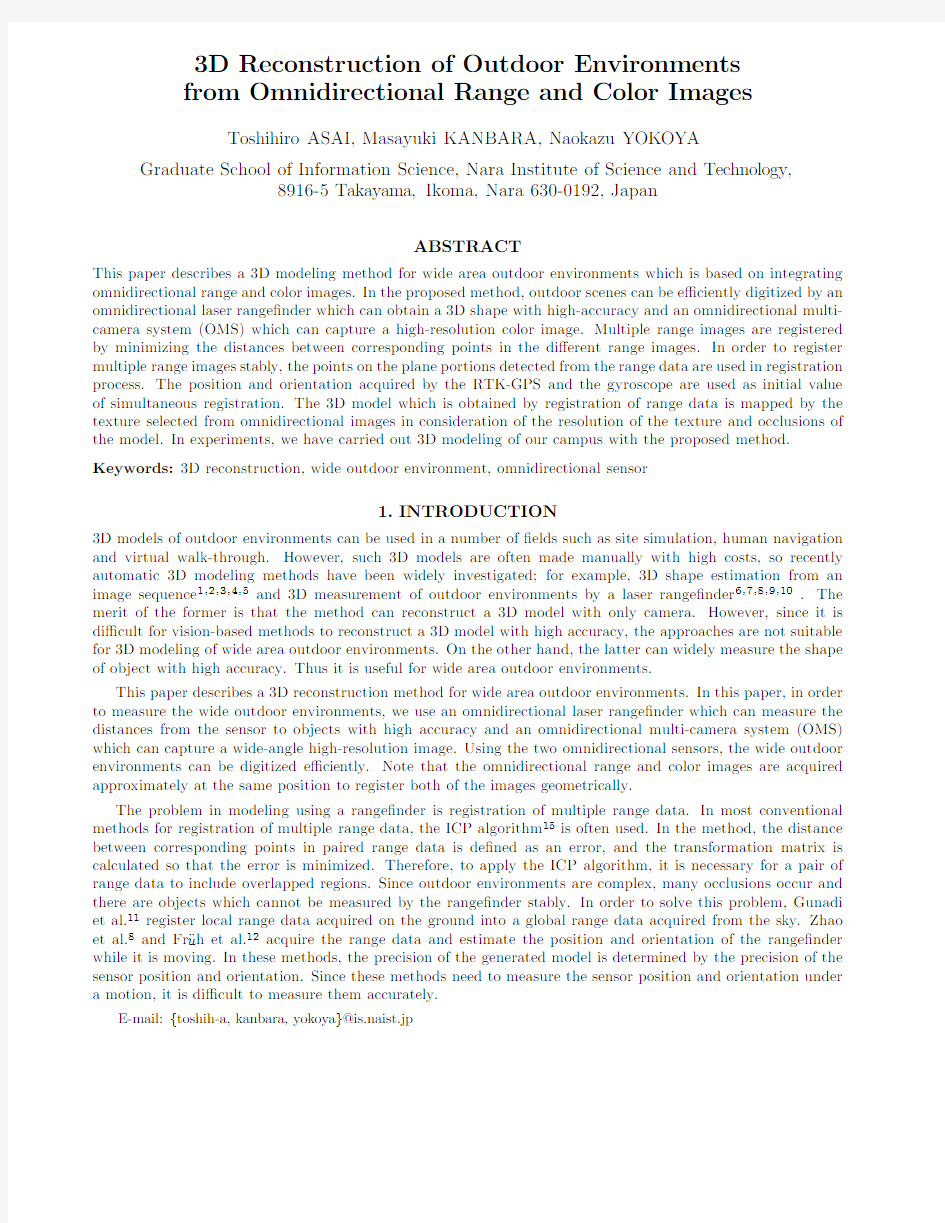
Omnidirectional multi-camera system
(Point Grey Research, Ladybug)
Omnidirectional
laser rangefinder
(Riegl, LMS-Z360)Antenna of RTK-GPS (Nikon-Trimble, LogPakII)
Gyroscope
(Tokimec, TISS-5-40)
Figure 1.Sensor system mounted on a vehicle.
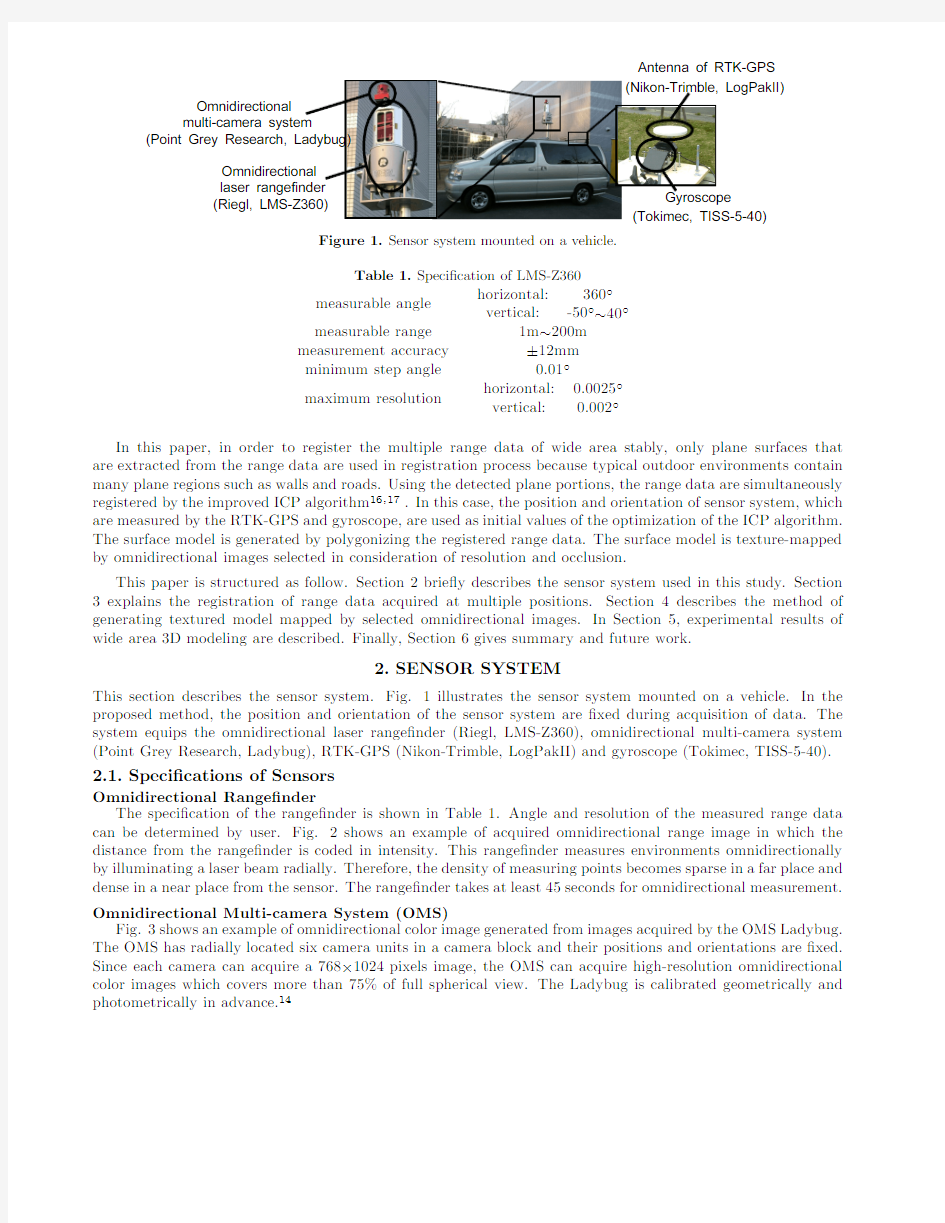
Table 1.Speci?cation of LMS-Z360
measurable angle
horizontal:360?vertical:-50?~40?measurable range
1m ~200m measurement accuracy
±12mm minimum step angle
0.01?maximum resolution horizontal:0.0025?
vertical:0.002?
In this paper,in order to register the multiple range data of wide area stably,only plane surfaces that are extracted from the range data are used in registration process because typical outdoor environments contain many plane regions such as walls and https://www.doczj.com/doc/5f11163795.html,ing the detected plane portions,the range data are simultaneously registered by the improved ICP algorithm 16,17.In this case,the position and orientation of sensor system,which are measured by the RTK-GPS and gyroscope,are used as initial values of the optimization of the ICP algorithm.The surface model is generated by polygonizing the registered range data.The surface model is texture-mapped by omnidirectional images selected in consideration of resolution and occlusion.
This paper is structured as follow.Section 2brie?y describes the sensor system used in this study.Section 3explains the registration of range data acquired at multiple positions.Section 4describes the method of generating textured model mapped by selected omnidirectional images.In Section 5,experimental results of wide area 3D modeling are described.Finally,Section 6gives summary and future work.
2.SENSOR SYSTEM
This section describes the sensor system.Fig.1illustrates the sensor system mounted on a vehicle.In the proposed method,the position and orientation of the sensor system are ?xed during acquisition of data.The system equips the omnidirectional laser range?nder (Riegl,LMS-Z360),omnidirectional multi-camera system (Point Grey Research,Ladybug),RTK-GPS (Nikon-Trimble,LogPakII)and gyroscope (Tokimec,TISS-5-40).
2.1.Speci?cations of Sensors
Omnidirectional Range?nder The speci?cation of the range?nder is shown in Table 1.Angle and resolution of the measured range data can be determined by user.Fig.2shows an example of acquired omnidirectional range image in which the distance from the range?nder is coded in intensity.This range?nder measures environments omnidirectionally by illuminating a laser beam radially.Therefore,the density of measuring points becomes sparse in a far place and dense in a near place from the sensor.The range?nder takes at least 45seconds for omnidirectional measurement.Omnidirectional Multi-camera System (OMS)Fig.3shows an example of omnidirectional color image generated from images acquired by the OMS Ladybug.The OMS has radially located six camera units in a camera block and their positions and orientations are ?xed.Since each camera can acquire a 768×1024pixels image,the OMS can acquire high-resolution omnidirectional color images which covers more than 75%of full spherical view.The Ladybug is calibrated geometrically and photometrically in advance.14
Figure2.Omnidirectional range image.
Figure3.Omnidirectional color image.
RTK-GPS and Gyroscope
RTK-GPS and gyroscope are used to measure the position and orientation of the sensor system,respectively. The speci?cation of the RTK-GPS is shown in Table2(a).In general,a yaw value measured by the gyroscope includes an accumulative error.The gyroscope is interlocked with the RTK-GPS in order to correct the accumu-lative error by measuring the direction of movement calculated by the GPS data under motion.The speci?cation of the gyroscope is shown in Table2(b).
2.2.Alignment of Sensor Coordinate Systems
There are four coordinate systems in the sensor system;the range?nder,the OMS,the RTK-GPS,and the gyro-scope coordinate systems.Geometrical relationship among the coordinate systems is?xed,and these coordinate systems are registered to RTK-GPS(global)coordinate system as shown in Fig.4.Figs.4(a),(b)and(c)illus-trate transformation matrices among sensor coordinate systems.The methods for estimating the transformation matrices are described below.
(a)Transformation matrix between OMS and range?nder coordinate systems
By giving the corresponding points in range and color images,the transformation matrix can be estimated by the existing method.14
(b)Transformation matrix between range?nder and gyroscope coordinate systems
The transformation matrix can be estimated by measuring more than three markers whose positions in the gyroscope coordinate system are known.The markers are placed at positions which can be measured by the range?nder as shown in Fig.5(a).The transformation Fig.4(b)is estimated by measuring the position of markers with respect to the range?nder as shown in Fig.5(b).
(c)Transformation matrix between gyroscope and global coordinate systems
The coordinate systems of the RTK-GPS(global coordinate system)and the gyroscope are aligned automat-ically,because these sensors are interlocked with each other.
Table2.Speci?cations of RTK-GPS and gyroscope
(a)Accuracy of RTK-GPS.
latitude±3.0cm
longitude±3.0cm
altitude±4.0cm (b)Accuracy of gyroscope.
yaw±2?
roll±0.5?
pitch±0.5?
g
global coordinate system
Figure4.Relationship among the coordinate systems of the sensors.
3.GENERATION OF3D SURF ACE MODEL
The surface model is generated by integrating multiple range data.Therefore,all range data are?rst registered to the GPS coordinate system.Since the position and orientation acquired by the sensors include an error, they are used as initial values of registration and should be optimized.The ICP algorithm15is usually used for optimal registration of multiple range images.In the conventional ICP algorithm,the distance between corresponding points in paired range data is de?ned as a registration error,and the transformation matrix is calculated so that the error is minimized.The present range?nder measures the distance by rotating the laser scan,thus the spatial density of data points depends on the distance;that is,close objects are measured densely and far objects are measured sparsely.In registering range data obtained at di?erent positions,this causes the problem that multiple points may correspond to a single point as shown in Fig.6(a).The solution tends to fall into a local minimum,because the correspondences between points are discrete and does not include the surface information about an object.16The proposed method?rst detects plane regions from all range data,and then determines the point-to-plane correspondences.Finally,the transformation matrix of range data is calculated by overlapping the corresponding planes.
3.1.Simultaneous Registration of Multiple Range Data
Multiple range data are registered by overlapping the corresponding planes.For this purpose as a pre-processing, planar regions in range data are detected and the normal vectors at the measured points in planar regions are calculated,then the plane in one data corresponding to each point in the other data is searched.The range data are simultaneously registered for optimization of transformation matrices.The position and orientation which are acquired by RTK-GPS and gyroscope are used as an initial value of the optimization.Procedure?owchart of the registration is shown in Fig.7and the detail of each process is described in the following.
3.1.1.Plane Detection from Range Data
Planar regions are detected from range data by local plane?tting.We employ the renormalization method13for planar region detection and the quadtree segmentation recursively.The whole range image is taken as an initial region.The distances between estimated plane and points in the region are calculated and when at least one distance is bigger than a threshold,the region is split.On the other hand,when all the distances are smaller than the threshold,the region is de?ned as a plane portion.The points which are not de?ned as a plane portion are not used for registration process.
(b) Range image of markers
(a) Layout of markers
marker
Figure 5.Alignment of range?nder and gyroscope coordinate
systems.
(b) Correspondence of a point (range data 1) and a plane (range data 2)
(a) Correspondence of a point (range data 1)
and a point (range data 2)
▲range data 1●
range data 2Plane
Figure 6.Correspondence between di?erent range data
3.1.2.Search of Corresponding Plane
The plane portion of a range data is searched from di?erent range data.The de?nition of the correspondence plane is described below.Let RD n be range data n (n =1,···,N ),P ni be a planar region in the range data n (i =1,···,I )and Q nij be a point in the plane P ni (j =1,···,J ),where normal vector of P ni are N ni .The plane which corresponds to the point Q nij is searched from range data other than the range data n .A plane P kl corresponding to the point Q nij is selected so that |Q nij P x |,which means the distance between Q nij and P x ,is minimized.Note that P kl and Q nij satisfy two conditions:the inner product of N kl and N ni is below the threshold and a point P x where the vector N kl which passes point Q nij intersects the plane P kl exists.
3.1.3.Estimation of Sensor Position and Orientation of Range Data
The sensor position of range data is estimated from the distance between a point and the corresponding plane and the sensor orientation of range data is estimated from the inner product of normal vectors.Let R n and T n be sensor orientation and position of range data n (n =1,···,N ),respectively.
step 1.The orientations R n are estimated by maximizing the correlation C N de?ned as the sum of inner
products of normal vectors of a point Q u and a plane P u (u =0,···,U ),where Q u is the point in range data x and P u is the plane in range data y ,P u is the plane which corresponds to the point Q u ,U represents the number of points which have corresponding planes.
C N =U u =0
(R x N nu )·(R y N mu )→max,(1)
where N nu and N mu are the normal vectors of Q u and P u respectively.
Figure7.Procedure of registring range data
step2.The positions T n are estimated by minimizing the error E T which is de?ned as the sum of distances between corresponding point and plane as follows.
E T=
U
u
distance(Q u,P u)→min,(2)
where,Q u and P u are Q u and P u after transformation by(R x,T x)and(R y,T y),and the orientations which are estimated in step1are?xed.
The corresponding plane is searched again after the step2and the process is iterated until the solution is converged.Multiple dimension downhill simplex method,which does not need the derivatives,is used for the optimization.18
3.2.Polygonization of Range Data
A polygon is generated from each range data by connecting four corners of region de?ned as a plane portion in the plane detection process in order to reduce the number of polygons.In the non-plane portion,a polygon is generated by connecting adjoining pixels and its four-connected neighbors and one of its diagonal neighbors.
A range data have the region which overlapped other range data which the acquisition position adjoins.The quantity of data is reduced by removing redundant polygons at overlapping regions.Polygons are generated from range data in order of input.The generated polygons which correspond to the vertices of polygon are searched with the method described in Section3.1.2.When distances between vertices and intersection P x are less than a threshold,the polygon is deleted as a redundant one as shown in Fig.8.Note that only the polygon de?ned as the plane portion is deleted to maintain the quality of model and to reduce the amount of data.
4.GENERATION OF TEXTURED MODEL
The3D shape obtained in the previous section is colored by textures selected from omnidirectional color images. The geometrical relationship between the range?nder and the OMS is known by the alignment described in Section2.Therefore,the position and orientation of omnidirectional images are also registered by registering the range data,and the2-D point in omnidirectional images on which a certain3-D point is projected can be easily determined.
Generated polygon
Vertex of polygon
Intersection P
x
Figure 8.Deletion of overlapping areas.
Figure 9.Selection of omnidirectional image in consideration
of occlusion.50m
Figure 10.Range data acquisition points.
4.1.Selection of Omnidirectional Image
Each polygon on the 3D shape is colored by the texture selected from the image which gives the highest resolution.A polygon is projected onto each omnidirectional image and then the image with the biggest area of the polygon is chosen.However,when occlusions occur this strategy fails.For example,as shown in Fig.9,the resolution of texture generated from camera 2is higher than the camera 1.However,the correct texture can not be taken by the camera 2.The occlusion is detected when the generated surface model intersects with a triangular pyramid determined by triangular patch vertices and the projection center of camera.In such a case,the next highest resolution image is selected,and occlusion is re-detected.
5.EXPERIMENTS
We have carried out experiments of reconstructing our campus.In experiments,the range and color images are acquired at 44points in our campus (about 250m ×300m).Fig.10illustrates the data acquisition points in our campus.Since the proposed method requires overlapping portions among range data for registration,we acquired the data paying that attention.The sensor coordinate systems are aligned in advance with the proposed method described in Section 2.2.The resolution of each omnidirectional range image is 1024×512.22PCs (CPU:
(a) Registration result using initial values.(b) Registration result after optimization.
Figure 11.2D CAD data overlaid on generated 3D model
Pentium41.7Ghz,Memory:1024MB)performed process which is search of corresponding plane,and single PC (CPU:Pentium41.8Ghz,Memory:2048MB)performed optimization process which is registration of multiple range data.The time required for registration was 72hours.In optimization,the position of the range data acquired by point A in Fig.10is ?xed.The mean distance between initial positions acquired by the RTK-GPS and optimized positions is 4.37m,and the maximum distance is 8.50m.Fig.11illustrates a 2D CAD data of our campus overlaid with the generated model.The sensor positions and orientations of range data used to generate the model in Fig.11(a)are initial values,while the model in Fig.11(b)is generated by using optimized positions and orientations.Examples of rendering the generated model are shown in Fig.12.
6.CONCLUSION
This paper has proposed a 3D modeling method which is based on integrating omnidirectional range and color images for wide area outdoor environments.In experiments,a 3D model is actually generated from omnidirec-tional range and color images acquired at 44points in our campus.We can move viewpoint and look around the model freely.However,there are many small data lacking portions mainly caused by occlusions in the generated model.In order to measure them e?ciently,we are planning to carry out continuous measurement during the movement of sensors.Moreover,the sense of incongruity is observed in the generated model,when di?erent images are selected in neighboring polygons.Such an e?ect is mainly caused by the varying illumination condi-tions during the measurement of whole area.This problem in generating a textured 3D model should further be investigated.
Figure12.Generated3D model with texture
REFERENCES
1.T.Sato,M.Kanbara,N.Yokoya and H.Takemura:“Dense3-D Reconstruction of an Outdoor Scene
by Hundreds-baseline Stereo Using a Hand-held Video Camera,”International Jour.of Computer Vision, Vol.47,No.1-3,pp.119–129,2002.
2.S.Ozawa,M.Notomi,and H.Zen:“A Wide Scope Modeling to Reconstruct Urban Scene”,Proc.ISPRS
Commission V,Int.Symposium on Real-Time Imaging and Dynamic Analysis,pp.370–376,1998.
3.C.Tomasi and T.Kanade:“Shape and Motion from Image Streams under Orthography A Factorization
Method,”International Jour.of Computer Vision,Vol.9,No.2,pp.137–154,1992.
4.M.Pollefeys,R.Koch,M.Vergauwen,A.A.Deknuydt and L.J.V.Gool:“Three-demintional Scene
Reconstruction from Images,”Proc.SPIE,Vol.3958,pp.215–226,2000.
5.M.Okutomi and T.Kanade:“A Multiple-baseline Stereo,”IEEE Trans.on Pattern Analysis and Machine
Intelligence,Vol.15,No.4,pp.353–363,1993.
6.S.F.El-Hakim,C.Brenner and G.Roth:“A Multi-sensor Approach to Creating Accurate Virtual Envi-
ronments,”Jour.of Photogrammetry&Remote Sensing,Vol.53,pp.379–391,1998.
7.H.Zhao and R.Shibasaki:“Reconstruction of Textured Urban3D Model by Fusing Ground-Based Laser
Range and CCD Images,”IEICE Trans.Inf.&Syst.,Vol.E-83-D,No.7,pp.1429–1440,2000.
8.H.Zhao and R.Shibasaki:“Reconstructing a Textured CAD Model of an Urban Environment Using Vehicle-
Borne Laser Range Scanners and Line Cameras,”Machine Vision and Applications,Vol.14,No.1,pp.35-41, 2003.
9.P.K.Allen,A.Troccoli,B.Smith,S,Murray,I.Stamos and M.Leordeanu:“New Methods for Digital
Modeling of Historic Sites,”IEEE Computer Graphics and Applications,Vol.23,pp.32–41,2003.
10.Y.Sun,J.K.Paik,A.Koschan and M.A.Abidi:“3D Reconstruction of Indoor and Outdoor Scenes Using
a Mobile Range Scanner,”Proc.Int.Conf.on Pattern Recognition,Vol.3,pp.653–656,2002.
11.C.R.Gunadi,H.Shimizu,K.Kodama,K.Aizawa:“Construction of Large-scale Virtual Eenvironment
by Fusing Range Data,Texture Images and Airbone Altimetry Data,”Proc.Int.Symposium on3D Data Processing,Visualization and Transmission,pp.772-775,2002.
12.C.Fr¨u h and A.Zakhor:“Constructing3D City Models by Merging Aerial and Ground Views,”IEEE
Computer Graphics and Applications,Vol.23,pp.52–61,2003.
13.Y.Kanazawa and K.Kanatani:“Reliability of Fitting a Plane to Range Data,”IEICE Trans.on Information
and Systems,Vol.E78-D,No.12,pp.1630–1635,1995.
14.S.Ikeda,T.Sato,and N.Yokoya:“Panoramic Movie Generation Using an Omnidirectional Mmulti-camera
System for Telepresence”,Proc.13th Scandinavian Conf.on Image Analysis,pp.1074–1081,2003.
15.P.J.Besl and N.D.McKay:“A Method for Registration of3-D Shapes,”IEEE Trans.on Pattern Analysis
and Machine Intelligence,Vol.14No.2,pp.239–256,1992.
16.K.Pulli:“Multiview Registration for Large Data Sets,”Proc.Int.Conf.on3D Digital Imaging and Mod-
elling,pp.160–168,1999.
17.T.Oishi,R.Sagawa,A.Nakazawa,R.Kurazume and K.Ikeuchi:“Parallel Alignment of a Large Number
of Range Images,”Proc.Int.Conf.on3D Digital Imaging and Modeling,pp.195–202,2003.
18.W.H.Press,B.P.Flannery,S.A.Teukolsky,W.T.Vetterling:Numerical Recipes in C,Cambridg University
Press1988.