Impedance-Manometry w Viscous Increases Test Sensitivity-Blonski-2007
- 格式:pdf
- 大小:270.01 KB
- 文档页数:7
.论著.盐酸多奈哌齐联合重复经颅磁刺激治疗老年痴呆的效果及对患者认知功能的影响^刘瑞王雪詹丽娟方立郑州人民医院神经内科,河南省郑州市450000【摘要】目的探讨盐酸多奈哌齐联合重复经颅磁刺激(rTMS)治疗老年痴呆的效果及对患者认知功能的影响。
方法选取2017年6月至2019年6月我院收治的老年痴呆患者86例,采用随机数字法分为观察组和对照组,每组43例,两组患者均给予常规治疗及盐酸多奈哌齐片治疗。
在此基础上,观察组患者给予rTMS治疗,对照组患者给予rTMS伪治疗,持续治疗3个月。
比较两组患者的临床疗效;比较两组患者治疗前后的认知功能(MoCA)和独立生活能力(ADL);比较两组患者的不良反应发生情况。
结果观察组患者的临床疗效明显优于对照组,治疗总有效率(90.7%)显著高于对照组(72.1%),差异有统计学意义(P<0.05)o治疗前,两组患者的MoCA和ADL评分比较,差异无统计学意义(P>0.05);治疗3个月后,两组患者的MoCA和ADL评分均明显升高,观察组患者的评分显著高于对照组,差异有统计学意义(P<0.05)o治疗期间,观察组患者的不良反应发生率(20.9%)低于对照组(27.9%),但差异无统计学意义(P>0.05)o结论盐酸多奈哌齐联合rTMS治疗老年痴呆患者临床效果显著,可显著提高患者的认知功能和独立生活能力,但不增加患者的不良反应。
【关键词】老年痴呆;盐酸多奈哌齐;颅磁刺激;认知功能【中图分类号】R592;R742【文献标识码】A【文章编号】1673-7768(2021)01aXH£4DOI:10.16121/45-1347/r.2021.01.01Effect of donepezil hydrochloride combined with repetitive transcranial magnetic stimulation in the treatment of senile dementia and their effects on cognitive functionUURui,WANG Xue,ZHAN Lijuan,FANG LiDepartment of Neurology,Zhengzhou Peopled Hospital,Zhengzhou450000,Henan Province,China[Abstract]Objective To explore the effects of donepezil hydrochloride combined with repetitive transcranial magnetic stimulation(rTMS)in the treatment of senile dementia and their influences on cognitive function.Methods A total of86patients with senile dementia admitted to our hospital from June2017to June2019were divided into observation group and control group by the random number method,with43cases in each group.Both groups were received conventional treatment and administrated donepezil hydrochloride tablets,based on which patients in the observation group were given rTMS for treatment,whereas patients in the control group were given rTMS pseudo treatment,for a continuously three-month treatment.The clinical efficacy was compared between the two groups.The Montreal cognitive assessment(MoCA)and the activities of daily living(ADL)before and after treatment were compared between the two groups,the occurrence of adverse reactions between the two groups was compared as well.Results The clinical efficacy of the observation group was significantly superior to that of the control group,and the total effective rate of the observation group(90.7%)was significantly higher than that of the control group(72.1%),and the differences were statistically significant(P<0.05). There were no statistically significant differences in pre-treatment MoCA and ADL scores between the two groups(P>0.05). After3months of treatment,the MoCA and ADL scores of the two groups significandy increased,and the scores of the observation group were significantly higher than those of the control group,with statistically significant differences(P<0.05). During the treatment period,the incidence of adverse reactions in the observation group(20.9%)was lower than that in the control group(27.9%),but the difference was not statistically significant(P>0.05).Conclusion Donepezil hydrochloride combined with rTMS has a significandy clinical effect in the treatment of patients with senile dementia,which can significantly improve the cognitive function and independent living ability in patients,but it does not increase the adverse reactions in patients.[Key words]Senile dementia;Donepezil hydrochloride;Cranial magnetic stimulation;Cognitive function▲基金项目:国家重点研发计划中医现代化研究重点专项(2018YFC1705801)老年痴呆是老年人常见的神经功能障碍性病变,主要包括阿尔茨海默病(Alzheimer,s disease,AD)和血管性痴呆(vascular dementia,VD)两种类型,其中AD是一种起病隐匿的退行性脑病,VD为一种因脑血管病变导致的脑功能损害,AD、VD患者均以认知功能损害和记忆力减退为主要临床表现,同时可能存在性格、判断力及定向力等方面的异常,日常生活能力明显下降UT。

类号分级密国际进类号十分(UDC )第四军医大学学位论文模拟失重对大鼠海马齿状回神经发生的影响题题(名和副名)郑丽娟(作者姓名) 导教师指姓名刘立 教授导教师单指位第四军医大学航空航天医学系临床医学教研室 请学级别申位硕士专业称名航空航天与航海医学 论文提交日期2008.04 辩答日期2008.05 论时间文起止2006 年 09月至2008 年 05月学单位授予位第四军医大学独创性声明秉承学校严谨的学风与优良的科学道德,本人声明所呈交的论文是我个人在导师指导下进行的研究工作及取得的研究成果。
尽我所知,除了文中特别加以标注和致谢的地方外,论文中不包含其他人已经发表或撰写过的研究成果,不包含本人或他人已申请学位或其他用途使用过的成果。
与我一同工作的同志对本研究所做的任何贡献均已在论文中作了明确的说明并表示了致谢。
申请学位论文与资料若有不实之处,本人承担一切相关责任。
论文作者签名: 日期:保护知识产权声明本人完全了解第四军医大学有关保护知识产权的规定,即:研究生在校攻读学位期间论文工作的知识产权单位属第四军医大学。
本人保证毕业离校后,发表论文或使用论文工作成果时署名单位仍然为第四军医大学。
学校可以公布论文的全部或部分内容(含电子版,保密内容除外),可以采用影印,缩印或其他复制手段保存论文。
学校有权允许论文被查阅和借阅,并在校园网上提供论文内容的浏览和下载服务。
论文作者签名: 导师签名: 日期:模拟失重对大鼠海马齿状回神经发生的影响研 究 生:郑丽娟学科专业:航空航天与航海医学所在单位:第四军医大学航空航天医学系导师:刘立教授关键词:模拟失重;神经发生;大鼠;海马;齿状回;免疫组织化学;5-溴化脱氧尿核苷;神经元;微血管中国人民解放军第四军医大学2008年 05 月目录缩略语表 (1)中文摘要 (3)英文摘要 (6)前 言 (10)文献回顾 (14)正 文 (36)实验一模拟失重对大鼠海马齿状回细胞增殖的影响 (36)1 引言 (36)2 材料 (36)3 方法 (37)4 结果 (38)5 讨论 (40)实验二模拟失重对大鼠海马齿状回神经干细胞分化的影响 (42)1 引言 (42)2 材料 (43)3 方法 (43)4 结果 (45)5 讨论 (51)实验三模拟失重后大鼠海马齿状回血管发生与神经发生的变化 (53)1 引言 (53)2 材料 (54)3 方法 (55)4 结果 (56)5 讨论 (60)小 结 (63)参考文献 (65)个人简历和研究成果 (80)致 谢 (81)缩略语表缩略词英文全称中文全称ABC avidinbiotin-peroxidasecomplex 卵白素-生物素-辣根过氧化物酶BDNF brain-derivedneurotrophic factor 脑源性神经营养因子bFGF basic fibroblast growth factor 碱性成纤维细胞生长因子BrdU bromodeoxyuridine 5-溴化脱氧尿核苷CNS central nervous system 中枢神经系统DAB 3,3’diaminobenzidine 二氨基联苯胺d day 天DCX doublecortin 微管相关蛋白DG dentategyrus 齿状回EC endothelialcell 内皮细胞EPO erythropoietin 促红细胞生长素g gram 克IGF-1 insulin like growth factor-1 胰岛素样生长因子-1 GCL granule cell layer 颗粒细胞层GDNF glial cell line-derivedneurotrophic factor胶质源性生长因子GFAP glial fibrillary acidic protein胶质纤维酸性蛋白LTP long-term potentiation 长时程增强-1-mm milimeter 毫米NeuN neuron-specific protein neural nuclet 神经元核心抗原NGF nerve growth factor 神经生长因子NMDA N-methyl-D-aspartate N-甲基-D-天门冬氨酸NSC neural stem cells 神经干细胞PBS phosphate buffered saline 磷酸盐缓冲生理盐水 RECA rat endothelial cell antigen大鼠内皮细胞抗原RMS rostral migration stream 喙侧迁移流SD Sprague-Dawleyrats SD大鼠SGZ subgranularzone 亚颗粒区SSC standardsalinecitrate 标准柠檬酸盐-氯化钠液SVZ subventricularzone 脑室下区VEC vascular endothelial cell 血管内皮细胞VEGF vascular endothelial growth factor 血管内皮生长因子-2-模拟失重对大鼠海马齿状回神经发生的影响硕士研究生:郑丽娟导 师:刘 立 教授第四军医大学航空航天医学系航空航天临床医学教研室,西安 710032中文摘要近年来研究发现, 成年中枢神经系统(central nervous system ,CNS) 仍能不断地产生新的神经元,即在成年CNS 仍有神经发生(neurogenesis),神经干细胞存在于包括人在内的所有哺乳动物的成熟的神经系统内,海马是一个重要的神经发生区域,也是与学习和记忆有关的重要脑区。
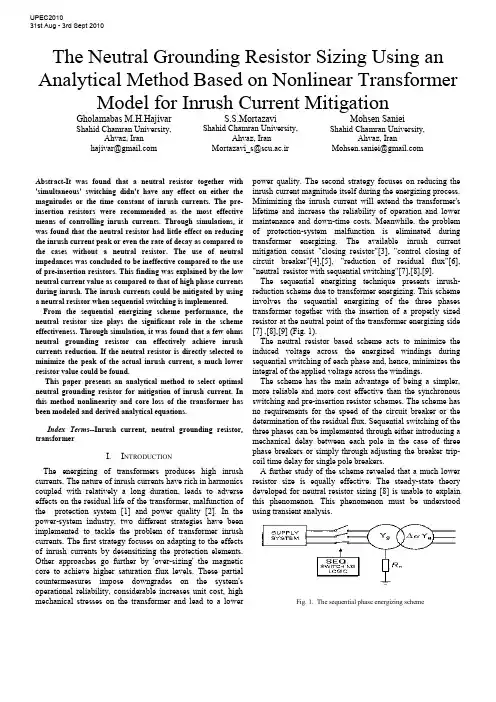
The Neutral Grounding Resistor Sizing Using an Analytical Method Based on Nonlinear Transformer Model for Inrush Current MitigationGholamabas M.H.Hajivar Shahid Chamran University,Ahvaz, Iranhajivar@S.S.MortazaviShahid Chamran University,Ahvaz, IranMortazavi_s@scu.ac.irMohsen SanieiShahid Chamran University,Ahvaz, IranMohsen.saniei@Abstract-It was found that a neutral resistor together with 'simultaneous' switching didn't have any effect on either the magnitudes or the time constant of inrush currents. The pre-insertion resistors were recommended as the most effective means of controlling inrush currents. Through simulations, it was found that the neutral resistor had little effect on reducing the inrush current peak or even the rate of decay as compared to the cases without a neutral resistor. The use of neutral impedances was concluded to be ineffective compared to the use of pre-insertion resistors. This finding was explained by the low neutral current value as compared to that of high phase currents during inrush. The inrush currents could be mitigated by using a neutral resistor when sequential switching is implemented. From the sequential energizing scheme performance, the neutral resistor size plays the significant role in the scheme effectiveness. Through simulation, it was found that a few ohms neutral grounding resistor can effectively achieve inrush currents reduction. If the neutral resistor is directly selected to minimize the peak of the actual inrush current, a much lower resistor value could be found.This paper presents an analytical method to select optimal neutral grounding resistor for mitigation of inrush current. In this method nonlinearity and core loss of the transformer has been modeled and derived analytical equations.Index Terms--Inrush current, neutral grounding resistor, transformerI.I NTRODUCTIONThe energizing of transformers produces high inrush currents. The nature of inrush currents have rich in harmonics coupled with relatively a long duration, leads to adverse effects on the residual life of the transformer, malfunction of the protection system [1] and power quality [2]. In the power-system industry, two different strategies have been implemented to tackle the problem of transformer inrush currents. The first strategy focuses on adapting to the effects of inrush currents by desensitizing the protection elements. Other approaches go further by 'over-sizing' the magnetic core to achieve higher saturation flux levels. These partial countermeasures impose downgrades on the system's operational reliability, considerable increases unit cost, high mechanical stresses on the transformer and lead to a lower power quality. The second strategy focuses on reducing the inrush current magnitude itself during the energizing process. Minimizing the inrush current will extend the transformer's lifetime and increase the reliability of operation and lower maintenance and down-time costs. Meanwhile, the problem of protection-system malfunction is eliminated during transformer energizing. The available inrush current mitigation consist "closing resistor"[3], "control closing of circuit breaker"[4],[5], "reduction of residual flux"[6], "neutral resistor with sequential switching"[7],[8],[9].The sequential energizing technique presents inrush-reduction scheme due to transformer energizing. This scheme involves the sequential energizing of the three phases transformer together with the insertion of a properly sized resistor at the neutral point of the transformer energizing side [7] ,[8],[9] (Fig. 1).The neutral resistor based scheme acts to minimize the induced voltage across the energized windings during sequential switching of each phase and, hence, minimizes the integral of the applied voltage across the windings.The scheme has the main advantage of being a simpler, more reliable and more cost effective than the synchronous switching and pre-insertion resistor schemes. The scheme has no requirements for the speed of the circuit breaker or the determination of the residual flux. Sequential switching of the three phases can be implemented through either introducing a mechanical delay between each pole in the case of three phase breakers or simply through adjusting the breaker trip-coil time delay for single pole breakers.A further study of the scheme revealed that a much lower resistor size is equally effective. The steady-state theory developed for neutral resistor sizing [8] is unable to explain this phenomenon. This phenomenon must be understood using transient analysis.Fig. 1. The sequential phase energizing schemeUPEC201031st Aug - 3rd Sept 2010The rise of neutral voltage is the main limitation of the scheme. Two methods present to control the neutral voltage rise: the use of surge arrestors and saturated reactors connected to the neutral point. The use of surge arresters was found to be more effective in overcoming the neutral voltage rise limitation [9].The main objective of this paper is to derive an analytical relationship between the peak of the inrush current and the size of the resistor. This paper presents a robust analytical study of the transformer energizing phenomenon. The results reveal a good deal of information on inrush currents and the characteristics of the sequential energizing scheme.II. SCHEME PERFORMANCESince the scheme adopts sequential switching, each switching stage can be investigated separately. For first-phase switching, the scheme's performance is straightforward. The neutral resistor is in series with the energized phase and this resistor's effect is similar to a pre-insertion resistor.The second- phase energizing is one of the most difficult to analyze. Fortunately, from simulation studies, it was found that the inrush current due to second-phase energizing is lower than that due to first-phase energizing for the same value of n R [9]. This result is true for the region where the inrush current of the first-phase is decreasing rapidly as n R increases. As a result, when developing a neutral-resistor-sizing criterion, the focus should be directed towards the analysis of the first-phase energizing.III. A NALYSIS OF F IRST -P HASE E NERGIZING The following analysis focuses on deriving an inrush current waveform expression covering both the unsaturatedand saturated modes of operation respectively. The presented analysis is based on a single saturated core element, but is suitable for analytical modelling of the single-phase transformers and for the single-phase switching of three-phase transformers. As shown in Fig. 2, the transformer's energized phase was modeled as a two segmented saturated magnetizing inductance in series with the transformer's winding resistance, leakage inductance and neutral resistance. The iron core non-l inear inductance as function of the operating flux linkages is represented as a linear inductor inunsaturated ‘‘m l ’’ and saturated ‘‘s l ’’ modes of operation respectively. (a)(b)Fig. 2. (a) Transformer electrical equivalent circuit (per-phase) referred to the primary side. (b) Simplified, two slope saturation curve.For the first-phase switching stage, the equivalent circuit represented in Fig. 2(a) can accurately represent behaviour of the transformer for any connection or core type by using only the positive sequence Flux-Current characteristics. Based on the transformer connection and core structure type, the phases are coupled either through the electrical circuit (3 single phase units in Yg-D connection) or through the Magnetic circuit (Core type transformers with Yg-Y connection) or through both, (the condition of Yg-D connection in an E-Core or a multi limb transformer). The coupling introduced between the windings will result in flux flowing through the limbs or magnetic circuits of un-energized phases. For the sequential switching application, the magnetic coupling will result in an increased reluctance (decreased reactance) for zero sequence flux path if present. The approach presented here is based on deriving an analytical expression relating the amount of inrush current reduction directly to the neutral resistor size. Investigation in this field has been done and some formulas were given to predict the general wave shape or the maximum peak current.A. Expression for magnitude of inrush currentIn Fig. 2(a), p r and p l present the total primary side resistance and leakage reactance. c R shows the total transformer core loss. Secondary side resistance sp r and leakage reactance sp l as referred to primary side are also shown. P V and s V represent the primary and secondary phase to ground terminal voltages, respectively.During first phase energizing, the differential equation describing behaviour of the transformer with saturated ironcore can be written as follows:()())sin((2) (1)φω+⋅⋅=⋅+⋅+⋅+=+⋅+⋅+=t V (t)V dtdi di d λdt di l (t)i R r (t)V dt d λdt di l (t)i R r (t)V m P ll p pp n p P p p p n p PAs the rate of change of the flux linkages with magnetizing current dt d /λcan be represented as an inductance equal to the slope of the i −λcurve, (2) can be re-written as follows;()(3) )()()(dtdi L dt di l t i R r t V lcore p p P n p P ⋅+⋅+⋅+=λ (4) )()(L core l p c l i i R dtdi−⋅=⋅λ⎩⎨⎧==sml core L L di d L λλ)(s s λλλλ>≤The general solution of the differential equations (3),(4) has the following form;⎪⎩⎪⎨⎧>−⋅⋅+−⋅+−−⋅+≤−⋅⋅+−⋅+−⋅=(5) )sin(//)()( )sin(//)(s s 22222221211112121111λλψωττλλψωττt B t e A t t e i A t B t e A t e A t i s s pSubscripts 11,12 and 21,22 denote un-saturated and saturated operation respectively. The parameters given in the equation (5) are given by;() )(/12221σ⋅++⎟⎟⎠⎞⎜⎜⎝⎛⋅−++⋅=m p c p m n p c m m x x R x x R r R x V B()2222)(/1σ⋅++⎟⎟⎠⎞⎜⎜⎝⎛⋅−++⋅=s p c p s n p c s m x x R x x R r R x V B⎟⎟⎟⎟⎟⎠⎞⎜⎜⎜⎜⎜⎝⎛⋅−+++=⋅−−⎟⎟⎟⎠⎞⎜⎜⎜⎝⎛−c p m n p m p c m R x x R r x x R x σφψ111tan tan ⎟⎟⎟⎟⎟⎠⎞⎜⎜⎜⎜⎜⎝⎛⋅−+++=⋅−−⎟⎟⎟⎠⎞⎜⎜⎜⎝⎛−c p s n p s p c m R R r x x R x σφψ112tan tan )sin(111211ψ⋅=+B A A )sin(222221s t B A A ⋅−⋅=+ωψ mp n p m p m p m p c xx R r x x x x x x R ⋅⋅+⋅−⋅+−⋅+⋅⋅⋅=)(4)()(21211σστm p n p m p m p m p c xx R r x x x x x x R ⋅⋅+⋅−⋅++⋅+⋅⋅⋅=)(4)()(21212σστ s p n p s p s p s p xx R r x x x x x x c R ⋅⋅+⋅−⋅+−⋅+⋅⋅⋅=)(4)()(21221σστ sp n p s p s p sp c xx R r x x x x x x R ⋅⋅+⋅−⋅++⋅+⋅⋅⋅=)(4)()(21222σστ ⎟⎟⎠⎞⎜⎜⎝⎛−⋅==s rs s ri i λλλ10 cnp R R r ++=1σ21221112 , ττττ>>>>⇒>>c R , 012≈A , 022≈A According to equation (5), the required inrush waveform assuming two-part segmented i −λcurve can be calculated for two separate un-saturated and saturated regions. For thefirst unsaturated mode, the current can be directly calculated from the first equation for all flux linkage values below the saturation level. After saturation is reached, the current waveform will follow the second given expression for fluxlinkage values above the saturation level. The saturation time s t can be found at the time when the current reaches the saturation current level s i .Where m λ,r λ,m V and ωare the nominal peak flux linkage, residual flux linkage, peak supply voltage and angular frequency, respectivelyThe inrush current waveform peak will essentially exist during saturation mode of operation. The focus should be concentrated on the second current waveform equation describing saturated operation mode, equation (5). The expression of inrush current peak could be directly evaluated when both saturation time s t and peak time of the inrush current waveform peak t t =are known [9].(10))( (9) )(2/)(222222121//)()(2B eA t e i A peak peak t s t s n peak n n peak R I R R t +−⋅+−−⋅+=+=ττωψπThe peak time peak t at which the inrush current will reachits peak can be numerically found through setting the derivative of equation (10) with respect to time equal to zero at peak t t =.()(11) )sin(/)(022222221212221/ψωωττττ−⋅⋅⋅−−−⋅+−=+−⋅peak t s t B A t te A i peak s peakeThe inrush waveform consists of exponentially decaying'DC' term and a sinusoidal 'AC' term. Both DC and AC amplitudes are significantly reduced with the increase of the available series impedance. The inrush waveform, neglecting the relatively small saturating current s i ,12A and 22A when extremely high could be normalized with respect to theamplitude of the sinusoidal term as follows; (12) )sin(/)()(2221221⎥⎦⎤⎢⎣⎡−⋅+−−⋅⋅=ψωτt t t e B A B t i s p(13) )sin(/)()sin()( 22221⎥⎦⎤⎢⎣⎡−⋅+−−⋅⋅−⋅=ψωτωψt t t e t B t i s s p ))(sin()( 2s n n t R R K ⋅−=ωψ (14) ωλλλφλφωλλφωmm m r s s t r m s mV t dt t V dtd t V V s=⎪⎭⎪⎬⎫⎪⎩⎪⎨⎧⎥⎥⎦⎤⎢⎢⎣⎡⎟⎟⎠⎞⎜⎜⎝⎛−−+−⋅=+⋅+⋅⋅==+⋅⋅=−∫(8) 1cos 1(7))sin((6))sin(10The factor )(n R K depends on transformer saturation characteristics (s λand r λ) and other parameters during saturation.Typical saturation and residual flux magnitudes for power transformers are in the range[9]; .).(35.1.).(2.1u p u p s <<λ and .).(9.0.).(7.0u p r u p <<λIt can be easily shown that with increased damping 'resistance' in the circuit, where the circuit phase angle 2ψhas lower values than the saturation angle s t ⋅ω, the exponential term is negative resulting in an inrush magnitude that is lowerthan the sinusoidal term amplitude.B. Neutral Grounding Resistor SizingBased on (10), the inrush current peak expression, it is now possible to select a neutral resistor size that can achieve a specific inrush current reduction ratio )(n R α given by:(15) )0(/)()(==n peak n peak n R I R I R α For the maximum inrush current condition (0=n R ), the total energized phase system impedance ratio X/R is high and accordingly, the damping of the exponential term in equation (10) during the first cycle can be neglected; [][](16))0(1)0()0(2212=⋅++⎥⎦⎤⎢⎣⎡⋅−+===⎟⎟⎠⎞⎜⎜⎝⎛+⋅⋅n s p c p s pR x n m n peak R x x R x x r R K V R I c s σ High n R values leading to considerable inrush current reduction will result in low X / R ratios. It is clear from (14) that X / R ratios equal to or less than 1 ensure negative DC component factor ')(n R K ' and hence the exponential term shown in (10) can be conservatively neglected. Accordingly, (10) can be re-written as follows;()[](17) )()(22122n s p c p s n p R x m n n peak R x x R x x R r V R B R I c s σ⋅++⎥⎦⎤⎢⎣⎡⋅−+=≈⎟⎟⎠⎞⎜⎜⎝⎛+⋅Using (16) and (17) to evaluate (15), the neutral resistorsize which corresponds to a specific reduction ratio can be given by;[][][](18) )0()(1)0( 12222=⋅++⋅−⋅++⋅−+⋅+=⎥⎥⎦⎤⎢⎢⎣⎡⎥⎥⎦⎤⎢⎢⎣⎡=n s p c p s p n s p c p s n p n R x x R x x r R x x R x x R r R K σσα Very high c R values leading to low transformer core loss, it can be re-written equation (18) as follows [9]; [][][][](19) 1)0(12222s p p s p n p n x x r x x R r R K +++++⋅+==α Equations (18) and (19) reveal that transformers require higher neutral resistor value to achieve the desired inrush current reduction rate. IV. A NALYSIS OF SECOND-P HASE E NERGIZING It is obvious that the analysis of the electric and magnetic circuit behavior during second phase switching will be sufficiently more complex than that for first phase switching.Transformer behaviour during second phase switching was served to vary with respect to connection and core structure type. However, a general behaviour trend exists within lowneutral resistor values where the scheme can effectively limitinrush current magnitude. For cases with delta winding or multi-limb core structure, the second phase inrush current is lower than that during first phase switching. Single phase units connected in star/star have a different performance as both first and second stage inrush currents has almost the same magnitude until a maximum reduction rate of about80% is achieved. V. NEUTRAL VOLTAGE RISEThe peak neutral voltage will reach values up to peak phasevoltage where the neutral resistor value is increased. Typicalneutral voltage peak profile against neutral resistor size is shown in Fig. 6- Fig. 8, for the 225 KVA transformer during 1st and 2nd phase switching. A del ay of 40 (ms) between each switching stage has been considered. VI. S IMULATION A 225 KVA, 2400V/600V, 50 Hz three phase transformer connected in star-star are used for the simulation study. The number of turns per phase primary (2400V) winding is 128=P N and )(01.0pu R R s P ==, )(05.0pu X X s P ==,active power losses in iron core=4.5 KW, average length and section of core limbs (L1=1.3462(m), A1=0.01155192)(2m ), average length and section of yokes (L2=0.5334(m),A2=0.01155192)(2m ), average length and section of air pathfor zero sequence flux return (L0=0.0127(m),A0=0.01155192)(2m ), three phase voltage for fluxinitialization=1 (pu) and B-H characteristic of iron core is inaccordance with Fig.3. A MATLAB program was prepared for the simulation study. Simulation results are shown in Fig.4-Fig.8.Fig. 3.B-H characteristic iron coreFig.4. Inrush current )(0Ω=n RFig.5. Inrush current )(5Ω=n RFig.6. Inrush current )(50Ω=n RFig.7. Maximum neutral voltage )(50Ω=n RFig.8. Maximum neutral voltage ).(5Ω=n RFig.9. Maximum inrush current in (pu), Maximum neutral voltage in (pu), Duration of the inrush current in (s)VII. ConclusionsIn this paper, Based on the sequential switching, presents an analytical method to select optimal neutral grounding resistor for transformer inrush current mitigation. In this method, complete transformer model, including core loss and nonlinearity core specification, has been used. It was shown that high reduction in inrush currents among the three phases can be achieved by using a neutral resistor .Other work presented in this paper also addressed the scheme's main practical limitation: the permissible rise of neutral voltage.VIII.R EFERENCES[1] Hanli Weng, Xiangning Lin "Studies on the UnusualMaloperation of Transformer Differential Protection During the Nonlinear Load Switch-In",IEEE Transaction on Power Delivery, vol. 24, no.4, october 2009.[2] Westinghouse Electric Corporation, Electric Transmissionand Distribution Reference Book, 4th ed. East Pittsburgh, PA, 1964.[3] K.P.Basu, Stella Morris"Reduction of Magnetizing inrushcurrent in traction transformer", DRPT2008 6-9 April 2008 Nanjing China.[4] J.H.Brunke, K.J.Frohlich “Elimination of TransformerInrush Currents by Controlled Switching-Part I: Theoretical Considerations” IEEE Trans. On Power Delivery, Vol.16,No.2,2001. [5] R. Apolonio,J.C.de Oliveira,H.S.Bronzeado,A.B.deVasconcellos,"Transformer Controlled Switching:a strategy proposal and laboratory validation",IEEE 2004, 11th International Conference on Harmonics and Quality of Power.[6] E. Andersen, S. Bereneryd and S. Lindahl, "SynchronousEnergizing of Shunt Reactors and Shunt Capacitors," OGRE paper 13-12, pp 1-6, September 1988.[7] Y. Cui, S. G. Abdulsalam, S. Chen, and W. Xu, “Asequential phase energizing method for transformer inrush current reduction—part I: Simulation and experimental results,” IEEE Trans. Power Del., vol. 20, no. 2, pt. 1, pp. 943–949, Apr. 2005.[8] W. Xu, S. G. Abdulsalam, Y. Cui, S. Liu, and X. Liu, “Asequential phase energizing method for transformer inrush current reduction—part II: Theoretical analysis and design guide,” IEEE Trans. Power Del., vol. 20, no. 2, pt. 1, pp. 950–957, Apr. 2005.[9] S.G. Abdulsalam and W. Xu "A Sequential PhaseEnergization Method for Transformer Inrush current Reduction-Transient Performance and Practical considerations", IEEE Transactions on Power Delivery,vol. 22, No.1, pp. 208-216,Jan. 2007.。
A Facial Aging Simulation Method Using flaccidity deformation criteriaAlexandre Cruz Berg Lutheran University of Brazil.Dept Computer ScienceRua Miguel Tostes, 101. 92420-280 Canoas, RS, Brazil berg@ulbra.tche.br Francisco José Perales LopezUniversitat les Illes Balears.Dept Mathmatics InformaticsCtra Valldemossa, km 7,5E-07071 Palma MallorcaSpainpaco.perales@uib.esManuel GonzálezUniversitat les Illes Balears.Dept Mathmatics InformaticsCtra Valldemossa, km 7,5E-07071 Palma MallorcaSpainmanuel.gonzales@uib.esAbstractDue to the fact that the aging human face encompasses skull bones, facial muscles, and tissues, we render it using the effects of flaccidity through the observation of family groups categorized by sex, race and age. Considering that patterns of aging are consistent, facial ptosis becomes manifest toward the end of the fourth decade. In order to simulate facial aging according to these patterns, we used surfaces with control points so that it was possible to represent the effect of aging through flaccidity. The main use of these surfaces is to simulate flaccidity and aging consequently.1.IntroductionThe synthesis of realistic virtual views remains one of the central research topics in computer graphics. The range of applications encompasses many fields, including: visual interfaces for communications, integrated environments of virtual reality, as well as visual effects commonly used in film production.The ultimate goal of the research on realistic rendering is to display a scene on a screen so that it appears as if the object exists behind the screen. This description, however, is somewhat ambiguous and doesn't provide a quality measure for synthesized images. Certain areas, such as plastic surgery, need this quality evaluation on synthesized faces to make sure how the patient look like and more often how the patient will look like in the future. Instead, in computer graphics and computer vision communities, considerable effort has been put forthto synthesize the virtual view of real or imaginary scenes so that they look like the real scenes.Much work that plastic surgeons put in this fieldis to retard aging process but aging is an inevitable process. Age changes cause major variations in the appearance of human faces [1]. Some aspects of aging are uncontrollable and are based on hereditary factors; others are somewhat controllable, resulting from many social factors including lifestyle, among others [2].1.1.Related WorkMany works about aging human faces have been done. We can list some related work in the simulation of facial skin deformation [3].One approach is based on geometric models, physically based models and biomechanical models using either a particle system or a continuous system.Many geometrical models have been developed, such as parametric model [4] and geometric operators [5]. The finite element method is also employed for more accurate calculation of skin deformation, especially for potential medical applications such as plastic surgery [6]. Overall, those works simulate wrinkles but none of them have used flaccidity as causing creases and aging consequently.In this work is presented this effort in aging virtual human faces, by addressing the synthesis of new facial images of subjects for a given target age.We present a scheme that uses aging function to perform this synthesis thru flaccidity. This scheme enforces perceptually realistic images by preserving the identity of the subject. The main difference between our model and the previous ones is that we simulate increase of fat and muscular mass diminish causing flaccidity as one responsible element for the sprouting of lines and aging human face.In the next section will plan to present the methodology. Also in section 3, we introduce the measurements procedure, defining structural alterations of the face. In section 4, we present a visual facial model. We describe age simulation thrua deformation approach in section 5. In the last section we conclude the main results and future work.2.MethodologyA methodology to model the aging of human face allows us to recover the face aging process. This methodology consists of: 1) defining the variations of certain face regions, where the aging process is perceptible; 2) measuring the variations of those regions for a period of time in a group of people and finally 3) making up a model through the measurements based on personal features.That could be used as a standard to a whole group in order to design aging curves to the facial regions defined.¦njjjpVM2.1Mathematical Background and AnalysisHuman society values beauty and youth. It is well known that the aging process is influenced by several parameters such: feeding, weight, stress level, race, religious factors, genetics, etc. Finding a standard set of characteristics that could possibly emulate and represent the aging process is a difficult proposition.This standard set was obtained through a mathematical analysis of some face measurements in a specific group of people, whose photographs in different ages were available [7]. To each person in the group, there were, at least, four digitized photographs. The oldest of them was taken as a standard to the most recent one. Hence, some face alterations were attained through the passing of time for the same person.The diversity of the generated data has led to the designing of a mathematical model, which enabled the acquiring of a behavior pattern to all persons of the same group, as the form of a curve defined over the domain [0,1] in general, in order to define over any interval [0,Į] for an individual face. The unknown points Įi are found using the blossoming principle [8] to form the control polygon of that face.The first step consisted in the selection of the group to be studied. Proposing the assessment of the face aging characteristics it will be necessary to have a photographic follow-up along time for a group of people, in which their face alterations were measurable.The database used in this work consisted of files of patients who were submitted to plastic surgery at Medical Center Praia do Guaíba, located in Porto Alegre, Brazil.3.MeasurementsAccording to anatomic principles [9] the vectors of aging can be described aswhich alter the position and appearance of key anatomic structures of the face as can be shown in figure 1 which compares a Caucasian mother age 66 (left side) with her Caucasian daughters, ages 37 (right above) and 33 (right below) respectively.Figure 1 - Observation of family groupsTherefore, basic anatomic and surgical principles must be applied when planning rejuvenative facial surgery and treating specific problems concomitantwith the aging process.4.Visual Facial ModelThe fact that human face has an especially irregular format and interior components (bones, muscles and fabrics) to possess a complex structure and deformations of different face characteristics of person to person, becomes the modeling of the face a difficult task. The modeling carried through in the present work was based on the model, where the mesh of polygons corresponds to an elastic mesh, simulating the dermis of the face. The deformations in this mesh, necessary to simulate the aging curves, are obtained through the displacement of the vertexes, considering x(t) as a planar curve, which is located within the (u,v ) unit square. So, we can cover the square with a regular grid of points b i,j =[i/m,j/n]T ; i=0,...,m; j=0,...,n. leading to every point (u,v ) asfrom the linear precision property of Bernstein polynomials. Using comparisons with parents we can distort the grid of b i,j into a grid b'i,j , the point (u,v )will be mapped to a point (u',v') asIn order to construct our 3D mesh we introduce the patch byAs the displacements of the vertexes conform to the certain measures gotten through curves of aging and no type of movement in the face is carried through, the parameters of this modeling had been based on the conformation parameter.4.1Textures mappingIn most cases the result gotten in the modeling of the face becomes a little artificial. Using textures mapping can solve this problem. This technique allows an extraordinary increase in the realism of the shaped images and consists of applying on the shaped object, existing textures of the real images of the object.In this case, to do the mapping of an extracted texture of a real image, it is necessary that the textureaccurately correspond to the model 3D of that is made use [9].The detected feature points are used for automatic texture mapping. The main idea of texture mapping is that we get an image by combining two orthogonal pictures in a proper way and then give correct texture coordinates of every point on a head.To give a proper coordinate on a combined image for every point on a head, we first project an individualized 3D head onto three planes, the front (x, y), the left (y, z) and the right (y, z) planes. With the information of feature lines, which are used for image merging, we decide on which plane a 3D-head point on is projected.The projected points on one of three planes arethen transferred to one of feature points spaces suchas the front and the side in 2D. Then they are transferred to the image space and finally to the combined image space.The result of the texture mapping (figure 2) is excellent when it is desired to simulate some alteration of the face that does not involve a type of expression, as neutral. The picture pose must be the same that the 3D scanned data.¦¦¦ mi nj lk n j m i lk k j i w B v B u B b w v u 000,,)()()(')',','(¦¦ m i nj n jmij i v B u B b v u 00,)()(),(¦¦ m i nj n j m i j i v B u B b v u 00,)()(')','(¦¦¦ mi nj lk n j m i lk k j i w B v B u B b w v u 000,,)()()(')',','(Figure 2 - Image shaped with texturemapping5.Age SimulationThis method involves the deformation of a face starting with control segments that define the edges of the faces, as¦¦¦ mi nj lk n j m i lk k j i w B v B u B b w v u 000,,)()()(')',','(Those segments are defined in the original face and their positions are changed to a target face. From those new positions the new position of each vertex in the face is determined.The definition of edges in the face is a fundamental step, since in that phase the applied aging curves are selected. Hence, the face is divided in influencing regions according to their principal edges and characteristics.Considering the face morphology and the modeling of the face aging developed [10], the face was divided in six basic regions (figure 3).The frontal region (1) is limited by the eyelids and the forehead control lines. The distance between these limits enlarges with forward aging.The orbitary region (2) is one of the most important aging parameters because a great number of wrinkles appears and the palpebral pouch increases [11]. In nasal region (3) is observed an enlargement of its contour.The orolabial region (4) is defined by 2 horizontal control segments bounding the upper and lower lips and other 2 segments that define the nasogenian fold. Figure 3 - Regions considering the agingparametersThe lips become thinner and the nasogenian fold deeper and larger. The mental region (5) have 8 control segments that define the low limit of the face and descend with aging. In ear curve (6) is observed an enlargement of its size. The choice of feature lines was based in the characteristic age points in figure 6.The target face is obtained from the aging curves applied to the source face, i.e., with the new control segment position, each vertex of the new image has its position defined by the corresponding vertex in the target face. This final face corresponds to the face in the new age, which was obtained through the application of the numerical modeling of the frontal face aging.The definition of the straight-line segment will control the aging process, leading to a series of tests until the visual result was adequate to the results obtained from the aging curves. The extremes of the segments are interpolated according to the previously defined curves, obtained by piecewise bilinear interpolation [12].Horizontal and vertical orienting auxiliary lines were defined to characterize the extreme points of the control segments (figure 4). Some points, that delimit the control segments, are marked from the intersection of the auxiliary lines with the contour of the face, eyebrow, superior part of the head and the eyes. Others are directly defined without the use of auxiliary lines, such as: eyelid hollow, eyebrow edges, subnasion, mouth, nasolabial wrinkle andnose sides.Figure 4 - Points of the control segmentsOnce the control segments characterize the target image, the following step of the aging process can be undertaken, corresponding to the transformations of the original points to the new positions in the target image. The transformations applied to the segments are given by the aging curves, presented in section 4.In the present work the target segments are calculated by polynomial interpolations, based on parametric curves [12].5.1Deformation approachThe common goal of deformation models is to regulate deformations of a geometric model by providing smoothness constraints. In our age simulation approach, a mesh-independent deformation model is proposed. First, connected piece-wise 3D parametric volumes are generated automatically from a given face mesh according to facial feature points.These volumes cover most regions of a face that can be deformed. Then, by moving the control pointsof each volume, face mesh is deformed. By using non-parallel volumes [13], irregular 3D manifolds are formed. As a result, smaller number of deformvolumes are necessary and the number of freedom incontrol points are reduced. Moreover, based on facialfeature points, this model is mesh independent,which means that it can be easily adopted to deformany face model.After this mesh is constructed, for each vertex on the mesh, it needs to be determined which particularparametric volume it belongs to and what valueparameters are. Then, moving control points ofparametric volumes in 3D will cause smooth facialdeformations, generating facial aging throughflaccidity, automatically through the use of the agingparameters. This deformation is written in matricesas , where V is the nodal displacements offace mesh, B is the mapping matrix composed ofBernstein polynomials, and E is the displacementvector of parametric volume control nodes.BE V Given a quadrilateral mesh of points m i,j ,, we define acontinuous aged surface via a parametricinterpolation of the discretely sampled similaritiespoints. The aged position is defined via abicubic polynomial interpolation of the form with d m,n chosen to satisfy the known normal and continuity conditions at the sample points x i,j .>@>M N j i ,...,1,...,1),(u @@>@>1,,1,),,( j j v i i u v u x ¦3,,),(n m n m n m v u d v u x An interactive tool is programmed to manipulate control points E to achieve aged expressions making possible to simulate aging through age ranges. Basic aged expression units are orbicularis oculi, cheek, eyebrow, eyelid, region of chin, and neck [14]. In general, for each segment, there is an associated transformation, whose behavior can be observed by curves. The only segments that do not suffer any transformation are the contour of the eyes and the superior side of the head.5.2Deformation approachThe developed program also performs shape transformations according to the created aging curves, not including any quantification over the alterations made in texture and skin and hair color. Firstly, in the input model the subjects are required to perform different ages, as previouslymentioned, the first frame needs to be approximately frontal view and with no expression.Secondly, in the facial model initialization, from the first frame, facial features points are extracted manually. The 3D fitting algorithm [15] is then applied to warp the generic model for the person whose face is used. The warping process and from facial feature points and their norms, parametric volumes are automatically generated.Finally, aging field works to relieve the drifting problem in template matching algorithm, templates from the previous frame and templates from the initial frame are applied in order to combine the aging sequence. Our experiments show that this approach is very effective. Despite interest has been put in presenting a friendly user interface, we have to keep in mind that the software system is research oriented. In this kind of applications an important point is the flexibility to add and remove test facilities. 6.Results The presented results in the following figuresrefer to the emulations made on the frontalphotographs, principal focus of this paper, with theobjective to apply the developed program to otherpersons outside the analyzed group. The comparisonswith other photographs of the tested persons dependon their quality and on the position in which theywere taken. An assessment was made of the new positions, of the control segments. It consisted in: after aging a face, from the first age to the second one, through the use of polynomial interpolation of the control segments in the models in the young age, the new positions are then compared with the ones in the model of a relative of older age (figure 5). The processed faces were qualitatively compared with theperson’s photograph at the same age. Figure 5 - Synthetic young age model,region-marked model and aged modelAlso the eyelid hollow, very subtle falling of the eyebrow, thinning of the lips with the enlarging of the nasion and the superior part of the lip, enlargingof the front and changing in the nasolabial wrinkle.7.ConclusionsModelling biological phenomena is a great deal of work, especially when the biggest part of the information about the subject involves only qualitative data. Thus, this research developed had has a challenge in the designing of a model to represent the face aging from qualitative data.Due to its multi-disciplinary character, the developed methodology to model and emulate the face aging involved the study of several other related fields, such as medicine, computing, statistics and mathematics.The possibilities opened by the presented method and some further research on this field can lead to new proposals of enhancing the current techniques of plastic face surgery. It is possible to suggest the ideal age to perform face lifting. Once the most affected aging regions are known and how this process occurs over time. Also missing persons can be recognized based on old photographs using this technique. AcknowledgementsThe project TIN2004-07926 of Spanish Government have subsidized this work.8. References[1] Burt, D. M. et al., Perc. age in adult Caucasianmale faces, in Proc. R. Soc., 259, pp 137-143,1995.[2] Berg, A C. Aging of Orbicularis Muscle inVirtual Human Faces. IEEE 7th InternationalConference on Information Visualization, London, UK, 2003a.[3] Beier , T., S. Neely, Feature-based imagemetamorphosis, In Computer Graphics (Proc.SIGGRAPH), pp. 35-42, 1992.[4] Parke, F. I. P arametrized Models for FacialAnimation, IEEE Computer & Graphics Applications, Nov. 1982.[5] Waters, K.; A Muscle Model for Animating ThreeDimensional Facial Expression. Proc SIGGRAPH'87,Computer Graphics, Vol. 21, Nº4, United States, 1987. [6] Koch, R.M. et alia.. Simulation Facial SurgeryUsing Finite Element Models, Proceedings of SIGGRAPH'96, Computer Graphics, 1996.[7] Kurihara, Tsuneya; Kiyoshi Arai, ATransformation Method for Modeling and Animation of the Human Face from Photographs, Computer Animatio n, Springer-Verlag Tokyo, pp.45-58, 1991.[8] Kent, J., W. Carlson , R. Parent, ShapeTransformation for Polygon Objects, In Computer Graphics (Proc. SIGGRAPH), pp. 47-54, 1992. [9] Sorensen, P., Morphing Magic, in ComputerGraphics World, January 1992.[10]Pitanguy, I., Quintaes, G. de A., Cavalcanti, M.A., Leite, L. A. de S., Anatomia doEnvelhecimento da Face, in Revista Brasileira deCirurgia, Vol 67, 1977.[11]Pitanguy, I., F. R. Leta, D. Pamplona, H. I.Weber, Defining and measuring ageing parameters, in Applied Mathematics and Computation , 1996.[12]Fisher, J.; Lowther, J.; Ching-Kuang S. Curveand Surface Interpolation and Approximation: Knowledge Unit and Software Tool. ITiCSE’04,Leeds, UK June 28–30, 2004.[13]Lerios, A. et al., Feature-Based VolumeMetamorphosis, in SIGGRAPH 95 - Proceedings,pp 449-456, ACM Press, N.Y, 1995.[14]Berg, A C. Facial Aging in a VirtualEnvironment. Memória de Investigación, UIB, Spain, 2003b.[15]Hall, V., Morphing in 2-D and 3-D, in Dr.Dobb's Journal, July 1993.。

医学考博英语:影像X射线常用词汇医学考博词汇不仅在医学考博英语中会用到,平时大家写论文时也经常需要熟悉其含义,新东方在线考博频道将各类医学考博英语常用词汇进行分类,希望考生们平日多累积记忆。
一、肺Lung清晰clear肺门阴影增大enlargement of hilar shadows肺纹理增粗increase of lung markings钙化灶calcified空洞cavitation球形病灶circular lesion (coin lesion)小块阴影区a minimal area of density散状的点(片)状阴影scattered spot (plaque-like) shadows边界不清的片状阴影a poorly defined patchy density圆形致密影a round density胸膜增厚pleural thickening肋膈角模糊(变钝、消失)haziness (blunting, obliteration) of the costophrenic angle横膈抬高、活动受限elevation of diaphragm with limitation of movement包裹性胸腔积液encapsulated pleural effusion液气胸hydropneumothorax纵膈移位mediastinal displacement肺门模糊hilar haze肺门密度增高increase of pulmonary hilar density肺淤血(栓塞) pulmonary venous stasis (infarction)阴影性状shadow淡的haziness云雾状clouding线装streaky絮状patcky结节状nodular块状massive粟粒状miliary融合状confluent均匀的homogeneous二、心脏Heart左(右)房(室)增大left (right) atrial (ventricular) enlargement 主动脉屈曲延长 a tortuous and prolonged aorta主动脉型(二尖瓣型)心脏“aortic type”(“mitral valve”) heart 肺动脉段突出bulging pulmonary artery segment肺动脉扩张a dilatation of the pulmonary artery心影普遍增大general enlargement of the heart shadow左(右)心室增大left(right) ventricular enlargement左(右)心房增大left(right) atrial dilatation靴形心脏boot-shaped heart主动脉钙化calcification of aorta心腰部waist of heart垂位(狭长形;无力形;横位;斜位)心vertical (slender; asthenic; horizontal; oblique) heart三、腹部平片KUB film结石calculus钙化影calcified shadow阶梯型液平fluid levels with stepladder pattern液气平面gas-fluid level膈下游离气体subphrenic free air四、胃肠道钡剂检查barium enema examination胃肠造影gastroenterography双重对比造影double contrast radiography食管蠕动征esophageal peristalsis sign十二指肠曲(压迹)duodenal flexure(impression)小肠黏膜皱襞影mucosal fold shadow of small intestine结肠蠕动与排空征peristalsis and empting signs of colon胃排空时间延长delayed gastric emptying time胃空腹潴留液fasting retention of stomach充盈缺损filling defect黏膜皱襞消失disappearance of the mucosal folds张力减低(增高)hypotonicity (hypertonicity)球部激惹现象irritable cap蠕动增强vigorous peristaltic activity (hyperperistalsis)蠕动减弱bradydiastalsis蠕动消失aperistalsis排空加快(减缓) accelerated(reduced) evacuation跳跃现象skipping phenomenon黏膜增宽和迂曲broadened and tortuous mucosal fold黏膜皱襞平坦flat mucosal fold五、胆道bile tract口服胆囊造影oral cholecystography静脉胆管胆囊造影intravenous cholecysto-cholangiography经T形管胆囊造影trans-T-tube cholecystography经皮肝穿刺胆管造影percutaneous transhepatic cholangiography (PTC)胆总管扩张dilated common duct胆囊浓缩功能良好gallbladder concentrated satisfactorily 胆囊显影不好,浓缩功能差gallbladder with faint shadow, concentrated inadequately收缩功能contractibility六、骨骼skeleton骨皮质增厚cortical thickening of bone洋葱皮样改变“onion skin” appearance骨膜反应periosteal reaction骨质疏松osteoporosis (rarefaction)骨化ossification畸形deformity缩短shortening移位displacement脱位luxation半脱位subluxation连接不正malunion青枝骨折greenstick fracture多发性骨折multiple fracture病理性骨折pathological fracture关节间隙joint space椎间隙intervertebral space肋软骨钙化影calcification shadow of costal cartilage骨质软化osteomalacia (osteomalacosis)骨质增生硬化hyperostosis osteosclerosis死骨sequestrum骨质坏死bone necrosis关节肿胀(破坏;退行)swelling (destruction; degeneration) of joint 关节强直ankyloses骨骺分离epiphyseal separation对线良好good alignment对位良好good apposition七、泌尿系统urological system静脉肾盂造影intravenous pyelography (IVP)逆行肾盂造影retrograde pyelography萎缩atrophy移位deformity扭曲distortion充盈缺损filling defect狭窄stricture不透光的(透光的)结石opaque(translucent) stone八、X线检查位置前后位anteroposterior projection后前位postero-anterior(PA) projection侧位lateral projection立位upright position斜位oblique projection右(左)前斜位right(left) anterior oblique(RAO/LAO) projection 前后斜位anteroposterior oblique projection前凸位lordotic position projection轴位axial position头位cranial projection尾位caudal projection。


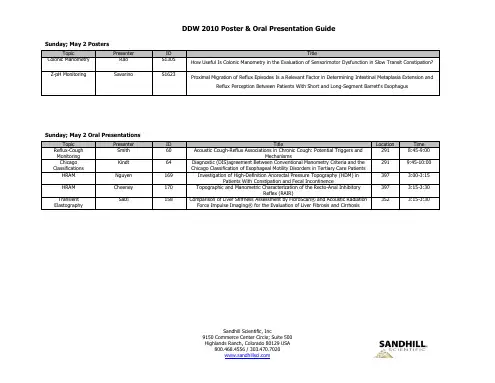
Sandhill Scientific, Inc9150 Commerce Center Circle; Suite 500 Highlands Ranch, Colorado 80129 USASunday; May 2 PostersTopic Presenter ID TitleColonic Manometry Rao S1305 How Useful Is Colonic Manometry in the Evaluation of Sensorimotor Dysfunction in Slow Transit Constipation? Z-pH Monitoring Savarino S1623 Proximal Migration of Reflux Episodes Is a Relevant Factor in Determining Intestinal Metaplasia Extension andReflux Perception Between Patients With Short and Long-Segment Barrett's EsophagusSunday; May 2 Oral PresentationsTopic Presenter ID Title Location TimeReflux-Cough Monitoring Smith 60 Acoustic Cough-Reflux Associations in Chronic Cough: Potential Triggers andMechanisms291 8:45-9:00Chicago Classifications Kindt 64 Diagnostic (DIS)agreement Between Conventional Manometry Criteria and theChicago Classification of Esophageal Motility Disorders in Tertiary Care Patients291 9:45-10:00HRAM Nguyen 169 Investigation of High-Definition Anorectal Pressure Topography (HDM) inPatients With Constipation and Fecal Incontinence397 3:00-3:15HRAM Cheeney 170 Topographic and Manometric Characterization of the Recto-Anal InhibitoryReflex (RAIR)397 3:15-3:30Transient Elastography Salzi 158 Comparison of Liver Stiffness Assessment by FibroScan® and Acoustic RadiationForce Impulse Imaging® for the Evaluation of Liver Fibrosis and Cirrhosis352 3:15-3:30Sandhill Scientific, Inc9150 Commerce Center Circle; Suite 500 Highlands Ranch, Colorado 80129 USAMonday; May 3 PostersTopic Presenter ID TitleZ-pH Monitoring Bredenoord M1143 Quality of Life in Patients With Excessive Supragastric Belching HRIM Leslie M1145 Predicting Bolus Transit Using Esophageal Pressure Topography (Ept) Measures: A Study Using SimultaneousHigh-Resolution Impedance and Manometry HRIM Ghosh M1152 Integrity of Esophageal Emptying in Spasm Patients: A High-Resolution Impedance Manometry Study EFT Pohl M1153 Distal Esophageal Spasm Revisited - Which Spasm Is a Spasm?HRIM Pohl M1154 High Resolution Impedance Manometry Recording During Multiple Rapid Swallows (MRS): A Study in HealthyVolunteersHRM Kumar M1156 Segmental Measurement of Contractile Front Velocity (Cfv) on High-Resolution Manometry (HRM) HRM Abreu M1157 Chicago (CC) Versus Traditional (Tc) Classifications in the Diagnosis of Esophageal Motility Disorders HRM Bansal M1158 Detailed Evaluation of Hiatus Hernia Morphology by High-Resolution ManometryEFT Jung M1162 The Clinical Correlation of Nutcracker Esophagus Motility PatternsEFT Krieger-Grübel M1163 Which Test Should Be Used to Investigate Patients After Treatment for Achalasia?HRM Yazaki M1164 Multiple Rapid Swallowing (MRS) As a Complementary Test During High Resolution Manometry HRM Jadcherla M1200 Effect of Pharyngeal Stimulus on Upper Esophageal Sphincter (UES) and Lower Esophageal Sphincter (LES)During Development in Human Pre-Term Infants HRAM Chumpitazi M1205 Single Center Experience Using High Resolution Anorectal Manometry in ChildrenZ-pH Monitoring Loots M1211 Multichannel Intraluminal Impedance Baseline Values in Infants Before and During Proton Pump InhibitorTherapyZ-pH Monitoring Garza M1212 Nasogastric Feeds Do Not Increase Gastroesophageal Reflux Events in InfantsZ-pH Monitoring Rosen M1213 Does Non-Acid Reflux Affect Quality of Life?HRM Dinning M2038 Simultaneous Multi-Point Measurement of Circumferential and Longitudinal Activity Recorded in IsolatedMammalian Lumen Using a Multimodal Fibre Optic Catheter HRIM Hong M2055 Multiple Intraluminal Impedance (MII) Can Detect Flow Across the Esophago Gastric Junction (EGJ): Validationin Normal SubjectsSandhill Scientific, Inc9150 Commerce Center Circle; Suite 500 Highlands Ranch, Colorado 80129 USAMonday; May 3 Oral PresentationsTopic Presenter ID TitleLocation Time Plenary Hecht Sp307 Presentation of Friedenwald Medal to Donald O. Castell Aud A-B 10:05-10:09 Plenary Furuta Sp311 Eosinophilic Esophagitis: Challenges and Horizons Aud A-B 10:39-10:49 PlenaryInadomiSp316Era of Healthcare Reform: What Is the Impact on GI?Aud A-B11:29-11:39Tuesday; May 4 PostersTopicPresenterIDTitleZ-pH Monitoring Slaughter T1097 Neither SI or SAP Are Reliable Tools for Assessing Symptoms and Reflux EventsZ-pH Monitoring Galindo T1098 Multi-Modality Evaluation of Patients With GERD Symptoms Who Have Failed Empiric PPI TherapyZ-pH Monitoring Hemmink T1100 Computer Analysis of 24-h Esophageal Impedance SignalsZ-pH Monitoring Heard T1101 Wireless “Mini” Multichannel Intraluminal Impedance - pH (MII-pH): What and Where?Z-pH Monitoring Heard T1102 Characterization of Patients With Low Baseline Impedance on Multichannel Intraluminal Impedance - pH (MII-pH) Reflux TestingZ-pH Monitoring Jeon T1105 Comparison of Esophageal pH, Impedance, and High Resolution Manometry in Detecting Reflux After a Meal Z-pH Monitoring Ali T1106 Duration of Reflux Events Is an Important Factor in Induction of Reflux Symptoms in Patients on PPI TherapyZ-pH Monitoring Aravapalli T1107 Influence of Symptom Index Time Windows on Association to Reflux EpisodesZ-pH Monitoring Bayrakci T1108 The Feasibility of 24 Hour Ambulatory Multichannel Intraluminal Impedance in Patients With ProgressiveSystemic SclerosisZ-pH Monitoring Emerenziani T1110 Relationship Between Esophageal Acid Exposure and Symptom Association Probability (SAP) Index in Erosiveand Non-Erosive Reflux Disease PatientsZ-pH Monitoring Arevalo T1111 Nocturnal Heartburn Is Not Common in Patients With GERDZ-pH Monitoring Gunderson T1112 Diagnostic Impact of Impedance-pH Testing in Management of GERD and Laryngopharyngeal Reflux PatientsNot Controlled by Acid SuppressionZ-pH Monitoring Salim T1113 Diagnostic Contribution of 24h Impedance Compared to 24h Oesophageal pH Monitoring: Study on 220Consecutive pH-Impedance in a Tertiary CenterZ-pH Monitoring Savarino T1116 Functional Heartburn and Non-Erosive Reflux Disease: The Added Value of Impedance-pH Monitoring to ROMEIII CriteriaZ-pH Monitoring Savarino T1117 Differences in Reflux Characteristics Can Be Diagnostic in NERD Patients When Symptoms Do Not Occur DuringMII-pH TestingZ-pH MonitoringJungT1119The Comparison of the Discomfort Between Catheter and Catheterless pH TestSandhill Scientific, Inc9150 Commerce Center Circle; Suite 500 Highlands Ranch, Colorado 80129 USAZ-pH Monitoring Gunderson T1121 Impedance-pH Characteristics of 47 Pre-Lung Transplantation PatientsZ-pH Monitoring Ang T1127 A Comparison of Acid and Non-Acid Reflux in the Evaluation of Patients With Typical Versus AtypicalManifestations of Gastroesophageal Reflux Disease: Results From an Asian CohortZ-pH Monitoring Karamanolis T1131 Therapeutic Success in Patients With Non-Cardiac Chest Pain Could Be Predicted Using GERD Parameters onImpedance-pH MonitoringZ-pH Monitoring Vardar T1132 The Impact of the Speed of Food Intake on Intraesophageal Reflux Events in Obese Female PatientsZ-pH Monitoring Leslie T1135 The Complementary Role of Impedance Color Contours for Analysis of Impedance-pH Tracings DuringEsophageal Reflux MonitoringTransient Elastography Mueller T1201 Improved Diagnostic Accuracy of TRANSIENT ELASTOGRAPHY for Cirrhosis Using Histology Plus Clinics As GoldStandardTransientElastographyAdolf T1202 Valsalva and Orthostatic Maneuvers Increase Liver Stiffness (FibroScan®) in Healthy VolunteersTransientElastographySporea T1204 Which Is the Best Noninvasive Ultrasound Method for the Evaluation of Liver Fibrosis?HRAM Anh T1347 High-Definition Manometry Can Predict Damage to External Anal Sphincter & Puborectalis MuscleHRAM Lee T1352 Comparison of High Resolution Anorectal Manometry With Conventional Anorectal Manometry in the Diagnosisof Defecatory Disorder Caused by Pelvic Floor Dysfunction Topic Presenter ID TitleAnorectal Manometry Moreau T1353 Fecal Incontinence in Males: Anal Sphincter Pressure Is Not the AnswerAnorectal Manometry Lam T1356 Anorectal Function Evaluation in Patients With Fecal Incontinence Compared to Patients Without FecalIncontinence: Determination of Predictive Factors for Fecal IncontinenceAnorectal Manometry Papathanasopoulos T1359 Anal Sphincter Responses to Different Patterns of Rectal Distension in Inflammatory Bowel Disease: A Role inFecal IncontinenceZ-pH Monitoring Uyanikoglu T1403 Does Cholecystectomy Increase the Esophageal Alkaline Reflux? Evaluation by Impedance-pH TechniqueZ-pH Monitoring Farré T1678 Evaluation of Esophageal Mucosa Integ rity “In Vivo”. Validation of Basal Intraluminal ImpedanceMeasurements to Assess Non-Erosive Changes Induced by Esophageal Acid Exposure in Rabbit and HealthyHuman SubjectsZ-pH Monitoring Ribolsi T1680 Functional Heartburn Patients Are Characterized by Increased Frequency and Perception of Liquid-Gas andProximal RefluxZ-pH Monitoring Ribolsi T1681 Relevance of the Dynamic Pattern of Reflux Episodes in Non-Erosive Reflux Disease (NERD) Patients With Non-Cardiac Chest PainZ-pH Monitoring Blondeau T1682 Increasing Body Weight Is Associated With a Higher Incidence and Proximal Extent of Reflux in Patients WithGERD Both 'on' and 'off' PPI TherapyZ-pH Monitoring Blondeau T1683 An Increase in Intra-Gastric Pressure Is Associated With a Higher Proximal Extent of Gastroesophageal Refluxin Healthy VolunteersZ-pH Monitoring Woodley T1692 The Association Between Acid Reflux and Cough in Patients With Cystic Fibrosis Is Not Dependent on the Typeof Acid RefluxZ-pH Monitoring Savarino T1695 Reflux Patterns in Patients With Short and Long Segment Barrett's Esophagus, Erosive Esophagitis andControls: A Study Using Impedance-pH MonitoringZ-pH Monitoring Savarino T1696 Reflux Patterns Differ Among Patients With Non-Erosive Reflux Disease (NERD), Hypersensitive Esophagus(HE) and Functional Heartburn (Fh)Z-pH Monitoring Savarino T1701 Is Nonacid Reflux Increased in Cholecystectomized Patients With Typical Reflux Symptoms? a Study UsingImpedance-pH MonitoringSandhill Scientific, Inc9150 Commerce Center Circle; Suite 500 Highlands Ranch, Colorado 80129 USAZ-pH Monitoring Emerenziani T1705 Findings of pH-Impedance Monitoring Improve Prediction of PPI Response in Non Erosive Reflux Disease(NERD) Patients With Typical Symptoms HRIM Hong T1880 Esophageal Emptying and Longitudinal Muscle Contraction in Patients With Achalasia As Defined by HighResolution Manometry, High Frequency Ultrasound (Hfus) and Impedance HRIM Roman T1883 Upper Esophageal Sphincter Relaxation As a Determinant of Reflux and Symptoms During Transient LowerEsophageal Sphincter Relaxation (TLESR)?HRM Roman T1884 High Resolution Manometry Improves Transient Lower Esophageal Relaxations (TLESRs) Detection in HealthyVolunteersHRM McCarthy T1886 The Effect of Body Posture on Esophageal Pressure Topography Subtypes in AchalasiaHRM Rohof T1887 High Resolution Esophageal Topography Is Superior to Conventional Sleeve Manometry for the Detection ofTLESRs Associated With RefluxHRM Bogte T1888 Reproducibility of Esophageal High-Resolution ManometryHRM Sweis T1889 Inclusion of Solid Swallows and a Test Meal Increase the Clinical Utility of High Resolution Manometry inPatients With DysphagiaHRM Sweis T1890 The Effect of 'Physiologic Challenge' on Coordination Between Proximal and Distal Esophageal Contractions inHealthy VolunteersHRM Sweis T1891 Solid Swallows and a Test Meal Increase the Clinical Utility of High Resolution Manometry in PatientsPresenting With Reflux SymptomsTopic Presenter ID TitleHRIM Jung T1901 The Discrepancy Between 2 and 3-Dimensional Impedance Recording Regarding Bolus Clearance: A StudyUsing High-Resolution Impedance ManometryHRM Burdick T1903 High Resolution Manometry (HRM) Reveals Worsening Esophageal Motor Function in Patients With Barrett'sEsophagusEFT Almansa T1905 Manometric Course of Patients With Esophageal SpasmHRIM Fareeduddin T1908 Reflux-Symptom Association and Determinants of Symptom Perception in an Investigator-Monitored Post-Prandial Study Utilizing High Resolution Impedance Manometry (HRIM) and pH Recording HRM Kahrilas T1910 Normalized High Resolution Esophageal Pressure Topography (HREPT) Data: Characterizing Peristalsis inTerms of Neuromuscular PhysiologyHRM Shukla T1911 Ingestion of Carbonated Drinks Decreases Lower Esophageal Sphincter (LES) Pressure and Increases TransientLES RelaxationsEFT Burza T1913 Esophageal Peristaltic Dysfunction in Obese and Overweight Subjects: A Prospective StudyHRM Rommel T1914 Manometric Characteristics of Deglutitive Upper Esophageal Sphincter Relaxation of in Patients WithDysphagia.Tuesday; May 4 Oral PresentationsTopic Presenter ID Title Location TimeZ-pH Monitoring Savarino 550 Microscopic Esophagitis Is More Frequent in Patients With pH-Positive Non-383-385 8:45-9:00Sandhill Scientific, Inc9150 Commerce Center Circle; Suite 500 Highlands Ranch, Colorado 80129 USAErosive Reflux Disease and Hypersensitive Esophagus Than in Those WithFunctional Heartburn: A Study Using Impedance-pH and Optical MicroscopyZ-pH Monitoring Luger 552 Inter-Observer and Inter-Analysis Agreement for Impedance Tracing and ColorContours Analysis of Esophageal Impedance Reflux Data383-385 9:15-9:30Z-pH Monitoring Weigt553 Small Volume Acid Reflux in GERD Patients With Hiatal Hernia Is Only Detectableby pH-Metry but Not by Multichannel Intraluminal Impedance383-385 9:30-9:45 Z-pH Monitoring Smout Sp546 State-of-the-Art Lecture: How Can We Improve the Diagnosis of Reflux Disease? 383-385 9:45-10:00Z-pH Monitoring Arevalo 880 Recumbent Impedance-pH Detected Swallows Predict Awakenings in GERDPatients295/296 5:00-5:15Wednesday; May 5 PostersTopic Presenter ID TitleZ-pH Monitoring Pauwels W1061 Duodeno-Gastro-Esophageal Reflux and Bile Acids in Saliva in Adult Patients With Cystic FibrosisZ-pH Monitoring Mertens W1065 the Effect of Gastro-Duodenal Contents on Functional Integrity of Tracheal Mucosa: There Is More to It ThanAcid.Z-pH Monitoring Rosen W1070 Non-Acid Reflux Burden Is a Predictor of Bacterial Lung InfectionsZ-pH Monitoring Ang W1072 A Pilot Study Evaluating the Role of Combined Impedance-pH Monitoring in the Evaluation of Asian PatientsWith Suspected Supra-Esophageal Manifestations of Gastro-Esophageal Reflux Disease (GERD): Establishingthe Presence of Acid and Non-Acid Reflux (NAR)Z-pH Monitoring Woodley W1107 Reduced Acid Reflux Frequency and Total Acid Exposure Following Proton Pump Inhibitor Treatment in CysticFibrosis Patients Is Largely Due to an Effect on pH Only and Classic Two-Phase Acid Reflux Episodes EFT Odaka W1125 Characteristics of Esophageal Motility in Patients With NERD Refractory for PPIs and a Treatment StrategyUsing Rikkunshito - A Study Using Combined Multichannel Intraluminal Impedance and Manometry (MII-EM) Z-pH Monitoring Battula W1186 A Portable Wireless System for Integrated Batteryless Impedance- and pH-Sensor Implants to Detect GERDEpisodesHRIM Kessing W1414 Impedance Recording and High Resolution Manometry Help to Better Define Rumination EpisodesZ-pH Monitoring Starpoli W1426 Characteristics of Multichannel Intraluminal Impedance-pH Reflux (MII-pH) Testing Before and After TransoralIncisionless Fundoplication (TIF)Sandhill Scientific, Inc9150 Commerce Center Circle; Suite 500 Highlands Ranch, Colorado 80129 USAZ-pH Monitoring Arnold W1662 Postoperative Impedance Testing Unreliable in Detecting Nissen Fundoplication FailureWednesday; May 5 Oral PresentationsTopic Presenter ID Title Location Time HRM Pandolfino Sp818 Lessons Learned From Research Studies Using High-ResolutionManometry/Esophageal Pressure Topography286/287 8:30-8:52HRM Kahrilas Sp819 Use of High-Resolution Manometry/Esophageal Pressure Topography in theDiagnosis of Esophageal Motility Disorders286/287 8:52-9:14HRIM Sifrim Sp820 Is There Value to Adding Impedance to High-Resolution Manometry/EsophagealPressure Topography?286/287 9:14-9:36 Colonic HRM Dinning Sp821 Colonic High-Resolution Manometry 286/287 9:36-9:58 GERD Castell Sp828 State-of-the-Art Lecture: Improving Treatment Outcomes in GERD Patients 265-268 9:45-10:00 Z-pH & HRIM Crowell Sp837 Manometry, Impedance, pH Testing 255-257 11:14-11:36 HRM Boeckxstaens Sp866 State-of-the-Art Lecture: Diagnosis and Treatment of Achalasia 2010 298-299 11:45-12:00。
循证医学名词术语中英文对照安全性Safety半随机对照试验quasi— randomized control trial,qRCT背景问题background questions比值比odds ratio,OR标准化均数差standardized mean difference, SMD病例报告case report病例分析case analysis病人价值观patient value病人预期事件发生率patient’s expected event rate,PEER补充替代医学complementary and alternative medicine,CAM 不良事件adverse event不确定性uncertaintyCochrane图书馆Cochrane Library, CLCochrane系统评价Cochrane systematic review,CSR Cochrane协作网Cochrane Collaboration,CCCox比例风险模型Cox' proportional hazard model参考试验偏倚References test bias肠激惹综合征irritable bowel syndrome,IRB测量变异measurement variation成本-效果cost-effectiveness成本-效果分析cost—effectiveness analysis成本-效益分析cost—benefit analysis成本-效用分析cost-utility analysis成本最小化分析(最小成本分析)cost—minimization analysis重复发表偏倚Multiple publication bias传统医学Traditional Medicine,TMD—L法DerSimonian & Laird methodthe number needed to harm one more patients from the therapy,NNH 对抗疗法allopathic medicine,AM对照组中某事件的发生率control event rate,CER多重发表偏倚multiple publication bias二次研究secondary studies二次研究证据secondary research evidence发表偏倚publication biasnumber needed to treat,NNT非随机同期对照试验non—randomized concurrent control trial分层随机化stratified randomization分类变量categorical variable风险(危险度) risk干扰co—intervention工作偏倚Workup bias固定效应模型fixed effect model国际临床流行病学网International Clinical Epidemiology Network,INCLEN 灰色文献grey literature后效评价reevaluation获益benefit机会结chance node疾病谱偏倚Spectrum bias技术特性Technical properties加权均数差weighted mean difference,WMD假阳性率(误诊率)false positive rate假阴性率(漏诊率) false negative rate简单随机化simple randomization检索策略search strategy交叉对照研究(交叉设计)crossover design经济学分析economic analysis经济学特性Economic attributes or impacts经验医学empirical medicine精确性precision决策结decision node决策树分析decision tree analysis绝对获益增加率absolute benefit increase, ABI绝对危险度降低率absolute risk reduction,ARR 绝对危险度增加率absolute risk increase,ARI 可重复性repeatability,reproducibility可靠性(信度)reliability可信区间confidence interval ,CI可信限confidence limit ,CLLogistic回归模型Logistic regression model 历史性对照研究historical control trial利弊比likelihood of being helped vs harmed, LHH 连续性变量continuous variable临床对照试验controlled clinical trial,CCT临床结局clinical outcome临床经济学clinical economics临床决策分析clinical decision analysis临床流行病学clinical epidemiology, CE临床实践指南clinical practice guidelines,CPG临床试验clinical trial临床研究证据clinical research evidence临床证据clinical evidence临床证据手册handbook of clinical evidence零点Zero time灵活性flexibility临界点Cut off points漏斗图funnel plots率差(或危险差)rate difference,risk difference,RD Meta—分析Meta—analysis敏感度sensitivity敏感性分析sensitivity analysis墨克手册Merck manual脑卒中病房Stroke Unit内在真实性internal validity偏倚bias起始队列inception cohort前—后对照研究before—after study前景问题foreground questions区组随机化block randomization散点图scatter plots森林图forest plots伤残调整寿命年disability adjusted life year,DALY生存曲线survival curves生存时间survival time生存质量(生活质量)quality of life世界卫生组织World Health Organization, WHO失安全数fail-Safe Number试验组某事件发生率experimental event rate,EER似然比likelihood Ratio, LR适用性applicability受试者工作特征曲线(ROC曲线)receiver operator characteristic curve随机对照临床试验randomized clinical trials, RCT 随机对照试验randomized control trial,RCT随机化隐藏randomization concealment随机效应模型random effect model特异度specificity同行评价colleague evaluation统计效能(把握度)power同质性检验tests for homogeneity外在真实性external validity完成治疗分析per protocol,PP腕管综合征carpal tunnel syndrome,CTS卫生技术health technology卫生技术评估health technology assessment, HTA 系统评价systematic review,SR相对获益增加率relative benefit increase, RBI相对危险度relative risk,RR相对危险度降低率relative risk reduction, RRR相对危险度增加率relative risk increase,RRI 效果effectiveness效力efficacy效应尺度effect magnitude效应量effect size序贯试验sequential trial选择性偏倚selection bias循证儿科学evidence—based pediatrics循证妇产科学evidence-based gynecology &obstetrics 循证购买evidence—based purchasing循证护理evidence-based nursing循证决策evidence-based decision-making循证内科学evidence-based internal medicine循证筛选evidence—based selection循证外科学evidence-based surgery循证卫生保健evidence—based health care循证诊断evidence-based diagnosis循证医学evidence-based medicine, EBM亚组分析subgroup analysis严格评价critical appraisal验后比post—test odds验后概率post-test probability验前比pre-test odds验前概率pre—test probability阳性预测值positive predictive value原始研究primary studies异质性检验tests for heterogeneity意向治疗分析intention—to-treat,ITT阴性预测值negative predictive value引用偏倚citation bias尤登指数Youden’s index语言偏倚language bias预后prognosis预后因素prognostic factor预后指数prognostic index原始研究证据primary research evidence原始研究证据来源primary resources沾染contamination真实性(效度)validity诊断参照标准reference standard of diagnosis。
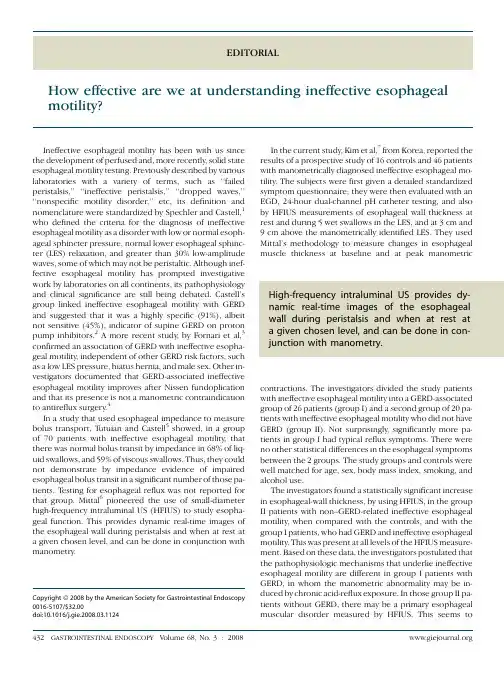
EDITORIALHow effective are we at understanding ineffective esophageal motility?Ineffective esophageal motility has been with us since the development of perfused and,more recently,solid state esophageal motility testing.Previously described by various laboratories with a variety of terms,such as‘‘failed peristalsis,’’‘‘ineffective peristalsis,’’‘‘dropped waves,’’‘‘nonspecific motility disorder,’’etc,its definition and nomenclature were standardized by Spechler and Castell,1 who defined the criteria for the diagnosis of ineffective esophageal motility as a disorder with low or normal esoph-ageal sphincter pressure,normal lower esophageal sphinc-ter(LES)relaxation,and greater than30%low-amplitude waves,some of which may not be peristaltic.Although inef-fective esophageal motility has prompted investigative work by laboratories on all continents,its pathophysiology and clinical significance are still being debated.Castell’s group linked ineffective esophageal motility with GERD and suggested that it was a highly specific(91%),albeit not sensitive(45%),indicator of supine GERD on proton pump inhibitors.2A more recent study,by Fornari et al,3 confirmed an association of GERD with ineffective esopha-geal motility,independent of other GERD risk factors,such as a low LES pressure,hiatus hernia,and male sex.Other in-vestigators documented that GERD-associated ineffective esophageal motility improves after Nissen fundoplication and that its presence is not a manometric contraindication to antireflux surgery.4In a study that used esophageal impedance to measure bolus transport,T utuian and Castell5showed,in a group of70patients with ineffective esophageal motility,that there was normal bolus transit by impedance in68%of liq-uid swallows,and59%of viscous swallows.Thus,they could not demonstrate by impedance evidence of impaired esophageal bolus transit in a significant number of those pa-tients.T esting for esophageal reflux was not reported for that group.Mittal6pioneered the use of small-diameter high-frequency intraluminal US(HFIUS)to study esopha-geal function.This provides dynamic real-time images of the esophageal wall during peristalsis and when at rest at a given chosen level,and can be done in conjunction with manometry.In the current study,Kim et al,7from Korea,reported the results of a prospective study of16controls and46patients with manometrically diagnosed ineffective esophageal mo-tility.The subjects were first given a detailed standardized symptom questionnaire;they were then evaluated with an EGD,24-hour dual-channel pH catheter testing,and also by HFIUS measurements of esophageal wall thickness at rest and during5wet swallows in the LES,and at3cm and 9cm above the manometrically identified LES.They used Mittal’s methodology to measure changes in esophageal muscle thickness at baseline and at peak manometric contractions.The investigators divided the study patients with ineffective esophageal motility into a GERD-associated group of26patients(group I)and a second group of20pa-tients with ineffective esophageal motility who did not have GERD(group II).Not surprisingly,significantly more pa-tients in group I had typical reflux symptoms.There were no other statistical differences in the esophageal symptoms between the2groups.The study groups and controls were well matched for age,sex,body mass index,smoking,and alcohol use.The investigators found a statistically significant increase in esophageal-wall thickness,by using HFIUS,in the group II patients with non–GERD-related ineffective esophageal motility,when compared with the controls,and with the group I patients,who had GERD and ineffective esophageal motility.This was present at all levels of the HFIUS measure-ment.Based on these data,the investigators postulated that the pathophysiologic mechanisms that underlie ineffective esophageal motility are different in group I patients with GERD,in whom the manometric abnormality may be in-duced by chronic acid-reflux exposure.In those group II pa-tients without GERD,there may be a primary esophageal muscular disorder measured by HFIUS.This seems toCopyrightª2008by the American Society for Gastrointestinal Endoscopy 0016-5107/$32.00doi:10.1016/j.gie.2008.03.1124High-frequency intraluminal US provides dy-namic real-time images of the esophageal wall during peristalsis and when at rest at a given chosen level,and can be done in con-junction with manometry.432GASTROINTESTINAL ENDOSCOPY Volume68,No.3:correlate with a recently published study by Mittal6of in-creased esophageal wall thickness by HFIUS in patients with a number of esophageal motor disorders.8In the cur-rent study by Kim et al,7unlike other previous studies,test-ing for GERD was also done.I would suggest that this testing be a prerequisite for future studies when using HFIUS in this area.In this study,as in others in this area,there were some methodologic issues.It was not clear to me how GERD was defined for study stratification.We know there is no cri-terion standard.T wenty-four of the26patients in the GERD group I had an abnormal distal pH profile.Presumably,the other2patients had endoscopic esophagitis,with a normal pH study,presumably,off acid-suppressive therapy.Is this GERD?Would removing those2patients from the study group affect the statistical calculations?Another thorny is-sue pertains to the manometric diagnosis of ineffective esophageal motility.Nayar et al,9the group from Cleveland Clinic,published a study of intraobserver agreement for esophageal manometry.There was good agreement for the diagnosis of normal motility and of achalasia(overall k Z0.68)but much less agreement for the other motility disorders(k Z0.27)between2independent interpreters, who disagreed about this manometric diagnosis in29%of the studies reviewed.Another issue involves the symptoms of the2groups with ineffective esophageal motility.I was surprised not to see more differences in dysphagia and chest pain recorded between the2study groups,given the differences seen in the esophageal-wall thickness and the hypothesis of the in-vestigators.In a recently published study of94patients,Mit-tal6found that dysphagia was more common in patients with increased esophageal-wall thickness,including24% of patients who had normal manometry but abnormal HFIUS.8The current study by Kim et al7was smaller.There were2patients with dysphagia in group I,and6in group II, but,because of the study size,this did not reach statistical significance.There was no difference in chest pain between the2groups.Nevertheless,the study by Kim et al7does advance our understanding of ineffective esophageal peristalsis and its association with GERD.It further suggests an increasing role of HFIUS in research in this area.Only time and more studies will tell how these findings affect our clinical man-agement of these patients.DISCLOSUREThe author reports that there are no disclosures rele-vant to this publication.V.Alin Botoman,MD,FACG,FACPDivision of GastroenterologyUniversity of MiamiGastroenterology Institute of Fort LauderdaleGI-GU Functional DiagnosticsFort Lauderdale,Florida,USA Abbreviations:HFIUS,high-frequency intraluminal US;LES,lower esoph-ageal sphincter.REFERENCES1.Spechler SJ,Castell DO.Classification of oesophageal motor abnormal-ities.Gut2001;49:145-51.2.Fouad YM,Katz PO,Castell DO.Oesophageal motility defects associ-ated with nocturnal gastro-oesophageal reflux on proton pump inhib-itors.Aliment Pharmacol Ther1999;13:1467-71.3.Fornari F,Callegari-Jacques SM,Scussel PJ,et al.Is ineffective esopha-geal motility associated with reflux esophagitis?Eur J Gastroenterol Hepatol2007;19:783-7.4.Ravi N,Al-Sarraf N,Moran T,et al.Acid normalization and improved mo-tility after Nissen fundoplication:equivalent outcomes in patients with normal and ineffective esophageal motility.Am J Surg2005;190:445-50.5.Tutuian R,Castell DO.Clarification of the esophageal function defect inpatients with manometric ineffective esophageal motility:studies using combined impedance-manometry.Clin Gastroenterol Hepatol2004;2: 230-6.6.Mittal KR.Motor and sensory function of the esophagus:revelationsthrough ultrasound imaging.J Clin Gastroenterol2005;39(Suppl2): S42-8.7.Kim JH,Rhee P-L,Son HJ,et al.Is all ineffective esophageal motility thesame?A clinical and high-frequency intraluminal US study.Gastrointest Endosc2008;68:422-31.8.Dogan I,Puckett JL,Padda BS,et al.Prevalence of increased esophagealmuscle thickness in patients with esophageal symptoms.Am J Gastro-enterol2007;102:137-45.9.Nayar DS,Kahndwala F,Achkar E,et al.Esophageal manometry:assess-ment of interpreter consistency.Clin Gastroenterol Hepatol2005;3: 218-24.Botoman Editorial Volume68,No.3:2008GASTROINTESTINAL ENDOSCOPY433。
《3.0T MRI测量心外膜脂肪体积与原发性高血压及冠状动脉粥样硬化的关系》篇一摘要本研究通过3.0T MRI技术对心外膜脂肪体积(EAT)进行了测量,探讨了其与原发性高血压(EH)及冠状动脉粥样硬化(CAS)的关系。
研究结果表明,心外膜脂肪体积的增加与原发性高血压及冠状动脉粥样硬化的发生和发展密切相关。
一、引言原发性高血压和冠状动脉粥样硬化是心血管系统常见的疾病,其发病机制复杂,涉及多种因素。
近年来,心外膜脂肪体积的增加被认为与心血管疾病的发生和发展密切相关。
因此,本研究采用3.0T MRI技术对心外膜脂肪体积进行测量,探讨其与原发性高血压及冠状动脉粥样硬化的关系。
二、方法1. 研究对象本研究共纳入100例受试者,其中50例为原发性高血压患者,50例为健康对照组。
所有受试者均接受3.0T MRI检查。
2. 3.0T MRI测量使用3.0T MRI设备对受试者进行心脏扫描,测量心外膜脂肪体积。
3. 统计分析采用SPSS软件进行数据分析,比较两组间心外膜脂肪体积的差异,分析心外膜脂肪体积与原发性高血压及冠状动脉粥样硬化的关系。
三、结果1. 心外膜脂肪体积的比较原发性高血压组的心外膜脂肪体积显著高于健康对照组(P<0.05)。
2. 心外膜脂肪体积与原发性高血压的关系经统计分析发现,心外膜脂肪体积的增加与原发性高血压的发生呈正相关。
心外膜脂肪体积越大,原发性高血压的发病率越高。
3. 心外膜脂肪体积与冠状动脉粥样硬化的关系研究发现,心外膜脂肪体积的增加与冠状动脉粥样硬化的程度密切相关。
心外膜脂肪体积越大,冠状动脉粥样硬化的程度越严重。
四、讨论本研究结果表明,心外膜脂肪体积的增加与原发性高血压及冠状动脉粥样硬化的发生和发展密切相关。
这可能与心外膜脂肪分泌的炎性因子、氧化应激等有关,这些因素可能促进血管内皮细胞的损伤和动脉粥样硬化的形成。
因此,心外膜脂肪体积的测量可以作为评估心血管疾病风险的重要指标。
Revised: March 2010 (10th version)- DRUG FOR TREATMENT OF UNSTABLE ANGINA PECTORIS AND ACUTE HEART FAILURE -SIGMART®Injection 2 mgSIGMART®Injection 12 mgSIGMART®Injection 48 mgINDICATIONSUnstable angina pectorisAcute heart failure (including acute decompensation of chronic heart failure)DOSAGE AND ADMINISTRATIONUnstable angina pectorisSIGMART is dissolved in isotonic sodium chloride solution or 5% glucose injection to prepare a 0.01%-0.03% solution. The usual adult dosage for intravenous drip infusion is 2 mg of nicorandil per hour. The dosage may be adjusted according to symptoms, while not exceeding 6 mg per hour. Acute heart failure (including acute decompensation of chronic heart failure)SIGMART is dissolved in isotonic sodium chloride solution or 5% glucose injection to prepare a 0.04%-0.25% solution. The usual adult dosage is 0.2 mg/kg of nicorandil to be given by intravenous administration over about 5 minutes, followed by 0.2 mg/kg/hr of nicorandil to be given by continuous intravenous infusion. The dosage may be adjusted in the range of 0.05-0.2 mg/kg/hr according to changes in blood pressure and symptoms.PRECAUTIONS1. Careful Administration (SIGMART Injection should beadministered with care in the following patients.)(1) Elderly (see 4, "Use in the Elderly".)(2) Patients with hypotension (Since SIGMART lowersblood pressure, this symptom may be exacerbated.)(3) Patients with hepatic or renal dysfunction (Sincemetabolic and excretory functions are impaired, theblood concentration of SIGMART may become high).(4) Patients with left ventricular outflow stenosis,hypertrophic obstructive cardiomyopathy, or aorticstenosis due to acute heart failure (Difference inpressure may be increased and lead to aggravation ofsymptoms.)2. Important Precautions(1) While SIGMART is being administered, blood pressureand hemodynamics should be monitored frequently.Dosage should be adjusted gradually according topatient's hemodynamics and symptoms.(2) When abnormalities such as hypotension are observedwhile SIGMART is being administered or whenpatients may suffer from hypotension, dosage should bereduced or administration discontinued. If necessary,appropriate measures such as elevation of lowerextremities or administration of vasopressors(catecholamine preparations) should be taken.(3) Since coadministration with drugs withPDE5-inhibiting effect(sildenafil citrate, vardenafilhydrochloride hydrate, or tadalafil) may enhance thehypotensive effect of SIGMART and excessivelydecrease blood pressure, confirmation should be madebefore administering SIGMART that these drugs arenot being used. Moreover, the patient should becautioned against using these drugs during or aftertaking SIGMART.(4) When used in patients with acute heart failure,SIGMART should be administered with sufficientmanagement of the patient’s general conditionincluding blood pressure, heart rate, urinary output,body fluids and electrolytes, as well as pulmonaryarterial wedge pressure, cardiac output and blood gasesif possible.(5) When used in patients with acute heart failure,SIGMART may cause a serious decrease in bloodpressure. Therefore, blood pressure should befrequently measured during treatment with SIGMART.If any abnormality is observed, treatment should bediscontinued and appropriate measures taken.(6) If expected improvement is not achieved followingtreatment with SIGMART in patients with acute heartfailure, appropriate measures such as change oftreatment to another should be taken.(7) In patients with acute heart failure, if hemodynamicsand clinical symptoms improve and the patient’scondition becomes stabilized (recover from the acutestage) following treatment with SIGMART, treatmentshould be switched to another. SIGMART has rarelybeen used for more than 48 hours in patients with acuteheart failure. Therefore, if it is necessary to useSIGMART for more than 48 hours, the drug should beadministered with sufficient management of thepatient’s blood circulation and general condition.3. Drug InteractionsContraindications for coadministration (SIGMART4. Adverse ReactionsUnstable angina pectorisThe following adverse reactions to this drug were reported in 227 patients (6.64%) and 301 events of 3,420 patients analyzable for safety. The major adverse reactions were headache (53 events, 1.55%), hepatic function disorder (37 events, 1.08%), increased ALT (GPT) (29 events, 0.85%), decreased blood pressure (24 events, 0.70%), increased AST (GOT) (19 events, 0.56%), increased Al-P (15 events,0.44%), thrombocytopenia (15 events, 0.44%), increased total bilirubin (13 events, 0.38%), increased LDH (9 events, 0.26%), anemia (9 events, 0.26%), and increased γ-GTP (8 events, 0.23%) (at the end of the reexamination period). Acute heart failure (including acute decompensation of chronic heart failure)The following adverse reactions to this drug were reported in 50 of 193 patients (25.9%, 79 events), who were the subjects of safety analysis. The main adverse reactions were throm-bocytopenia (11 events, 5.7%), headache (10 events, 5.2%), decreased blood pressure (7 events, 3.6%), increased total bilirubin (7 events, 3.6%), decreased serum total protein (5 events, 2.6%), increased AST (GOT) (3 events, 1.6%), increased ALT (GPT) (3 events, 1.6%), increased blood creatinine (3 events, 1.6%), leucocytosis (3 events, 1.6%), urinary protein positive (3 events, 1.6%), increased LDH (2 events, 1.0%), increased CK (CPK) (2 events, 1.0%), ventricular tachycardia (2 events, 1.0%), increased blood potassium (2 events, 1.0%) and decreased HDL cholesterol (2 events, 1.0%) (at the time of approval).(1) Clinically Significant Adverse Reactions1) Hepatic dysfunction and jaundice (incidence unknown):Jaundice may develop. Hepatic dysfunction, with in-creased AST (GOT), ALT (GPT) and γ-GTP may occur.Patients should be carefully monitored, and administra-tion of the drug should be discontinued and appropriatetherapeutic measures taken, if suchabnormalities are observed.2) Thrombocytopenia (incidence unknown): Thrombocy-topenia may occur. If any abnormalities are observed,the drug should be discontinued immediately and ap-propriate therapeutic measures must be taken.(2) Other adverse reactionsIf any of the following adverse reactions are observed,appropriate measures such as dosage reduction orNote 4)In the event of such symptom, administration should be discontinued.5. Use in the ElderlySince the elderly often have reduced physiological function and are more likely to experience adverse reactions,SIGMART should be administered while closely andfrequently monitoring blood pressure and hemodynamics.The dosage should be carefully and gradually adjusted inview of the patient’s hemodynamics and symptoms. (See"Important Precautions".)In particular, caution should be taken for decrease in blood pressure, which is apt to occur in elderly patients with acute heart failure.6. Use during Pregnancy, Delivery or LactationSince the safety of SIGMART in pregnant women has not been established, use of SIGMART in pregnant women or women who may possibly be pregnant is not recommended.7. Pediatric UseThe safety of SIGMART in children has not beenestablished (no clinical experience).8. Precautions concerning UsePreparation methodSIGMART should be dissolved in physiological saline or 5% glucose solution for injection and used within 24 hours of preparation.PHARMACOKINETICS1. Blood concentration(1) Single administration1)To five healthy volunteers, 2 mg of SIGMART Injectionwas administered once over a two minute period Note 5).administrationNote 5) This is different from the approved dosage andadministration of SIGMART. (See "DOSAGE AND ADMINISTRATION”.)(2) Continuous administration 2), 3)To five healthy volunteers, SIGMART Injection was intravenously administered for six hours continuously Note 6)6h completion of continuous intravenous administration(3) Long-term administration (in patients with acute heartfailure) 4)SIGMART Injection was intravenously administered to 14 patients with acute heart failure at a dose of 0.2 mg/kg for 5 minutes, and then at a rate of 0.2 mg/kg/hr for 48 hours continuously. The time course of plasma nicorandil concentration is shown below.Time after the start of administration (hr)Time course of plasma nicorandil concentration in patients with acute heart failure (mean±SE)2. Metabolism and excretion 3), 5)The metabolism and excretion of SIGMART wereinvestigated by intravenously administering 2, 4 or 6 mg/hr of SIGMART Injection (as nicorandil) to five healthy men Note 6)and 6 mg/hr of nicorandil labelled with deuterium to four healthy men for six hours, respectively. Most nicorandil was subjected to a denitration reaction and metabolized to N-(2-hydroxy ethyl) nicotinamide. This metabolite, N-(2-hydroxy ethyl) nicotinamide, wasdetectable in the plasma 0.25-0.5 hours after the start of continuous intravenous administration, and reached aplateau 3 to 9 hours after administration. The cumulative urinary excretion of nicorandil and the metabolite [N-(2-hydroxy ethyl) nicotinamide] 24 hours after administration was 0.2% to 0.4% and 2% to 5%, respectively.Note 6) This is different from the approved dosage andadministration of SIGMART for acute heart failure (including acute decompensation of chronic heart failure).(See "DOSAGE AND ADMINISTRATION".)3. Serum protein binding rate 6)In an in vitro test using human serum, the serum protein binding rate ranged from 34.2% to 41.5% (nicorandil concentration: 1-100 µg/mL)CLINICAL STUDIES1. The usefulness of SIGMART Injection was confirmed by a double-blind comparative study on patients with unstableangina pectoris 7).2. In clinical studies including double-blind study on patients with unstable angina pectoris, overall improvement rates ranged from 68.4% to 75.0%7, 8) in a total of 134 assessable patients.3. In clinical studies including a double-blind study of patients with acute heart failure (including acute decompensation of chronic heart failure, with a pulmonary arterial wedge pressure of 18 mmHg or more), SIGMART Injection was intravenously administered to 54 patients at a dose of 0.2 mg/kg for 5 minutes, and then at a rate of 0.2 mg/kg/hr continuously. As a result, their pulmonary arterial wedge pressure decreased by 21.2%9-11).PHARMACOLOGY1. Pharmacological action(1) Coronary vasodilating activity1) In a canine Langendorff preparation, nicorandil dilated relatively small coronary arteries under normal-pressure perfusion, whereas underlow-pressure perfusion during ischemia, it dilated large coronary arteries. In unanesthetized dogs, intravenous administration of nicorandil dilated large coronary arteries in a dose-dependent manner irrespective of coronary blood flow 12, 13). 2) When SIGMART Injection (2 mg to 6 mg or 0.05-0.1 mg/kg of nicorandil) was administered intravenously once to patients with coronary artery disease Note 7), coronary angiography showed02004006008001000120014001600012243648Time after the start of administration (hr)Time course of plasma nicorandil concentration (mean±SE)Continuous i.v. administrationP l a s m a c o n c e n t r a t i o n (n g /m L )P l a s m a c o n c e n t r a t i o n (n g /m L )significant coronary vasodilation in a dose-dependentmanner. The rate of dilation (in relation to theinternal diameter of non-stenotic vessels) ranged from108% to 127%14-16).(2) Effects on coronary blood flow1) Nicorandil produced a dose-dependent, sustainedincrease in coronary blood flow following intravenousor intraduodenal administration in open-chestedanesthetized dogs. The same responses were shownin conscious dogs, isolated canine heart-lungpreparations, and canine Langendorff'spreparations13,17-20).2) SIGMART Injection (0.1 mg/kg of nicorandil) wasadministered intravenously once Note 7) to patients withangina pectoris having no significant stenosis or anorganic stenosis of 75% or greater in the left coronaryartery and to people with no significant stenosis.The great cardiac vein flow was then measured threeto five minutes after administration (continuousthermal dilution method). In the non-stenosis group(n=5), the average volume increased from 115 to 187mL/min., and in the stenosis group (n=4), it increasedfrom 38 to 69 mL/min., thus confirming significantincreases in coronary blood flow16).(3) Coronary vasospasmolytic activity1) In dogs with partially constricted coronary arteries,nicorandil inhibited cyclical reductions of coronaryblood flow and ST elevations in ECG. Coronaryvasoconstriction induced by the intracoronaryinjection of methacholine or norepinephrine inminiature pigs was also suppressed by nicorandil21,22).2) In 10 patients with coronary spastic angina pectoris,0.1 mg/kg of nicorandil was administeredintravenously to treat coronary spasms induced byergonovine load test or naturally occuring coronaryspasms Note 7). The results showed that nicorandilattenuated coronary spasms 23).(4) Effects on cardio-hemodynamics1) Nicorandil slightly decreased systemic blood pressuredose-dependently when injected intravenously inopen chest dogs under general anesthesia. Therewere no appreciable effects on heart rate, myocardialcontractility, myocardial oxygen consumption andatrioventricular conduction time at doses causing asignificant decrease in coronary vascular resistance17,18, 24).2) When SIGMART Injection (2 to 6 mg or0.05-0.1 mg/kg of nicorandil) was administeredintravenously once to patients with coronary anginapectoris at rest Note 7), heart rate increased, and BPdynamics index (e.g., systolic aortic pressure),systemic vascular resistance, and pressure-rateproduct decreased in a dose-dependent manner.However, the range of these fluctuations were slightto mild14-16). While right intraventricular pacing wasutilized, SIGMART Injection (0.05mg/kg ofnicorandil) was administered intravenously once Note7)to eight patients with angina pectoris with 75% orgreater stenosis. In terms of left ventricular function,nicorandil suppressed increases in the left ventricularend-diastolic pressure and increased the cardiacindex25).Note 7) This is different from the approved dosageand administration of SIGMART. (See"DOSAGE AND ADMINISTRATION”.) (5) Effects on heart failure1) In a canine model of acute heart failure, treatment withnicorandil decreased right atrial pressure and leftventricular pressure in the late diastolic phase (adecrease in the preload), with a concurrent decrease inthe total peripheral vascular resistance (a decrease inthe afterload). Consequently, by improving the leftventricular contractility and increasing the cardiacoutput, the treatment improved the hemodynamics inheart failure26).2) Patients with acute heart failure (including acutedecompensation of chronic heart failure) receivedintravenous administration of SIGMART at a dose of0.2 mg/kg/5 min followed by a 2-hour continuousintravenous infusion at a rate of 0.2 mg/kg/hr. As aresult, a significant decrease was found in thepulmonary arterial wedge pressure, diastolic pressure,systolic pulmonary arterial pressure, diastolicpulmonary arterial pressure, and total peripheralvascular resistance, while a significant increase wasseen in the cardiac index, cardiac output, output perstroke, and output index per stroke. No significantchange was found in the heart rate, systolic bloodpressure, mean right atrial pressure, or pressure-rateProduct11).3) In patients with congestive heart failure who receiveda long-term continuous intravenous infusion ofSIGMART, a decrease in the pulmonary arterialwedge pressure was maintained, which suggested thatdrug resistance would hardly occur27).2. Vasodilating effect and its mechanismThe vasohypotonic effect of nicorandil on extracted blood vessels is suppressed by ATP-sensitive K channel inhibitors or guanylate cyclase inhibitors28). Moreover, in a caninemodel of acute heart failure, the cardiachemodynamics-improving effect of the drug (e.g. effect of increasing the aortic blood flow) was suppressed byATP-sensitive K channel inhibitors29). Furthermore, the drug caused an increase in the cGMP content in extracted blood vessels30). These facts suggest that the vasodilating effect of the drug is related to the effect of opening the ATP-sensitive K channel, as well as to the effect of increasing production of cGMP.PHYSICOCHEMISTRYNonproprietary name:Nicorandil (JAN)Chemical name:N-[2-(Nitrooxy) ethyl] pyridine-3-carboxamide Structural formula:Molecular formula: C 8H 9N 3O 4Molecular weight: 211.17 Description:Nicorandil occurs as white crystals.It is freely soluble in methanol, ethanol (99.5), acetic acid (100); soluble in acetic anhydride; sparingly soluble in water.Melting point:About 92° C (to be decomposed)PACKAGING2 mg InjectionBoxes of 10 vials. 12 mg InjectionBoxes of 10 vials. 48 mg InjectionBoxes of 10 vials.REFERENCES1) Azuma J. et. al.: Yakuri To Chiryo (Jpn. Pharmacol. & Ther.), 15 (11), 4779, 19872) Azuma J. et. al.: Yakuri To Chiryo (Jpn. Pharmacol. & Ther.), 18 (9), 3479, 19903) Internal document: Azuma J. et al.: Pharmacokinetics following intravenous continuous administration of nicorandil in healthy adults (1990)4) Internal document: Phase III study in patients with acute heart failure (long-term administration)5) Internal document: Ishitani H. et al.: Investigation on urinary metabolites following continuous intravenous administration of nicorandil in healthy adults (1990) 6) Internal document: Ida S. et al.: in vivo and in vitro serum protein binging of nicorandil (1991)7) Kato K. et al.: Rinsho Iyaku (J. of Clinical Ther. & Medicines), 7 (9), 2031, 19918) Kato K. et al.: Rinsho To Kenkyu (Jpn. J. of Clinical and Experi. Medicine), 68 (11), 3480, 19919) Internal document: Early phase II study in patients with acute heart failure (single + continuous administration) 10) Internal document: Late phase II study in patients with acute heart failure11) Internal document: Phase III study in patients with acute heart failure (placebo-controlled)12) Yamada A. et al.: Arzneim. -Forsch. (Drug Res.), 37 (11), 1252, 198713) Nakagawa Y. et al.: Jpn. Heart J., 20 (6), 881, 1979 14) Hata N. et al.: Myakkangaku (Vessels), 31 (4), 333, 199115) Gomyo Y. et al.: Therapeutic Research, 10 (4), 1615, 198916) Motohara S. et al.: Therapeutic Research, 10(4), 1307, 198917) Uchida Y. et al.: Jpn. Heart J., 19 (1), 112, 197818) Satoh K. et al.: Shinzo (Heart), 12 (4), 371, 1980 19) Mizukami M. et al.: Arzneim-Forsch. (Drug Res.), 31 (2), 1244, 198120) Sakanashi M. et al.: Oyo Yakuri (Pharmacotrics), 15 (3), 385, 197821) Uchida Y. et al.: Jpn. Heart J., 19 (6), 904, 197822) Sakai K. et al.: J. Pharmacol. Exp. Ther., 227 (1), 220, 198323) Matsumura Y. et al.: Therapeutic Research, 11 (5), 1448, 199024) Sakai K. et al.: J. Cardiovasc. Pharmacol., 3 (1), 139, 198125) Kambara H. et al.: Am. J. Cardiol., 63, 56J, 1989 26) Kamijo, T. et al.: J. Cardiovasc. Pharmacol., 33: 93 (1999)27) Larsen, A. I. et al.: Am. Heart J., 134: 435 (1997) 28) Internal document: Fukazawa M. et al.:Pharmacological study using extracted blood vessels of rats (2001)29) Kamijo, T. et al.: Asia Pac. J. Pharmacol., 11: 141 (1996)30) Internal document: Imagawa J. et al.: Influence on cAMP and cGMP in aortas of rats (2000)REQUEST FOR LITERATURE SHOULD BE MADE TO:Requests for any of the internal documents listed in the“REFERENCES” section can also be made to the following: Drug Information CenterChugai Pharmaceutical Co., Ltd.1-1 Nihonbashi-Muromachi 2-chome, Chuo-ku, Tokyo 103-8324, Japan TEL: 0120-189706 FAX: 0120-189705http://www.chugai-pharm.co.jpManufactured and Distributed by:Chugai Pharmaceutical Co., Ltd., Roche Group.1-1 Nihonbashi-Muromachi 2-chome, Chuo-ku, Tokyo 103-8324, JapanBRAND NAMES IN OTHER COUNTRIESSigmart Injection (Korea)。
关于缺氧的新进展英语作文Title: Advancements in Understanding Hypoxia。
Hypoxia, the condition characterized by inadequate oxygen supply to tissues, has long been a subject of scientific inquiry and medical concern. Recent advancements in research have shed new light on the mechanisms underlying hypoxia and opened up avenues for innovative treatments. In this essay, we will explore some of these developments and their implications.Firstly, researchers have made significant progress in elucidating the molecular pathways involved in hypoxia. Studies have identified key genes and signaling pathways that regulate cellular responses to low oxygen levels. For example, the hypoxia-inducible factor (HIF) pathway has emerged as a central player in the adaptation to hypoxic conditions. By understanding how these pathways function, scientists can develop targeted therapies to modulate cellular responses to hypoxia.Furthermore, advancements in imaging technology have allowed for better visualization of tissue oxygenation in real-time. Techniques such as magnetic resonance imaging (MRI) and near-infrared spectroscopy (NIRS) enable researchers to non-invasively monitor oxygen levels in various organs and tissues. This improved understanding of tissue oxygenation dynamics can guide the development of interventions to optimize oxygen delivery in clinical settings.In addition to basic research, clinical studies have provided valuable insights into the management of hypoxia-related conditions. For instance, recent trials have evaluated the efficacy of hyperbaric oxygen therapy (HBOT) in treating conditions such as carbon monoxide poisoning and ischemic stroke. HBOT involves breathing pure oxygen in a pressurized chamber, which increases oxygen delivery to tissues and promotes healing. These studies have yielded promising results and underscore the potential of HBOT as a therapeutic intervention for hypoxia-related disorders.Moreover, advances in pharmacology have led to the development of novel drugs targeting hypoxia-induced pathways. For example, pharmaceutical companies areactively developing HIF stabilizers and oxygen carriersthat can enhance tissue oxygenation and improve outcomes in hypoxic conditions. These pharmacological interventions have the potential to revolutionize the treatment of diseases characterized by inadequate oxygen supply, such as pulmonary hypertension and ischemic heart disease.Furthermore, there is growing recognition of the role of environmental factors in exacerbating hypoxia-related health issues. Climate change, for instance, is leading to more frequent and severe hypoxic events, such as heatwaves and air pollution episodes. Addressing these environmental challenges requires interdisciplinary efforts involving policymakers, scientists, and healthcare professionals to mitigate the impact of environmental factors on human health.In conclusion, recent advancements in understanding hypoxia have provided new insights into its molecularmechanisms, improved diagnostic capabilities, and expanded treatment options. From basic research to clinical trials and environmental interventions, these developments offer hope for better management of hypoxia-related conditions and ultimately improving patient outcomes. However, further research is needed to fully elucidate the complex interplay of factors contributing to hypoxia and to develop more effective strategies for its prevention and treatment.。
•论著.尿酸对不同体质量指数青年高血压患者左心室肥厚及舒张功能的影响陈鑫,张晓芳.王琼英,余静兰州大学第二医院高血压中心,甘肃兰州730070摘要:目的观察尿酸对不同体质量指数(BMI)青年高血压患者左心室肥厚(L V H)及舒张功能的影响__方法选取2018年1月至2019年9月在兰州大学第二医院高血压中心确诊的青年高血压患者237例。
按B M I分为体质量正常组(BMI 18. 5〜<24;n=82)、超重组(BMI 24〜<28;« =90)、肥胖组(BMI>28kg/mz;n=65);按尿酸水平三分位将患者分为低分位组(尿酸<330. 00;n=78),中分位组(尿酸330_ 00〜<412. 67;» =80),高分位组(尿酸>412.67 funol/L w z Y g)。
收集患者的一般资料、尿酸等生化指标及超声心动图检查结果,进行统计学分析。
结果①随着B M I的升高,正常、超重及肥胖3组患者尿酸升高[(339. 82 士96_ 78)比(384. 27 士98. 50)比(415. 02 士105_ 59)M mol/L],两两比较差异有统计学意义(均P C0.05);舒张末期左心室内径(LVEDd)[(45. 01士5. 18)比(45. 82±4. 40)比(48. 66士5_ 16)mm]及二尖瓣口舒张期血流频谱E峰速度与二尖瓣瓣环运动频谱舒张早期峰值速度e'的比值(E/eO升高[9. 73(7. 79〜12. 13)比9. 94(8. 66〜11. 64)比11. 00(9. 28〜13. 48)],正常组与肥胖组组间差异有统计学意义(P<〇. 05),超重组与肥胖组组间差异有统计学意义(P<0.05),而正常组、超重组两组间比较差异无统计学意义(P>0.05);舒张末期左心室后壁厚度(LVPWTd)依次升高[8_ 50(7_ 50〜9_43)比8. 80(8.00〜9. 63)比9. 60(8. 75〜10.85) mra],正常组与肥胖组比较差异有统计学意义(P<0.05)。
不同脑小血管病负荷评分与伴无症状腔隙的脑小血管病患者认知功能的关系杜晓光,魏荣,刘琦慧,于力群,周丽摘要:目的 探讨不同脑小血管病(CSVD)负荷评分与伴无症状腔隙的CSVD患者认知功能的关系。
方法 纳入2021年7月—2023年10月就诊于潍坊市人民医院神经内科的128例伴无症状腔隙的CSVD患者,运用蒙特利尔量表(MoCA)、CSVD总负荷评分和改良负荷评分统计受试者的认知功能和CSVD负荷,分为认知障碍组(MoCA<26分)和无认知障碍组(MoCA≥26分),比较两组患者的人口社会学信息、血管病危险因素及CSVD负荷评分的差异。
采用线性回归分析MoCA评分与两种CSVD负荷评分的关系,采用趋势检验分析伴无症状腔隙的CSVD 患者认知障碍的发病趋势。
结果 研究共纳入伴无症状性腔隙的CSVD患者128例,其中认知障碍组68例(53.1%),无认知障碍组60例(46.9%),两组患者人口社会学信息及血管病危险因素差异无统计学意义(P>0.05)。
两组患者的CSVD总负荷评分和改良负荷评分比较均存在统计学差异(P<0.05)。
Spearman秩相关分析显示,CSVD 总负荷评分和改良负荷评分均与MoCA评分呈负相关(P<0.001)。
线性趋势χ2检验分析显示,伴无症状腔隙的CSVD患者认知障碍发病风险随CSVD改良负荷评分增加而增加(P trend<0.05),该发病风险与CSVD总负荷评分间趋势分析无统计学意义(P trend=0.069)。
结论 CSVD总负荷评分和改良负荷评分均可用于筛检伴无症状腔隙的CSVD认知障碍患者。
改良负荷评分可能在识别认知障碍高风险患者方面更具优势。
关键词:脑小血管病;认知;腔隙中图分类号:R743 文献标识码:ARelationship between cerebral small vessel disease burden scores and cognitive function in patients with cerebral small vessel disease with asymptomatic lacunes DU Xiaoguang,WEI Rong,LIU Qihui, et al.(Department of Neurol⁃ogy, Weifang People′s Hospital, Weifang 261000, China)Abstract:Objective To investigate the relationship between cerebral small vessel disease (CSVD) burden scores and cognitive function in patients with CSVD with asymptomatic lacunes.Methods A total of 128 patients with CSVD with asymptomatic lacunes who visited the Department of Neurology of Weifang People′s Hospital from July 2021 to October 2023 were included. All the patients were scored using the Montreal Cognitive Assessment (MoCA) for cognitive function and using the total CSVD score and the modified CSVD score for CSVD burden. They were divided into cognitive impairment group (MoCA score<26)and non-cognitive impairment group (MoCA score≥26).The demographic information,vascular disease risk factors, and the CSVD scores of the two groups were compared. A linear regression analysis was performed to as⁃sess the relationship between the MoCA score and the two CSVD scores. A trend analysis was conducted to analyze the trend of incidence of cognitive impairment in patients with CSVD with asymptomatic lacunes.Results Among the 128 patients with CSVD with asymptomatic lacunes, 68 (53.1%) were in the cognitive impairment group and 60 (46.9%) were in the non-cognitive impairment group. There were no significant differences in the demographic information and vascular disease risk factors between the two groups (P>0.05). The total CSVD score and the modified CSVD score differed significantly be⁃tween the two groups (P<0.05). The Spearman correlation analysis showed that the total and modified CSVD scores were sig⁃nificantly negatively correlated with the MoCA score (P<0.001). The chi-square test for linear trend revealed that the cogni⁃tive impairment risk increased significantly with the modified CSVD score in patients with CSVD with asymptomatic lacunes (P trend<0.05), but with no significance for the total CSVD score (P trend=0.069).Conclusion Both the total and modified CSVD scores are useful tools to detect cognitive impairment in patients with CSVD with asymptomatic lacunes, and the modi⁃fied CSVD score may be superior in identifying patients at high risk of cognitive impairment.Key words:Cerebral small vessel disease;Cognition;Lacune脑小血管病(cerebral small vessel disease,CSVD)是血管性认知障碍的主要原因[1]。
•针灸经络研究•刃针搜法治疗脑梗死后感觉障碍的临床研究桑鹏,陈佳琪(黑龙江省中医药科学院•黑龙江哈尔滨150001)摘要目的:探究刃针搜法治疗脑梗死后感觉障碍的临床作用机制。
方法:将90例脑梗死后感觉障碍患者随机分为刃针治疗组、针刺对照组、药物对照组,每组30例。
3组患者分别治疗14d,评价治疗效果,并进行治疗前后的血液流变学、神经元功能、血流动力学、体感诱发电位等相关指标检测。
结果:治疗后刃针治疗组疗效明显高于其他两组,差异有统计学意义(P<0.05)。
与治疗前比较,3组患者治疗后Fugl-Meyer评分显著提高(P<0.05);患侧体感诱发电位(SEP)N20潜伏期明显缩短(P<0.05)、波幅明显增高(P<0.05);血浆粘度、血小板聚集率、纤维蛋白原等血液流变学指标明显改善(P<0.05);血清S100B、基质金属蛋白酶-9(MMP-9)显著下降(P<0.05),金属蛋白酶组织抑制剂-l(TIMP-l)显著升高(P<0.05);病侧大脑中动脉舒张末期血流速度(Vd)、收缩期最大血流速度(Vs)、平均血流速度(Vm)显著升高;刃针治疗组上述指标变化较药物对照组和针刺对照组显著(P<0.05)。
结论:刃针搜法通过改善脑梗死后感觉障碍患者脑部组织血液循环和供血情况、改善神经元功能、促进感觉神经传导通路修复等作用机制达到治疗效果。
关键词刃针;脑梗死;感觉障碍;血液流变学;血流动力学;S100B;基质金属蛋白酶;金属;蛋白酶组织抑制因子-1Clincal Study on Sensory Impairment after Cerebral Infarction Treatedwith Blade Needle SearchSANG Peng,CHEN Jiaqi(Heilongjiang Academy of Chinese Medicine Sciences,Harbin,Heilongjiang150001)ABSTRACT Objective:To explore the mechanism o£sensory impairment after cerebral infarction treated withblade needle search.Methods:90patients with sensory impairment after cerebral infarction were randomly divided into3groups:blade needle treatment,acupuncture control,and drug control groups,30patients in eachgroup.Patients in the3groups were treated for14days to evaluate the therapeutic effects,and relevant indexesincluding hemorheology characteristics,neurons function,hemodynamics,somatosensory evoked potentials weredetected before and after treatment.Results:The curative effect of blade needle treatment group was better thanthat of the other two groups(P V0.05).To compare with before treatment,Fugl-Meyer score was significantlyraised in the three groups after treatment(P<0.05),somatosensory evoked potentials(SEP)N20latency wasshorten(P V0.05)and amplitude was heightened(P<0.05);hemorheology indexes such as plasma viscosity,platelet aggregation rate,and fibrinogen concentration were significantly decreased(P<0.05);serum SIOOB andMMP-9levels were decreased and TIMP-1was increased significantly(P<0.05);peak velocity of diastolic(VD),peak velocity of systolic(VS),velocity of mean(VM)in the affected side of the middle cerebral artery(MCA)were significantly increased(P<0.05).Changes of all above indexes in the blade needle treatmentgroup were more significant than those in the other two groups(P<0.05).Conclusion:Needle search therapycan effectively treat sensory impairment after cerebral infarction by improving blood circulation and blood supplyto brain tissue,improving neuronal function,and promoting repair of sensory nerve conduction pathways.Key words blade needle;cerebral infarction;sensory impairment;hemorheology;hemodynamics;SIOOBMMP-9;TIMP-1脑梗死,又名为缺血性脑卒中,是由于脑局部驚项目:黑龙江省中医药学会青年中医药科技创新项目(ZHYI9-组织缺血、缺氧性坏死而出现的一类神经功能缺损的临床综合征,多是由于脑血管病变所致的脑部血流供应障碍所引起⑷。
This article was downloaded by:[Hauptbibliothek Universitaet Zuerich][Hauptbibliothek Universitaet Zuerich]On:17 July 2007Access Details:[subscription number 731710275]Publisher:Informa HealthcareInforma Ltd Registered in England and Wales Registered Number: 1072954Registered office: Mortimer House, 37-41 Mortimer Street, London W1T 3JH, UKScandinavian Journal ofGastroenterologyPublication details, including instructions for authors and subscription information:/smpp/title~content=t713690387Impedance manometry with viscous test solutionincreases detection of esophageal function defectscompared to liquid swallowsWojciech Blonski ab;Amine Hila a;Vishal Jain a;Janice Freeman a; Marcelo Vela aa Division of Gastroenterology, Medical University of South Carolina. Charleston,SC. USAb Department of Gastroenterology and Hepatology, Wroclaw Medical University.Wroclaw. PolandOnline Publication Date:01 January 2007To cite this Article:Blonski, Wojciech,Hila, Amine,Jain, Vishal,Freeman, Janice, Vela, Marcelo and Castell, Donald O. , (2007) 'Impedance manometry with viscous test solution increases detection of esophageal function defects compared to liquid swallows', Scandinavian Journal of Gastroenterology, 42:8, 917 - 922To link to this article: DOI:10.1080/00365520701245702URL:/10.1080/00365520701245702PLEASE SCROLL DOWN FOR ARTICLED o w n l o a d e d B y : [H a u p t b i b l i o t h e k U n i v e r s i t a e t Z u e r i c h ] A t : 18:26 17 J u l y 2007ORIGINAL ARTICLEImpedance manometry with viscous test solution increases detection of esophageal function defects compared to liquid swallowsWOJCIECH BLONSKI 1,2,AMINE HILA 1,VISHAL JAIN 1,JANICE FREEMAN 1,MARCELO VELA 1&DONALD O.CASTELL 11Division of Gastroenterology,Medical University of South Carolina,Charleston,SC,USA,and 2Department of Gastroenterology and Hepatology,Wroclaw Medical University,Wroclaw,PolandAbstractObjective.Multichannel intraluminal impedance and manometry (MII-EM)is performed using ten 5-ml swallows each of a liquid and a viscous solution.However,the manometric diagnosis is based solely on results from the 10liquid swallows.The aim of this study was to compare esophageal function evaluated with 10liquid versus 10viscous swallows using combined MII-EM in patients with various symptoms.Material and methods.Consecutive studies performed in 300patients (211F,mean age 54.5years)were analyzed.The manometric diagnoses were separated into normal and abnormal manometry.MII findings included the number of complete and incomplete transits and total bolus transit time.Results.Manometric diagnosis for liquid and viscous solutions was consistent in 231(77%)and inconsistent in 69(23%)patients (p B 0.0001).Overall,the number of manometric abnormalities detected with the viscous solution (n 091,30.3%)was significantly higher (p 00.03)than that detected with the liquid solution (n 060,20%).Impedance diagnosis for the viscous and liquid solutions was consistent in 238(79.3%)patients and inconsistent in 62(20.7%)patients (p B 0.0001).Among those 62patients,36(58.1%)had complete bolus transit with the liquid solution and incomplete bolus transit with the viscous solution,and 26(41.9%)had incomplete bolus transit with the liquid solution and complete transit with the viscous solution (p 00.46).Overall,there was no significant difference between the number of bolus transit abnormalities for the liquid (n 075,25%)and viscous solutions (n 085,28.3%,p 00.47).Conclusions.Our results indicate that a viscous solution detects significantly more manometric abnormalities than a liquid solution.Impedance diagnosis has greater similarity for both the liquid and viscous solutions.Key Words:Combined multichannel intraluminal impedance and manometry,liquid solution,viscous solutionIntroductionCombined multichannel intraluminal impedance and manometry (MII-EM)provides simultaneous evaluation of bolus transit and pressure changes within the esophagus [1].The basic principles of impedance testing were first described by Silny in 1991[2].Multichannel intraluminal impedance detects the bolus movement within the esophagus without the use of radiation based on the differences in resistance to alternating currents among air,esophageal mucosa and esophageal liquid bolus [2].The ability of impedance to detect bolus move-ment within the esophagus has been validated with the use of combined video fluoroscopy and impe-dance [3Á5].MII-EM is performed using ten 5-ml swallows each of a liquid and a viscous solution.However,the manometric diagnosis is based solely on results from the 10liquid swallows.The aim of the study was to compare esophageal function evaluated with 10liquid versus 10viscous solution swallows using combined MII-EM in pa-tients with various symptoms.Materials and methodsWe analyzed a cohort of 300consecutive MII-EM studies after having excluded patients with achalasia or scleroderma examined in the Esophageal Labora-tory at the Medical University of South CarolinaCorrespondence:Donald O.Castell,MD,Division of Gastroenterology,Medical University of South Carolina,210CSB,Charleston,SC,USA.Fax:'184********.E-mail:castell@Scandinavian Journal of Gastroenterology ,2007;42:917Á922D o w n l o a d e d B y : [H a u p t b i b l i o t h e k U n i v e r s i t a e t Z u e r i c h ] A t : 18:26 17 J u l y 2007from January 2005to November 2005.Approval was obtained from our Institutional Review Board to review and analyze these studies and to publish the information retrieved from them.All patients and subjects included in the study provided informed consent giving the investigators permission to use their data for database research studies.Esophageal function testing (EFT)using com-bined MII-EM was performed with a Koenigsberg 9-channel probe (Sandhill EFT catheter;Sandhill Scientific Inc.,Highlands Ranch,Colo.,USA).The 4.5-mm diameter catheter design has two circumfer-ential solid-state pressure sensors located at 5and 10cm from the tip and three unidirectional solid-state pressure sensors located at 15,20and 25cm.Impedance-measuring segments consist of two metal rings placed 2cm apart,centered 10,15,20and 25cm from the tip,straddling the four proximal pressure transducers.The EFT catheter was passed through the nose into the esophagus up to a depth of 60cm.The lower esophageal sphincter (LES)was identified using a station pull-through technique,and the most distal sensor was placed in the high pressure zone of the LES.Intraesophageal pressure sensors and impedance-measuring segments were thus located 5,10,15and 20cm above the LES.In the supine position,10swallows of 5ml normal saline and 10swallows of 5ml viscous material (applesauce-like consistency)were given,each 20-30s apart.The viscous material is manufactured as a food substance with a known standardized impe-dance value (Sandhill Scientific Inc.).Double swal-lowing disqualified swallows and these were repeated.Manometric parameters used to character-ize swallows included:1)distal esophageal ampli-tude (DEA)as the average of contraction amplitude 5and 10cm above the LES and 2)onset velocity of esophageal contractions in the distal part of the esophagus (i.e.contraction velocity between 10and 5cm above the LES).Impedance parameters in-cluded:1)bolus entries and exits 5,10,15and 20cm above the LES and 2)total bolus transit time (TBTT)as time elapsed between bolus entry at 20cm above the LES and bolus exit at 5cm above the LES.Bolus entry at a specific level was considered at the 50%point between the 3-s pre-swallow impedance baseline and impedance nadir during bolus pre-sence.Bolus exit was determined as the return to this 50%point on the impedance recovery curve.The bolus was considered to exit at a given level in the esophagus (i.e.5,10and 15cm above the LES)if the impedance recovered to greater than the 50%baseline value for at least 5s (Figure 1A).Conversely,the bolus was considered not to exit the given segment if it did not recover to greater thanthe 50%baseline value,or recovered for less than 5s (Figure 1B).Swallows were manometrically classified as 1)normal if contraction amplitudes 5and 10cm above the LES were each ]30mmHg and distal onset velocity was 58cm/s,2)ineffective if either of the contraction amplitudes 5and 10cm above the LES was B 30mm Hg or 3)simultaneous if contraction amplitudes 5and 10cm above the LES were each ]30mmHg and distal onset velocity was 8cm/s.Swallows were classified by MII as showing:1)complete bolus transit if bolus entry occurred at 20cm above the LES and bolus exit points were recorded in all three distal impedance measuring sites 15,10and 5cm above the LES and total bolus transit time was 515s,and 2)incomplete bolus transit if bolus exit was not identified at any of the three distal impedance measuring sites or if bolus entry was not identified at 20cm above the LES or total bolus transit time was 15s.Esophageal transit was defined by impedance as normal liquid transit if at least 80%ofliquidFigure plete bolus transit:bolus entry is present at the most proximal site and bolus exit points are present in all three distal impedance measuring segments. B.Incomplete bolus transit:bolus exit is not present at any one of the three distal impedance measuring segments.918W .Blonski et al.D o w n l o a d e d B y : [H a u p t b i b l i o t h e k U n i v e r s i t a e t Z u e r i c h ] A t : 18:26 17 J u l y 2007swallows had complete bolus transit and as normal viscous transit if at least 70%of viscous swallows had complete bolus transit [6].The diagnoses of manometric abnormalities were based on the following criteria.Ineffective esophageal motility (IEM)was defined as 50%or more manome-trically ineffective swallows [7].Nutcracker esopha-gus was defined as normal peristalsis of esophageal body with an average DEA ]220mmHg [8].Distal esophageal spasm (DES)was defined as 20%or more simultaneous contractions [9,10].Patients with a manometric diagnosis of achalasia or scleroderma esophagus were not included in this study.Statistical analysisStatistical analysis was performed using Prism soft-ware version 3.00(Graph Pad,Calif.,USA).The Mann-Whitney test,Wilcoxon’s signed-rank test or the paired t -test was used.The correlations between the number of peristaltic,ineffective and simulta-neous contractions,distal esophageal amplitude and complete and incomplete bolus transit for the liquid and viscous solutions were assessed using Spear-man’s correlation coefficient.The correlation be-tween the total bolus transit time for the liquid and viscous solution was assessed using Pearson’s corre-lation coefficient.A p -value 50.05was taken to be statistically significant.ResultsThe investigation covered 300MII-EM studies in 300patients.These included 211women with a mean age of 54.2years and 89men with a mean age of 55.2years.Of 300patients receiving liquid swallows,240(80%)had normal esophageal manometry.Based on the aforementioned criteria,60(20%)patients had esophageal manometric abnormalities:32(10.7%)had IEM,17(5.7%)had DES,10(3.3%)had nutcracker esophagus and 1patient (0.3%)had IEM and DES (Figure 2A).Applying the same manometric criteria to the viscous solution,209(69.7%)of the 300patients had normal esophageal manometry,whereas 91(30.3%)had abnormal esophageal manometry in-cluding IEM (n 049,16.3%),DES (n 034,11.3%),IEM and DES (n 01,0.3%),nutcracker esophagus (n 06,2%)and nutcracker and DES (n 01,0.3%)(Figure 2B).Overall,the number of manometric abnormalities detected with the viscous solution (n 091;30.3%)was significantly higher (p 00.03,Mann-WhitneyFigure 2.A.Distribution of manometric diagnoses with liquid swallows.B.Distribution of manometric diagnoses with viscous swallows.DES 0distal esophageal spasm;IEM 0ineffective esophageal motility.MII-EM with viscous versus liquid919D o w n l o a d e d B y : [H a u p t b i b l i o t h e k U n i v e r s i t a e t Z u e r i c h ] A t : 18:26 17 J u l y 2007test)than the number detected with the liquid solution (n 060;20%).Of the 300studies,231(77%)had consistent manometric diagnoses for both the liquid and viscous solutions,and 69(23%,p B 0.0001,Mann-Whitney test)had inconsistent manometric diag-noses for both solutions.The manometric diagnoses for liquid and viscous swallows are summarized in T able I.Among 231patients with consistent manometric diagnoses for both the liquid and viscous solutions,192(64%)had normal and 39(13%)abnormal manometry (24IEM,11DES and 4nutcracker esophagus).Among 69patients with inconsistent manometric diagnoses between liquid and viscous solutions,48(69.6%)had normal manometry with the liquid solution but abnormal manometry with the viscous solution,17(24.6%)had abnormal manometry with the liquid and normal manometry with the viscous solution,and 4(5.8%)had different manometric abnormalities with the liquid and viscous solutions.In the subgroup of patients with abnormal mano-metry with either a liquid or viscous solution,the number of patients with manometric abnormalities detected with the viscous solution (n 048)was significantly higher than the number detected with the liquid solution (n 017,p 00.02,Mann-Whitney test)(T able I).Of 300patients receiving liquid swallows,225(75%)had normal and 75(25%)had abnormal bolus transit identified by impedance.In contrast,215of 300(71.7%)patients receiving viscous swallows had normal and 85(28.3%)had abnormal bolus transit.Overall,there was no significant diff-erence between the number of patients with bolus transit abnormalities for the liquid (n 075)and viscous solutions (n 085,p 00.47,Mann-Whitneytest).There were 238(79.3%)patients with con-sistent impedance diagnoses for the liquid andviscous solutions,and 62(20.7%,p B 0.0001,Mann-Whitney test)with inconsistent impedance diagnoses for the liquid and viscous solutions.Of the 238patients with a consistent impedance diagnosis,189(79.4%)had normal bolus transit and 49(20.6%)had abnormal bolus transit with both the liquid and viscous solutions.Among 62patients with inconsistent diagnoses for both the liquid and viscous solutions,36(58.1%)had complete bolus transit with the liquid but incomplete bolus transit with the viscous solution and 26(41.9%)had incomplete bolus transit with the liquid and complete bolus transit with the viscous solution (p 00.46).A statistically significant difference was found between the number of peristaltic,ineffective and simultaneous contractions,distal esophageal ampli-tude,complete and incomplete bolus transit and total bolus transit time for liquid and viscous solutions (T able II),whereas distal onset velocity of contractions did not differ between liquid and viscous swallows (T able II).DiscussionIn this study we report the results of combined impedance manometry in 300patients with various symptoms.We compared the manometric and im-pedance diagnoses of MII-EM performed with liquid and viscous swallows and we found that significantly more manometric abnormalities were detected with the viscous solution (n 091)than with the liquid solution (n 060,p 00.03).We also found that distal esophageal amplitude defining liquid swallows was significantly higher than that defining viscous swallows,whereas no differ-ences were observed in distal esophageal velocities between liquid and viscous swallows.These results are consistent with those reported by Nguyen et al.and Frieling et al.who found that liquid and viscous boluses were characterized by similar velocities [11,12].Srinivasan et al.also found that the constant volume of liquid,semisolid and solid boluses did not influence the esophageal contraction wave velocity [1].Dooley et al.reported that fluids of medium and high viscosity significantly slowed the velocity of esophageal peristaltic waves,whereas fluids of low viscosity did not influence esophageal velocity [13].In their subsequent study,Dooley et al.also found that an increase in bolus consistency caused sig-nificant reductions in the velocity of propagation of esophageal waves but did not alter the amplitude of contractions throughout the esophagus [14].T able I.Distribution of manometric diagnoses between liquid and viscous solutions in 300patients.Manometric diagnosisLiquidViscous No.of patientsNormal IEM 25Normal DES21Normal Nutcracker 2DES Normal 6IEM Normal 6IEM DES1IEMIEM and DES 1IEM and DES DES 1Nutcracker Normal5Nutcracker Nutcracker and DES 1NormalNormal192Abnormal as viscousAbnormal as liquid39Abbreviations:IEM 0ineffective esophageal motility;DES 0dis-tal esophageal spasm.920W .Blonski et al.D o w n l o a d e d B y : [H a u p t b i b l i o t h e k U n i v e r s i t a e t Z u e r i c h ] A t : 18:26 17 J u l y 2007Conversely,in a recent study by Tutuian et al.it was demonstrated that liquid and viscous swallows had comparable distal esophageal amplitudes and significantly different distal esophageal velocities which were lower for viscous solutions [6].However,esophageal manometry has been vali-dated using liquid solutions and thus the mano-metric results obtained with viscous solutions should be interpreted with caution.In a study comprising healthy volunteers it was shown that 14%of patients with normal manometry with a liquid solution had an abnormal manometry when done with viscous material (IEM or DES)[6].It should be stressed that in our study 96%of patients with normal manometry with liquid and abnormal manometry with a viscous solution showed IEM (52%)or DES (44%)patterns when a viscous solution was used.The change in the manometric diagnosis observed with 10viscous swallows compared with 10liquid swallows cannot be explained by the fact that an additional 10swallows had been used as it has recently been demonstrated that an additional 10liquid swallows are likely to change the manometric diagnosis in only 2%of patients [15].However,it can be explained by the fact that viscous material may exert greater stress on the esophagus than liquid material during esophageal function testing [16].When the impedance diagnoses were analyzed,we found a similar number of impedance abnormalities detected with either the viscous (n 085)or liquid solutions (n 075,p 00.47).In our study,62(20.6%)of all analyzed patients had inconsistent impedance diagnoses between liquid and viscous solutions.There was no significant difference be-tween the number of transit abnormalities for liquid (n 026)and viscous material in this subgroup of patients (n 036,p 00.47).In our current study we also found that the number of swallows with complete bolus transit was significantly higher with liquid swallows,whereas the number of swallows with incomplete bolus transit was significantly higher during viscousswallows.This is contrary to the findings of Tutuian et al.who did not observe any difference in the number of swallows with complete and incomplete bolus transit between liquid and viscous solutions [6].In summary,whereas the results of our study indicate that a viscous solution detects more mano-metric abnormalities than a liquid solution,impe-dance diagnosis has a greater similarity for both liquid and viscous solutions.Future studies are needed to further evaluate the diagnostic value of viscous solutions in identifying manometric abnorm-alities.These studies should also find an answer to the question of whether a viscous solution is more sensitive,or too sensitive,in comparison with a liquid solution in detecting various manometric abnormalities.References[1]Srinivasan R,Vela MF,Katz PO,Tutuian R,Castell JA,Castell DO.Esophageal function testing using multichannel intraluminal impedance.Am J Physiol Gastrointest Liver Physiol 2001;280:G 457Á62.[2]Silny J.Intraluminal multiple electric impedance procedurefor measurement of gastrointestinal motility.J Gastrointest Motil 1991;3:151Á62.[3]Silny J,Knigge K,Fass J.Verification of the intraluminalmultiple electrical impedance measurement for recording of gastrointestinal motiliy.J Gastrointest Motil 1993;5:107Á22.[4]Simren M,Silny J,Holloway R,T ack J,Janssens J,Sifrim D.Relevance of ineffective oesophageal motility during oeso-phageal acid clearance.Gut 2003;52:784Á90.[5]Blom D,Mason R,Balaji NS.Esophageal bolus transportidentified by simultaneous multichannel intraluminal impe-dance and manofluoroscopy.Gastroenterology 2001;120:103.[6]Tutuian R,Vela MF,Balaji NS,Wise JL,Murray JA,PetersJH,et al.Esophageal function testing with combined multi-channel intraluminal impedance and manometry:multi-center study in healthy volunteers.Clin Gastroenterol Hepatol 2003;1:174Á82.[7]Tutuian R,Castell DO.Clarification of the esophagealfunction defect in patients with manometric ineffective esophageal motility:studies using combined impedance-manometry.Clin Gastroenterol Hepatol 2004;2:230Á6.Table II.Characteristics of liquid and viscous swallows.LiquidViscous p -value Peristaltic swallows(#)[median (range)]10.0(0Á10)8.0(0Á10)B 0.0001*Ineffective swallows(#)[median (range)]0.0(0Á10) 1.0(0Á10)B 0.0001*Simultaneous swallows(#)[median (range)]0.0(0Á8)0.0(0Á10)0.0004*Complete bolus transit(#)[median (range)]9.0(0Á10)8.0(0Á10)B 0.0001*Incomplete bolus transit(#)[median (range)]1.0(0Á10)2.0(0Á10)B 0.0001*Distal esophageal amplitude (mmHg)[median (range)]93(18Á300)83(23Á290)B 0.0001*Distal onset velocity of contractions (cm/s);mean 9SE 4.090.1 4.190.10.14**Total bolus transit time (s);mean 9SE 7.490.17.690.10.0007***Wilcoxon signed-rank test;**paired t -test.MII-EM with viscous versus liquid921D o w n l o a d e d B y : [H a u p t b i b l i o t h e k U n i v e r s i t a e t Z u e r i c h ] A t : 18:26 17 J u l y 2007[8]Agrawal A,Hila A,Tutuian R,Mainie I,Castell DO.Clinicalrelevance of the nutcracker esophagus:suggested revision of criteria for diagnosis.J Clin Gastroenterol 2006;40:504Á9.[9]Spechler SJ,Castell DO.Classification of oesophagealmotility abnormalities.Gut 2001;49:145Á51.[10]Sperandio M,Tutuian R,Gideon RM,Katz PO,Castell DO.Diffuse esophageal spasm:not diffuse but distal esophageal spasm (DES).Dig Dis Sci 2003;48:1380Á4.[11]Nguyen HN,Silny J,Albers D,Roeb E,Gartung C,Rau G,et al.Dynamics of esophageal bolus transport in healthy subjects studied using multiple intraluminal impedancome-try.Am J Physiol 1997;273:G 958Á64.[12]Frieling T,Hermann S,Kuhlbusch R,Enck P,Silny J,LubkeHJ,et parison between intraluminal multiple electricimpedance measurement and manometry in the humanoesophagus.Neurogastroenterol Motil 1996;8:45Á50.[13]Dooley CP,Schlossmacher B,Valenzuela JE.Effects of alterations in bolus viscosity on esophageal peristalsis in humans.Am J Physiol 1988;254:G 8Á11.[14]Dooley CP,Di Lorenzo C,Valenzuela JE.Esophageal function in humans.Effects of bolus consistency and temperature.Dig Dis Sci 1990;35:167Á72.[15]Jalil S,Sperandio M,Tutuian R,Castell DO.Are 10wet swallows an appropriate sample of esophageal motility?Y es and no.J Clin Gastroenterol 2004;38:30Á4.[16]Tutuian R,Elton JP,Castell DO,Gideon RM,Castell JA,Katz PO.Effects of position on oesophageal function:stu dies using combined manometry and multichannel intralu-minal impedance.Neurogastroenterol Motil 2003;15:63Á7.922W .Blonski et al.。