SPSS软件
- 格式:doc
- 大小:305.00 KB
- 文档页数:29
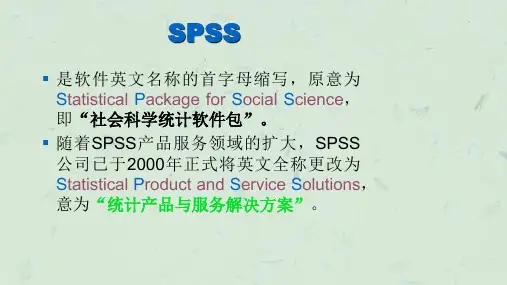
SPSS统计软件的操作与应用SPSS(Statistical Package for the Social Sciences,社会科学统计软件包)是一种用于数据统计和分析的软件工具。
它提供了广泛的功能和分析选项,适用于各种研究领域和数据类型。
本文将介绍SPSS的操作步骤和应用场景。
一、SPSS的基本操作步骤:1.数据输入:在SPSS中,可以通过手动输入数据或导入其他文件格式的数据。
点击“文件”-“打开”命令,选择数据文件并确认导入选项。
4.数据转换与清洗:SPSS提供了强大的数据转换和清洗功能。
可以使用“计算变量”命令来创建新的变量,通过数学公式、逻辑操作或函数运算来计算新的变量。
可以使用“数据筛选”命令来选择特定的数据子集进行分析。
5.数据分析:SPSS提供了丰富的统计分析功能,包括描述性统计、频率分析、多元回归、因子分析、聚类分析、生存分析等。
可以使用“统计”-“描述统计”命令进行描述性统计分析,使用“分析”-“回归”命令进行回归分析。
6.图表绘制和结果解释:SPSS可以绘制各种类型的图表,如柱形图、线形图、散点图等,以可视化方式展示数据。
分析结果可以通过图表、表格和文字报告的方式进行解释。
7. 输出和导出结果:SPSS的分析结果可以输出为SPSS输出文件( .spo )或HTML格式,也可以导出为Microsoft Office软件(如Excel、Word、PowerPoint)或PDF格式。
二、SPSS的应用场景:1.社会科学研究:SPSS是社会科学研究中最常用的统计软件之一、它可用于分析民意调查数据、人口统计数据、教育问卷数据等。
可以进行统计描述、相关分析、卡方检验、T检验、方差分析、逻辑回归等分析。
2.医学研究:医学研究中需要对大量的数据进行分析和解释,SPSS 可以进行生存分析、队列研究、临床试验等统计分析,帮助研究人员发现疾病的原因、评估治疗方法的效果等。
3.市场研究:市场研究中需要对调查数据进行分析和预测,SPSS可以进行市场细分、购买选择行为分析、品牌忠诚度分析等统计分析,帮助企业了解市场需求和制定市场策略。

spss是什么软件?spss是⽤来做什么的?很多⼈看到有⼈在⽤spss,好奇spss是什么软件?spss是⽤来做什么的?spss是⼀个⾮常好⽤的统计分析软件,spss⽤于统计学分析运算、数据挖掘、预测分析和决策⽀持任务的软件产品及相关服务软件哦,下⾯⼩编就来详细介绍⼀下吧!spss是什么软件? spss⽤于统计学分析运算、数据挖掘、预测分析和决策⽀持任务的软件产品及相关服务。
SPSS是世界上最早采⽤图形菜单驱动界⾯的统计软件,它最突出的特点就是操作界⾯极为友好,输出结果美观漂亮。
它将⼏乎所有的功能都以统⼀、规范的界⾯展现出来,使⽤Windows的窗⼝⽅式展⽰各种管理和分析数据⽅法的功能,对话框展⽰出各种功能选择项。
⽤户只要掌握⼀定的Windows操作技能,精通统计分析原理,就可以使⽤该软件为特定的科研⼯作服务。
SPSS采⽤类似EXCEL表格的⽅式输⼊与管理数据,数据接⼝较为通⽤,能⽅便的从其他数据库中读⼊数据。
其统计过程包括了常⽤的、较为成熟的统计过程,完全可以满⾜⾮统计专业⼈⼠的⼯作需要。
输出结果⼗分美观,存储时则是专⽤的SPO格式,可以转存为HTML格式和⽂本格式。
对于熟悉⽼版本编程运⾏⽅式的⽤户,SPSS还特别设计了语法⽣成窗⼝,⽤户只需在菜单中选好各个选项,然后按“粘贴”按钮就可以⾃动⽣成标准的SPSS程序。
极⼤的⽅便了中、⾼级⽤户。
SPSS for Windows的分析结果清晰、直观、易学易⽤,⽽且可以直接读取EXCEL及DBF数据⽂件,现已推⼴到多种各种操作系统的计算机上,它和SAS、BMDP并称为国际上最有影响的三⼤统计软件。
在国际学术界有条不成⽂的规定,即在国际学术交流中,凡是⽤SPSS软件完成的计算和统计分析,可以不必说明算法,由此可见其影响之⼤和信誉之⾼。
最新的21.0版采⽤DAA(Distributed Analysis Architecture,分布式分析系统),全⾯适应互联⽹,⽀持动态收集、分析数据和HTML格式报告。
统计分析软件SPSS介绍统计分析软件SPSS(Statistical Package for the Social Sciences)是一款功能强大、广泛应用于科研、社会学、经济学、心理学等领域的统计分析软件。
SPSS主要用于数据统计和分析,并以其简单易用的特点受到了广大用户的喜爱。
SPSS在数据分析方面提供了丰富的功能和方法,能够满足不同领域的需求。
它可以实现常见的描述性统计分析,包括数据的均值、标准差、最大值、最小值等,同时还提供了多种图形展示方式,如柱状图、折线图、散点图等,帮助用户更直观地认识数据。
此外,SPSS还支持各种统计检验方法,如t检验、方差分析、相关分析、回归分析等,可以帮助用户深入挖掘数据背后的规律和关系。
最为人称道的是,SPSS还能够根据用户的特定需求进行高级统计分析,如因子分析、聚类分析、逻辑回归分析等,极大地拓宽了数据分析的领域。
SPSS的操作相对简单,适合初学者使用。
它采用了图形化用户界面(Graphical User Interface, GUI)设计,用户只需要通过鼠标点击和拖拽操作,即可完成数据输入和分析等任务。
同时,SPSS还提供了丰富的帮助文档和在线教程,用户可以通过查阅文档、学习教程,快速掌握软件的使用方法和技巧。
此外,SPSS还支持数据的可视化操作,用户可以通过设置变量属性、创建过滤器等方式,快速筛选和呈现感兴趣的数据,提高了数据处理和分析的效率。
除了常规的统计分析功能,SPSS还针对特定领域的需求,提供了相应的专业模块。
比如,在医学研究领域,SPSS提供了医学统计模块(Medical Statistics Module),支持药效学分析、生存分析等医学相关的统计技术;在市场营销领域,SPSS提供了市场营销模块(Marketing Research Module),支持市场调研、市场细分、顾客满意度分析等市场营销相关的分析;在社科领域,SPSS提供了社会调查模块(Social Survey Module),支持问卷设计、抽样、数据收集等社会科学调查相关的研究。
使用SPSS统计软件进行数据分析入门指南第一章:SPSS统计软件简介SPSS(Statistical Package for the Social Sciences,社会科学统计软件包)是一款专门用于数据分析和统计建模的软件工具。
它提供了一系列的数据处理、描绘和统计分析方法,可用于解决各种统计学问题。
本章将介绍SPSS软件的基本概念和功能,并指导读者进行安装和设置。
1.1 SPSS软件的背景和发展历程1.2 SPSS软件的版本和特点1.3 安装SPSS软件1.4 设置SPSS软件的语言和界面1.5 SPSS数据文件的格式和类型1.6 打开、保存和关闭SPSS数据文件第二章:SPSS数据管理与数据清洗数据分析的第一步是数据的收集和管理。
本章将介绍如何在SPSS软件中进行数据的导入、清洗和变换,以确保数据的质量和准确性。
2.1 导入数据文件2.2 数据类型和变量属性设置2.3 缺失值处理2.4 数据的筛选与排序2.5 数据的变换与合并2.6 数据文件的导出和备份第三章:SPSS数据描述统计分析在进行深入的数据分析之前,首先需要对数据进行描述和总结,以获得对数据分布和特征的初步了解。
本章将介绍SPSS如何进行数据的描述性统计分析和数据可视化。
3.1 数据的描述性统计量3.2 数据的频数和交叉分析3.3 数据的描述性图表3.4 数据的相关分析3.5 数据的因子分析3.6 数据的聚类分析第四章:SPSS统计推断分析统计推断分析是利用样本数据对总体进行推断的一种方法。
本章将介绍如何利用SPSS软件进行统计推断分析,并解释如何进行假设检验、方差分析和回归分析等常用的统计方法。
4.1 参数统计分析与假设检验4.2 方差分析与多元方差分析4.3 相关与回归分析4.4 判别分析与逻辑回归分析4.5 非参数统计分析方法4.6 多元统计分析方法第五章:SPSS高级数据分析与报告生成在完成基本的数据分析后,可以进行一些更高级的操作和分析,以进一步深入了解数据的内在关系和结构。
spss软件使用教程SPSS(Statistical Package for the Social Sciences)是一款用于统计分析的软件,可以对大量数据进行处理、分析和呈现。
以下是一个简单的SPSS软件使用教程,帮助您快速上手:1. 打开SPSS软件:点击桌面上的SPSS图标或通过开始菜单打开软件。
2. 创建新的数据文件:选择“文件”菜单中的“新建”选项,或使用快捷键Ctrl + N,然后选择“数据集”。
3. 导入数据:在数据文件中导入数据,可以从Excel、CSV文件等导入。
选择“文件”菜单中的“打开”选项,或使用快捷键Ctrl + O,然后选择需要导入的数据文件。
4. 数据清理与变量设置:导入数据后,您可以对数据进行清理和变量设置。
使用“数据”菜单中的“变量查看器”选项,可以查看已导入数据的变量和数据类型。
若存在缺失值或异常值,可以使用“数据”菜单中的“数据清理”选项进行处理。
5. 数据分析:使用SPSS进行数据分析的主要功能是“统计”菜单。
您可以选择不同的统计方法,如描述统计、方差分析、回归分析等。
选择相应的统计方法后,设定变量和分析选项,然后点击“确定”进行分析。
6. 数据可视化:SPSS提供了丰富的数据可视化功能,可以通过图表、统计图、散点图等方式呈现数据。
选择“图表”菜单中的“创建”选项,选择所需的图表类型,然后指定变量和数据类型。
7. 输出结果:分析完成后,您可以查看并保存分析结果。
选择“窗口”菜单中的“输出”选项,可以查看结果,也可以导出为PDF、Excel等格式。
8. 存储与使用分析模板:您可以保存自己常用的分析和设置为模板,以便日后使用。
选择“文件”菜单中的“存储”选项,保存当前工作为模板文件。
以上是SPSS软件的基本使用教程,希望能帮助您快速上手该软件。
记住,熟能生巧,多实践和尝试,您将掌握更多的数据分析技能。
SPSS软件能做什么?
SPSS是目前社会科学领域最流行的统计分析软件之一,被广泛应用于
市场调研、社会调查、医学研究等领域。
那么,SPSS到底能做什么呢?
一、数据管理
SPSS可以对数据进行快速、准确、标准化的处理,包括数据清洗、缺
失值处理、变量名修改、变量重分类、数据转换、数据合并等,以满
足数据分析的要求。
二、描述性分析
SPSS可以进行描述性统计分析,如平均数、中位数、标准差和频数分
布表等。
通过这些统计量,我们可以了解数据的基本情况,如数据属
于正态分布还是偏态分布,数据的集中趋势和离散程度等。
三、推断性统计分析
SPSS可以进行推断性统计分析,如t检验、方差分析、回归分析、因
子分析等。
这些统计方法可以帮助研究人员进行数据分析、模型建立
和检验,以回答他们的研究问题。
四、数据可视化
SPSS可以生成直方图、散点图、线图、条形图等数据可视化图表,使数据更加直观、易于理解。
通过数据可视化,我们可以快速地发现数据中的规律和异常点,进而进行更有针对性的数据分析。
五、写作和发布
SPSS提供多种数据和结果的写作和发布方式,如Word、Excel、PDF 等。
这些数据和结果可以被方便地嵌入报告或文章中,用于展示研究的结果和结论。
总之,SPSS是一种功能强大、易用性高的统计分析软件。
使用它可以帮助研究人员提高数据分析的效率和准确性,为科研工作提供有力的支持。
spss19.0软件安装SPSS 19.0 软件安装简介SPSS(统计分析软件包)是一款功能强大的统计分析软件,被广泛用于数据分析和数据挖掘领域。
本文将详细介绍 SPSS 19.0 软件的安装步骤,以帮助用户顺利安装并开始使用该软件。
步骤一:获取安装文件在开始安装 SPSS 19.0 软件之前,首先需要获得软件的安装文件。
您可以在 IBM 官方网站或其他可信赖的软件下载平台上下载 SPSS 19.0 的安装文件。
确保您下载的是适用于您的操作系统的版本。
步骤二:运行安装程序在获取到 SPSS 19.0 的安装文件后,双击该文件,然后运行安装程序。
在安装程序启动时,您将看到一个欢迎界面,点击“下一步”按钮继续。
步骤三:阅读软件许可协议在安装过程中,您将被要求阅读并接受软件许可协议。
请仔细阅读协议内容,如果您同意协议条款,请选择“我接受许可协议”选项,然后点击“下一步”按钮。
步骤四:选择安装位置在下一个界面上,您需要选择SPSS 19.0 的安装位置。
默认情况下,软件将安装在系统的默认位置。
如果您想要更改安装位置,可以点击“浏览”按钮,选择您希望安装的目录,然后点击“下一步”按钮。
步骤五:选择安装组件在这一步,您可以选择要安装的组件。
SPSS 19.0 提供了多个组件,包括 Base、Regression、Advanced Statistics 等等。
您可以根据自己的需求选择要安装的组件。
默认情况下,所有组件都将被安装。
选择完成后,点击“下一步”按钮。
步骤六:选择许可证类型在这一步,您需要选择 SPSS 19.0 的许可证类型。
如果您拥有有效的许可证,选择“使用现有的许可证”,然后在下方输入许可证信息。
如果您没有许可证,可以选择“试用版许可证(30天试用)”。
选择完成后,点击“下一步”按钮。
步骤七:选择安装类型在这一步,您可以选择 SPSS 19.0 的安装类型。
通常情况下,推荐选择“完整安装”,以获取该软件的全部功能。
spss功能SPSS (Statistical Package for the Social Sciences) 是一款统计分析软件,广泛应用于社会科学和商业领域的数据处理和分析任务。
SPSS具有多种功能和特点,如下:1. 数据管理:SPSS可以帮助用户对数据进行清洗、转换和整理。
它支持导入多种数据格式,如Excel、CSV和数据库,用户可以使用SPSS进行数据清理、合并和组织。
2. 数据描述:SPSS提供了丰富的数据描述和摘要功能。
用户可以使用SPSS生成频数表、交叉表和描述性统计报告,帮助他们了解数据的基本特征和结构。
3. 数据可视化:SPSS提供了多种数据可视化方法,如直方图、散点图和箱线图。
用户可以使用SPSS以图形的方式展示数据的分布和关系,从而更直观地理解数据。
4. 推断统计:SPSS支持多种推断统计分析方法,如假设检验、方差分析、回归分析和相关分析。
用户可以使用SPSS对样本数据进行统计推断,评估变量之间的关系和差异。
5. 预测建模:SPSS提供了预测建模功能,如逻辑回归、决策树和聚类分析。
用户可以使用SPSS构建和评估预测模型,从而预测分类和群组。
6. 定制分析:SPSS允许用户进行自定义分析。
用户可以使用SPSS的语法或界面进行高级分析,根据自己的需求定制分析过程。
7. 报告和输出:SPSS可以生成专业的分析报告和结果输出。
用户可以使用SPSS将分析结果导出为图表、表格和报告,方便他们展示和分享分析结果。
8. 教学和学术研究:SPSS被广泛应用于教学和学术研究领域。
它是许多统计学课程和研究项目的首选工具,可以帮助学生和研究者进行数据分析和统计建模。
总之,SPSS是一款功能强大的统计分析软件,提供了丰富的数据管理、描述、可视化、推断统计和预测建模功能,帮助用户进行数据处理和分析任务。
无论是在社会科学、商业领域还是学术研究中,SPSS都是一个重要的工具。
统计分析软件SPSS介绍统计分析软件SPSS介绍SPSS(Statistical Package for the Social Sciences)是一款统计分析软件,可用于数据整理、描述统计、推断统计、数据挖掘等多个领域的数据分析。
它是世界上最常用的统计软件之一,被广泛应用于社会科学、市场调研、医学、教育、经济等领域。
SPSS由IBM公司开发和销售,它的前身是20世纪60年代诞生的社会科学中最早的计算机统计软件,经过多个版本的迭代发展,目前已经成为一套十分强大且易于使用的工具。
SPSS的特点和优势主要体现在以下几个方面:1. 数据整理与管理:SPSS可以对数据进行整理、清洗和转换,包括缺失值处理、异常值检测、变量重编码等功能,使得原始数据成为适合分析的格式。
同时,SPSS还支持对数据库的连接和数据的导入导出,方便在不同数据源之间进行数据交换和整合。
2. 描述性统计分析:SPSS提供了丰富的统计描述方法,包括频数统计、交叉表分析、描述性统计、图表制作等功能。
用户可以通过简单的指令或图形界面快速生成各种统计报告和图表,对数据的基本特征进行总结和描述。
3. 推断性统计分析:SPSS支持多种推断性统计方法,包括参数检验、非参数检验、方差分析、回归分析等。
用户只需输入相关指令或通过可视化界面选择相应的分析模型,即可进行各种复杂的统计分析。
此外,SPSS还对结果进行了自动解释,使用户能够更好地理解统计结果。
4. 数据挖掘与预测分析:SPSS的数据挖掘模块可以发现和分析数据中的隐藏模式、关联规则和趋势,帮助用户发现数据背后的规律和价值,从而做出更科学的决策。
同时,SPSS还具备强大的预测分析功能,包括回归预测、时间序列预测、聚类分析、决策树和神经网络等方法,可用于市场预测、客户细分、产品定价等领域。
5. 可定制性与扩展性:SPSS提供了丰富的语言和界面定制选项,用户可以根据自己的需求编写自定义的命令和程序,实现特定的统计算法和分析流程。
SPSS软件使用教程什么是SPSS软件?SPSS(Statistical Package for the Social Sciences,社会科学统计软件包)是一种广泛使用的统计分析软件。
它为用户提供了一个功能强大且易于使用的平台,用于处理和分析大量数据,并生成高质量的统计报告和图形。
SPSS可以适用于各个领域,包括社会科学、医学、商业和工程等。
安装SPSS软件要使用SPSS软件,首先需要安装它。
以下是安装SPSS软件的步骤:1.在IBM官方网站上下载SPSS软件的安装程序。
2.运行安装程序并按照提示进行安装。
3.在安装过程中选择所需的组件和功能。
4.完成安装后,启动SPSS软件。
SPSS软件界面介绍一旦成功安装SPSS软件并启动它,将会出现SPSS软件的主界面。
以下是主界面的主要部分和功能:1.菜单栏:位于顶部,包含各种菜单选项,如文件、编辑、数据、转换、分析等。
用户可以通过菜单栏访问软件的各种功能。
2.工具栏:位于菜单栏下方,提供了一些常用工具和快捷按钮,可快速访问某些功能。
3.语法栏:位于工具栏下方,用于输入和执行SPSS语法命令。
通过使用SPSS语法,用户可以更精确地指定数据处理和分析操作。
4.数据编辑器:位于左侧,显示当前加载的数据集。
用户可以在此进行数据输入、编辑和查看。
5.输出窗口:位于右侧,显示SPSS软件生成的统计报告、图表和结果。
6.语法参考:位于底部,提供了SPSS语法的详细文档和参考。
导入数据在开始数据分析之前,首先需要将数据导入到SPSS软件中。
以下是导入数据的步骤:1.打开SPSS软件并创建一个新的数据集。
2.在数据编辑器中选择“文件” - “打开”选项,然后选择要导入的数据文件。
3.在打开文件对话框中,选择正确的文件类型和位置,然后点击“确定”按钮。
4.如果需要,根据数据文件的格式和属性进行适当的设置和调整。
5.完成设置后,点击“导入”按钮,将数据导入到SPSS软件中。
SPSS统计分析软件及其应用SPSS(Statistical Package for the Social Sciences)是一款专业的统计分析软件,由IBM公司开发。
SPSS拥有强大的数据处理、分析和报告功能,可以用于各种统计方法和研究领域的数据分析,被广泛应用于社会科学、市场调查、医学研究等领域。
SPSS的主要功能包括数据管理、数据输入与输出、数据清洗、统计分析、预测建模和报告生成等。
用户可以通过SPSS进行数据的整理、清洗、合并等操作,使数据整理得更加规范和准确。
SPSS还提供了丰富而灵活的统计分析功能,包括描述统计、推断统计、多元分析、拟合分析、时间序列和预测等方法,可以帮助用户全面了解数据的特征和规律。
具体来说,SPSS可以用于以下几个方面的数据分析:1.描述统计:SPSS可以计算数据的平均值、方差、标准差、最大值和最小值等统计指标,可以生成频数表、交叉表和多维表等描述性统计报告。
2.推断统计:SPSS提供了各种假设检验方法,如t检验、方差分析、相关分析和回归分析等,可以帮助用户进行样本间比较和关系分析。
3.多元分析:SPSS可以进行多元方差分析、因子分析、主成分分析和聚类分析等多元统计方法,可以揭示变量之间的复杂关系和分组结构。
4.拟合分析:SPSS可以进行线性回归、非线性回归和多项式回归等拟合分析,可以建立各种数学模型来解释和预测数据。
5.时间序列和预测:SPSS可以进行时间序列分析、季节调整和预测建模等方法,可以对时间序列数据进行趋势分析和预测。
6.数据可视化和报告生成:SPSS提供了丰富的图表和图形绘制功能,可以绘制柱状图、折线图、散点图和饼图等,可以生成演示文稿和报告。
SPSS的应用广泛,不同领域的研究人员和企业常常使用SPSS来进行统计分析。
在社会科学领域,SPSS可以用于教育、心理学、社会学等研究中的数据分析和统计推断。
在市场调查领域,SPSS可以用于处理、分析和报告大量的市场调研数据,帮助企业了解消费者行为和市场趋势。
《SPSS软件》(双语教学)教学大纲编写:田飞安徽大学社会学系二O O七年一月课程性质与设置目的要求(前言)《SPSS软件》课程是社会学专业、社会工作专业高等教育的专业核心知识课程。
《SPSS软件》以本科二年级学生为讲授对象,是应用性学科。
设置本课程的目的是:通过本课程的学习,使学生全面了解和掌握SPSS技术,具体内容有软件窗口操作、数据录入与管理,定性变量和定量变量的描述统计,T检验、卡方检验、F检验等推论统计。
学习本课程的要求是:先修课程要求:学习者应具有大学英语四级以上水平,已修完计算机文化基础和应用基础两门课程并成绩合格。
本课程计划72学时,4学分,1学期上完。
选用教材:1、《SPSS13.0步步通》(第六版)(英文原版影印)世界图书出版公司2006年。
SPSS for Windows Step-by-Step:A Simple Guide and Reference, 13.0 Update. Dar Darren George, Paul Mallery, Person Education 20062、《社会统计分析方法――SPSS软件应用》(21世纪社会学系列教材)郭志刚,中国人民大学出版社,2005年。
教学手段:所有教学环节均采用英语。
课堂教学采用多媒体手段讲授;所有教学材料(每次课的POWERPOINT电子教案、每次课主要内容及作业要求、用以打印的PDF格式的电子教案、练习与举例所用的数据、阅读材料等)均上载在互连网上供学生预习、学习和复习(/wwwuser/shx/32.htm);实验教学安排在计算机机房里进行。
课堂教学与实验教学各占一半课时。
考核方法:平时上机练习、期中考试和期末考试。
Table of Contents1. An Overview of SPSS for Windows Step by Step2. SPSS Windows Processes: Mouse and keyboard processing, frequently-used dialog boxes, editing output, printing results, the Options Option3. Creating and Editing a Data File4. Managing Data: Listing cases, replacing missing values, computing new variables, recoding variables, exploring data, selecting cases, sorting cases, merging files5. GRAPHS: Creating and editing graphs and charts6. FREQUENCIES: Frequencies, bar charts, histograms, percentiles7. DESCRIPTIVE Statistics: Measures of central tendency, variability, deviationfrom normality, size, and stability8. CROSSTABULATION and Chi-Square (*2) Analyses9. The MEANS Procedure10. Bivariate CORRELATION: Bivariate correlations, partial correlations, and the correlation matrix11. The T TEST Procedure: Independent-samples, paired-samples, andone-sample tests12. The One-Way ANOVA Procedure: One-way Analysis of Variance13. General Linear Models: Two-Way Analysis of Variance14. General Linear Models: Three-Way Analysis of Variance and the influence of covariates15. Simple Linear REGRESSION16. MULTIPLE REGRESSION ANALYSIS17. NONPARAMETRIC Procedures18. RELIABILITY ANALYSIS: Coefficient alpha (*) and split-half reliability19. MULTIDIMENSIONAL SCALING20. FACTOR ANALYSIS21. CLUSTER ANALYSIS22. DISCRIMINANT ANALYSIS23. General Linear Models: MANOVA and MANCOVA Multivariate Analysis of Variance and Covariance24. General Linear Models: Repeated-Measures MANOVA: Multivariate Analysis of Variance with repeated measures and within-subjects factors25. LOGISTIC REGRESSION26. Hierarchical LOGLINEAR MODELS27. General LOGLINEAR MODELS28. RESIDUALS: Analyzing left-over varianceChapter 1 An Overview of SPSS for Windows Step by Step I)The purpose of studyThis chapter introduces the major concepts discussed in this book and gives a brief overview of the book’s organization and basic tools that are needed in order to use it.II)Content1.1.Necessary skill1.2.Scope of coverage1.3.overviewanization, chapter by chapter1.5.an introduction to the example1.6.typographical and formulating conventionIII)Teaching notesSee PPT related.IV)Importance, difficulties and teaching methods⏹Importance: scope of coverage, example⏹Difficulties: no⏹Teaching methods: class teaching accompanying with a projection on thescreen and SPSS running show.V)Thinking and practicingHomework: install SPSS softwareVI)Reading materialsNo.Chapter 2 SPSS Windows ProcessesI.The purpose of studyThis chapter will give you the remaining skills required to use SPSS for windows: how to use the mouse, how to navigate using the taskbar, what the various buttons (on the toolbar and elsewhere) do, and how to navigate the primary windows used in SPSS.II.Content1、The mouse2、The taskbar and start menu3、Common buttons4、The data window5、Other commonly used windows6、The output window7、Printing out8、The “options..” optionIII、Teaching notesSee PPT related.IV、Importance, difficulties and teaching methodsImportance:o Output windowo Optiono Data window∙Difficulties:o Data window∙Teaching methods: class teaching accompanying with a projection on the screen and SPSS running show.V、Thinking and practicingHomework: review chapter one and preview chapter 2.VI、Reading materialsChapter 3 Creating and Editing a Data FileI.The purpose of studyThis chapter describes the first step necessary to analyze data: typing the data into the computer. SPSS uses a spreadsheet for entering and editing data. V ariousnames are listed across the top columns, case or subject numbers are listed along the left rows, and cells in the middle are available for entering data. V ertical and horizontal scroll bars allow you to maneuver rapidly through even a large file, and there are several automatic go-to functions that allow you to identify or find a particular case number or variable quickly.II.Content3.1.Structure of the data file3.2.Step by step3.3.Formatting: name & type3.4.Formatting: width & decimals3.5.Formatting: labels & values3.6.Formatting: missing & columns3.7.Formatting: align & measure3.8.Entering data3.9.Editing data3.10.Example fileIII.Teaching notesSee PPT related.IV.Importance, difficulties and teaching methods●Importance: entering data, editing data●Difficulties: missing and columns, align and measure●Teaching methods: class teaching accompanying with a projection on thescreen.V.Thinking and practicingHomework: review chapter 3 and preview chapter 4.VI.Reading materialsChapter 4 Managing DataI.The purpose of studyThe three steps necessary to get as far as reading a data file and accessing a screen that will allow you to conduct analysis will begin the step by step section in each chapter. This will be followed by the steps necessary to run a particular analysis. A description of how to print the results and exit the program will conduct eachsection. The critical steps designed to perform a particular procedure for eachchapter will typically involved a sequence steps 4 that accesses and sets up the procedure, and one or more versions of sequence step 5 that describes thespecifics of how to complete the procedures..II.Content4.1.Introduction to managing data4.2.Listing cases4.3.Replacing missing valuesputing new variables4.5.Recoding variables4.6.Selecting cases4.7.Sorting cases4.8.Merging filesIII.Teaching notesSee PPT related.IV.Importance, difficulties and teaching methods●Importance: listing cases, computing new variable, selecting cases●Difficulties: replacing missing values, merging files●Teaching methods: class teaching accompanying with a projection on thescreen.V.Thinking and practicingHomework:Preview: chapter 5Review: chapter 4Lab exercise:p65: 1,4,5,8,11,12,13,14VI.Reading materialsChapter 5 GRAPHSI.The purpose of studySPSS for windows possesses impressive and dramatic graphics capabilities. It produces high quality graphs and charts, and editing and enhancement options are extensive. Furthermore, there are two complete sets of graphing proceduresavailable in SPSS: regular graphs and interactive graphs.II.Content5.1.Introduction5.2.The sample graph5.3.Producing graphs and charts5.4.Specific graphs summarized5.5.Editing graphs and charts5.6.Editing output graphsIII.Teaching notesSee PPT related.IV.Importance, difficulties and teaching methods●Importance: producing graphs and charts, specific graphs summarized●Difficulties: editing graphs and charts, editing output graphs●Teaching methods: class teaching accompanying with a projection on thescreen.V.Thinking and practicingPreview: chapter 6Review: chapter 5Lab exercise: p82,1,2,3,4,5,6VI.Reading materialsChapter 6 FREQUENCIESI.The purpose of studyThis chapter deals with frequencies, graphical representation of frequencies (bar charts and pie charts), histograms, and percentiles. Each of these procedures is described below. Frequencies is one of the SPSS commands in which it is possibleto access certain graphs directly(specifically, bar charts, pie charts, and histograms) rather than accessing them through the graph command.II.Content6.1.Introduction6.2.Frequencies6.3.Bar chart6.4.Histogram6.5.Percentile6.6.Step by step6.7.OutputIII.Teaching notesSee PPT related.IV.Importance, difficulties and teaching methods●Importance: frequency, bar chart, histogram●Difficulties: percentile●Teaching methods: class teaching accompanying with a projection on thescreen.V.Thinking and practicingPre view: chapter 7Review: chapter 6Lab exercise: p93: 1,3,5VI.Reading materialsChapter 7 Descriptive StatisticsI.The purpose of studyIt is designed to give you information about the distribution of your variables.Within this broad category are measures of central tendency (Mean, Median,Mode), measures of variability around the mean (Std deviation and V ariance),measures of deviation from normality ( Skewness and Kurtosis), informationconcerning the spread of the distribution (Maximum, Minimum, and Range), and information about the stability or sampling error of certain measures includingstandard error(S.E.) of the mean (S.E. mean), S.E. of kurtosis, and S.E. of theskewness..II.Content7.1.Statistical significance7.2.The normal distribution7.3.Mean, median, mode7.4.V ariance and standard deviation7.5.Skewness and kurtosis7.6.Maximum, minimum, range, sum7.7.Standard error7.8.Step by step7.9.outputIII.Teaching notesSee PPT related.IV.Importance, difficulties and teaching methods●Importance: mean, median, standard deviation, variance●Difficulties: skewness and kurtosis●Teaching methods: class teaching accompanying with a projection on thescreen.V.Thinking and practicingPre view: chapter 8Review: chapter 7Lab exercise: p104: 1,2,3VI.Reading materialsChapter 8 Crosstabulation and x2 AnalysesI.The purpose of studyThe purpose of crosstabulation is to show in tabular format the relationshipbetween two or more categorical variables. Categorical variables includes those in which distinct categories exists such as gender (female, male), ethnicity (Asian, White, Hispanic), place of residence (urban, suburban, rural), and many more.Crosstabulation can be used with continuous data only if such data are divided into separate categories, such as age (0—10 years, 20—39 years, 40—59 yeas, 60—79 years, 80—99 years), total points (0-99,100-149, 150-199, 200-250), and so on. While it is acceptable to perform crosstabulation with continuous data that has been categorized, it is rare to perform chi-square analysis with continuous data because a great deal of useful information about the distribution is lost by theprocess of categorization..II.Content8.1.Crosstabulation8.2.Chi-Square Tests of Independence8.3.Step by step8.4.Output8.5.Definition of termsIII.Teaching notesSee PPT related.IV.Importance, difficulties and teaching methods●Importance: crosstabulation, chi-square test●Difficulties: chi-square test●Teaching methods: class teaching accompanying with a projection on thescreen.V.Thinking and practicingReview: chapter 8Preview: chapter 9Lab exercise: p114:1,2,4VI.Reading materialsChapter 9 The Means ProcedureI.The purpose of studyIt allows you to explore certain characteristics of continuous variables withincertain categories. By the way of comparison, a crosstabulation of ethnicity by gender would indicate that there were 13 White females, 22 White males, 8Hispanic females, 6 Hispanic males, and so on. The means command allows you to view certain characteristic of continuous variables (such as total points, GPAs, percent) by groups. The utility of the means command for data such as our sample file is several-fold.II.Content9.1.Subpopulation differences9.2.Step by step9.3.Output9.4.Definition of termsIII.Teaching notesSee PPTIV.Importance, difficulties and teaching methodsa)Importance: means command screenb)Difficulties: interpret the results of means commandc)Teaching methods: class teaching accompanying with a projection on thescreen.V.Thinking and practicingReview: chapter 9Preview: chapter 10Lab exercise: p121:1,2,3VI.Reading materialsChapter 10 Bivariate CorrelationI.The purpose of studyIt is designated by the lower case letter r, and range in value from -1 to +1. acorrelation is often called a bivariate correlation to designate a simple correlation between two variables, as opposed to relationships among more than two variables, as frequently observed in multiple regression analysis or structural equationmodeling.II.Content10.1.What is a correlation10.2.Linear vs. curvilinear10.3.Significance10.4.Direction of causality10.5.Partial correlation10.6.Step by step10.7.outputIII.Teaching notesSee PPTIV.Importance, difficulties and teaching methodsa)Importance: concept of correlation and linear trendb)Difficulties: partial correlation.c)Teaching methods: class teaching accompanying with a projection on thescreen.V.Thinking and practicingReview: chapter 10Preview: chapter 11Lab exercise: p132:1,2VI.Reading materialsChapter 11 The T T est ProcedureI.The purpose of studyA T test is a procedure used for comparison sample means to see if there issufficient evidence to infer that the means of the corresponding population distributions also differ. More specifically, for an independent-sample t tests, a sample is taken from two populations. The two samples are measured on some variable of interest. A t test will determine if the means of the two samples distributions differ significantly from each other.II.Content11.1.what are t tests11.2.Independent-Samples t tests11.3.Paired-Samples t tests11.4.One-Sample t tests11.5.Tests of significance11.6.Step by step11.7.OutputIII.Teaching notesSee PPTIV.Importance, difficulties and teaching methods●Importance: Independent-Samples t tests, One-Sample t tests●Difficulties: Paired-Samples t tests●Teaching methods: class teaching accompanying with a projection on thescreen.V.Thinking and practicingReview: chapter 11Preview: chapter 12Lab exercise: p142: 1,3,6,8,9VI.Reading materialsChapter 12 The One-Way ANOV A ProcedureI.The purpose of studyOne-way ANOVA is obtained through the SPSS One-Way ANOV A command.While a one-way analysis of variance could also be accomplished using theGeneral Linear Models command, the One-Way ANOV A command has certain options not available in General Linear Models, including post test, such as Tukey and Scheffe, and planned comparisons of different groups or comparisons ofgroups.II.Content12.1.Introduction to One-Way ANOV A12.2.Step by step12.3.Post Hoc multiple comparisons12.4.Contrasts: planned comparisons12.5.outputIII.Teaching notesSee PPT related.IV.Importance, difficulties and teaching methodsa)Importance: understanding the one-way ANOVAb)Difficulties: Post Hoc multiple comparison, Contrasts: planned comparisonc)Teaching methods: class teaching accompanying with a projection on thescreen.V.Thinking and practicingReview: chapter 12Preview: chapter 13Lab exercise: p152: 1,2,3VI.Reading materialsChapter 13 General Linear Models: Two-Way ANOV AI.The purpose of studyIt is designated a single dependent variable (always continuous ) and utilizesexactly two independent variables (always categorical ) to gain an understanding of how the independent variables influence the dependent variable. This operation requires the use of the General Linear Models-Univariate command, because the One-Way ANOV A command is capable of conducting only one-way analyses.II.Content13.1.introduction to ANOV A models13.2.Statistical power13.3.Two-Way Analysis of V ariance13.4.Main effects and interactions13.5.Step by step13.6.OutputIII.Teaching notesSee PPT related.IV.Importance, difficulties and teaching methodsa)Importance: Two-Way Analysis of V arianceb)Difficulties: Statistical powerc)Teaching methods: class teaching accompanying with a projection on thescreen.V.Thinking and practicingReview: chapter 13Preview: chapter 14VI.Reading materialsChapter 14 General Linear Models: Three-Way ANOVA I.The purpose of studyA three-way or higher-order ANOVA is complex by any standards, and a verythorough and careful explanation of the analysis done here will hopefully assist you in untangling any three-way or higher-order ANOVAs that you might conduct.An almost universally-practiced procedure for helping to clarify ANOV A results is to graph the cell means for interactions.II.Content14.1.Introduction to ANOV A models14.2.Three-Way Analysis of V ariance14.3.The influence of covariance14.4.Step by step14.5.Output14.6.Main effect14.7.Two-Way interaction14.8.Three-Way interaction14.9.Output with a covariateIII.Teaching notesSee PPT related.IV.Importance, difficulties and teaching methodsa)Importance: Two-Way interaction, Three-Way interactionb)Difficulties: Output with a covariate, The influence of covariancec)Teaching methods: class teaching accompanying with a projection on thescreen.V.Thinking and practicingReview: chapter 14Preview: chapter 15Lab exercise: p175: 2,4,5,7VI.Reading materialsChapter 15 Simple Linear RegressionI.The purpose of studyThe regression procedure is designed to perform either simple regression ormultiple regressions. We split the command into two chapters largely for the sake of clarity. If the reader is unacquainted with multiple regressions, this chapter, on simple regression, will serve as an introduction. Several things will be covered in the introductory portion of this chapter: (a) the concept of predicted values and the regression equation, (b) the relationship between bivariate correlation and simpleregression, (c) the proportion of variance in one variable explained by another, and (d) a test for curvilinear relationships..II.Content15.1.Simple Linear Regression15.2.Predicted values15.3.The regression equation15.4.The amount of variance explained15.5.Curvilinear relationship15.6.Step by step15.7.Output: linear regression15.8.Output: Curvilinear regressionIII.Teaching notesSee PPT related.IV.Importance, difficulties and teaching methodsa)Importance: regression equation, the amount of variance explainedb)Difficulties: curvilinear relationshipc)Teaching methods: class teaching accompanying with a projection on thescreen.V.Thinking and practicingReview: chapter 15Preview: chapter 16Lab exercise: p189: 1,2,4,5,6,7,8VI.Reading materialsChapter 16 Multiple Regression AnalysisI.The purpose of studyMultiple regressions are the natural extension of simple linear regressionpresented in prior chapter. In simple regression, we measured the amount ofinfluence one variable had on a second variable. We also computed the constant and coefficient for a regression equation designed to predict the values of thedependent variable, based on the values of the independent variable. While simple regression shows the influence of two or more variables on a designateddependent variable.II.Content16.1.Multiple regression analysis16.2.The regression equation16.3.The amount of variance explained16.4.Curvilinear trends and model building16.5.Step by step16.6.Methods for variable selection16.7.Output16.8.Changes as each new variable is added16.9.Definitions of termsIII.Teaching notesSee PPT related.IV.Importance, difficulties and teaching methodsa)Importance: t he amount of variance explainedb)Difficulties: Curvilinear trends and model building, Changes as each new variable isaddedc)Teaching methods: class teaching accompanying with a projection on thescreen.V.Thinking and practicingReview: chapter 16Preview: chapter 17Lab exercise: p205:1,4VI.Reading materialsChapter 17 Nonparametric ProcedureI.The purpose of studyA parametric test is one that is based on certain parameters. The criticalparameters that most of the procedures described in this book are based on is that data from samples (and the populations from which they are down), thenonparametric tests procedures deals primarily with populations that are notnormally distributed and considered how to conduct statistical tests if theassumption of normally is violated.II.Content17.1.Nonparametric tests17.2.Step by step17.3.Mann-Whitney Rank-Sum Test17.4.The sign test17.5.Wilcoxon Matched-Pairs Signed-Ranks test17.6.The runs test17.7.The binomial test17.8.The kolmogorov-smirnov one-sample test17.9.The ons-sample chi-square test17.10.The Fridman one-way ANOV A17.11.The K-Sample median testIII.Teaching notesSee PPT related.IV.Importance, difficulties and teaching methods⏹Importance:◆Wilcoxon Matched-Pairs Signed-Ranks test◆The kolmogorov-smirnov one-sample test⏹Difficulties:◆The Fridman one-way ANOV A◆The K-Sample median test⏹Teaching methods: class teaching accompanying with a projection on thescreen.V.Thinking and practicingReview: chapter 17Preview: chapter 18Lab exercise: each example presented in the chapterVI.Reading materialsChapter 18 Reliability AnalysisI.The purpose of studyOf the thousands of measurement scales that have been constructed, two critical questions are asked of each: “Is it reliable?” and “Is it V alid?”. The question of reliability ( the topic of this chapter) addresses the issue of whether this instrument will produce the same results each time it is administered to the same person in the same setting. Instrument used in the social sciences are generally considered reliable if they produce similar results regardless of whom administers them and regardless of which forms are used. .II.Content18.1.Introduction to reliability18.2.Coefficient Alpha18.3.Split-half reliability18.4.Step by step18.5.output18.6.The K-Sample median testIII.Teaching notesSee PPT related.IV.Importance, difficulties and teaching methods⏹Importance:◆Coefficient Alpha◆Split-half reliability⏹Difficulties:◆The K-Sample median test⏹Teaching methods: class teaching accompanying with a projection on thescreen.V.Thinking and practicingReview: chapter 18Preview: chapter 19Lab exercise: p232:1.4.8,11,13VI.Reading materialsChapter 19 Multidimensional ScalingI.The purpose of studyMultidimensional scaling is useful because a picture is often easier to interpret than a table of numbers. In multidimensional scaling, a matrix made up ofdissimilarity data is converted into a one, two, or three-dimensional graphical representation of those distances. A particular advantage of multidimensional scaling graphs is that the distance between two points can be interpretedintuitively. If two points on a multidimensional scaling graph are for apart from each other, then they are unique dissimilar in the original dissimilar matrix; if two points are close together on the graph, then they are quite similar in the original matrix.II.Content19.1.Multidimensional scaling: introduction19.2.Square asymmetrical matrixes19.3.Square symmetrical matrixes with created distances from data19.4.Individual difference models19.5.Step by step19.6.outputIII.Teaching notesSee PPT related.IV.Importance, difficulties and teaching methods⏹Importance:◆Square asymmetrical matrixes◆Square symmetrical matrixes with created distances from data⏹Difficulties:◆Square symmetrical matrixes with created distances from data⏹Teaching methods: class teaching accompanying with a projection on thescreen.V.Thinking and practicingReview: chapter 19Preview: chapter 20Lab exercise: each example presented in this chapter.VI.Reading materialsChapter 20 Factor AnalysisI.The purpose of studyFactor analysis is most frequently used to identify a small number of factors (e.g., outgoing> that may be used to present relationships among sets of interrelated variables. Four basic steps are required to conduct a factor analysis: (a) calculate a correlation matrix of all variables to be used in the analysis. (b) Extract factors. (c) Rotate factors to create a more understandable factor structure. (d) Interpretresults.II.Content20.1.Factor analysis20.2.The correlation matrix20.3.Factor extraction20.4.Factor selection and rotation20.5.Interpretation of output20.6.Step by step20.7.OutputIII.Teaching notesSee PPT related.IV.Importance, difficulties and teaching methods⏹Importance:◆Factor selection and rotation◆The correlation matrix⏹Difficulties:◆interpretation of output⏹Teaching methods: class teaching accompanying with a projection on thescreen.V.Thinking and practicingReview: chapter 20Preview: chapter 21Lab exercise: each example presented in this chapter.VI.Reading materialsChapter 21 Cluster AnalysisI.The purpose of studyCluster analysis is in some way similar to factor analysis, but it also differs in several important ways. If you are unfamiliar with factor analysis, please read through the introduction of chapter 20 before attempting this chapter. Theintroduction paragraphs of this section will compare and contrast cluster analysis with factor analysis. Following this, the sequential steps of the cluster analysis procedure will be identified, along with a description of the data set used as an example to aid in the understanding of each step of the procedure.II.Content22.1.Hierarchical cluster analysis22.2.Cluster and factor analysis compared22.3.Procedures for conducting cluster analysis22.4.Step by step22.5.Output22.6.Agglomeration schedule22.7.V ertical icicle plot with complete linkage22.8.Dendogram with complete linkageIII.Teaching notesSee PPT related.IV.Importance, difficulties and teaching methods⏹Importance:◆Cluster and factor analysis compared◆Procedures for conducting cluster analysis⏹Difficulties:◆V ertical icicle plot with complete linkage⏹Teaching methods: class teaching accompanying with a projection on thescreen.V.Thinking and practicingReview: chapter 21Preview: chapter 22Lab exercise: each example presented in this chapter.VI.Reading materialsChapter 22 Discriminant AnalysisI.The purpose of studyThis technology is used primarily to predict membership in two or more mutually exclusive groups. The procedure for predicting membership is initially to analyze pertinent variables where the group membership is already known. For instance, a top research university wishes to predict whether applicants will complete a Ph.D.program successfully. Such a university will have many years of records of entry characteristics of applicants and additional information about whether theycompleted the Ph.D. and how long it took them.II.Content22.1.Discriminant analysis22.2.The example22.3.Step used in discriminant analysis22.4.Step by stepIII.Teaching notesSee PPT related.IV.Importance, difficulties and teaching methods⏹Importance:◆Discriminant analysis◆Step used in discriminant analysis。