The Case for Exploiting Packet Loss Locality in Multicast Loss Recovery
- 格式:pdf
- 大小:250.44 KB
- 文档页数:13

0 IntroductionMobile terminal in Ad hoc networks has a portable, light and facility qualities while the limited energy depends on batteries under the urgent and hazardous circumstance, which will have an impact on connectivity of the whole topological network and reduce the quality of communication when the nodes run out of energy due to failing to charge up and then stops. Currently, there are some various effective works about minimum energy in Ad hoc networks. There are Medium Access Control (MAC) layer mechanism, 2.5 layer mechanism and network energy-saving mechanism, respectively, as classified according to network hierarchy. PAMAS[1] protocol and 802.11PSM [2] protocol are used in MAC layer; minimum energy protocol in 2.5 layer includes Span [3] protocol for connection of backbone set and on-demand protocol deciding states of the nodes by network traffic as well as minimum transmission power routing (MTPR), minimum battery consumption routing (MBCR), and minimum-maximum battery consumption routing are all minimum energy protocol in the network layer.By exploiting multi-path in Ad hoc network, energy can be minimized, frequent routing updating can be reduced, data transmission rate can be improved and wireless network bandwidth can be increased. Source Transmit Power Selection Algorithm referred to in reference [7] is, currently, an efficient, multi-path and energy-minimized routing algorithm with disjoint nodes. However, due to properties of multicast in wireless transmission, if there are multi path transmitting data simultaneously, it will give rise to great collision problems, such as, high packets loss rate, bad transmitting performance of data. Hence, if we employ multi-path, we should exploit related strategy to lower the collision and choose minimum possibility of collision to conduct communication.In this paper, we proposed Energy Collision-Constrained Algorithm, (ECCA) and correlation factor was introduced to weigh the collision probability between node-disjoint multi-path when transmitting data simultaneously, then a upper limit for correlation factor was calculated according to service requirements, finally a minimum energy node-disjoint multi-path routing was found to satisfy the limit.1 the theory of energy in Mobile Ad hoc network1.1 energy model in Ad hoc networkIn nature, there are difference between wireless transmission and wire transmission: a link exists between two nodes in a traditional wire network, which refers to they can directly communicate through the physical medium while, in Ad hoc wireless network, referring to sending nodes try to send signals in high enough power to make Signal-to-Noise in the received nodes greater than threshold value which can ensure bit error rate in transmission lower than some value to ensure right transmission.Assume that the nodes in the network exploit omnidirectional aerial as well as regulate power dynamically, besides, every node has a maximum transmission power . This paper is based on wireless transmitting energy model in reference [7,8], inwhich signal power sent by sending nodes is decreased by ,where d is distancebetween source and destination ,generally, m is 2 or 4. If the node i want tocommunicate with the node j, the minimum sending power of the node i is :To simplify the calculation and simulation afterwards as well as without loss of generality, we assume k=1, therefore, the equation 1 can be changed to:In mobile Ad hoc network, if the node i can communicate with the node j, then the sending power of the node I must meet:The channel in wireless Ad hoc network is unidirectional due to the influence of emission frequency and geographical position. For example, the required power is lower when transmitted from uphill mountains to downhill, vice versa. Observed in unidirectional channel as follow:1.2 topological graph for energyWith the development off Global Positioning System (GPS), it’s become probability to achieve low-cost GPS in Ad hoc nodes, and the nodes may know where its physical position is as follow:1)firstly, locate the position of every node in the network and assign a related IDto every node to make all nodes form a node set by exploiting GPS2)as for random nodes , if , then there exists a link from i to j.to carry out energy management, we must assign a weight and the set “V” formed by all linksFigure1 topological graph for energy1.3 source transmission power selection (STPS)Assume that Q is the sub-graph which is formed by the energy topological graph with only M disjoint nodes. However, as for moving nodes frequently, the power of every node can be considered as the biggest weight in all borders. And the required power E(Q) equals the total power of all nodes. As shown in the following equations:Where . This is much difference compared to the traditional networks. For Ad hoc network, its energy is based on nodes, and equals the total power of all nodes, while it’s based on borders and equals the total weight of all borders in a traditional network. The equation 6 is for a traditional network:Figure 2 source transmission power selectionIn figure 2, it’s an sub-graph G’ of energy topological graph G with only M disjoint nodes. By observing, we find there is only border in the middle of nodes except the source node and destination node, so the nodes in the middle are constants while the power of sources have M kinds of choices. The total power E(Q) of sub-graph Q can be changed as follow:Where transmission power of source node is p(s) .2node-disjoint multi-path collision problemsthe properties of WMA (Wireless Multicast Advantage) refers to when one node is sending message, all nodes can received messages in its bound of power. In Figure 3, and are the distance from the node i to j, respectively. If the node jwants to communicate with the node k, in traditional networks, the power of thenode i equals , while in Ad hoc networks, the power of the node Iequals p(i)= according to the properties of WMA, apparently, it’s minimum energy. Rather , it’s this properties that results in collision problems.Assume , when the node i wants to send data packets to the node j, and the power of the node i is still ,and for this reason, the collision will happen.Figure 3.WMA propertiesTo reduce the great collision problems caused by using multi-path, we employed the disjoint path in the traditional networks. It includes node-disjoint and link-disjoint path. The former is better than the latter according to the collision problems. However, there still exist great collision problem between multi-path , even if the nodes are disjoint. Figure 4, two node-joint path, S-b-c-D and S-d-e-D, when b sends data packets to c, d can also receive the packets due to the weight in on the border (b, c) is greater up to 5 than that of on border (b, d). hence, when from b to c, the collision will happen. Similarly, when c sends packets to D, the node d and e can neither send packets or receive packets.Therefore, there still exist collision problems while transmitting data simultaneously, even though the nodes are disjoint. To solve this problem, a correlation factor was introduced to weigh the probability of collision in a group of node-joint.Definition 1 the correlation factor 入of two node-disjoint path: assume the correlation factor 入is the number of the borders of two node-disjoint in G’, andG’ is the sub-graph of the energy topological graph in two node-disjoint path. Figure.4 is illustrated by the two node-disjoint path, S-b-c-D and S-d-e-D.There are three such links in G’(b, d), (c, d), (c, e). the only common property is :one node belongs to S-b-c-D and another belongs to S-d-e-D. therefore, the correlation factor 入in figure 2 is 3.Figure 4. node-disjoint paths (入=3)Definition 2the correlation factor in k piece of nodes 入: a sub-graph G’ of energy topological graph G, and the k is the number of the two random borders belonging to k pieces of node-disjoint in G’.3Based on ECCA algorithmThis paper proposed two steps of ECCA:1)according to the loss packet rate required by the specific application andnetwork simulation experiments, we calculated a upper limit for collision, namely when the correlation factor in used node-disjointpaths, this will meet the requirement that specific application to losspackets rate.2)On the condition of the appropriate correlation factor less than , try tofind the most energy-saving group of node-disjoint paths with k pieces ofborders.To avoid overusing some node and make its energy run out quickly, bytrials, we define a threshold value , when choosing nodes, try not to usethose which the remains of energy is less than unless not using thisnode to find a group node-disjoint paths required.3.1 ECCA AlgorithmAssume that the source node S has M close nodes and the requiredpower of these close nodes are, respectively, and the relatedborders to these power are respectively.Input: networks energy topological graph GOutput: correlation factor , most energy-saving node-disjointpaths with k borders.Initialize: set m=k, the power of source node.Step1 modify energy topological graph G, delete the power of sourcenode, unable to cover to the borders ,attain the relatedpower of source nodes.Step2 for n=1 to k{operate algorithm on modified the topological graph , only usethose without marks which the remaining energy is greater than nodeand find a shortest path and mark the middle nodes in this path.}If node-disjoint path can’t be found ,then directly turn to step4; if it’s found,then determine the power of all nodes, attain the sub-graph of , marked .Step3relative to the sub-graph,calculate the transmission power of thesource node, and find the correlation factorcalculate the total transmission power by theequationstep4 set m=m+1, repeatedly run step1 to step4 until m>M.step5choose the smallest group of gathering energy, the total consumed power for the minimum energy which meets is :(8)3.2 the analysis of algorithm complexityAssume n as the number of node in the networks, so the complexity ofDijstra algorithm. The number of close nodes of the source node is at most the n-1, therefore, the algorithm complexity of the whole algorithm is , namely.3.3 the analysis of performanceaccording to the loss packet rate required by the specific application and network simulation experiments, we calculated a upper limit forcollision , namely when the correlation factor in usednode-disjoint paths, this will meet the requirement that specific application to loss packets rate.4.simulation analysissimulate a network which contains 80 hosts distribute in the grid of 50mX50m, the bound of MTU of every node is 100m,and set a=2. so the maximum power of every node is 10000. 40 CBRs will be produced by the upper traffic at random, the average lasting time of every connection corresponds to the time of 200 packets transmitted. The length of every packet is 512 bytes, the rate is 4 packets/s. data link exploits IEEE802.11 protocol, and the bandwidth is 2 Mbps. The initialized energy of every node is set to 20J, variance ranges from 0 to 2 by Gauss. The simulation time is 1200s. k=2 in ECCA. The simulation is produced as the number of the nodes are 20,30,40,50,60,70,80. the random chosen source and destination nodes in the simulation is the average value by 10 times of experimentations.4.2 the result of simulationFigure5. the comparison of loss packets rateThe first simulation compared the loss packets rate of two algorithm as shown in figure5. the benefit of ECCA compared with STPS is not finding the minimum energy but choosing the energy-saving path which can meet the condition of limit collision by correlation factor.The second one compared the energy consumption of two algorithm as shown infigure6. by choosing different the value of , we can compare the totaltransmission power , due to the path attained by ECCA. These two algorithm is much similar, and that shows the more strict the limit for collision, the more energy will be consumed. In general, compared with STPS, the increased volume of the total transmission power is very small.Figure5 comparison of power consumptionFigure7. comparison of seek timeWe compared the seek time of ECCA and STPS by simulation as shown in figure7. some calculations are added due to correlation factor in algorithm, so it took much time to seek the time. However, when the seek time respectively is 2,4,6 in ECCA, compared with the minimum energy algorithm STPS, it increases 0.02s,0.06s,0.07s respectively. Therefore, the seek time of ECCA is better. Reference:。
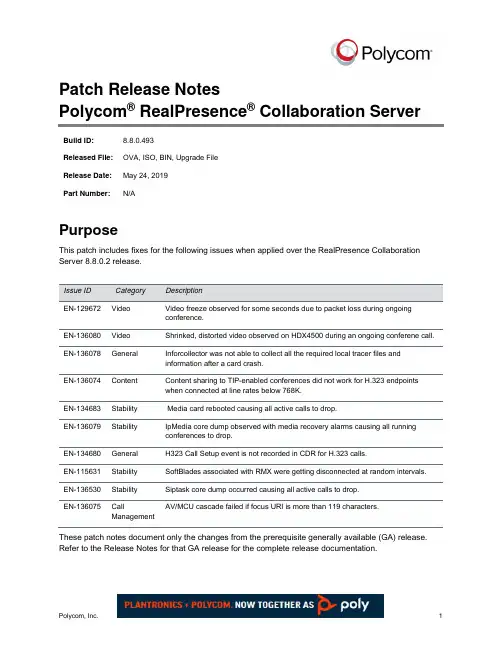
Patch Release NotesPolycom® RealPresence® Collaboration Server Build ID: 8.8.0.493Released File: OVA, ISO, BIN, Upgrade FileRelease Date: May 24, 2019Part Number: N/APurposeThis patch includes fixes for the following issues when applied over the RealPresence Collaboration Server 8.8.0.2 release.Issue ID Category DescriptionEN-129672 Video Video freeze observed for some seconds due to packet loss during ongoingconference.EN-136080 Video Shrinked, distorted video observed on HDX4500 during an ongoing conferene call. EN-136078 General Inforcollector was not able to collect all the required local tracer files andinformation after a card crash.EN-136074 Content Content sharing to TIP-enabled conferences did not work for H.323 endpointswhen connected at line rates below 768K.EN-134683 Stability Media card rebooted causing all active calls to drop.EN-136079 Stability IpMedia core dump observed with media recovery alarms causing all runningconferences to drop.EN-134680 General H323 Call Setup event is not recorded in CDR for H.323 calls.EN-115631 Stability SoftBlades associated with RMX were getting disconnected at random intervals. EN-136530 Stability Siptask core dump occurred causing all active calls to drop.AV/MCU cascade failed if focus URI is more than 119 characters.EN-136075 CallManagementThese patch notes document only the changes from the prerequisite generally available (GA) release. Refer to the Release Notes for that GA release for the complete release documentation.Patch Release Notes – 8.8.0.3 Polycom, Inc.Prerequisites and Configuration ConsiderationsFor information on prerequisites and configuration, please refer to the Polycom RealPresence Collaboration Server v8.8.0 Release Notes and Polycom RealPresence Collaboration Server v8.8 Administrator Guide.Installation and Upgrade NotesFor information on installation, please refer to the Polycom RealPresence Collaboration Server v8.8.0 Release Notes.。

科技论文题目The Application of LCD系别尚德光伏学院专业微电子技术班级1001学生姓名于路学号100100193指导教师谢丽君2013年4 月On the deployment of VolP in Ethernet networks:methodology and case studyKhaled Salah, Department of Information and Computer Science, King Fahd University of Petroleum and Minerals, P.O. Box 5066, Dhahran 31261, Saudi ArabiaReceived 25 May 2004; revised 3 June 2005; accepted 3 June 2005. Available online 1 July 2005.AbstractDeploying IP telephony or voice over IP (V olP) is a major and challenging task for data network researchers and designers. This paper outlines guidelines and a step-by-step methodology on how V olP can be deployed successfully. The methodology can be used to assess the support and readiness of an existing network. Prior to the purchase and deployment of V olP equipment, the methodology predicts the number of V olP calls that can be sustained by an existing network while satisfying QoS requirements of all network services and leaving adequate capacity for future growth. As a case study, we apply the methodology steps on a typical network of a small enterprise. We utilize both analysis and simulation to investigate throughput and delay bounds. Our analysis is based on queuing theory, and OPNET is used for simulation. Results obtained from analysis and simulation are in line and give a close match. In addition, the paper discusses many design and engineering issues. These issues include characteristics of V olP traffic and QoS requirements, V olP flow and call distribution, defining future growth capacity, and measurement and impact of background traffic.Keywords: Network Design,Network Management,V olP,Performance Evaluation,Analysis,Simulation,OPNET1 IntroductionThese days a massive deployment of V olP is taking place over data networks. Most ofthese networks are Ethernet based and running IP protocol. Many network managers are finding it very attractive and cost effective to merge and unify voice and data networks into one. It is easier to run, manage, and maintain. However, one has to keep in mind that IP networks are best-effort networks that were designed for non-real time applications. On the other hand, V olP requires timely packet delivery with low latency, jitter, packet loss, and sufficient bandwidth. To achieve this goal, an efficient deployment of V olP must ensure these real-time traffic requirements can be guaranteed over new or existing IP networks. When deploying a new network service such as V olP over existing network, many network architects, managers, planners, designers, and engineers are faced with common strategic, and sometimes challenging, questions. What are the QoS requirements for V olP? How will the new V olP load impact the QoS for currently running network services and applications? Will my existing network support V olP and satisfy the standardized QoS requirements? If so, how many V olP calls can the network support before upgrading prematurely any part of the existing network hardware? These challenging questions have led to the development of some commercial tools for testing the performance of multimedia applications in data networks. A list of the available commercial tools that support V olP is listed in [1,2]. For the most part, these tools use two common approaches in assessing the deployment of V olP into the existing network. One approach is based on first performing network measurements and then predicting the network readiness for supporting V olP. The prediction of the network readiness is based on assessing the health of network elements. The second approach is based on injecting real V olP traffic into existing network and measuring the resulting delay, jitter, and loss. Other than the cost associated with the commercial tools, none of the commercial tools offer a comprehensive approach for successful V olP deployment. I n particular, none gives any prediction for the total number of calls that can be supported by the network taking into account important design and engineering factors. These factors include V olP flow and call distribution, future growth capacity, performance thresholds, impact of V olP on existing network services and applications, and impact background traffic on V olP. This paper attempts to address those important factors and layout a comprehensive methodology for a successful deployment of any multimedia application such as V olP and video conferencing. However, thepaper focuses on V olP as the new service of interest to be deployed. The paper also contains many useful engineering and design guidelines, and discusses many practical issues pertaining to the deployment of V olP. These issues include characteristics of V olP traffic and QoS requirements, V olP flow and call distribution, defining future growth capacity, and measurement and impact of background traffic. As a case study, we illustrate how our approach and guidelines can be applied to a typical network of a small enterprise. The rest of the paper is organized as follows. Section 2 presents a typical network topology of a small enterprise to be used as a case study for deploying V olP. Section 3 outlines practical eight-step methodology to deploy successfully V olP in data networks. Each step is described in considerable detail. Section 4 describes important design and engineering decisions to be made based on the analytic and simulation studies. Section 5 concludes the study and identifies future work.Moreover, industrial automation communication protocols have not reached the same level of standardization as office communication networks, which further justifies the predominance of proprietary architectures.However, the success of the Internet and of the Web has started impacting the industrial V olP world too. Industrial users are starting to familiarize with Web interfaces, graphical quality, multimedia content, and features such as mobility, adaptivity, and personalization of the applications.At the same time,TCP-IP based communication protocols and embedded operating systems have started to spread in the industrial automation field [6][10], thus reducing the need of proprietary architectures making enterprisewide integration more appealing.In this scenario, it is easy to foresee a slow but inexorable convergence of the industrial V olP solutions towards standard architectures, standard communication protocols, and advanced interactive functions.Our work focuses on the design of a new distributed software architecture for VOLP systems able to provide features and services such as personalization, adaptivity, distribution, mobility, multi-channel notification, integration with office networks and software packages, although preserving the robustness, reliability, performance and cost-effectiveness oftraditional V olP solutions.The project, called ESAMyV olP is a research activity carried out in collaboration between Politecnico di Milano and ESA Elettronica S.p.A., an Italian company operating in the V olP market.2 Existing networkFig. 1 illustrates a typical network topology for a small enterprise residing in a high-rise building. The network shown is realistic and used as a case study only; however, our work presented in this paper can be adopted easily for larger and general networks by following the same principles, guidelines, and concepts laid out in this paper. The network is Ethernet-based and has two Layer-2 Ethernet switches connected by a router. The router is Cisco 2621, and the switches are 3Com Superstack 3300. Switch 1 connects Floors 1 and 2 and two servers; while Switch 2 connects Floor 3 and four servers. Each floor LAN is basically a shared Ethernet connecting employee PCs with workgroup and printer servers. The network makes use of VLANs in order to isolate broadcast and multicast traffic. A total of five LANs exist. All VLANs are port based. Switch 1 is configured such that it has three VLANs. VLAN1 includes the database and file servers. VLAN2 includes Floor 1. VLAN3 includes Floor2. On the other hand, Switch 2 is configured to have two VLANs. VLAN4 includes the servers for E-mail, HTTP, Web and cache proxy, and firewall. VLAN5 includes Floor 3. All the links are switched Ethernet 100 Mbps full duplex except for the links for Floors 1–3 which are shared Ethernet 100 Mbps half duplex.Industrial V olP products rarely implement innovative services, such as remote access to the plant control, messaging and remote notification.Indeed, V olP companies seem to privilege exclusively performance and good access to industrial communication standards, even if these factors could be incompatible with the adoption of innovative solution based on modern and solid Web architectures.Even the V olP players that seem to offer the most innovative contents (and claim their products are Web-enabled) still leverage on legacy architectures, typically exploiting monolithic Applications.On the contrary, recent studies [6] show how users are increasingly looking towards a new range of products with advanced features, superior graphical capabilities and improved usability that could grant:• remote and possibly, distributed control of an industrial plant;• remote notification solutions even when the user is not in front of the terminal;• personalization and automatic adaptation of the GUI;• integration with existing enterprise processes, systems and equipments;• openness to new standard and best practises in the field, by offering low cost modularity and extensibility.SCADA (Supervisory Control And Data Acquisition) systems recently introduced some interesting innovations but, as the acronym suggests, their target is focused on products that implement a wide range of high-level functionalities and that can be deployed in a large set of contexts.They are typically deployed on high-profile devices (PCs and powerful embedded systems) and represent a niche in the V olP market.In the other market’s sectors, innovation has been led by main vendors (e.g., Siemens), who have been working for the past few years in raising the level of the features provided by traditional V olP applications.Sm@rtAccess [15], for example, is a technology developed that allows distributing the control of an industrial plant over a maximum of three stations.Its functioning, though, is based on simply broadcasting the displayed interface of the apparatus that is directly connected with the plant to the others clients.The bandwidth requirements of this approach exceed the capability of a typical Internet connection.Progea [16] proposes a more innovative solution by offering remotization features and a Web-based architecture.Running the Progea server application on a Windows XP based PC, it is possible to remotely control a plant from an internet connected standard Web browser that has the support of a JVM (Java Virtual Machine).Even if powerful, this approach lacks in offering a portable solution since differentimplementations have been provided for different platforms.3 Step-by-step methodologyFig. 2 shows a flowchart of a methodology of eight steps for a successful V olP deployment. The first four steps are independent and can be performed in parallel. Before embarking on the analysis and simulation study, in Steps 6 and 7, Step 5 must be carried out which requires any early and necessary redimensioning or modifications to the existing network. As shown, both Steps 6 and 7 can be done in parallel. The final step is pilot deployment.3.1. V olP traffic characteristics, requirements, and assumptionsFor introducing a new network service such as V olP, one has to characterize first the nature of its traffic, QoS requirements, and any additional components or devices. For simplicity, we assume a point-to-point conversation for all V olP calls with no call conferencing. For deploying V olP, a gatekeeper or Call Manager node has to be added to the network [3,4,5]. The gatekeeper node handles signaling for establishing, terminating, and authorizing connections of all V olP calls. Also a V olP gateway is required to handle external calls. A V olP gateway is responsible for converting V olP calls to/from the Public Switched Telephone Network (PSTN). As an engineering and design issue, the placement of these nodes in the network becomes crucial. We will tackle this issue in design step 5. Other hardware requirements include a V olP client terminal, which can be a separate V olP device, i.e. IP phones, or a typical PC or workstation that is V olP-enabled. A V olP-enabled workstation runs V olP software such as IP Soft Phones .Fig. 3 identifies the end-to-end V olP components from sender to receiver [9]. The first component is the encoder which periodically samples the original voice signal and assigns a fixed number of bits to each sample, creating a constant bit rate stream. The traditionalsample-based encoder G.711 uses Pulse Code Modulation (PCM) to generate 8-bit samples every 0.125 ms, leading to a data rate of 64 kbps . The packetizer follows the encoder and encapsulates a certain number of speech samples into packets and adds the RTP, UDP, IP, and Ethernet headers. The voice packets travel through the data network. An important component at the receiving end, is the playback buffer whose purpose is to absorb variations or jitter in delay and provide a smooth playout. Then packets are delivered to the depacketizer and eventually to the decoder which reconstructs the original voice signal. We will follow the widely adopted recommendations of H.323, G.711, and G.714 standards for V olP QoS requirements.Table 1 compares some commonly used ITU-T standard codecs and the amount of one-way delay that they impose. To account for upper limits and to meet desirable quality requirement according to ITU recommendation P.800, we will adopt G.711u codec standards for the required delay and bandwidth. G.711u yields around 4.4 MOS rating. MOS, Mean Opinion Score, is a commonly used V olP performance metric given in a scale of 1–5, with 5 is the best. However, with little compromise to quality, it is possible to implement different ITU-T codecs that yield much less required bandwidth per call and relatively a bit higher, but acceptable, end-to-end delay. This can be accomplished by applying compression, silence suppression, packet loss concealment, queue management techniques, and encapsulating more than one voice packet into a single Ethernet frame.3.1.1. End-to-end delay for a single voice packetFig. 3 illustrates the sources of delay for a typical voice packet. The end-to-end delay is sometimes referred to by M2E or Mouth-to-Ear delay. G.714 imposes a maximum total one-way packet delay of 150 ms end-to-end for V olP applications . In [22], a delay of up to 200 ms was considered to be acceptable. We can break this delay down into at least three different contributing components, which are as follows (i) encoding, compression, and packetization delay at the sender (ii) propagation, transmission and queuing delay in the network and (iii) buffering, decompression, depacketization, decoding, and playback delay atthe receiver.3.1.2. Bandwidth for a single callThe required bandwidth for a single call, one direction, is 64 kbps. G.711 codec samples 20 ms of voice per packet. Therefore, 50 such packets need to be transmitted per second. Each packet contains 160 voice samples in order to give 8000 samples per second. Each packet is sent in one Ethernet frame. With every packet of size 160 bytes, headers of additional protocol layers are added. These headers include RTP+UDP+IP+Ethernet with preamble of sizes 12+8+20+26, respectively. Therefore, a total of 226 bytes, or 1808 bits, needs to be transmitted 50 times per second, or 90.4 kbps, in one direction. For both directions, the required bandwidth for a single call is 100 pps or 180.8 kbps assuming a symmetric flow.3.1.3. Other assumptionsThroughout our analysis and work, we assume voice calls are symmetric and no voice conferencing is implemented. We also ignore the signaling traffic generated by the gatekeeper. We base our analysis and design on the worst-case scenario for V olP call traffic. The signaling traffic involving the gatekeeper is mostly generated prior to the establishment of the voice call and when the call is finished. This traffic is relatively small compared to the actual voice call traffic. In general, the gatekeeper generates no or very limited signaling traffic throughout the duration of the V olP call for an already established on-going call. In this paper, we will implement no QoS mechanisms that can enhance the quality of packet delivery in IP networks.A myriad of QoS standards are available and can be enabled for network elements. QoS standards may include IEEE 802.1p/Q, the IETF’s RSVP, and DiffServ.Analysis of implementation cost, complexity, management, and benefit must be weighed carefully before adopting such QoS standards. These standards can be recommended when the cost for upgrading some network elements is high and the network resources are scarce and heavily loaded.3.2. V olP traffic flow and call distributionKnowing the current telephone call usage or volume of the enterprise is an importantstep for a successful V olP deployment. Before embarking on further analysis or planning phases for a V olP deployment, collecting statistics about of the present call volume and profiles is essential. Sources of such information are organization’s PBX, telephone records and bills. Key characteristics of existing calls can include the number of calls, number of concurrent calls, time, duration, etc. It is important to determine the locations of the call endpoints, i.e. the sources and destinations, as well as their corresponding path or flow. This will aid in identifying the call distribution and the calls made internally or externally. Call distribution must include percentage of calls within and outside of a floor, building, department, or organization. As a good capacity planning measure, it is recommended to base the V olP call distribution on the busy hour traffic of phone calls for the busiest day of a week or a month. This will ensure support of the calls at all times with high QoS for all V olP calls. When such current statistics are combined with the projected extra calls, we can predict the worst-case V olP traffic load to be introduced to the existing network.Fig. 4 describes the call distribution for the enterprise under study based on the worst busy hour and the projected future growth of V olP calls. In the figure, the call distribution is described as a probability tree. It is also possible to describe it as a probability matrix. Some important observations can be made about the voice traffic flow for inter-floor and external calls. For all these type of calls, the voice traffic has to be always routed through the router. This is so because Switchs 1 and 2 are layer 2 switches with VLANs configuration. One can observe that the traffic flow for inter-floor calls between Floors 1 and 2 imposes twice the load on Switch 1, as the traffic has to pass through the switch to the router and back to the switch again. Similarly, Switch 2 experiences twice the load for external calls from/to Floor 3.3.3. Define performance thresholds and growth capacityIn this step, we define the network performance thresholds or operational points for a number of important key network elements. These thresholds are to be considered when deploying the new service. The benefit is twofold. First, the requirements of the new service to be deployed are satisfied. Second, adding the new service leaves the network healthy andsusceptible to future growth. Two important performance criteria are to be taken into account. First is the maximum tolerable end-to-end delay; and second is the utilization bounds or thresholds of network resources. The maximum tolerable end-to-end delay is determined by the most sensitive application to run on the network. In our case, it is 150 ms end-to-end for V olP. It is imperative to note that if the network has certain delay sensitive applications, the delay for these applications should be monitored, when introducing V olP traffic, such that they do not exceed their required maximum values. As for the utilization bounds for network resources, such bounds or thresholds are determined by factors such as current utilization, future plans, and foreseen growth of the network. Proper resource and capacity planning is crucial. Savvy network engineers must deploy new services with scalability in mind, and ascertain that the network will yield acceptable performance under heavy and peak loads, with no packet loss. V olP requires almost no packet loss. In literature, 0.1–5% packet loss was generally asserted. However, in [24] the required V olP packet loss was conservatively suggested to be less than 105 . A more practical packet loss, based on experimentation, of below 1% was required in [22]. Hence, it is extremely important not to utilize fully the network resources. As rule-of-thumb guideline for switched fast full-duplex Ethernet, the average utilization limit of links should be 190%, and for switched shared fast Ethernet, the average limit of links should be 85% [25]. The projected growth in users, network services, business, etc. must be all taken into consideration to extrapolate the required growth capacity or the future growth factor. In our study, we will ascertain that 25% of the available network capacity is reserved for future growth and expansion. For simplicity, we will apply this evenly to all network resources of the router, switches, and switched-Ethernet links. However, keep in mind this percentage in practice can be variable for each network resource and may depend on the current utilization and the required growth capacity. In our methodology, the reservation of this utilization of network resources is done upfront, before deploying the new service, and only the left-over capacity is used for investigating the network support of the new service to be deployed.3.4. Perform network measurementsIn order to characterize the existing network traffic load, utilization, and flow, network measurements have to be performed. This is a crucial step as it can potentially affect results to be used in analytical study and simulation. There are a number of tools available commercially and noncommercially to perform network measurements. Popular open-source measurement tools include MRTG, STG, SNMPUtil, and GetIF [26]. A few examples of popular commercially measurement tools include HP OpenView, Cisco Netflow, Lucent VitalSuite, Patrol DashBoard, Omegon NetAlly, Avaya ExamiNet, NetIQ Vivinet Assessor, etc. Network measurements must be performed for network elements such as routers, switches, and links. Numerous types of measurements and statistics can be obtained using measurement tools. As a minimum, traffic rates in bits per second (bps) and packets per second (pps) must be measured for links directly connected to routers and switches. To get adequate assessment, network measurements have to be taken over a long period of time, at least 24-h period. Sometimes it is desirable to take measurements over several days or a week. One has to consider the worst-case scenario for network load or utilization in order to ensure good QoS at all times including peak hours. The peak hour is different from one network to another and it depends totally on the nature of business and the services provided by the network.The market of industrial V olP is seeing a slow but steady evolution towards the integration of industrial automation terminals with software and hardware architectures typical of office and Web-based applications, to achieve greater usability and flexibility of the interface and easier interoperability between industrial automation solutions and enterprise information systems.This goal requires unbundling the functions and modules of a traditional V olP solution, deploying them over a modular and distributed system, which exploits the open standards of the Internet and the architectural patterns of multi-tier Web Applications. The MyV olP project aims at designing, implementing and evaluating a distributed V olP platform which can be seamlessly accessed both locally and remotely and can be easily integrated in the enterprise ICT infrastructure. The major functional and non-functional requirements at the base of the MyV olP design are summarized in Table 1 and Table 2, respectively.Table 2 shows a summary of peak-hour utilization for traffic of links in both directions connected to the router and the two switches of the network topology of Fig. 1. These measured results will be used in our analysis and simulation study.4 The VolP architectureIn this section we overview the main characteristics of the design of the V olP framework. The overall architecture of the V olP platform is illustrated in Figure 1: the V olP functionality, usually embedded within the terminal attached to the controlled system, becomes partitioned into a client-server architecture, implemented on top of a hybrid communication network, comprising an Ethernet backbone that connects the V olP devices and a set of field bus protocols for connecting to the controlled plant.4.1. General design choicesThe design of the system had to address several issues, according to the requirements. In this section we give a summary of the adopted solutions.4.1.1. Distribution model of presentation andbusiness logic.The architecture design has been addressed by applying the state of the art solutions for granting separation of concerns and modular implementation. We adopted a Rich web interface paradigm consisting of extending the client side of traditional Web architectures, thus moving some of the computation from the server to the client.The business layer is still located at server side and contains the control policies, while the presentation layer is implemented at the client-side. It is responsible of building the interface for the human supervisor and of managing the user interaction.4.1.2. Personalization solutions.One of the most challenging requirements advocated for strong personalization capabilities of the platform. We use personalization based on groups that assumes users can be classified in roles, factoring out most of the personalization rules at the group level. The remaining detailed personalization rules can be applied on the single user, but we may assumethat their number and complexity are limited. This solution implements a good trade-off between the needs of fine-grained personalization and of reducing the complexity of the computation.4.1.3. Connectivity.The communication between client and server was implemented by means of HTTP with (emulated) callback through the HTTP request-response cycle. The client submits requests upon user interaction and upon timeouts generated by its internal clock. Requests submitted to the server are left pending until an actual update on the status of the controlled system happens. In this case, the server sends a response to the client, thus simulating an event-based message exchange.4.1.4. Personalization enactment.Some specific decisions must be taken about how and where to apply the personalization and adaptation rules on the Interfaces.Personalization and adaptivity rules could be stored and managed with two approaches:1.Rules encoded as XML files: personalization rules are generated by the offline configuration tool in XML format. Such rules are parsed and interpreted at runtime by a general purpose code, that generates the expected interface. A variant of the approach could devise several specific components for parsing the personalization and adaptivity rules addressing different issues (e.g., user interface, alarm configuration, and so on);2.Rules embedded in the code: this solution consists in generating and compiling a source code at configuration time that include specific personalization and adaptation rules targeted to the developed project. The result is a binary code that embeds all the rules and can be executed extremely fast, because no access to files or rule repositories is needed; We adopt both client and server side rule calculations: a hybrid approach in which part of the rules are applied at server side and the remaining ones at client side. We apply at client side the rules that affects the user interface and, in general, the client-side issues. For this part, the rules have been stored as binary code in the client application, for performance reasons. Vice versa, we adopted server-side application of the rules concerning the server configuration. In this case, the rules have been encoded as XML files and parsed by the server components.。

PF_RING User GuideLinux High Speed Packet CaptureVersion 1.1January 2008© 2004-08 1. IntroductionPF_RING is a high speed packet capture library that turns a commodity PC into an efficient and cheap network measurement box suitable for both packet and active traffic analysis and manipulation. Moreover, PF_RING opens totally new markets as it enables the creation of efficient application such as traffic balancers or packet filters in a matter of lines of codes.This manual is divided in two parts:•PF_RING installation and configuration.•PF_RING SDK.1.1 What’s New with PF_RING?•Release 1.0 (January 2008)•Initial PF_RING users guide.•Release 1.1 (January 2008)•Described PF_RING plugins architecture.2. PF_RING InstallationPF_RING’s architecture is depicted in the figure below.PF_RING User-Space LibraryPF_RING MonitoringApplication Monitoring Application Monitoring Application Ethernet Device DriverPF_RINGLegacyU s e r l a n d K e r n e l PF_RINGThe main building blocks are:•The accelerated kernel driver that provides low-level packet copying into the kernel PF_RINGs.•The user space PF_RING SDK that provides transparent PF_RING-support to user-space applications.When you download PF_RING you fetch the following components:•An automatic patch mechanism allows you to automatically patch a vanilla kernel with PF_RING.•The PF_RING user-space SDK.•An enhanced version of the libpcap library that transparently takes advantage of PF_RING if installed, or fallback to the standard behavior if not installed.PF_RING is downloaded by means of SVN as explained in /PF_RING.html2.1 Linux Kernel InstallationThe PF_RING source code layout is the following:8 README 0 kernel/ 32 mkpatch.sh 0 userland/The Linux kernel patch is performed automatically by mkpatch.sh tool. This tool downloads from the Internet the linux kernel source and patches it. The patched kernel will be placed on a new directory named workspace that will sit at the same level of the other PF_RING files.Users can decide what Linux kernel version to download by modifying the following mkpatch.sh variables:VERSION=${VERSION:-2}PATCHLEVEL=${PATCHLEVEL:-6}SUBLEVEL=${SUBLEVEL:-18.4}In the above configuration the kernel 2.6.18.4 will be downloaded.After the kernel has been downloaded and patched, users need to compile and install the kernel as usual. Once the kernel is installed you need to modify your boot loader (usually lilo or grub) in order to let your system access the new kernel. Done this, you need to reboot the box and make sure you select the kernel you just installed as default kernel.Note that:•the kernel installation requires super user (root) capabilities.•For some Linux distributions a kernel installation/compilation package is provided.2.2 PF_RING Device ConfigurationWhen PF_RING is activated, a new entry /proc/net/pf_ring is created.nbox-factory:/home/deri# ls /proc/net/pf_ring/info plugins_infonbox-factory:/home/deri# cd /proc/net/pf_ring/nbox-factory:/proc/net/pf_ring# cat infoVersion : 3.7.5Bucket length : 2000 bytesRing slots : 4096Slot version : 9Capture TX : Yes [RX+TX]IP Defragment : NoTransparent mode : YesTotal rings : 0Total plugins : 2nbox-factory:/proc/net/pf_ring# cat plugins_infoID Plugin2 sip [SIP protocol analyzer]12 rtp [RTP protocol analyzer]PF_RING allows users to install plugins for handling custom traffic. Those plugins are also registered in the pf_ring /proc tree and can be listed by typing the plugins_info file.2.3 Libpfring and Libpcap InstallationBoth libpfring and libpcap are distributed in source format. They can be compiled as follows:•cd userland/libpfring•make•sudo make install•cd ../libpcap-0.9.7-ring/•./configure•makeNote that the libpfring is reentrant hence it’s necessary to link you PF_RING-enabled applications also against the -lpthread library.IMPORTANTLegacy pcap-based applications need to be recompiled against the new libpcap andlinked with a PF_RING enabled libpcap.a in order to take advantage of PF_RING. Donot expect to use PF_RING without recompiling your existing application.3. PF_RING for Application DevelopersConceptually PF_RING is a simple yet powerful technology that enables developers to create high-speed traffic monitor and manipulation applications in a small amount of time. This is because PF_RING shields the developer from inner kernel details that are handled by a library and kernel driver. This way developers can dramatically save development time focusing on they application they are developing without paying attention to the way packets are sent and received.This chapter covers:•The PF_RING API.•Extensions to the libpcap library for supporting legacy applications.•How to patch the Linux kernel for enabling PF_RING3.1 The PF_RING APIThe PF_RING internal data structures should be hidden to the user who can manipulate packets and devices only by means of the available API defined in the include file pfring.h that comes with PF_RING.3.1.1 Return CodesBy convention, the library returns negative values for errors and exceptions. Non-negative codes indicate success.3.1.2 PF_RING: Device Initializationpfring* pfring_open(char *device_name, u_int8_t promisc, u_int8_t reentrant);This call is used to initialize an PF_RING device hence obtain a handle of type struct pfring that can be used in subsequent calls. Note that:• You can use both physical (e.g. eth0) and virtual (e.g. tap devices)• You need super-user capabilities in order to open a device.Input parameters:device_nameSymbolic name of the PF_RING-aware device we’re attempting to open (e.g. eth0).promiscIf set to a value different than zero, the device is open in promiscuous mode.reentrantIf set to a value different than zero, the device is open in reentrant mode. This isimplemented by means of semaphores and it results is slightly worse performance.Use reentrant mode only for multithreaded applications.Return value:On success a handle is returned, NULL otherwise.3.1.3 PF_RING: Device Terminationvoid pfring_close(pfring *ring);This call is used to terminate an PF_RING device previously open. Note that you must always close a device before leaving an application. If unsure, you can close a device from a signal handler.Input parameters:ringThe PF_RING handle that we are attempting to close.3.1.4 PF_RING: Read an Incoming Packetint pfring_recv(pfring *ring, char* buffer, u_int buffer_len, struct pfring_pkthdr *hdr,u_char wait_for_incoming_packet);This call returns an incoming packet when available.Input parameters:ringThe PF_RING handle where we perform the check.bufferA memory area allocated by the caller where the incoming packet will be stored.buffer_lenThe length of the memory area above. Note that the incoming packet is cut if the incoming packet is too long for the allocated area.hdrA memory area where the packet header will be copied.wait_for_incoming_packetIf 0 we simply check the packet availability, otherwise the call is blocked until a packet isavailable.Return value:The actual size of the incoming packet, from ethernet onwards.3.1.5 PF_RING: Ring Clustersint pfring_set_cluster(pfring *ring, u_int clusterId);This call allows a ring to be added to a cluster that can spawn across address spaces. On a nuthsell when two or more sockets are clustered they share incoming packets that are balanced on a per-flow manner. This technique is useful for exploiting multicore systems of for sharing packets in the same address space across multiple threads.Input parameters:ringThe PF_RING handle to be cluster.clusterIdA numeric identifier of the cluster to which the ring will be bound.Return value:Zero if success, a negative value otherwise.int pfring_remove_from_cluster(pfring *ring);This call allows a ring to be removed from a previous joined cluster.Input parameters:ringThe PF_RING handle to be cluster.clusterIdA numeric identifier of the cluster to which the ring will be bound.Return value:Zero if success, a negative value otherwise.3.1.6 PF_RING: Packet Reflectionint pfring_set_reflector(pfring *ring, char *reflectorDevice);This call allows packets received from a ring not to be forwarded to user-space (as usual) but to be sent unmodified on a reflector device. This technique allows users to implement simple applications that set one or more filters and forward all packets matching the filter. All this is done in kernel space for maximum speed: the application just needs to instrument the ring without the need to fetch-and-forward packets.Input parameters:ringThe PF_RING handle to be used as reflector.reflectorDeviceThe reflector device (e.g. eth0). Note that it’s not possible to use the same device for bothreceiving and forwarding packet.Return value:Zero if success, a negative value otherwise.int pfring_set_sampling_rate(pfring *ring, u_int32_t rate /* 1 = no sampling */);Implement packet sampling directly into the kernel. Note that this solution is much more efficient than implementing it in user-space. Sampled packets are only those that pass all filters (if any)Input parameters:ringThe PF_RING handle on which sampling is applied.rateThe sampling rate. Rate of X means that 1 packet out of X is forwarded. This means that asampling rate of 1 disables samplingReturn value:Zero if success, a negative value otherwise.PF_RING allows to filter packets in two ways: precise (a.k.a. hash filtering) or wildcard filtering. Precise filtering is used when it is necessary to track a precise 6-tuple connection <vlan Id, protocol, source IP, source port, destination IP, destination port>. Wildcard filtering is used instead whenever a filter can have wildcards on some of its fields (e.g. match all UDP packets regardless of their destination).3.1.8.1 PF_RING: Wildcard Filteringint pfring_add_filtering_rule(pfring *ring, filtering_rule* rule_to_add);Add a filtering rule to an existing ring. Each rule will have a unique rule Id across the ring (i.e. two rings can have rules with the same id).Input parameters:ringThe PF_RING handle on which the rule will be added.rule_to_addThe rule to add.Return value:Zero if success, a negative value otherwise.int pfring_remove_filtering_rule(pfring *ring, u_int16_t rule_id);Remove a previously added filtering rule.Input parameters:ringThe PF_RING handle on which the rule will be added.rule_idThe id of a previously added rule that will be removed.Return value:Zero if success, a negative value otherwise (e.g. the rule does not exist).int pfring_get_filtering_rule_stats(pfring *ring, u_int16_t rule_id, char* stats, u_int *stats_len);Read statistics of a hash filtering rule.Input parameters:ringThe PF_RING handle from which stats will be read.rule_idThe rule id that identifies the rule for which stats are read.statsA buffer allocated by the user that will contain the rule statistics. Please make sure that thebuffer is large enough to contain the statistics.stats_lenThe size (in bytes) of the stats buffer.Return value:Zero if success, a negative value otherwise (e.g. the rule does not exist).int pfring_handle_hash_filtering_rule(pfring *ring,hash_filtering_rule* rule_to_add,u_char add_rule);Add or remove a hash filtering rule.Input parameters:ringThe PF_RING handle from which stats will be read.rule_to_addThe rule that will be added/removed.add_ruleIf set to a positive value the rule is added, if zero the rule is removedReturn value:Zero if success, a negative value otherwise (e.g. the rule to be removed does not exist).int pfring_get_hash_filtering_rule_stats(pfring *ring,hash_filtering_rule* rule,char* stats, u_int *stats_len);Read statistics of a hash filtering rule.Input parameters:ringThe PF_RING handle on which the rule will be added/removed.ruleThe rule for which stats are read. This needs to be the same rule that has been previously added.statsA buffer allocated by the user that will contain the rule statistics. Please make sure that thebuffer is large enough to contain the statistics.stats_lenThe size (in bytes) of the stats buffer.Return value:Zero if success, a negative value otherwise (e.g. the rule to be removed does not exist).int pfring_toggle_filtering_policy(pfring *ring, u_int8_t rules_default_accept_policy);Set the default filtering policy. This means that if no rule is matching the incoming packet the default policy will decide if the packet is forwarded to user space of dropped. Note that filtering rules are limited to a ring, so each ring can have a different set of rules and default policy.Input parameters:ringThe PF_RING handle on which the rule will be added/removed.rules_default_accept_policyIf set to a positive value the default policy is accept (i.e. forward packets to user space), dropotherwiseReturn value:Zero if success, a negative value otherwise.3.1.9 PF_RING: Miscellaneous Functionsint pfring_enable_ring(pfring *ring);A ring is not enabled (i.e. incoming packets are dropped) until the user space application calls pfring_recv() or the above function. This function should usually not be called unless the user space application sets drop-filters and periodically reads statistics from the ring.Input parameters:ringThe PF_RING handle to enable.Return value:Zero if success, a negative value otherwise.int pfring_stats(pfring *ring, pfring_stat *stats);Read ring statistics (packets received and dropped).Input parameters:ringThe PF_RING handle to enable.statsA user-allocated buffer on which stats will be stored.Return value:Zero if success, a negative value otherwise.int pfring_version(pfring *ring, u_int32_t *version);Read the ring version. Note that is the ring version is 3.7 the retuned ring version is 0x030700.Input parameters:ringThe PF_RING handle to enable.versionA user-allocated buffer on which ring version will be copied.Return value:Zero if success, a negative value otherwise.3.2 The C++ PF_RING interfaceThe C++ interface (see. PF_RING/userland/libpfring/c++/) is equivalent to the C interface. No major changes have been made and all the methods have the same name as C. For instance:• C: int pfring_stats(pfring *ring, pfring_stat *stats);• C++: inline int get_stats(pfring_stat *stats);4. Writing PF_RING PluginsSince version 3.7, developers can write plugins in order to delegate to PF_RING activities like:• Packet payload parsing• Packet content filtering• In-kernel traffic statistics computation.In order to clarify the concept, imagine that you need to develop an application for VoIP traffic monitoring. In this case it’s necessary to:•parse signaling packets (e.g. SIP or IAX) so that those that only packets belonging to interesting peers are forwarded.•compute voice statistics into PF_RING and report to user space only the statistics, not the packets.In this case a developer can code two plugins so that PF_RING can be used as an advanced traffic filter and a way to speed-up packet processing by avoiding packets to cross the kernel boundaries when not needed.The rest of the chapter explains how to implement a plugin and how to call it from user space.4.1 Implementing a PF_RING PluginInside the directory kernel/net/ring/plugins/ there is a simple plugin called dummy_plugin that shows how to implement a simple plugin. Let’s explore the code.Each plugin is implemented as a Linux kernel module. Each module must have two entry points, module_init and module_exit, that are called when the module is insert and removed. The module_init function, in the dummy_plugin example it’s implement by the function dummy_plugin_init(), is responsible for registering the plugin by calling the do_register_pfring_plugin() function. The parameter passed to the registration function is a data structure of type ‘struct pfring_plugin_registration’ that contains:•a unique integer pluginId.•pfring_plugin_handle_skb: a pointer to a function called whenever an incoming packet is received.•pfring_plugin_filter_skb: a pointer to a function called whenever a packet needs to be filtered. This function is called after pfring_plugin_handle_skb().•pfring_plugin_get_stats: a pointer to a function called whenever a user wants to read statistics from a filtering rule that has set this plugin as action.A developer can choose not to implement all the above functions, but in this case the plugin will be limited in functionality (e.g. if pfring_plugin_filter_skb is set to NULL filtering is not supported).static int plugin_handle_skb(filtering_rule_element *rule,filtering_hash_bucket *hash_rule,struct pcap_pkthdr *hdr,struct sk_buff *skb,u_int16_t filter_plugin_id,struct parse_buffer *filter_rule_memory_storage);This function is called whenever an incoming packet (RX or TX) is received. This function typically updates rule statistics. Note that if the developer has set this plugin as filter plugin, then the packet has:•already been parsed•passed a rule payload filter (if set).Input parameters:ruleA pointer to a wildcard rule (if this plugin has been set on a wildcard rule) or NULL (if this pluginhas been set to a hash rule).hash_ruleA pointer to a hash rule (if this plugin has been set on a hash rule) or NULL (if this plugin hasbeen set to a wildcard rule). Note if rule is NULL, hash_rule is not, and vice-versa.hdrA pointer to a pcap packet header for the received packet. Please note that:•the packet is already parsed•the header is an extended pcap header containing parsed packet header metadata.skbA sk_buff datastructure used in Linux to carry packets inside the kernel.filter_plugin_idThe id of the plugin that has parsed packet payload (not header that is already stored into hdr).if the filter_plugin_id is the same as the id of the dummy_plugin then this packet has already been parsed by this plugin and the parameter filter_rule_memory_storage points to the payload parsed memory.filter_rule_memory_storagePointer to a data structure containing parsed packet payload information that has been parsed by the plugin identified by the parameter filter_plugin_id. Note that:•only one plugin can parse a packet.•the parsed memory is allocated dynamically (i.e. via kmalloc) by plugin_filter_skb and freedby the PF_RING core.Return value:Zero if success, a negative value otherwise.int plugin_filter_skb(filtering_rule_element *rule,struct pcap_pkthdr *hdr,struct sk_buff *skb,struct parse_buffer **parse_memory)This function is called whenever a previously parsed packet (via plugin_handle_skb) incoming packet (RX or TX) needs to be filtered. In this case the packet is parsed, parsed information is returned and the return value indicates whether the packet has passed the filter.Input parameters:ruleA pointer to a wildcard rule that contains a payload filter to apply to the packet.hdrA pointer to a pcap packet header for the received packet. Please note that:•the packet is already parsed•the header is an extended pcap header containing parsed packet header metadata.skbA sk_buff data structure used in Linux to carry packets inside the kernel.Output parameters:parse_memoryA pointer to a memory area allocated by the function, that will contain information about theparsed packet payload.Return value:Zero if the packet has not matched the rule filter, a positive value otherwise.4.1.3 PF_RING Plugin: Read Packet Statisticsint plugin_plugin_get_stats(filtering_rule_element *rule,filtering_hash_bucket *hash_bucket,u_char* stats_buffer,u_int stats_buffer_len)This function is called whenever a user space application wants to read statics about a filtering rule.Input parameters:ruleA pointer to a wildcard rule (if this plugin has been set on a wildcard rule) or NULL (if this pluginhas been set to a hash rule).hash_ruleA pointer to a hash rule (if this plugin has been set on a hash rule) or NULL (if this plugin hasbeen set to a wildcard rule). Note if rule is NULL, hash_rule is not, and vice-versa.stats_bufferA pointer to a buffer where statistics will be copied..stats_buffer_lenLength in bytes of the stats_buffer.Return value:The length of the rule stats, or zero in case of error.4.2 Using a PF_RING PluginA PF_RING based application, can take advantage of plugins when filtering rules are set. The filtering_rule data structure is used to both set a rule and specify a plugin associated to it.filtering_rule rule;rule.rule_id = X;....rule.plugin_action.plugin_id = MY_PLUGIN_ID;When the plugin_action.plugin_id is set, whenever a packet matches the header portion of the rule, then the MY_PLUGIN_ID plugin (if registered) is called and the plugin_filter_skb () and plugin_handle_skb() are called.If the developer is willing to filter a packet before plugin_handle_skb() is called, then extra filtering_rule fields need to be set. For instance suppose to implement a SIP filter plugin and to instrument it so that only the packets with INVITE are returned. The following lines of code show how to do this.struct sip_filter *filter = (struct sip_filter*)rule.extended_fields.filter_plugin_data;rule.extended_fields.filter_plugin_id = SIP_PLUGIN_ID;filter->method = method_invite;filter->caller[0] = '\0'; /* Any caller */filter->called[0] = '\0'; /* Any called */filter->call_id[0] = '\0'; /* Any call-id */As explained before, the pfring_add_filtering_rule() function is used to register filtering rules.。

七、任现职后主要专业技术工作业绩登记任现职期间教学方面主要工作业绩:任现职期间平均每年指导本科毕业论文3篇以上,其中论文《基于S7-200系列海水养殖自动控制系统》获得2010年校级优秀学士论文;任现职期间科研方面的主要工作业绩:(1)主持纵向课题累计经费1230万元,其中省部级课题2项,厅局级课题1项;(2)主持横向课题累计经费122.7万元;(3)参与横向课题累计经费39.75万元;(4)作为第一发明人获授权实用新型专利8项:ZL200820026210.8、ZL201020657692.4、ZL201020657697.7、ZL201621064576.5、ZL201620834804.6、ZL201620834816.9、ZL201621064540.7、ZL201120234588.9;(5)作为第一发明人获发明专利受理2项:CN106230858A、CN104729739A;(6)作为第一发明人获软件著作权登记1项:2016SR338514;(7)主持烟台市科技成果鉴定1项:烟科成鉴字[2013]第18号;(8)发表EI收录论文3篇,国内核心期刊论文1篇:图像的多尺度稀疏分解及其在遥感图像融合上的应用,烟台大学学报(自然科学与工程版)第30卷第一期;八、各部门意见学校教务部门审核意见:负责人(签章):(公章)年月日学校科研部门审核意见:负责人(签章):(公章)年月日学校人事部门审核意见:负责人(签章):(公章)年月日评价委员会意见:(公章)主任(签章):年月日学校意见:(公章)年月日单位(章):现职称:实验师申报职称:高级实验师方式:正常推荐单位意见申报人承诺是否人事代理人员本单位已审核申报人基本条件和材料,符合《烟台大学职称评审条件》规定的申报条件,经评议,其推荐位次为2/2 。
负责人签名:本人所提供的个人信息和证明材料真实准确,对因提供有关信息、证件不实或违反有关规定造成的后果负责。
Lab Exercise – IPv4ObjectiveTo learn about the details of IP (Internet Protocol). IP is the network layer protocol used throughout the Internet. We will examine IP version 4, since it is ubiquitously deployed, while the IP version 6 is partly deployed.The trace is here: /~kevin/com320/labs/wireshark/trace-ipv4.pcapThe text file is here: /~kevin/com320/labs/wireshark/trace-ipv4.txt RequirementsWireshark: This lab uses the Wireshark software tool to capture and examine a packet trace. A packet trace is a record of traffic at a location on the network, as if a snapshot was taken of all the bits that passed across a particular wire. The packet trace records a timestamp for each packet, along with the bits that make up the packet, from the lower-layer headers to the higher-layer contents. Wireshark runs on most operating systems, including Windows, Mac and Linux. It provides a graphical UI that shows the sequence of packets and the meaning of the bits when interpreted as protocol headers and data. It col-or-codes packets by their type, and has various ways to filter and analyze packets to let you investigate the behavior of network protocols. Wireshark is widely used to troubleshoot networks. You can down-load it from if it is not already installed on your computer. We highly recommend that you watch the short, 5 minute video “Introduction to Wireshark” that is on the site.wget / curl: This lab uses wget (Linux and Windows) and curl (Mac) to fetch web resources. wget and curl are command-line programs that let you fetch a URL. Unlike a web browser, which fetches and executes entire pages, wget and curl give you control over exactly which URLs you fetch and when you fetch them. Under Linux, wget can be installed via your package manager. Under Windows, wget is available as a binary; look for download information on /software/wget/. Under Mac, curl comes installed with the OS. Both ha ve many options (try “wget --help” or “curl --help” to see) but a URL can be fetched simply with “wget URL” or “curl URL”. traceroute / tracert: This lab uses “traceroute” to find the router level path from your computer to a remote Internet host. traceroute is a standard command-line utility for discovering the Internet paths that your computer uses. It is widely used for network troubleshooting. It comes pre-installed on Win-dow and Mac, and can be installed using your package manager on Linux. On Windows, it is called “tracert”. It has various options, but simply issuing the command “traceroute .au” will cause your computer to find and print the path to the remote computer (here .au).Step 1: Capture a TraceProceed as follows to capture a trace assuming that your computer has IPv4 connectivity; alternatively, you may use a supplied trace. The trace we want to gather is a simple web fetch from a remote server, which will cause your computer to send and receive IP packets, followed by a traceroute to the re-mote server to find the path it uses over the Internet.1.Pick a URL at a remote server, e.g., .au/ and check that you can fetch thecontents with wget or curl, e.g., “wget .au/” or “curl.au/”. This will fetch the resource and either write it to a file (wget) or to the screen (curl). With wget, you want a single response with status code “200 OK”. Ifthe fetch does not work then try a different URL; keep in mind that you may be referring to aURL by a shortcut for which browsers must do work to find the intended content, e.g., may really be /index.html. If no URLs seem to work then de-bug your use of wget/curl or your Internet connectivity.2.Perform a traceroute to the same remote server to check that you can discover informationabout the network path.On Windows, type, e.g., “tracert .au”. On Linux / Mac, type, e.g., “traceroute .au”. If you are on Linux / Mac and behind aNAT (as most home users or virtual machine users) then use the –I option (that was a capital i)to traceroute, e.g., “traceroute –I .au”. This will cause traceroute to send ICMP probes like tracert instead of its usual UDP probes; ICMP probes are better ableto pass through NAT boxes. A successful example is shown below; save the output as you willneed it for later steps. Note that traceroute may take up to a minute to run. Each line shows information about the next IP hop from the computer running traceroute towards the tar-get destination. T he lines with “*”s indicate that there was no response from the network toidentity that segment of the Internet path. Some unidentified segments are to be expected.However, if traceroute is not working correctly then nearly all the path will be “*”s. In thiscase, try a different remote server, experiment with traceroute, or use the supplied traces.Figure 1: Running traceroute (as tracert on Windows)unch Wireshark and start a capture with a filter of “tcp port 80“. Make sure to check“enable network name resolution”. We use this filter to record only standard web traffic. Name resolution will translate the IP addresses of the computers sending and receiving packets into names. It will help you to recognize whether the packets are going to or from your computer.Your capture window should be similar to the one pictured below, other than our highlighting.Select the interface from which to capture as the main wired or wireless interface used by your computer to connect to the Internet. If unsure, guess and revisit this step later if your capture is not successful. Uncheck “capture packets in promiscuous mode”. This mode is useful to over-hear packets sent to/from other computers on broadcast networks. We only want to record packets sent to/from your computer. Leave other options at their default values. The capture filter, if present, is used to prevent the capture of other traffic your computer may send or re-ceive. On Wireshark 1.8, the capture filter box is present directly on the options screen, but on Wireshark 1.9, you set a capture filter by double-clicking on the interface.Figure 2: Setting up the capture options4.After the capture is started, repeat the wget/curl command above. This time, the packets willalso be recorded by Wireshark.5.After the command is complete, return to Wireshark and stop the trace. You should now have ashort trace similar to that shown in the figure below, along with the output of a traceroute you ran earlier to the corresponding server.Figure 3: Trace of wget/curl traffic showing the details of the IP headerStep 2: Inspect the TraceSelect any packet in the trace and expand the IP header fields (using the “+” expander or icon) to see the details. You can simply click on a packet to select it (in the top panel). You will see details of its structure (in the middle panel) and the bytes that make up the packet (in the bottom panel). Our interest is the IP header, and you may ignore the other higher and lower layer protocols. When you click on parts of the IP header, you will see the bytes that correspond to the part highlighted in the bottom panel. We have expanded the IP header and clicked on all the IP header fields in the figure above.Let us go over the fields in turn:•The version field is set to 4. This is “IPv4” after all.•Then there is the header length field. Observe by looking at the bytes selected in the packet da-ta that version and header length are both packed into a single byte.•The Differentiated Services field contains bit flags to indicate whether the packet should be handled with quality of service and congestion indications at routers.•Then there is the Total Length field.•Next is the Identification field, which is used for grouping fragments, when a large IP packet is sent as multiple smaller pieces called fragments. It is followed by the Flags and the Fragmentoffset fields, which also relate to fragmentation. Observe they share bytes.•Then there is the Time to live or TTL field, followed by the Protocol field.•Next comes the header checksum. Is your header checksum carrying 0 and flagged as incorrect for IP packets sent from your computer to the remote server? On some computers, the operat-ing system software leaves the header checksum blank (zero) for the NIC to compute and fill in as the packet is sent. This is called protocol offloading. It happens after Wireshark sees thepacket, which causes Wireshark to believe that the checksum is wrong and flag it with a differ-ent color to signal a problem. A similar issue may happen for the TCP checksum. You can remove these false errors if they are occurring by telling Wireshark not to validate the checksums. Select “Preferences” from the Wireshark menus and expand the “Protocols” area. Look under the list until you come to IP v4. Uncheck “Validate checksum if possible”. Similarly, you may uncheckchecksum validation for TCP if applicable to your case.•The last fields in the header are the normally the source and destination address. It is possible for there to be IP options, but these are unlikely in standard web traffic.•The IP header is followed by the IP payload. This makes up the rest of the packet, starting with the next higher layer header, TCP in our case, but not including any link layer trailer (e.g., Ether-net padding).Step 3: IP Packet StructureTo show your understanding of IP, sketch a figure of an IP packet you studied. It should show the position and size in bytes of the IP header fields as you can observe using Wireshark.Since you cannot easily de-termine sub-byte sizes, group any IP fields that are packed into the same bytes. Your figure can simply show the frame as a long, thin rectangle. Try not to look at the figure of an IPv4 packet in your text; check it afterwards to note and investigate any differences.To work out sizes, observe that when you click on a protocol block in the middle panel (the block itself, not the “+” expander) Wireshark will highlight the corresponding bytes in the packet in the lower panel, and display the length at the bottom of the window. You may also use the overall packet size shown in the Length column or Frame detail block. Note that this method will not tell you sub-byte positions.By looking at the IP packets in your trace, answer these questions:1.What are the IP addresses of your computer and the remote server?2.Does the Total Length field include the IP header plus IP payload, or just the IP payload?3.How does the value of the Identification field change or stay the same for different packets? Forinstance, does it hold the same value for all packets in a TCP connection or does it differ for each packet? Is it the same in both directions? Can you see any pattern if the value does change?4.What is the initial value of the TTL field for packets sent from your computer? Is it the maximumpossible value, or some lower value?5.How can you tell from looking at a packet that it has not been fragmented? Most often IP pack-ets in normal operation are not fragmented. But the receiver must have a way to be sure. Hint: you may need to read your text to confirm a guess.6.What is the length of the IP Header and how is this encoded in the header length field? Hint: no-tice that only 4 bits are used for this field, as the version takes up the other 4 bits of the byte.You may guess and check your text.Step 4: Internet PathsThe source and destination IP addresses in an IP packet denote the endpoints of an Internet path, not the IP routers on the network path the packet travels from the source to the destination. traceroute is a utility for discovering this path. It works by eliciting responses (ICMP TTL Exceeded messages) from the router 1 hop away from the source towards the destination, then 2 hops away from the source, then 3 hops, and so forth until the destination is reached. The responses will identify the IP address of the router. The output from traceroute normally prints the information for one hop per line, including the measured round trip times and IP address and DNS names of the router. The DNS name is handy for working out the organization to which the router belongs. Since traceroute takes advantage of common router implementations, there is no guarantee that it will work for all routers along the path, and it is usual to see “*” re sponses when it fails for some portions of the path.Using the traceroute output, sketch a drawing of the network path. If you are using the supplied trace, note that we have provided the corresponding traceroute output as a separate file.Show your computer (lefthand side) and the remote server (righthand side), both with IP addresses, as well as the routers along the path between them numbered by their distance on hops from the start of the path. You can find the IP address of your computer and the remote server on the packets in the trace that you captured. The output of traceroute will tell you the hop number for each router.To finish your drawing, label the routers along the path with the name of the real-world organization to which they belong. To do this, you will need to interpret the domain names of the routers given by traceroute. If you are unsure, label the routers with the domain name of what you take to be the or-ganization. Ignore or leave blank any routers for which there is no domain name (or no IP address).This is not an exact science, so we will give some examples. Suppose that traceroute identifies a router along the path by the domain name . Normally, we can ig-nore at least the first part of the name, since it identifies different computers in the same organization and not different organizations. Thus we can ignore at least “arouter” in the domain name. For ge-neric top-level domains, like “.com” and “.edu”, the last two domains give the domain name of the or-ganization. So for our example, it is “”. To translate this domain name into the real-world name of an organization, we might search for it on the web. You will quickly find that is the University of Washington. This means tha t “cac” portion is an internal structure in the University of Washington, and not important for the organization name. You would write “University of Washington” on your figure for any routers with domain names of the form *. Alternatively, consider a router with a domain name like .au. Again, we ignore at least the “arouter” part as indicating a computer within a specific organization. For country-code top-level domains like “.au” (for Australia) the last three domain s in the name will normally give the organization. In this case the organization’s domain name is .au. Using a web search, we find this domain represents AARNET, Australia’s research and education network. The “syd” por-tion is internal structure, and a good guess is that it means the router is located in the Sydney part of AARNET. So for all routers with domain names of the form *.au, you would write“AARNET” on your figure. While there are no guarantees, you should be able to reason similarly and at least give the domain name of the organizations near the ends of the path.Step 5: IP Header ChecksumWe will now look at the IP header checksum calculation by validating a packet. The checksum algorithm adds the header bytes 16 bits at a time. It is computed so that re-computing the sum across the entire IP header (including the checksum value) will produce the result of zero. A complicating factor for us is that this is done using 1s complement arithmetic, rather than 2s complement arithmetic that is normally used for computing. The steps below explain how to perform the necessary computation.From the trace, pick a packet sent from the remote server to your computer and check that you have a non-zero value in the checksum field. The checksum value sent over the network will be non-zero, so if you have a zero value it is because of the capture setup. Try a packet that has an IP header of 20 bytes, the minimum header size when there are no options, to make this exercise easier.Follow these steps to check that the checksum value is correct:1.Divide the header into 10 two byte (16 bit) words. Each word will be 4 hexadecimal digits shownin the packet data panel in the bottom of the Wireshark window, e.g., 05 8c2.Add these 10 words using regular addition. You may add them with a hexadecimal calculator(Google to find one), or convert them to decimal, add them, and convert them back to hexadec-imal. Do whatever is easiest.3.To compute the 1s complement sum from your addition so far, take any leading digits (beyondthe 4 digits of the word size) and add them back to the remainder. For example: 5a432 will be-come a432 + 5= a437.4.The end result should be 0xffff. This is actually zero in 1s complement form, or more precise-ly 0xffff is -0 (negative zero) while 0x0000 is +0 (positive zero).If you cannot get your sum to come out and are sure that the checksum must be wrong, you can get Wireshark to check it. See whether it says “[correct]” already. If it does not then use the menus to go to Preferenc es, expand Protocols, choose IPv4 from the list, and check “validate header checksum”. Now Wireshark will check the checksum and tell you if it is correct.Extra - Explore on your ownWe encourage you to explore IP on your own once you have completed this lab. Some ideas: •Read about and experiment with IPv6. Modern operating systems already include support for IPv6, so you may be able to capture IPv6 traffic on your network. You can also “join the IPv6”backbone by tunneling to an IPv6 provider.•Learn about tunnels, which wrap an IP packet within another IP header.•Read about IP geolocation. It is the process of assigning a geographical location to an IP address using measurements or clues from its name administrative databases. Try a geolocation service.•Learn about IPsec or IP security. It provides confidentiality and authentication for IP packets, and is often used as part of VPNs.。
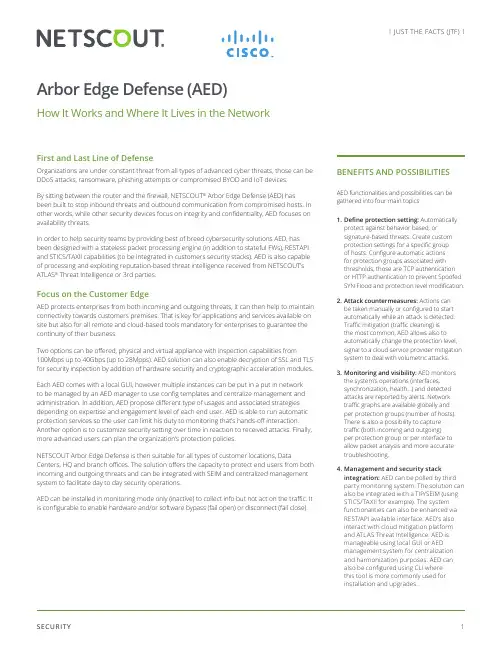
l JUST THE FACTS (JTF) lBENEFITS AND POSSIBILITIESAED functionalities and possibilities can be gathered into four main topics1. Define protection setting: Automatically protect against behavior based, orsignature-based threats. Create custom protection settings for a specific group of hosts. Configure automatic actions for protection groups associated with thresholds, those are TCP authentication or HTTP authentication to prevent Spoofed SYN Flood and protection level modification.2. Attack countermeasures: Actions can be taken manually or configured to start automatically while an attack is detected. Traffic mitigation (traffic cleaning) is the most common, AED allows also to automatically change the protection level, signal to a cloud service provider mitigation system to deal with volumetric attacks.3. Monitoring and visibility: AED monitors the system’s operations (interfaces, synchronization, health…) and detected attacks are reported by alerts. Network traffic graphs are available globally and per protection groups (number of hosts). There is also a possibility to capture traffic (both incoming and outgoing) per protection group or per interface to allow packet analysis and more accurate troubleshooting.4. Management and security stackintegration: AED can be polled by third party monitoring system. The solution can also be integrated with a TIP/SEIM (using STICS/TAXII for example). The system functionalities can also be enhanced via REST/API available interface. AED’s also interact with cloud mitigation platform and ATLAS Threat Intelligence. AED is manageable using local GUI or AED management system for centralization and harmonization purposes. AED can also be configured using CLI where this tool is more commonly used for installation and upgrades.First and Last Line of DefenseOrganizations are under constant threat from all types of advanced cyber threats, those can be DDoS attacks, ransomware, phishing attempts or compromised BYOD and IoT devices.By sitting between the router and the firewall, NETSCOUT ® Arbor Edge Defense (AED) hasbeen built to stop inbound threats and outbound communication from compromised hosts. In other words, while other security devices focus on integrity and confidentiality, AED focuses on availability threats.In order to help security teams by providing best of breed cybersecurity solutions AED, has been designed with a stateless packet processing engine (in addition to stateful FWs), RESTAPI and STICS/TAXII capabilities (to be integrated in customers security stacks). AED is also capable of processing and exploiting reputation-based threat intelligence received from NETSCOUT’s ATLAS ® Threat Intelligence or 3rd parties.Focus on the Customer EdgeAED protects enterprises from both incoming and outgoing threats, it can then help to maintain connectivity towards customers premises. That is key for applications and services available on site but also for all remote and cloud-based tools mandatory for enterprises to guarantee the continuity of their business.Two options can be offered, physical and virtual appliance with inspection capabilities from100Mbps up to 40Gbps (up to 28Mpps). AED solution can also enable decryption of SSL and TLS for security inspection by addition of hardware security and cryptographic acceleration modules.Each AED comes with a local GUI, however multiple instances can be put in a put in network to be managed by an AED manager to use config templates and centralize management and administration. In addition, AED propose different type of usages and associated strategies depending on expertise and engagement level of each end user. AED is able to run automatic protection services so the user can limit his duty to monitoring that’s hands-off interaction. Another option is to customize security setting over time in reaction to received attacks. Finally, more advanced users can plan the organization’s protection policies.NETSCOUT Arbor Edge Defense is then suitable for all types of customer locations, DataCenters, HQ and branch offices. The solution offers the capacity to protect end users from both incoming and outgoing threats and can be integrated with SEIM and centralized management system to facilitate day to day security operations.AED can be installed in monitoring mode only (inactive) to collect info but not act on the traffic. It is configurable to enable hardware and/or software bypass (fail open) or disconnect (fail close).Arbor Edge Defense (AED)How It Works and Where It Lives in the Network...while other security devices focus on integrity andconfidentiality, AED focuses on availability threats.Robust to State ExhaustionUnlike firewalls or load-balancers which keep connection information as long as the session is up, AED perform real-time Layer 3 to Layer 7 packet and event countermeasures without keeping session table entry during session lifetime. In this way, memory and CPU are not affected by state exhaustion attacks and AED can protect customer network and handle this kind of threats.vAEDvAED is the virtual machine version of AED that runs on a hypervisor. vAED contains all of the AED software packages and configurations (including software bypass in case of failure)The following orchestrators are supported: Cloud-Init v0.7.6, Openstack Kilo and Mitaka series, OpenStack Heat, OpenStack Tacker, Ansible, Nokia Cloudband, Cisco NSO/ESC, Cisco NFVIS, Amdocs, Netcracker and other ONAP or ETSI NFV management and orchestration technologies vAED is compatible with VMware vSphere 5.5+ and VM kemel 3.19 QEMU 2.0 hypervisors.vAED requires a minimum of 2 vCPUs; 6GB of memory: 6 GB and 100 GB of storage space. The virtual appliance can deliver up to 1Gbps (or 910 Kpps) inspected traffic per appliance.Arbor Enterprise ManagerAEM is a management tool which allows central management and configuration of up to 50 AED’s. Common configurations and specific ones (protection groups, blacklists/whitelists, outbound threat filter) are propagated to AED’s. AEM also gives the possibility to view aggregated and specific graphs and alerts. It’s also possible to launch protection actions (mitigation, protection level modification …) in response to an attack.ATLAS Intelligence FeedAIF contains information about the latest advanced threats, botnets, and web crawlers that our Active Threat Level Analysis System (ATLAS) has identified. AED can use this information to detect threats (malformed/invalid DNS or SIP requests, HTTP messages and Botnet packets), block attacks, and allow legitimate search engine web crawlers to access your network. Updates can be done automatically or upon request on the GUI.STICS/TAXIIAED can accept the IOCs in STIX 2.0 feeds that are sent from TAXII 2.0 clients in order to identify and block any traffic that matches the STIX IOCs in the TAXII collections.Protection LevelAED proposes Three protection levels and associated setting and behavior (rate-basedthreshold, specific countermeasures like filters). Those levels apply globally or per protection group (set of hosts):• Low (under normal conditions): there is no tolerance for false positives.• Medium (during significant attack): The protection settings are stricter. Clean traffic that is unusual might be blocked.• High (during heavy attack): This level provides the most aggressive protection but it carries risks. Blocking some clean traffic is acceptable as long as most of the hosts are protected.AED protects enterprises from both incoming and outgoing threats, it can then help to maintain connectivity towards customers premises.Protection Groups and Server TypesIn order to protect a set of hosts, user should define a protection group containing the IPs and identify the server type of the machines (ex. Web, DNS, FTP, VPN ….) so predefined protection setting can be applied. Server type determines application-specific data to be collected and displayed by AED for that group. Note that custom server type can be created, and settings customized. AED supports a maximum of 100 protection groups. Protection level (low, med, high) and mode (active/inactive) can be configured per protection group.Traffic Profiling and Rate-Based ProtectionAED can simplify the configuration of certain rate-based protection settings by learning typical network behaviors and suggesting values that are appropriate for your network. AED can then suggest values to block traffic over some thresholds like Bits/packets per Second, DNS Query/ NXDomain Rate Limit, HTTP Request Limit, maximum bps for UDP/ICMP, SIP Source Limit, maximum bps/pps for fragmented packets.Regular Expressions FilteringTo identify malicious traffic, AED offers the possibility to look into the packet or application header and payload, therefore regular expression are tracked in HTTP, DNS header or requests, PCAP filters (filter lists) can also be setup to allow or block traffic (source port, destination, port, IPs, checksum….).TCP Flood Attacks PreventionA SYN flood attack exploits the TCP three-way handshake, which establishes a connection between a client and a server. By forcing all TCP clients to authenticate that they are valid, Spoofed SYN Flood Prevention can protect against highly distributed attacks (AED replies to the client’s initial SYN with an ACK that imitates an existing, half-open TCP connection. If the client sends a reset, then AED authenticates the client, and the client opens a new TCP connection to the protected host).EAD proposes also the possibility to block TCP connections/reset/idle when thresholds are exceeded (number of TCP connections per host, idle timeout).HTTP AuthenticationTo ensure that the client is a legitimate browser, AED can use one the following methods to authenticate the client• EAD answers with an HTTP redirect to force the browser to a request to the redirected URL • HTTP soft reset while EAD asks the client to resend the request• HTTP JavaScript: AED sends a small amount of JavaScript to the client. If the client responds with a redirect, then AED authenticates the client.UDP Flood DetectionThis feature protects against attacks that send an excessive number of UDP packets to a server to exhaust its resources.AED solution can also enable decryption of SSL and TLS for security inspection by addition of hardware security and cryptographic acceleration modules.AED is able to run automatic protection services so the user can limit his duty to monitoring that’s hands-off interaction.Unlike firewalls or load-balancers which keepconnection information as long as the session is up, AED perform real-time Layer 3 to Layer 7 packet and event countermeasures without keeping session table entry during session lifetime.Blacklist and WhitelistAED offers the possibility to blacklist countries or hosts (globally or per protection group). That can be done for both inbound and outbound traffic, this mechanism can also be automatically activated while the system identifies an attack for a particular target or source. To avoid any critical traffic to be affected, users can whitelist sources when those are, for example, belonging to a trusted network (remote sites, partners, providers or customers).TLS/SSL Traffic ProtectionThe TLS Attack Prevention settings enforce correct protocol usage and block malformed SSL and TLS requests. These settings also block clients that attempt to exploit the protocols to exhaust server resources.With the appropriate module (CAM: Cryptographic Acceleration Module and HSM : Hardware Security Module) and the import of keys and certificate on it, AED can decrypt and TLS/SSL traffic and applies the HTTP-related protections. Processing capacity goes up to 97K connections/second.MitigationThe focus of AED is on the automatic detection and mitigation of attacks. When AED is in active mode, it continually blocks any malicious traffic that it detects. However, additional solutions are available to help monitoring the system and blocking attacks which do not fit configured protection settings, or which is not detectable by AED (ex. affecting upstream equipment).Following actions can be taken to mitigate an attack:• Raise protection level on AED to apply stricter setting (thresholds, filter lists…)• Identify and block malicious traffic: blacklist IPs, setup FCAP filters….• Use Cloud signaling: if available, AED can ask for cloud-based mitigation for volumetric attacks to avoid overloading of uplink connectivity.Cloud SignalingWhen Cloud Signaling is activated, AED signals to the cloud service provider that mitigation help is needed. When the service provider begins the mitigation process, the attack that is congesting the upstream links is redirected to the cloud service provider who mitigates the attack, and then routes the cleaned traffic back to customer site (using GRE tunnel for example). Cloud signaling can be setup towards Cloud mitigation infrastructure of the service provider or towards Arbor Cloud DDoS Protection service which is built to handle the high-bandwidth, volumetric attacks that are too large to mitigate at the data center’s premises. By rerouting the traffic away from service provider infrastructure, the Arbor Cloud DDoSProtection service can defuse the attack, thereby limiting downtime and maintaining availability. Redirection to Arbor Cloud can be done by changing DNS records of affected hosts or by modifying BGP announcements (Arbor Cloud service announces the BGP routes for the affected prefixes).NETSCOUT off ers sales, support, and services in over 32 countries. Global addresses, and international numbers are listed on the NETSCOUT website at: /company/contact-usProduct SupportToll Free US: 888-357-7667(International numbers below)Sales InformationToll Free US: 800-309-4804(International numbers below)Corporate Headquarters NETSCOUT Systems, Inc.Westford, MA 01886-4105Phone: +1 Packet CaptureAED offers the possibility to sample the packets that AED inspects, and capture information about the packets in real time. Users can save the packet information (PCAP files for example) to use it to explore payload and define regular expressions to be used to filter traffic (TCP/UPD ports, IP headers…).Graphs and Traffic DataAED provides traffic forensics in real time, graphs for global, per protection group, per target, source, top countries, blocked and passed, matched countermeasure category, top URL, top protocols and top service traffic are displayed as well as Outbound Threat Activity.AlertingBandwidth alerts can be set up globally and per protection group. Alerts raise when defined threshold are exceeded for total, blocked and botnet traffic.Alerts are also raised when a system issue is detected to allow user to take appropriate actions (ex. Interface down, CPU, HW…).NotificationsE-mails, syslog messages and SNMP traps can be configured to be sent when a configured event happens (bandwidth, system health, Cloud signaling event, protection level, change logs …).CDN and Proxy Support SettingsWhen traffic is routed through a CDN or proxy, the source IP address is that of the last CDN or proxy device. Therefore, the protection settings that block an attacker’s IP address might block all traffic from the CDN or proxy. To avoid that, CDN and Proxy Support can be enabled, AED relies on the protection categories that block malicious traffic but do not block the attacker’s IP address. The clean traffic from the CDN or proxy is passed.LEARN MOREFor more information about NETSCOUT Arbor Edge Defense (AED) visit:https:///product/netscout-aed。


Unit11. In a world full of misinformation it is a formidable challenge for the students to learn to identify the true, the beautiful, and the good.2. Any form of mountaineering has its inherent danger. After all, it is an adventure sport.3. The university will permit a degree of individual instruction and the students may receive a curriculum tailored to their needs, learning style and pace.4. It is said that the understanding of the genetic basis of learning will tell us which youngsters are likely to advance quickly and which ones seem doomed to "difficult" school experiences.5. It has been reported that in Canada literally thousands of lakes and rivers are no longer able to support fish or plants.6. In countries with relatively high literacy rates, books play an important part in enriching people's lives.7. The essence of government intervention has been to limit and distort competition rather than to encourage it.8. The great cause of reform being carried out by Chinese people is without precedent in history.9. Practice in simulated examination conditions must not bedelayed until close to the examination time.10. People have found that the lions and wolves in the forest often hunt down live animals by cooperative efforts.Unit21. During that battle a large number of men perished from hunger and thirst due to the severe shortage of food.2. This research project bas further proved that fireworks have originated in China.3. He is tempted to go there in person and check out how the accident happened.4. At present, people have not found an effective way to cure this disease, which is still afflicting old people.5. The contractor must adhere to the contract and complete the important project on time.6. With persistent efforts, they finally settled the dispute between the two regions.7. If Party B fails in delivering goods at a given time, PartyA is entitled to terminate the contract and claim for any loss.8. It usually takes a week to patent one's invention.9. A clever politician knows well how to manipulate the public opinion and take advantage of his supporters.10. The amount of water in tile rivers and lakes will diminish as the dry season continues.Unit31. As such, the event evoked curiosity and awe in most of us.2. The techniques of sales promotion, to work well must gain the trust of middlemen in business as well as consumers. At the same time, they should be consistent with the local preferences and customs.3. TO launch this new product into the European market, the company gave away 10,000 free samples for the local consumers to try.4. As their life has been bettered, going on tours/trips out in the holidays has become a fashionable/stylish pastime for quite a few people.5. The purpose of waging the war is, in nature, to control the oil resources in the area.6. Sales promotion is effective in helping consumers become acquainted with a new product when it is first introduced toa market.7. The new administration has realized that economic reforms must be deepened in conjunction with effective measures takento ensure the basic conditions of employment and daily life for those poor people.8. Towards its sales objective this year, the company offereda training course to enlighten consumers about its latest products.9. To effectively raise our productivity, we should bring in advanced management experience from other countries.10. Professor Wu's lecture helped the students become acquainted with the use of this software product. It also gave them an idea of software development.Unit4I. Those who lead a miserable life often fail to recognize the inherent virtue of work in earning and sustaining their dignity.2. With the life bettered and levels of education higher, the work ethic is diluted now.3. The young generation has much difficulty understanding why their ancestors had to focus their minds upon work as the central concern of existence.4. According to Maslow, different classes and ethnic groups are positioned at different stages in the work hierarchy.5. In developing countries, many talented young intellectuals flock in droves to America, which forms the so-called "brain drain".6. If a country is prone to high inflation, then its currency will have to be dued to maintain the price competitiveness of its exports.7. One expert in sociology believes that work is a means for people to build relationships. In that sense, the workplace performs the function of a community.8. The desire to "fulfill themselves", a harmless and even worthy enterprise, may sometimes degenerate into a selfish discontent.9. To most Americans today, the blow of being laid off seldom carries the life-and-death implications it once had.10. Modem workers may have a lot of complaints. But they will feel better when they know that their predecessors did work under a far more brutal condition during the early stage of the Industrial Revolution.Unit51. The firm will slash its employees from 5,000 to 3,000 because its business is slack.2. We should treasure and maintain the cordial relationship established with them in 1990.3. The patient died after he was infected as a result of a hospital blunder.4. To do simuRaneous interpretation of speeches needs special training and sldlls.5. Ifyou don't follow the objective law, you will be destined to fail.6. It was clear that the government failed to revive the economy or reform the social institutions last year.7. The miners' strike in July showed how quickly workers' anger erupted.8. Whenever you visit the city, on a rainy day or on a sunny one, it gives a scene of an industrial flavor as cheerful and busy as ever.9. He realized that it was difficult to inhabit this barren island any longer.10. Overweight people are often lured by modern food products which claim to be able to help them lose America was once troubled by employment crisis.Unit61. The crime was exposed, and the chief criminal was prosecuted and convicted.2. His international contacts could contribute greatly to their hitherto isolated effort.3. Medical service would be free to the patients, and the financial transaction would take place between the two departments.4. Police are hunting two youths who snatched a handbag froma woman in broad daylight.5. During the ensuing twenty years, his far-sighted management brought great prosperity and turned the company into the largest clothing business in the country.6. His strong belief that she was withholding things from him did not have any basis in fact.7. Over the past few weeks, his every waking moment has been spent poring over his medical books.8. We were given advance warning, so we were able to minimize the effects of the storm.9. Such organizations have had only limited success in averting conflicts between states.lO. She was hounded out of public life by the persistent aaacks of the popular newspapers.Unit71. Cyberspace communication is expanding by leaps and bounds, with millions of people browsing websites daily.2. The Chinese media are formulating new plans in order to increase their presence on the Intemet to meet the challenges of the virtual era.3. The new system now allows faxes to be sent round the world with minimum effort and maximum security.4. Because of its interactivity and accessibility, the Intemet has activated new interest in homestudy programs.5. The invention of the electronic word processor was as startling an information revolution as the invention of the printing press.6. Digital cameras aren't available for everybody -- at least, not yet. While cheaper than before, they are by no means cheap.7. Aworkaholic is a person who works too much. Aworkaholic lives to work, rather than works to live.8. It is not cheap to raise pets in the city. In the case ofa dog, registration may be obtained from the city's Dogs Supervision Office for a fee of about 2,000 yuan a year. 9. Recently, we have witnessed a number of young people who,for a variety of sociological and psychological reasons, have become attached to their computers, and are exploiting their potential in a criminal manner.10. Whether it is worth investing in the long term is still in doubt. Let's assume you are a sports fan.Unit81. Children were asked to complete many compulsory pieces of work each week.2. I commended the girl on the excellent job she had done. I later wrote to commend her to her employer.3. Everyone with a mortgage realized the government's economic strategy was not working.4. Absurd though it may seem, it is quite likely that Mr. Smith and his companions genuinely believe all this.5. He aggravated his condition by leaving hospital too soon.6. By patient questioning we managed to elicit enough information from the witness.7. During your flight you can relax with a drink from the duty-free bar, and a meal or light refreshments will be served according to the time of day.8. I was in a dreadful plight -- I had lost my money and missed the last bus home.9. One of the witnesses was bribed to give false evidence.10. Despite repeated assurance(s) he failed to repay the money he had borrowed.。

电子商务网络安全毕业设计英文原文及翻译-论文电子商务网络安全毕业设计英文原文及翻译|计算机专业全套免费毕业设计论文网|任务书|本科毕业设计课题目作品下载附录A---英文原文Web Security Privacy & CommerceThe running battle between hackers and network security professionals has moved beyond the perimeter firewall to hand-to-hand combat at individual Web and corporate servers.And new security weapons have emerged that use ingenious methods to protect Web sites and corporate networks from external and internal security threats.Here are some of the latest tools at your disposal.No exitGillian G-Server doesn’t care how the hacker got in or what changes they may have made to your Web site.Gillian Exit Control technology prevents the world from seeing the consequences of a security breach.Gillian G-Server sits between the Web server and the router or firewall that connects the Web server to the Internet, inspecting every piece of content that goes out. The Exit Control G-Server contains a collection of digital signatures made from authorized Web content during the publication process.Each time the site content producers publish a new or revised object,the G-Server saves a digital backup of the object along with a digital signature.Signatures that don match send up a red flag which triggers the G-Server to immediately replace a bogus page with a secure archived copy of the original,while simultaneously alerting appropriate personnel.Tripwire,Inc. Tripwire for Servers is a similar data and network integrity product.However,Tripwire for Servers takes a different approach ——its software is loaded onto the server that you want to protect.It monitors all file changes,whether they originate from inside or outside the company,and reports back if a change violates predetermined policies.Honeypots or decoysHoneypots are designed to lure and contain an intruder on the network.Honeypots are decoy devices that can divert attacks from production systems and let security administrators study or understand what happening on the network.ManTrap,from Recourse,is a powerful honeypot that deployed next to data servers,if it being used to deflect internal attacks,and located off the firewall in the demilitarized zone (DMZ) if it being used against external threats.The majority of users deploy it internally to get suspicious activity under control.In that scenario,a ManTrap server would be set up to look like a file server that stores intellectual property or business plans.A successful deployment of ManTrap depends on a variety of factors including quality,naming scheme,placement and security policy.For example,deceptive defenses are most effective when deployed in quantities equal to or greater than that of the production system.Honeypots can get expensive which is why companies must pick and choose the critical servers they want to protect.What attracts an attacker to ManTrap is configuring it to make it look more vulnerable than other servers.Once the hacker is on the decoy server,security managers can log the hacker activity and gain insight into what the intruder is trying to accomplish. Fall into the gapAir gap technology provides a physical gap between trusted and untrusted networks, creating an isolated path for moving files between an external server and a company internal network and systems. Vendors include RVT Technologies, Spearhead Technology and Whale Communications.Whale e-Gap Web Shuttle is a nonprogrammable device that switches a memory bank between two computer hosts. The e-Gap Web Shuttle creates an air gap between the Internet and a company back-office systems. Companies might use e-Gap Web Shuttle between an external service running e-commerce applications, such as online banking, and internal databases that might be queried by external users.The e-Gap system consists of the e-Gap appliance that is attached to two PC hosts, one internal and one external. The internal host connects to the company internal network and the external host sits in the DMZ in front of the firewall.All URLs to Web pages are directed to a mock location on the external host. Pages do not actually reside on this host. The external host strips off the protocol headers, extracts only the content of the Secure Sockets Layer (SSL) traffic and passes it to the e-Gap Web Shuttle. The e-Gap Web Shuttle transports the encrypted data to the internal host using a toggling e-disk. The e-Gap internal host decrypts SSL traffic, authenticates the user and filters the URL content. It then passes the URL request to the company production Web server that resides on the back-office network.The fix is inSecurity and vulnerability assessment tools, designed to be used in-house, can detect weaknesses in an organization systems before problems occur and can fix those problems.Retina , from eEye, scans, monitors, alerts and automatically fixes network security vulnerabilities. The product works on Windows NT SP3 or higher and Windows 2000.The software is installed on any machine within the network. The network administrator types in a range of IP addresses to scan and pushes a button. The product scans the network for vulnerabilities, software flaws and policy problems and reports any vulnerabilities.The product “fix it” feature provides network administrator with a description of any found vulnerabilities, information on how to fix it, or access to a fix it button that can repair the vulnerability locally or remotely.Demolishing DoS attacksPerhaps one of the newest categories of security is products that target denial-of-service (DoS) attacks and more. By definition, DoS attacks make computer systems inaccessible by exploiting software bugs or overloading servers or networks so that legitimate users can no longer access those resources. The product category is so new that some products are still in beta test or on the cusp of entering the marketplace. Going after one of the most malicious types of computer vandalism, the DoS attack, are Arbor Networks, of Waltham, Mass.; Mazu Networks, of Cambridge, Mass.; and Asta Networks in Seattle.Mazu’s solution to distributed DoS attacks works via intelligent traffic analysis and filtering across the network. A monitoring device, such as a packet sniffer or packet analyzer, evaluates packets on the network at speeds up to 1G bit/sec. A monitoring device then determines which traffic needs to be filtered out.The good, the bad and the uglyThe good news about all of these new security techniques is that they theoretically offer companies additional layers of security protection, providing better overall security. What this ultimately means to businesses is that additional security mechanisms can succeed where others have failed. Another plus about some of the new products is that they are optimized for a particular application, such as integrity of the Web servers.However, as with any technology, there are pros and cons to consider. In fact, there are some downsides to implementing these new security products. For example: They are all incremental solutions, not replacements.They require a certain amount of expertise.Many vendors are start-ups and there a risk as to how long theyl be around.There a concern, in many IT shops, about adding preventive controls because of associated overhead——a concern that can be easily remedied by investing in additional horsepower.What too much? When does a company run the risk because of having too many products to manage?The bottom line is that security is never a done deal. It a continuing process that a new crop of innovative vendors are making more interesting.Benevolent WormsAlthough the prospect of using virus technology to simplify the task of delivering patches and software updates is tempting, the dangers can outweigh the benefits when the process is too automated. For example, the improved Windows Update feature in Windows XP now allows patches and updates to be downloaded automatically,altho ugh installation is still at the user’s discretion.Trojan horses, worms, and other malicious code forms have proven to be incredibly successful at paralyzing e-mail systems and Internet providers. It is therefore only logical to conceive of ways to use them for productive purposes, much as the Bible exhorts its readers to beat their swords into plowshares and their spears into pruning hooks.Granted, it would be wonderful if IT administrators could distribute patches and software updates to desktops and servers as quickly as an e-mail virus can spread from one machine to the next. But is such a magic wand really a good idea?Well, maybe not exactly. After all, unlike the human immune system, which produces defenses, or antibodies, automatically, the computer must wait for a human to analyze samples of a computer virus, prepare antidotes and vaccines for that specific situation, and only then apply the cure.This observation alone would seem to discredit the idea of a “digital immune system” that the sec urity community has tossed around during the past few years, but there’s an even more important point to consider. Similar to the way that autoimmune diseases turn the body’ s own defenses against itself, so could one turn a viruslike software delivery system against its own computers. Although it would be difficult to monkey with the digital certificates that would conceivably be used to identify trusted patches, it’s not impossible to subvert the certificate issuing system, as Microsoft and VeriSign found to their dismay last March.Ultimately, a viruslike software delivery system would require software publishers to deliberately put a back door into their systems, and few customers will tolerate that practice, even under shrinkwrap licensing terms. Becau se there’s no guarantee thatsuch a tempting target wouldn’t be exploited by hackers, any IT manager deploying such a system would be foolhardy in the extreme.Virus behavior that standpoint go to see from the operate system, is some normal behaviors, and say for the operate system that don't break the law , therefore at kill the virus software to check to kill the virus, usually meeting because operate system of obstruction-" the document was take upped by system and can't change the code at system "," virus the inside to circulate" etc. reason, but can't clean the virus , we at kill the virus of time also want to speak to investigate some techniques, and go to the round over the operate system's obstruction, from success of virus is from the system Speak here of kill the virus method is:Kill the virus with the tool under the safe mode to kill the virus under the pure DOS mode.Why want the pure DOS mode to down kill the virus?Because the virus procedure is under the operate system explain the mode to circulate o, such as:Script virus" new and happiness time", virus etc., they can't circulate in the inside memory, and system also argue all legal procedures but as to it's take in to protect, and guarantee it continue to circulate, prohibition against in the movement procedure right proceed modification, this result ined virus can't quilt the clearance's result for aegis for having under the pure DOS mode, connecting the Windows operate system all don't can quilt circulating, virus more impossible movement, for this reason this hour as to it's checking killing, round over system, attaining cleanly killing the virus.The usage special tool under the safe mode to kill the virusThe each of Windows operate system for edition all contain a safe mode to circulate the way, and here circulate the way bottom can only circulate the most basic procedure, again this mode bottom, you can cancel all of from start the item,avoid the virus's special tool is small and very shrewd, and use it can under the safe mode normal weakness is a result for can aim atting the popular virus of some comparisons, can't attaining completely killing the virus.For attain to kill the clean virus result, we can synthesize to use these two kinds of methods.Kill the virus not equal to defend the virus, and hard work should be protected . Privacy-Protecting techniquesIn this chapter, we will look at some proven techniques to protect your privacy when you use the Internet. Most of these techniques are simple, commonsense rules that you can put into effect immediately-choosing a good service provider, using good password, cleaning up after yourself online, avoiding Spam and junk email, and protecting yourself from identity theft.Choosing a good service providerThe first and most important technique for protecting your privacy is to pick service providers who respect your privacy.Here are some things to consider when you choose an ISP:. Unless you take special measures to obscure the content and destinations of your Internet usage, your ISP can monitor every single web page that you visit, every email message that you send, every email message that you receive, and many others about your Internet usage.. If you have a dialup ISP ,your ISP can also infer when you are at home ,when you go on vacation, and other aspects of your schedule.. If you check your email from work ,your ISP can learn where you work.. Many ISPs routinely monitor the actions of their subscribers for the purposes of testing equipment, learning about their user population, or collecting per-user demographics.. Some ISPs will monitor the web sites that you visit and sell this information for the purpose of increasing their revenue. In some cases, the ISPs clearly state this policy and, in fact ,use the sale of the data as a way of subsidizing the cost of Internet access .Other ISPs silently engage in this practice.. Equipment is now on the market that allows ISPs to monitor the advertisements that are downloaded to your computer and ,in some case, replace the advertisements with different ones. This equipment is also capable of generating detailed user-level statistics.. Some ISPs have strict policies regarding which employees have access to user data and how that data must be protected .Other ISPs have no policies at all.. Many policies that are in use basically say “we can monitor anything that we want.”However,not all ISPs that have these policies actually monitor their users. Picking a Great PasswordPasswords are the simplest from of authentication. Passwords are a secret that you share with the you log in, you type your password to prove to the computer that you are who you claim to be. The computer ensures that the password you type matches the account that you have specified. If they match, you allowed to proceed.Using good passwords for your Internet service is a first line of defense for your privacy. If you pick a password that is easy to guess, then somebody who is targeting you will find it easier to gain access to your personal information. If you use the same password on a variety of different services ,then a person who is able to discover the password for one of your services will be able to access other services.Good Passwords: locked DoorsGood passwords are passwords that are difficult to guess. The best passwords are difficult to guess because they:-Have both uppercase and lowercase letters-Have digits and/or punctuation characters as well as letters-May include some control characters and /of spaces-Are easy to remember, so they do not have to be written down-Are at least seven of eight characters long-Can be typed quickly ,so somebody cannot determine what you type by watching over your shoulderIt is easy to pick a good password. Here are some suggestions:.Take two short words and combine them with a special character or a number, like robot4my or eye-con..Put together an acronym that is special to you, like Notfsw(None of this fancy stuff works),auPEGC(All Unix programmers eat green cheese),orTtl*Hiww(Twinkle,twinkle,little star. How I w onder what…).Cleaning Up After YourselfWhen you use the Internet, you leave traces of the web sites that you visit and the information that you see on your computer. Another person can learn a lot about the web sites that you have visited by examining your computer for these electronic footprints. This process of computer examination is called computer forensics, and it has become a hot area of research in recent years. Special-purpose programs can also examine your computer and either prepare a report, or transmit the report over the Internet to someone else.Although it can be very hard to remove all traces of a web site that you have seen or an email message that you have downloaded, you can do a good job of cleaning up your computer with only a small amount of work. There are also a growing number of programs that can automatically clean up your computer at regular intervals as we will see in the next chapter.Avoiding Spam and Junk EmailUnwanted electronic mail is the number one consumer complaint on the Internet today. A 1999 study by BrightMail,a company that develops antispam technology, found that 84 percent of Internet users had received Spam;42 percent loathed the time it takes to handle Spam;30 percent found it to be a “significant invasion of privacy;”15 percent found it offensive; and ISPs suffered account churn rates as high as percent as a direct result of Spam.Protect Your Email AddressTo send you junk mail, a spammer must have your email address. By understanding how spammers get email addresses, you can keep your mailbox relatively Spam-free: Do not put your email address on your home page, Take your name out of online directories, Do not post to public mailing lists, Do not post to Usenet, Pick an unusual username.附录B---中文翻译网络上的个人和商业安全原文见于,请对照参考。
Unit11. In a world full of misinformation it is a formidable challenge for the students to learn to identify the true, the beautiful, and the good.2. Any form of mountaineering has its inherent danger. After all, it is an adventure sport.3. The university will permit a degree of individual instruction and the students may receive a curriculum tailored to their needs, learning style and pace.4. It is said that the understanding of the genetic basis of learning will tell us which youngsters are likely to advance quickly and which ones seem doomed to "difficult" school experiences.5. It has been reported that in Canada literally thousands of lakes and rivers are no longer able to support fish or plants.6. In countries with relatively high literacy rates, books play an important part in enriching people's lives.7. The essence of government intervention has been to limit and distort competition rather than to encourage it.8. The great cause of reform being carried out by Chinese people is without precedent in history.9. Practice in simulated examination conditions must not be delayed until close to the examination time.10. People have found that the lions and wolves in the forest often huntdown live animals by cooperative efforts.Unit21. During that battle a large number of men perished from hunger and thirst due to the severe shortage of food.2. This research project bas further proved that fireworks have originated in China.3. He is tempted to go there in person and check out how the accident happened.4. At present, people have not found an effective way to cure this disease, which is still afflicting old people.5. The contractor must adhere to the contract and complete the important project on time.6. With persistent efforts, they finally settled the dispute between the two regions.7. If Party B fails in delivering goods at a given time, Party A is entitled to terminate the contract and claim for any loss.8. It usually takes a week to patent one's invention.9. A clever politician knows well how to manipulate the public opinion and take advantage of his supporters.10. The amount of water in tile rivers and lakes will diminish as the dry season continues.Unit31. As such, the event evoked curiosity and awe in most of us.2. The techniques of sales promotion, to work well must gain the trust of middlemen in business as well as consumers. At the same time, they should be consistent with the local preferences and customs.3. TO launch this new product into the European market, the company gave away 10,000 free samples for the local consumers to try.4. As their life has been bettered, going on tours/trips out in the holidays has becomea fashionable/stylish pastime for quite a few people.5. The purpose of waging the war is, in nature, to control the oil resources in the area.6. Sales promotion is effective in helping consumers become acquainted with a new product when it is first introduced to a market.7. The new administration has realized that economic reforms must be deepened in conjunction with effective measures taken to ensure the basic conditions of employment and daily life for those poor people.8. Towards its sales objective this year, the company offered a training course to enlighten consumers about its latest products.9. To effectively raise our productivity, we should bring in advanced management experience from other countries.10. Professor Wu's lecture helped the students become acquainted withthe use of this software product. It also gave them an idea of software development.Unit4I. Those who lead a miserable life often fail to recognize the inherent virtue of work in earning and sustaining their dignity.2. With the life bettered and levels of education higher, the work ethic is diluted now.3. The young generation has much difficulty understanding why their ancestors had to focus their minds upon work as the central concern of existence.4. According to Maslow, different classes and ethnic groups are positioned at different stages in the work hierarchy.5. In developing countries, many talented young intellectuals flock in droves to America, which forms the so-called "brain drain".6. If a country is prone to high inflation, then its currency will have to be dued to maintain the price competitiveness of its exports.7. One expert in sociology believes that work is a means for people to build relationships. In that sense, the workplace performs the function ofa community.8. The desire to "fulfill themselves", a harmless and even worthy enterprise, may sometimes degenerate into a selfish discontent.9. To most Americans today, the blow of being laid off seldom carries the life-and-death implications it once had.10. Modem workers may have a lot of complaints. But they will feel better when they know that their predecessors did work under a far more brutal condition during the early stage of the Industrial Revolution.Unit51. The firm will slash its employees from 5,000 to 3,000 because its business is slack.2. We should treasure and maintain the cordial relationship established with them in 1990.3. The patient died after he was infected as a result of a hospital blunder.4. To do simuRaneous interpretation of speeches needs special training and sldlls.5. Ifyou don't follow the objective law, you will be destined to fail.6. It was clear that the government failed to revive the economy or reform the social institutions last year.7. The miners' strike in July showed how quickly workers' anger erupted.8. Whenever you visit the city, on a rainy day or on a sunny one, it gives a scene of an industrial flavor as cheerful and busy as ever.9. He realized that it was difficult to inhabit this barren island any longer.10. Overweight people are often lured by modern food products which claim to be able to help them lose weight.i America was once troubled by employment crisis. Unit6 1. The crime was exposed, and the chief criminal was prosecuted and convicted. 2. His international contacts could contribute greatly to their hitherto isolated effort. 3. Medical service would be free to the patients, and the financial transaction would take place between the two departments. 4. Police are hunting two youths who snatched a handbag from a woman in broad daylight. 5. During the ensuing twenty years, his far-sighted management brought great prosperity and turned the company into the largest clothing business in the country. 6. His strong belief that she was withholding things from him did not have any basis in fact. 7. Over the past few weeks, his every waking moment has been spent poring over his medical books. 8. We were given advance warning, so we were able to minimize the effects of the storm.9. Such organizations have had only limited success in averting conflicts between states. lO. She was hounded out of public life by the persistent aaacks of the popular newspapers. Unit7 1. Cyberspace communication is expanding by leaps and bounds, with millions of people browsing websites daily. 2. The Chinese media are formulating new plans in order to increase their presence on the Intemet to meet the challenges of the virtual era. 3. The new system now allows faxes to be sent round the world with minimum effort and maximum security. 4. Because of its interactivity and accessibility, the Intemet has activated new interest in homestudy programs. 5. The invention of the electronic word processor was as startling an information revolution as the invention of the printing press. 6. Digital cameras aren't available for everybody -- at least, not yet. While cheaper than before, they are by no means cheap. 7. Aworkaholic is a person who works too much. Aworkaholic lives to work, rather than works to live. 8. It is not cheapto raise pets in the city. In the case of a dog, registration may be obtained from the city's Dogs Supervision Office fora fee of about 2,000 yuan a year. 9. Recently, we have witnessed a number of young people who, for a variety of sociological and psychological reasons, have become attached to their computers, and are exploiting their potential in a criminal manner. 10. Whether it is worth investing in the long term is still in doubt. Let's assume you are a sports fan. Unit8 1. Children were asked to complete many compulsory pieces of work each week. 2. I commended the girl on the excellent job she had done. I later wrote to commend her to her employer. 3. Everyone with a mortgage realized the government's economic strategy was not working. 4. Absurd though it may seem, it is quite likely that Mr. Smith and his companions genuinely believe all this. 5. He aggravated his condition by leaving hospital too soon. 6. By patient questioning we managed to elicit enough information from the witness. 7. During your flight you can relax with a drink from the duty-free bar, and a meal or light refreshments will be served according to the time of day.8. I was in a dreadful plight -- I had lost my money and missed the lastbus home. 9. One of the witnesses was bribed to give false evidence. 10. Despite repeated assurance(s he failed to repay the money he had borrowed.。
Chapter 4 The Network Layer 1.What is the name of a network-layer packet?()A.messageB.segmentC.datagramD.frame2.What are the two most important network-layer functions in a datagram network? ()A.forwarding & routingB.forwarding & filteringC.routing & detectingD.routing & checking3.When a packet arrives at a router’s input link, the router must move the packet to the appropriate output link, this action is called ____? ()A.ForwardingB.routingC.cut throughD.filtering4.The network layer must determine the path taken by packets as they flow from a sender to a receiver. This action is called____? ()A.ForwardingB.routingC.cut throughD.examine5.A router forwards a packet by examining the value of a field in the arriving packet’s header, and then using this value to index into the router’s forwarding table, this value is? ()A.destination IP addressB.source IP addressC.destination MAC addressD.source MAC address6.IP belongs to ____ layer? ()A.transportworkC.data linkD.physical7.Which layer provides host-to-host services? ()A.transportworkC.data linkD.physical8.Which layer provides a connection service calledvirtual-circuit networks and a connectionless service called datagram networks? ()A.transportworkC.data linkD.physical9.IPV4 has a ___ bit address? ()A.48B.16C.32D.6410.MAC address is ____ bits? ()A.48B.16C.32D.6411.The Internet’s network layer has three major component s, the first component is the IP protocol, the second component is the routing protocol, the final component is____? ()A.forwardingB.address translationC.checkD.ICMP12.How many bits specify the IP protocol version in a datagram? ()A. 1 bitB. 2 bitsC. 4 bitsD.8 bits13.Most IPV4 datagram do not contain option field, how many bytes a header has in a typical IP datagram? ()A. 4 bytesB.8 bytesC.16 bytesD.20 bytes14.How many bits used in IP datagram express total length of the IP datagram? ()A. 4 bitsB.8 bitsC.16 bitsD.20 bits15.Data-grams are rarely larger than ____?()A.1500 bytesB.65535 bytesC.500 bytesD.1024 bytes16.New version of IP----IPV6 does not allow fragment in ____?()A.RouterB.HostC.Both of aboveD.None of above17.How does the TTL changed by one each time the datagram is processed by a router? ()A.decreaseB.increaseC.no changeD.always 018.Which layer protocol is indicated by the value of protocol field in IP datagram? ()A.applicationB.transportworkD.data link19.IP option is dropped in the ____ header. ()A.IPv6B.IPv4C.TCPD.UDP20.The data field in IP datagram can carry many types of data except ____. ()A.TCPB.UDPC.ICMPD.MAC21.ICMP is used for____?()A.Reliable data transferB.Error reportingC.Flow controlD.Congestion control22.Suppose you receive an IP datagram from one link and check your forwarding table to determine the outgoing link, but this outgoing link has an MTU that is smaller than the length of IP datagram. Which technology will be used? ()A.resendB.discardC.fragmentD.none23.The designer of IPv4 decided to put the job of datagram reassembly in____.()A.routerB.switchC.hubD.end system24.IP addressing assigns an address to 223.10.198.250/29, the network address for this network is____.()A.223.10.198.248B.223.10.198.250C.223.10.198.0D.223.10.0.025.If all data-grams arriving at the router from WAN have the same destination IP address, then how does the router know the internal host to which it should forward a given datagram? The trick is to use ____ table at router, and include port numbers as well as IP address in the table entries. ()A.routingB.forwardingC.ARPD.NAT translation26.When running a Telnet, FTP, or HTTP session, you may haveencountered an error message such as “Destination network un-reachable”, This message had its origin in ____. ()A.IGMPB.EGPC.ICMPD.BGP27.The well-known ping program sends an (a) ____ type 8 code 0 message to the specified host. The destination hosts seeing the echo request, send back a type 0 code 0 ICMP echo reply. ()A.ICMPB.IGMPC.TCPD.UDP28.Tracer-out is implemented with ____ messages. ()A.IGMPB.TCPC.UDPD.ICMP29.The standard Tracer-out program actually sends sets of ____ packets with the same TTL. ()A.oneC.threeD.four30.IPv6 increases the size of the IP address from 32bit to ____ bit. ()A.64B.128C.256D.51231.How many bytes are there in header of IPv6? ()A.8B.20C.40D.3232.IPv6 does not allow for fragmentation and reassembly at inter-media ____. ()A.routersB.switchesC.end systemD.hubs33.From sender to receivers, all packets will take the same path, this is we use a ____ service. ()B.VCC.circuitD.Ethernet34.____ means moving packets from router’s input port to appropriate router output port? ()A.forwardingB.filteringC.routingD.switching35.____ means determining route taken by packets from source to destination? ()A.forwardingB.filteringC.routingD.switching36.A router works in ____ layer? ()workingB.Data linkC.ApplicationD.Physical37.A switch works in ____ layer? ()workingB.Data linkC.ApplicationD.Physical38.Networking layer provides services between two ____.()A.HostsB.ProcessesC.ApplicationsD.Machines39.Link layer provides services between two ____. ()A.HostsB.ProcessesC.ApplicationsD.Machines40.The internet’s network layer provides a singleservice----that is ____.()A.Reliable data transferB.Flow controlC.Congestion controlD.Best-effort-service41.Datagram network provides network-layer____.()A.connectionless serviceB.connection serviceC.both of aboveD.neither of A and B42.VC network provides network-layer ____. ()A.connectionless serviceB.connection serviceC.both of aboveD.neither of A and B43.In VC network, each packet carries ____. ()A.VC identifierB.destination host addressC.IP addressD.Mac address44.A VC consists of three part, this three parts do not include____. ()A.Path from source to destinationB.VC numbers, one number for each link along pathC.Entries in forwarding tables in routers along pathD.Destination address45.In ____ networking, a series of packet may follow different paths and may arrive out of order? ()A.DatagramC.TCPD.None of above46.The internet is a (an) ____ network? ()A.DatagramB.VCC.Both of aboveD.None of above47.The four components of a router do not include____? ()A.Input and output portsB.Switch fabricC.Routing processorD.Switching processor48.There are three kinds of switch fabric for a router normally, those three switch fabric do not includes____?()A.Switching via memoryB.Switching via a busC.Switching via an Interconnection-NetworkD.Packet switching49.Which of the following protocol is used for error reporting? ()A.ICMPC.IPD.UDP50.Which of the following is not a routing protocol? ()A.TCPB.RIPC.OSPFD.BGP51.IPV4 has a ___ bits address? ()A.32B.64C.16D.12852.IP address is identifier for ____. ()A.HostB.Router interfaceC.Both of aboveD.None of above53.“233.1.1.0/24”, where the /24 notation, sometimes known as a____. ()A.Subnet maskworking addressC.Host addressD.None of above54.Subnets with an 8-, ____-, and 24-bit subnet addresses were know as class A, B, and C networks respectively. ()A.9B.10C.12D.1655.IPV6 has a ___ bits address? ()A.32B.64C.16D.12856.____ means that IPv6 nodes also have a complete IPv4 implementation as well? ()A.Dual stackB.TunnelingC.Bridge connectionD.Forwarding57.____ means that IPv6 carried as payload in IPv4 data-gram among IPv4 routers? ()A.Dual stackB.TunnelingC.Bridge connectionD.Forwarding58.Typically a host is attached directly to one router, the ____ for the host. ()A.Default routerB.Source routerC.Destination routerD.Core router59.The default router of the source host is known as ____.()A.Default routerB.Source routerC.Destination routerD.Core router60.The default router of the destination host is known as ____. ()A.Default routerB.Source routerC.Destination routerD.Core router61.A path between the source and destination that has beastcost is known as____. ()A.Least cost pathB.Shortest pathrgest cost pathD.None of above62.The path with the smallest number of links between the source and the destination is known as ____. ()A.Least cost pathB.Shortest pathrgest cost pathD.None of above63.Which of following about DV is not correct? ()A.IterativeB.SynchronousC.DistributedD.Self-terminating64.Which of the following is not intra-AS routing protocol? ()A.RIPB.OSPFC.IGRPD.BGP65.RIP is a kind of ____ algorithm. ()A.DVB.LSC.Both of aboveD.Neither of A and B66.OSPF is a kind of ____ algorithm. ()A.DVB.LSC.Both of aboveD.Neither of A and B67.The router in non-backbone areas and perform only intra-AS routing is known as ____. ()A.Internal routersB.Area border routersC.Backbone routersD.Boundary routers68.____“summarize” distances to nets in own area, advertise to other Area Border routers. ()A.Internal routersB.Area border routersC.Backbone routersD.Boundary routers69.____ runs OSPF routing limited to backbone. ()A.Internal routersB.Area border routersC.Backbone routersD.Boundary routers70.____ connect to other AS’s. ()A.Internal routersB.Area border routersC.Backbone routersD.Boundary routers71.Which of the following is an inter-autonomous system routing protocol? ()A.RIPB.OSPFC.IGRPD.BGP72.____means sending a packet to all other nodes in the network. ()A.BroadcastB.MulticastC.Any-castD.Uni-cast73.A ____ packet is delivered to only a subset of network nodes. ()A.BroadcastB.MulticastC.Any-castD.Uni-cast74.Means that the switch must receive the entire packet before it can begin to transmit the first bit of the packet onto the outbound link. ()A.store-and-forward transmissionB.FDMC.End-to-end connectionD.TDM75.Datagram networks and virtual-circuit networks differ in ____.()A.Datagram networks are circuit-switched networks, andvirtual-circuit networks are packet-switched networks.B.Datagram networks are packet-switched networks, andvirtual-circuit networks are circuit-switched networks.C.Datagram networks use destination addresses andvirtual-circuit networks use VC. Numbers to forward packets toward their destination.D.Datagram networks use VC. Numbers and virtual-circuitnetworks use destination addresses to forward packetstoward their destination.76.The Internet’s network layer is responsible for moving network-layer packets known as ____ from one host to another. ()A.frameB.datagramC.segmentD.message77.The protocols of various layers are called ____. ()A.the protocol stackB.TCP/IPC.ISPwork protocol78.The two important network-layer functions are ____. ()A.multiplexing and de-multiplexingB.routing and forwardingC.lookup and forwardingD.routing and IP addressing79.The virtual circuit includes three identifiable phases but ____. ()A.setupB.data transferC.forwarding VC numbersD.teardown80.There are some ways to accomplish the switching in the router, which one is not included? ()A.switching via memoryB.switching via a busC.switching via hubD.switching via an interconnection81.In the router, the packet queues can form at ____.()A.institutional cacheB.switch fabricC.input portD.routing processor82.In IPV4 datagram header, which field is to ensure that datagram do not circulate forever in the network? ()A.type of serviceB.time-to-liveC.header checksumD.version83.Suppose one IP datagram of 5,000 bytes (20 bytes of IP header)and it must be forwarded to a link with an MTU of 1,500 bytes, the offset and flag of the second fragment in header are ____. ()A.185, 0B.185, 1C.370, 1D.370,084.Given the IP address 202.96.104.8/20, its subnet address is ____. ()A.202.96.104.0B.202.96.96.0C.202.96.104.255D.202.96.111.25585.If the subnet mask is 255.255.240.0, then how many bits indicate the host address? ()A.20B.24C.12D.1686.In the following four fields, which is in IPV6 header but not in IPV4? ()A.source addressB.destination addressC.versionD.flow label87.One host is attached directly to one router, the router is ____.()A.NAT routerB.gateway routerC.first-hop routerD.interval router88.The Internet’s network layer includes the following components but ____.()A.IP protocolB.the Internet Message Control ProtocolC.Routing ProtocolD.Channel Partitioning Protocol89.In the following protocols, which one is inter-AS routing protocol? ()A.RIPB.OSPFC.BGPD.ICMP90.In the following four descriptions about autonomous system,which one is not correct? ()A.An autonomous system is a collection of routers underthe same administrative and technical control.B.All routers in an autonomous system run the same routingprotocol.C.The routing algorithm running within an autonomoussystem is called an intra-AS routing protocol.D.The routers that connect AS-s to each other are calleddefault router.91.In the loop of the Dijkstra’s algorithm, for node x, add y to N’, and update the cost of y’s neighbor v, then D(v) is ____. ()A.c(x, v)B.min{D(v), D(x)+c(x, v)}C.min{D(v), D(y)+c(y, v)}D.c(y, v)92.Consider the data D is 01110010001, if use even parity checking approach, the parity bit is ( ), if use odd parity checking approach, the parity bit is ____. ()A.0, 0B.0, 1C.1, 0D.1, 193.The ability to determine the interfaces to which a frame should be directed, and then directing the frame to those interfaces is ____.()A.filteringB.forwardingC.self-learningD.optimal routing94.Given that costs are assigned to various edge in the graph abstraction. In the following four descriptions, which one is not correct? ()A.The shortest path is the path with smallest number oflinks between the source and destination.B.The least cost path is not always the shortest path.C.If all edges have same cost, the least cost path mustbe the shortest path.D.If all edges have various costs, the least cost path mustnot be the shortest path.95.Given the IP address 202.96.104.8/20, its broadcast address is ____. ()A.202.96.104.0B.202.96.96.0C.202.96.104.255D.202.96.111.25596.If the subnet mask is 255.240.0.0, then how many bits indicate the host address? ()A.20B.12C.24D.1697.In IPV6 datagram header, the field Next-header is equivalent to the field ( ) in IPV4. ()A.upper-layer protocolB.time-to-liveC.header checksumD.version98.For one host, its source router is also called ____. ()A.NAT routerB.gateway routerC.first-hop routerD.interval router99.In the following four descriptions about link-state (LS) algorithm, which one is not correct? ()A.The LS algorithm must be aware of the cost of each linkin the network.B.The LS algorithm is a decentralized algorithmC.The LS algorithm computes the least cost path betweena source and destination using complete global knowledgeabout the networkD.The calculation of LS algorithm can be run at one siteor multiple sites100.In the initialization of the Dijkstra’s algorithm, for node x, if y is not a neighbor of x, then D(y) is ____. ()A.0B. 1C.∞D.c(x, y)101.In DV algorithm, when one node updates its distance vector, it must ____.()A.send the updated routing table to its neighborsB.send the updated routing table to all the nodes in theASC.send the updated routing table at randomD.do nothing102.Now we had known IP address is 211.197.3.158/26, Pleasecompute :(1). Network address?(2). Broadcast address?(3). How many hosts are there in the network?(4). Fist host IP address?(5). Last host IP address? 103.For the given topology of the network, use Dijstra’s shortest path algorithm to compute the shortest path from A to all network nodes. Give a shortest path tree and node A’s routing table.104.The topology of a network shown as below. Using Link State routing algorithm to calculate the routing table in the node A. The vectors arrive to node C as bellow: B:( 4, 0, 8, 12, 6, 2 ); D:( 13, 10, 6, 0, 9, 10 ); E:( 7, 6, 3, 9, 0, 14 ). The delays measured from C to B, D, E are 4, 2, and 3separately. Update router C’s route table please.31。
Experience in Black-box OSPF MeasurementAman Shaikh,Albert GreenbergAbstract—OSPF(Open Shortest Path First)is a widely used intra-domain routing protocol in IP networks.Inter-nal processing delays in OSPF implementations impact the speed at which updates propagate in the network,the load on individual routers,and the time needed for both intra-domain and inter-domain routing to reconverge following an internal topology or a configuration change.An OSPF user,such as an Internet Service Provider,typically has no access to the software implementation,and no way to esti-mate these delays directly.In this paper,we present black-box methods(i.e.,measurements that rely only on external observations)for estimating and trending delays for key in-ternal tasks in OSPF:processing Link State Advertisements (LSAs),performing Shortest Path First calculations,updat-ing the Forwarding Information Base,andflooding LSAs. Corresponding measurements are reported for production routers from Cisco Systems.To help validate the methodol-ogy,black-box and white-box(i.e.,measurements that rely on internal instrumentation)are reported for a open source OSPF implementation,GateD.Keywords—Routing,OSPF,black-box measurements, SPF calculationI.I NTRODUCTIONOSPF is used widely as an intra-domain routing proto-col[1][2]in IP networks today.Overall,OSPF implemen-tations are now robust and high quality.Still,the behav-ior of these implementations in large operational IP net-works,especially under transient stress,is not very well understood.Any sort of service level agreement or quality assurance depends on routing stability.Any internal topo-logical or OSPF configuration change will,in general,alter trafficflows throughout the network,following a transient period during which route calculation has yet to converge. In general,such an event triggers not only intra-domain routing changes,but also inter-domain routing changes, since BGP(Border Gateway Protocol)uses intra-domain Aman Shaikh is at the University of California,Santa Cruz,CA 95064,E-mail:aman@Albert Greenberg is with AT&T Research,Florham Park,NJ07932, E-mail:albert@ (OSPF)distance calculations to break ties between candi-dates for traffic egress points.Thus,a very large number of flows and a very large number of customers are potentially impacted by OSPF events.A number of key tasks internal to OSPF implemen-tations affect the speed at which updates propagate in the network,the load on individual routers,and the time needed to reconverge.The delays associated with some of these tasks depend on scaling factors such as the number of routers and links in the network.To understand these de-lays and their dependencies,we could imagine gathering data by instrumenting OSPF implementations deployed in the network.However,users,such as Internet Service Providers,have limited opportunities for this.First,com-mercial implementations are proprietary.Second,even if appropriate access was provided,the necessary instrumen-tation to measure certain tasks(e.g.,updates to the For-warding Information Base)may be difficult to achieve. The instrumentation may involve kernel level measure-ment,grappling with various platform dependencies,and reverse engineering complex code written and debugged over the years by numerous developers.In this paper,we present black-box measurement tech-niques for estimating key internal delays in OSPF imple-mentations,and our experience in applying these tech-niques to production routers from Cisco Systems.We tested a variety of Cisco platforms including the12012 (GSR),7513and3660.By black-box,we mean the inter-nal task times are estimated using only external observa-tions of the behavior of the box under test.Table I summa-rizes internal tasks considered:processing Link-State Ad-vertisements(LSAs),performing Shortest Past First(SPF) calculations,updating the Forwarding Information Base (FIB),andflooding LSAs to neighboring routers.As de-scribed in Section II,these are the key tasks OSPF goes through upon receiving an update.As Table I indicates,we examine the dependencies of these tasks on scaling factors such as the network size.The methods presented are effec-tive in estimating delays across a wide range,from a few hundred microseconds to a few hundred milliseconds,and in correctly capturing dependencies with scaling parame-ters.For example,the black-box SPF measurements agree with white-box counterparts and scale quadratically with the network size.The idea behind the black-box measurements is straight-TABLE IS UMMARY OF PROCESSING DELAYS FOR WHICH MEASUREMENTS ARE PRESENTED IN THIS PAPER.Task Type of Measurement LSA Processing black-boxblack-boxNumber of links at a routerShortest Path First Calculation black-box,white-boxNumber of routersLS Update LS Ack data packetroute processor (CPU)OSPF SPF calculationdata packetinterface cardSwitching fabricinterface cardLS Update forwarding databaselink−state FIBforwarding Fig.2.Model of a router.II.OSPF P ROCESSINGOverviewOSPF is a link-state routing protocol,meaning each router (i)discovers and maintains a complete view of the network topology (within the the domain controlled by OSPF),and (ii)uses this view to calculate paths to all des-tinations in the network [2].In essence,the topology is a directed graph,where routers correspond to vertices and links between neighboring routers correspond to unidirec-tional edges.All links are administratively assigned fixed numerical weights.Each router independently computes a shortest path tree with itself as the root,and applies the re-sults to build its Forwarding Information Base (FIB).We refer to the computation of the shortest path tree as the SPF computation ,and the tree itself as the SPF tree .Fig-ure 1provides an example.OSPF allows a network to be divided into one or more areas for scalability.In OSPF,each router describes a certain part of the network in a message termed a Link-State Advertisement (LSA).LSAs are flooded reliably to other routers in the network,so that all routers can build a consistent view of the network topology.Each router stores a current set of LSAs as a local link-state database ;LSAs contained in the database determine the topology visible from the router.When sending LSAs to a neighbor,a router bundles them together in a Link-State Update (LS Update)packet.To ac-knowledge receipt of each LSA,the receiving router bun-dles individual LSA acks into Link-State Acknowledgment(LS Ack)packets,and sends them to the appropriate neigh-bor.Figure 2depicts a simplified model of a router.Routing protocols like OSPF run on a route processor.OSPF re-ceives LSAs bundled in LS Update packets as shown in the figure and processes these to build the link-state database.OSPF then uses the link-state database to perform an SPF calculation and applies the result to build the FIB.In most modern routers,the FIB is maintained in specialized mem-ory to maximize forwarding performance.Data packets do not consume CPU cycles of the route processor.Once a data packet arrives on an interface card,the card con-sults the FIB to determine the next hop and forwards the packet to the outgoing interface through a switching fabric as shown in the figure.ProcessingConsider the processing tasks initiated by receipt of an LS Update packet (Figure 3).Although the OSPF speci-fication clearly describes the tasks to be performed upon receiving an LS Update packet,it gives implementors a lot of leeway in how and when these tasks are scheduled.The flow chart in Figure 3follows the specification while capturing the scheduling choices available to implemen-tors.As can be seen from the figure,upon receiving an LS Update packet,OSPF processes all the LSAs contained in the packet.For each LSA,OSPF classifies the LSA as new or duplicate based on the sequence number con-tained in the LSA.An LSA is deemed a duplicate if theLSA needs to be flooded outDetermine which interfaces T3T6T5T7T4T2T1newduplicateYesNoUpdate link−state databaseSchedule SPF calculation if requiredAcknowledge LSA immediately Get (next) LSAReceive an LS Update packetnew/duplicate?Send LS Ack packet backSPF calculation endsFIB is updatedBundle LSAs into an LS Update packet and flood the packet outDoes next LSA exist?LS Update packet processing overSPF calculation startsFig.3.Flow chart depicting OSPF processing initiated by the receipt of an LS Update packet.sequence number is the same as that of a matching LSA instance in the router’s link-state database.OSPF typically receives duplicate LSAs because of flooding redundancy,i.e.,when all the neighbors of the router send the same LSA to the router.An LSA is new if its sequence num-ber is higher than that of the matching LSA instance in the router’s database.As the figure shows,LSA processing de-pends on the new or duplicate distinction.For every new LSA,OSPF has to update its link-state database,sched-ule an SPF calculation and determine which interfaces theLSA needs to be flooded out.Actual flooding of the LSA may or may not happen immediately after LSA processing.Modern routers em-ploy pacing mechanisms as a form of flow control while sending out OSPF packets [7].LSA flooding is driven by a timer off the path of LSA processing.In other words,while processing the LSAs,OSPF merely deter-mines which interfaces the LSA needs to be flooded out according to [1],but does not actually send the LSA.The LSA is sent out on an interface along with other “to-be-flooded”LSAs when the timer associated with the inter-facefires.In this paper,our objective is to determine two parame-ters relevant to LSA processing:which indicates how long it takes toflood an LSA after it is received().When processing an LSA,OSPF also has to determine whether to carry out an SPF calculation.Not all LSAs indicate a change in topology;OSPF requires periodic re-freshing of LSAs even when the topology has not changed. In addition,since SPF calculation is a CPU-intensive task, modern routers merely schedule an SPF calculation when they receive an LSA indicating a change.This gives the router a chance to receive more LSAs that may indicate changes in the topology and amortize the cost of an SPF calculation over a number of LSAs requiring such calcula-tion.We assume that SPF calculation is non-preemptable in the sense that the router completes the calculation be-fore doing any other OSPF processing.This makes sense since the router has already waited for a certain time period before undertaking the calculation.It makes little sense to delay its completion further by preempting it.Moreover, data collected for SPF calculation time(Section IV-C)val-idate the assumption.We have also verified these assump-tions with vendors.Once a router has done its SPF calculation,it has to install all the routes in its FIB,which introduces an ad-ditional delay.Accordingly,we estimate two parameters relevant to the routing calculation:the time taken by a router to perform an SPF calculation(in Fig-ure3),and the time)on a Linux PC running GateD version4.0.6,and compared the mea-surements with corresponding white-box measurements.TABLE IIS UMMARY OF FOUR PROCESSING DELAYS WE MEASURE. Processing task Start timeLSA FloodingTABLE IIIT ESTBED CONFIGURATION FOR FOUR PROCESSING DELAYSTaskPC1-target router on VLAN1PC1-target router on VLANS1and2PC1-target router on VLAN1PC1-target router on VLAN1and(Duplicate LSA processing time)RTTRTTHere RTT denotes the round trip propagation delay be-tween PC1and the target router(Figure4)andProbe LSA processing Duplicate LSA arrives (t2’)timeDuplicate LSA processing over (t3)Duplicate LSA sent (t1’)Probe LSAs sent (ts)Probe LSAs processing over (t2)Probe LSAs arrive (t1)lsa_proc= t Ack for theduplicate LSA arrives (tr)Fig.5.Sequence of events during the measurement of LSA processing delays on the target router.0.00020.00040.00060.00080.0010.00120.0014020406080100M e a n p r o c e s s i n g t i m e (s e c o n d s )Number of links (n) in the LSA Mean processing time for a new LSA (On Cisco GSR) with n linksmean95% confidence interval0.00020.00040.00060.00080.0010.00120.0014020406080100M e a n p r o c e s s i n g t i m e (s e c o n d s )Number of links (n) in the LSAMean processing time for a new LSA with n linksmean95% confidence interval(a)Cisco GSR(b)Cisco 7513Fig.6.Processing time for an LSA (.Due to space constraints,wepresent results showing only the first.To gauge the effect of number of links onvaries asincreases for the two Cisco target routers.timeProbe LSA processing done (t2)Probe LSA sent (ts)Probe LSA is flooded out (t3)Probe LSA arrives (t1)Probe LSA is received (tr)lsa_floodt Fig.8.Sequence of events in experiment designed to estimate the time the target router takes to flood out an LSA.00.010.020.030.040.0520406080100M e a n f l o o d t i m e (s e c o n d s )Number of links (n) in the LSA Mean flood time for a new LSA (on Cisco GSR) with n linksmean95% confidence interval0.010.020.030.040.05020*********M e a n f l o o d t i m e (s e c o n d s )Number of links (n) in the LSAMean flood time for a new LSA (on 7513) with n linksmean95% confidence interval(a)Cisco GSR(b)Cisco 7513Fig.9.Time taken by the target router for flooding an LSA (for every additional LSAper LS Update packet is smaller thanfor the same experiment varies with the size of the LS Up-date packet.Note that the processing time remains roughly the same for LS Update packets of a given size,irrespec-tive of the number of LSAs contained in the packet or the number of links described in the LSAs.An important im-plication is that for the router in question,the Cisco GSR,we can safely characterize the processing time of an LS Update packet simply as a function of the packet’s size,ignoring the number of LSAs contained in the packet.B.LSA Flood TimeWe next consider the time the target router takes to flood an LSA after receiving it.On Cisco routers,as we will see,the dominant effect is the pacing-timer mentioned earlier.Estimating the time needed to flood a newly received LSA to neighbors is relatively straightforward.We con-SPF calculation starts (t3)Duplicate LSA sent (t1’)TopTrackerTarget RouterDuplicate LSA arrives (t2’)Probe LSA processing done (t2)Probe LSA arrives (t1)Probe LSA sent (ts)time SPF calculation SPF calculation completes (t4)duplicate LSA arrives (tr)Ack for thespf= t ack sent (t6)Duplicate LSA processing done and Fig.10.Sequence of events in measuring the SPF calculation time on the target router.0.0050.010.0150.020.0250.030.035020406080100M e a n S P F c a l c u l a t i o n t i m e (s e c o n d s )Number of nodes (n) in the networkMean SPF calculation time (on GSR)mean95% confidence interval 0.00000247x^2 + .0009780.0050.010.0150.020.0250.030.035020406080100M e a n S P F c a l c u l a t i o n t i m e (s e c o n d s )Number of nodes (n) in the networkMean SPF calculation time (on 7513)mean95% confidence interval 0.00000247x^2 + .000978(a)Cisco GSR(b)Cisco 7513Fig.11.SPF calculation time ()for a fully connectednode topology,for varying .figure the testbed (Figure 4)with TopTracker having two adjacencies with the target router on two interfaces.Figure 8describes the setup and the sequence of events.TopTracker sends a probe LSA on one interface to the tar-get router,and receives the LSA flooded in response by the target router on the other interface.TopTracker logs the time at which it sends the probe LSA,and the time at which it receives the flooded copy.,we performed measurements using a single LSAcontaining links as the probe LSA.Figure 9shows thatcate LSA,we extract the SPF processing time.We configure the testbed with TopTracker having one adjacency with the target router on VLAN1.To begin the experiment,TopTracker sends to the target router a probe LSA indicating a change in the network topology.Upon receiving the probe LSA,the target router processes it and schedules an SPF calculation.Next,TopTracker sends a duplicate LSA in a separate LS Update packet to the tar-get router.TopTracker then receives an ack as soon as the target router isfinished processing the duplicate LSA. Since spf-delay and spf-holdtime are set to0,SPF com-putation starts as soon as the target router receives theprobe LSA.We would like to use the LS Ack for the du-plicate LSA to closely bracket thefinish time for the SPFcalculation.Specifically,we want the duplicate LSA to ar-rive to the target router while its route processor is engagedin the SPF calculation.We achieved this by introducing acertain delay(determined by sweeping this delay parame-ter)between the transmission of two LS Update packets.TopTracker logs the time at which it sends out the LS Update packet containing the probe LSA,and the timeat which it receives the ack for the duplicate LSA.FromFigure10,we then see thatWe can safely assume that is negligible.The quan-tity is equal to the RTT between Top-Tracker and the target router.Hence,RTTRTT(3)where RTTIn order to determine,we repeat the experi-ments with two changes:First,we set spf-delay to a very large value(nominally60seconds).Second,TopTracker sends the probe LSA and the duplicate LSA back-to-back in two separate LS Update packets.These choices ensure that the SPF calculation is removed from the interval be-tween the probe and the duplicate LSA processing tasks. TopTracker logs the time at which it sends out the probe LSA and the time at which it receives the ack for the du-plicate LSA.The difference between these two time values provides an estimate of.To investigate the effect of network size on SPF calcu-lation time,we collected values for fully connected emulated topologies with varying number of nodes.Fig-ure11presents the results.Note that the results for the0.0050.010.0150.02020*********MeanSPFcalculationtime(seconds)Number of nodes (n) in the networkMean SPF calculation time (on Gated (pc4))mean (black box)95% confidence interval (black box)mean (white box)95% confidence interval (white box)parison of black-box and white-box measurements for SPF calculation time()for GateD,with varying, the number of nodes in a fully connected topology.GSR and7513are essentially identical.Though these routers have vastly different forwarding capabilities,their route processors are similar,and SPF calculation is a CPU intensive task.A closer examination of the data also val-idates the assumption that the SPF calculation is non-preemptable.To help validate the above methodology,we repeated the same experiments with GateD and compared the re-sults with white-box measurements obtained by instru-menting GateD’s SPF calculation.Figure12shows that the black-box measurements closely track the white-box measurements.D.Forwarding Information Base(FIB)Update Time Next we consider the time needed for the target router to update its Forwarding Information Base(FIB)after it starts the SPF calculation.The idea behind the experiment is(i)to configure the testbed initially with a given address unreachable on the target router,(ii)to inject an LSA that makes reachable on the target router,and(iii)closely bracket the time that the target router takes to install in its FIB.To achieve step(iii),we ping on the target router at high rate.Until the FIB is updated,all pings are dropped. Thus,thefirst ping forwarded closely brackets the time the FIB update completes.We configure the testbed(Figure4)using PC2as the ping generator.PC2pings destination at a constant rate of one ping every0.01second(the maximal rate available on Linux).Since PC2does not run OSPF,we install a static route on PC2for destination with the target router as the next hop.Thus,PC2forwards all ping packets (ICMP request packets to be more specific)to the target router on VLAN1.At this point,the target router does notTarget RouterPC2TopTracker (PC1)ping dRoute to d installed in FIB (t4)SPF computation ends (t3)SPF computation starts (t2)Probe LSA arrives (t1)Probe LSA sent (ts)time fib_updatet target router (t5)Ping packet reaches reaches (tr)First ping packet Fig.13.Sequence of events in measuring the FIB update time on the target router.00.050.10.150.20.250.320406080100M e a n F I B u p d a t e t i m e (s e c o n d s )Number of nodes (n) in the networkMean FIB update time for a fully meshed network of n nodesmean95% confidence interval0.050.10.150.20.250.3020406080100M e a n F I B u p d a t e t i m e (s e c o n d s )Number of nodes (n) in the networkMean FIB update time for a fully meshed network of n nodesmean95% confidence interval(a)Cisco GSR(b)Cisco 7513Fig.14.FIB update time (As we did for SPF calculation delay,we can safely assume that is negligible.Similarly,RTT(PC2-router)RTT(PC2-router)has little dependence the size of the networkTABLE IVS UMMARY OF RESULTSTask DependenceLSA processing Depends on the size of the LS Update packet;Individual LSA in the packet contribute littleto the overall processing time of the packet30-40millisecondsSPF calculation Depends on the number of nodes in the network 100-300millisecondsother avenue of future research is developing black-box techniques for other routing protocols,such as BGP[10] and IS-IS[11].A CKNOWLEDGMENTWe are grateful to Mukul Goyal,K.K.Ramakrishnan and Raju Rajan for several helpful discussions during the course of the experiments,and to Jennifer Rexford,Timo-thy Griffin,Randy Bush and Nick Feamster for comments on the paper.We are also grateful to David Katz of Ju-niper Networks for answers to several questions related to commercial OSPF implementations,to Brian Colbry and Steven Gao for help with Cisco router configuration and testbed setup,and to Matthew Roughan for help with curve-fitting software.Finally,we would like to thank the anonymous reviewers for their comments and feedback.R EFERENCES[1]John Moy,“OSPF Version2,”Request for Comments2328,April1998.[2]J.T.Moy,OSPF:Anatomy of an Internet Routing Protocol,Addison-Wesley,January1998.[3]Anindya Basu and Jon G.Riecke,“Stability issues in ospf rout-ing,”in Proc.ACM SIGCOMM,August2001.[4] A.S.Maunder and G.Choudhury,“Explicit Marking and Pri-oritized Treatment of Specific IGP Packets for IGP Convergence and Improved Network Stability and Scalability,”Internet Draft draft-ietf-scalability-00.txt,work in progress,March2001. [5]“Toward milli-second IGP convergence,”Internet Draft draft-alaettinoglu-isis-convergence-00.txt,work in progress,November 2000.[6]J.H.Dunn and C.E.Martin,“Framework for Router Benchmark-ing,”Internet Draft draft-ietf-bmwg-rtr-framework-00.txt,work in progress,July2000.[7]“,”.[8]J.T.Moy,OSPF:Complete Implementation,Addison-Wesley,September2000.[9]Don Libes,Exploring Expect,O’Reilly&Associates,Inc.,De-cember1994.[10]Y.Rekhter and T.Li,“A Border Gateway Protocol4(BGP-4),”RFC1771,March1995.[11]R.Callon,“Use of OSI IS-IS for Routing in TCP/IP and DualEnviornments,”RFC1195,December1990.。
Security+认证模拟题800.Highly sensitive data is stored in a database and is accessed by an application on a DMZ server. The disk drives on all servers are fully encrypted. Communication between the application server andend-users is also encrypted. Network ACLs prevent any connections to the database server except from the application server. Which of the following can still result in exposure of the sensitive data in the database server?A. SQL InjectionB. Theft of the physical database serverC. CookiesD. Cross-site scripting800.高度敏感的数据存储在数据库中并被DMZ服务器上的应用程序访问。
所有服务器上的磁盘驱动器都已完全加密。
应用服务器和最终用户之间的通信也被加密。
网络访问控制列表防止除了应用服务器外的任何连接访问数据库服务器。
下列哪项仍然会导致数据库服务器中敏感数据暴露?A. SQL 注入B. 盗窃物理的数据库服务器C. CookiesD. 跨站脚本801.The fundamental information security principals include confidentiality, availability and which of the following?A. The ability to secure data against unauthorized disclosure to external sourcesB. The capacity of a system to resist unauthorized changes to stored informationC. The confidence with which a system can attest to the identity of a userD. The characteristic of a system to provide uninterrupted service to authorized users801. 基本信息安全原则包括保密性、可用性和下列哪项A.确保数据不会未经授权的泄露到外部的能力B.系统抵御未经授权的变更存储的信息的能力C.系统可以证明用户身份的能力D.为授权用户提供不间断服务的能力802.Which of the following is the MOST likely cause of users being unable to verify a single user's email signature and that user being unable to decrypt sent messages?A. Unmatched key pairsB. Corrupt key escrowC. Weak public keyD. Weak private key802. 下列哪项是用户无法验证单个用户的电子邮件签名和用户无法解密发送的消息的最可能原因?A. 不匹配的密钥对B. 损坏密钥托管C. 弱的公钥D. 弱的私钥803.Full disk encryption is MOST effective against which of the following threats?A. Denial of service by data destructionB. Eavesdropping emanationsC. Malicious codeD. Theft of hardware803.全盘加密是最有效的对付以下哪项威胁的手段?A. 数据破坏导致不能提供服务B. 电磁侦听C. 恶意代码D. 盗窃硬件804.Which of the following may cause Jane, the security administrator, to seek an ACL work around?A. Zero day exploitB. Dumpster divingC. Virus outbreakD. Tailgating804.以下哪个原因可能导致安全管理员Jane使用ACL进行解决A. 零日漏洞B. 垃圾搜寻C. 病毒爆发D. 尾随805.In order to use a two-way trust model the security administrator MUST implement which of the following?A. DACB. PKIC. HTTPSD. TPM805. 为了使用双向信任模型安全管理员必须实施以下哪项?A. DACB. PKIC. HTTPSD. TPM806.Which of the following would a security administrator use to verify the integrity of a file?A. Time stampB. MAC timesC. File descriptorD. Hash806. 安全管理员使用下列哪项来验证文件的完整性A. 时间戳B. MAC timesC. 文件描述符D. 哈希807.Which of the following is a best practice when securing a switch from physical access?A. Disable unnecessary accountsB. Print baseline configurationC. Enable access listsD. Disable unused ports807.下列哪项是确保交换机物理访问安全的最好做法?A. 关闭不必要的账户B. 打印基线配置C. 开启访问列表D. 关闭不使用的端口808.A security administrator needs to image a large hard drive for forensic analysis. Which of the following will allow for faster imaging to a second hard drive?A. cp /dev/sda /dev/sdb bs=8kB. tail -f /dev/sda > /dev/sdb bs=8kC. dd in=/dev/sda out=/dev/sdb bs=4kD. locate /dev/sda /dev/sdb bs=4k808.为进行取证分析安全管理员需要镜像一个大容量硬盘。
C.Livadas and I.Keidar,“The Case for Exploiting Packet Loss Locality inMulticast Loss Recovery,”Technical Report MIT/LCS/TR-867,Lab.forComputer Science,MIT,Cambridge,MA,Oct.2002.The Case for Exploiting Packet Loss Localityin Multicast Loss RecoveryCarolos Livadas Laboratory for Computer Science,MIT clivadas@Idit KeidarDept.of Electrical Engineering,Technion idish@ee.technion.ac.ilOctober30,2002AbstractThis paper makes the case for exploiting packet loss lo-cality in the loss recovery of reliable multicast protocols, such as SRM[4].We claim that packet loss locality in IP multicast transmissions can be exploited by simple caching schemes.In such schemes,receivers cache infor-mation about the recovery of recently recovered packets and use this information to expedite the recovery of sub-sequent losses.We present a methodology for estimating the potential effectiveness of caching within multicast loss recovery.We use this methodology on the IP multicast transmission traces of Yajnik et al.[14].We observe that IP multicast losses exhibit substantial locality and that caching can be very effective.1IntroductionRecently,numerous retransmission-based reliable multi-cast protocols have been proposed[4,6–8,11,12].The chal-lenge in designing such protocols lies in the requirements to scale to large multicast groups,to cater to a dynamic membership and network,and to minimize the recovery overhead.Most retransmission-based reliable multicast protocols treat losses independently and blindly repeat the recovery process for each loss.Such protocols can potentially reduce recovery latency and overhead by em-ploying simple caching schemes that exploit packet loss locality.Locality is the property that losses suffered by a receiver at proximate times often occur on the same link of the IP multicast tree.We propose the extension of re-liable multicast protocols with caching schemes in which receivers cache information about the recovery of recently recovered packets and use this information to expedite the recovery of subsequent losses.We present a methodology for estimating the degree to which IP multicast losses exhibit locality and quantify-ing the potential effectiveness of caching in multicast loss recovery.Our methodology involves evaluating the perfor-mance of a caching-based loss location prediction scheme. In this scheme,each receiver caches the locations of its most recent losses whose locations it has identified and predicts that its next loss occurs at the location that ap-pears most frequently in its cache.We consider a predic-tion to be a hit if it matches the location of the loss.The hit rate achieved by each receiver is an indication of the degree to which the losses suffered by each receiver exhibit locality.A shared hit corresponds to the case when the predictions of all receivers sharing a loss are hits;that is, all such receivers predict the same loss location and this loss location is correct.The shared hit rate can indicate the potential effectiveness of a caching scheme that relies on the collaboration and coordination of all receivers that share each loss.We apply our evaluation methodology to the IP multicast transmission traces of Yajnik et al.[14].In particular,we observe the hit rates achieved by our loss location pre-diction scheme as a function of:the cache size,the delay in detecting losses,the delay in identifying a loss’s loca-tion,and the precision of the loss location identification. As the delays in detecting losses and in identifying their locations increase,caches become populated by the loca-tions of less recent losses and predictions are made based on less recent information.Knowledge of the IP multicast tree topology may improve the precision with which the locations of losses are identified.Our analysis reveals that the losses in the traces of Ya-jnik et al.exhibit substantial locality.The per-receiver hit rates achieved by our loss location prediction scheme in most cases exceed40%and often exceed80%.The shared hit rates range from10%to80%when the loss location identification is topology-oblivious and from25%to90% when it is topology-aware.The shared hit rates for a cache of size10exceed35%(70%)for half the traces when the loss location identification is topology-oblivious(respec-tively,topology-aware).These observations suggest thatexploiting packet loss locality through caching within ei-ther existing or novel reliable multicast protocols has the potential of substantially reducing recovery latency and overhead.Although the IP multicast transmission traces used in this paper are of modest duration and group size[14], we expect packet loss locality to also be prevalent in both longer-lived and larger group size IP multicast transmis-sions.Recent studies of IP multicast transmission losses[1,5,14, 15]have investigated whether losses in the multicast set-ting exhibit temporal and spatial correlation.Temporal correlation refers to the degree to which losses are bursty and spatial correlation refers to degree to which losses are pairwise shared between receivers.All such studies ob-serve that although packet losses are clearly not indepen-dent,they exhibit low temporal and spatial correlation. Our observations do not contradict these results.Loosely speaking,these studies examine whether the loss of con-secutive(or,close-by)packets is correlated whereas we examine whether the location of consecutive(or,close-by)losses is correlated.Notably,packet loss locality can be exploited in multicast loss recovery.This paper is organized as follows.Section2illustrates how caching can be incorporated within SRM in order to exploit locality.In Section3,we present the IP mul-ticast transmission trace data that we use in this paper and describe how we interpret and represent it.Section4 presents our analysis of locality and the effectiveness of caching in multicast loss recovery.Section5concludes the paper and suggests future work directions.2Exploiting Locality Through CachingIn this section,we illustrate how caching can be used to exploit packet loss locality within the Scalable Reliable Multicast(SRM)protocol[4].Packet recovery in SRM is initiated when a receiver de-tects a loss and schedules a retransmission request to be multicast in the near future.If the packet is received prior to the transmission of the scheduled request,then the scheduled request is canceled.If a request for the packet is received prior to the transmission of the sched-uled request,then the scheduled request is postponed (suppressed and rescheduled).Upon receiving a request for a packet that has been received,a receiver schedules a retransmission of the requested packet(reply).If a reply for the same packet is received prior to the transmission of the scheduled reply,then the scheduled reply is can-celed(suppressed).All requests and replies are multicast. SRM minimizes duplicate requests and replies using sup-pression.Unfortunately,suppression techniques delay the transmission of requests and replies so that only few(and, optimally,single)requests and replies are transmitted for each loss.We suggest enhancing SRM with a caching-based ex-pedited recovery scheme[9,10].This scheme operates roughly as follows.Each receiver caches the requestor and replier of the most recently recovered packet.A receiver considers itself to be optimal when its cached requestor is itself.Upon detecting losses,in addition to scheduling requests as is done in SRM,optimal receivers immediately unicast requests to their cached repliers.Upon receiving such a request,a receiver immediately multicasts a reply for the requested packet.A cache hit corresponds to the case when the unicast request is sent to a receiver that is capable of retransmitting the packet.Since unicast re-quests and the resulting retransmissions are not delayed for purposes of suppression,the recovery resulting from a hit incurs minimum latency.Moreover,it suppresses any requests and replies scheduled by SRM’s recovery scheme. In the case of a miss,the recovery of a packet is carried out as prescribed by SRM’s recovery scheme.The overhead associated with a miss is a single unicast request.The above simple caching-based expedited recovery scheme associates loss locations with the requestor-replier pairs that recover the respective packets.This scheme may turn out to be too crude,in the sense that many requestor-replier pairs get associated with particular loss locations.To obtain more precise loss location identi-fication,we propose employing a router-assisted scheme where routers annotate packets so that turning point routers[7,11]are exposed.Turning points identify the subtrees of the IP multicast tree that are affected by each loss;thus,they identify loss locations precisely.This in-formation can be used to associate sets of requestor-replier pairs to particular locations;thus,improving the effective-ness of caching.SRM is highly resilient to group membership and network topology changes.Unfortunately,such resilience comes at the expense of performance.In static environments,other protocols[3,6,7,11,12]may outperform SRM by either a priori choosing designated repliers,arranging receivers in hierarchies,or extending the functionality of IP multi-cast routers so as to intelligently forward recovery packets. Our proposed caching-based expedited recovery scheme can substantially improve SRM’s performance when the group membership and the network topology are static. Moreover,it may partially bridge the performance gap between SRM and hierarchical or router-assisted schemes,while still retaining SRM’s resilience to dynamic environ-ments.Of course,many variations on the above caching scheme may be considered:caching several of the most recent requestor-replier pairs and choosing to recover from the most frequent such pair,multicasting the expedited re-quest,etc.Moreover,similar caching schemes may benefit either other existing or novel reliable multicast protocols in similar ways.3IP Multicast Traces and Their Rep-resentationWe represent IP multicast traces by per-receiver time se-ries whose elements indicate the locations at which the losses suffered in the trace occur.We consider two such representations.Thefirst representation is oblivious to the IP multicast tree topology and associates the location of each loss with the loss’s loss pattern,i.e.,the set of receivers that share the loss.The second representation takes into consideration the IP multicast tree topology and estimates the link(s)that are responsible for each loss.We begin this section by describing the IP multicast trace data that we use throughout the paper.We then describe how we interpret the trace data and produce our two trace representations.3.1Trace DataWe use14IP multicast transmission traces of Ya-jnik et al.[14].These traces involve IP multicast trans-missions each originating in the World Radio Network (WRN),the UC Berkeley Multimedia Seminar(UCB),or the Radio Free Vat(RFV).In these IP multicast trans-missions,packets are transmitted at a constant rate.Each IP multicast transmission is received by a subset of17 research community hosts spread out throughout the US and Europe.Each IP multicast transmission trace is com-prised of per-receiver sequences indicating which packets were received and the order in which they were received. The traces do not include the packet reception times.Ta-ble1lists the source,date,number of receivers,IP mul-ticast tree depth,packet transmission period,number of packets transmitted,and transmission duration for each of the14traces.Yajnik et al.also provide the IP multi-cast tree topology for each trace.For more information regarding the traces,see[14].Yajnik et al.[14],as do the other multicast loss studies[1, 5,15],represent IP multicast traces by per-receiver bi-Table1IP Multicast Traces of Yajnik et al.[14].Source#of Tree Period#of Duration&Date Rcvrs Depth(msec)Pkts(hr:min:sec) 1RFV96041912680450011:00:002RFV960508105401489701:39:193UCB96042415740937341:02:294WRN9509198480176370:23:315WRN95103010480570301:16:026WRN9511019580417510:55:407WRN95111312580464431:01:558WRN95111410480385390:51:239WRN9511289480449560:59:5610WRN95120411580454041:00:3211WRN95121111480725191:36:4212WRN9512147480387240:51:3813WRN9512168380502021:06:5614WRN9512188380699941:33:20 nary time series each of whose elements indicates whether the respective packet was lost by the respective receiver. For instance,element i of the binary time series for re-ceiver j is equal to1if the receiver j did not receive the i-th packet of the IP multicast transmission.The loss pat-tern observed for packet i is the binary sequence whose j-th element is1if receiver j did not receive packet i.3.2Virtual Link Trace RepresentationOurfirst representation is oblivious to the IP multicast tree.We associate the location of each loss with the loss’s loss pattern,i.e.,the set of receivers that share the loss. Although many of the observed loss patterns result from losses on multiple links of the IP multicast tree,we at-tribute each distinct loss pattern to a loss on a single vir-tual link.For example,a virtual link could represent the fact that receivers2,5,8,and12did not receive a given packet.By assigning a unique identifier to each distinct loss pat-tern,or virtual link,observed in the trace,we represent each trace by per-receiver time series whose elements are the identifiers of the virtual links responsible for the losses suffered by each receiver.We use the identifier0to denote that the particular packet was successfully received.For the virtual link representation,a loss location predic-tion is a hit only if the receiver can predict the exact set of receivers that share the loss.However,in order to benefit from caching,a receiver need not predict this exact set. For instance,consider the lossy IP multicast transmission example shown in Figure1where a packet is lost on two links,leading to two independent subtrees of the IP mul-ticast tree.Receivers3and4can recover the packet from receiver1and receivers5and6can recover the packet from receiver2.Receivers in one subtree are not affectedFigure1Example of a Lossy IP Multicast Transmission.by the fact that a loss also occurs on the other subtree. Were receivers3and4to predict that the loss is shared by receivers3and4only,they would be able to recover the packet from receiver1.However,in the virtual link repre-sentation,this scenario is considered a cache miss.Thus, the performance analysis of our loss location prediction scheme using the virtual link representation may under-estimate the expected effectiveness of caching in multicast loss recovery.In order to remedy this,in the next section we present a more precise representation which estimates the actual links on which losses occur.3.3Concrete Link Trace RepresentationOur second representation involves per-receiver time se-ries whose elements compute estimates of the actual links of the IP multicast tree responsible for the losses suffered by each receiver.We estimate the actual links responsible for each loss based on the IP multicast tree topology and the observed loss pattern in the trace for the respective packet.Each loss pattern observed in a trace may be the result of losses on either a single or a combination of ac-tual links.Moreover,it may result from losses on several such combinations.For example,the loss pattern involv-ing all receivers may result from either a single loss on the link leaving the source,or losses on each of the links leading to the receivers.We select a particular combina-tion of links to represent each instance of a loss pattern based on the probability that a packet is dropped on ex-actly the links comprising each combination.We estimate this probability byfirst estimating the probability that a packet is dropped on each link of the IP multicast tree, i.e.,the link loss rates.Let L be the set of links comprising the IP multicast tree of a given trace and l nn ∈L be the link that connects the nodes n and n ,where n is the parent of n .We define p(l nn )to be the probability that a packet is dropped along l nn given that the packet is received by n.The probabil-ities p(l nn ),for l nn ∈L,can be estimated either by the method of Yajnik et al.[14]or the maximum-likelihood estimator method of C´a ceres et al.[2].For the tracesused in this paper,both methods yield very similar linkloss probability estimates.In this paper,we use the linkloss probability estimates obtained using the method ofYajnik et al.Given the IP multicast tree,it is straightforward to deducethe set of link combinations that result in any loss patternobserved in the trace.We assume that the probability of apacket being dropped on a link is independent of it beingdropped on any other link.We compute the probability ofoccurrence of a particular link combination as the productof the probabilities of a packet being dropped on the linkscomprising the combination and successfully forwarded onthe links leading to those comprising the combination. More precisely,consider an observed loss pattern x.LetC x be the set of all possible link combinations resultingin x,L c be the set of links that comprise a combinationc∈C x,and U c be the set of links that are neither in L cnor downstream of any of the links in L c.Presuming thatthe probabilities of loss along the links of the IP multicasttree are independent,the probability of occurrence of thelink combination c is estimated by p(c)= l∈L c p(l)· l ∈U c(1−p(l )).Thus,the relative probability that the observed loss pattern x results from the link combinationc as opposed to the other combinations in C x is given byp Cx(c)=p(c)/ c ∈C x p(c ).We select a particular link loss combination to representan instance of the loss pattern x in the trace based on therelative probabilities of occurrence of all link loss combi-nations resulting in x.For13out of14of the traces weconsider,more than90%of the link combinations selectedto represent the losses have relative probabilities of occur-rence that exceed95%and are often very close to100%.For the remaining trace,85%of the link combinations se-lected to represent the losses have relative probabilities ofoccurrence that exceed98%.Thus,our estimates of thelinks responsible for the losses observed in each trace arepredominantly accurate.By assigning a unique identifier to each link of the IPmulticast tree of each trace,we represent each trace byper-receiver time series whose elements are the identifiersof the links responsible for the losses suffered by each re-ceiver.We use the identifier0to denote that the partic-ular packet was successfully received.While the performance analysis of our loss location pre-diction scheme using the virtual link trace representationmay under-estimate the expected effectiveness of caching,the analysis using the concrete link trace representationmay over-estimate it.Firstly,receivers may not always beable to deduce the exact locations at which losses occur.In SRM,for instance,receivers may identify a loss loca-tion by the requestor-replier pair that recovers the loss, i.e.,thefirst receiver to request a retransmission and the first receiver to retransmit the packet.However,some-times different requestor-replier pairs can emerge for dif-ferent losses on the same link and sometimes the emerging requestor or replier is not optimal.Secondly,even an ac-curate identification of the link responsible for a loss at each receiver does not always yield optimal recovery.Con-sider the case where two receivers,1and2,lose a given packet on separate links and there are two repliers,3and 4,that are equidistant from1and2and are both poten-tial optimal repliers for both.Even when receivers1and2 can accurately identify the links on which the packet was dropped,receiver1may request the packet from3,and 2may request it from4,leading to two retransmissions. Although for the concrete link trace representation such predictions are considered hits,they do not lead to the desired recovery behavior involving a single request and a single reply.In contrast,in the case of the virtual link representation,such predictions are considered misses.4Evaluating the Effectiveness of CachingIn this section,we demonstrate that the IP multicast transmission traces of Yajnik et al.[14]exhibit substantial locality and that caching can be very effective.In partic-ular,we analyze the performance of a caching-based loss location prediction scheme.In this scheme,each receiver caches the locations of its most recent losses whose loca-tions it has identified and predicts that its next loss occurs at the location that appears most frequently in its cache. We refer to correct and incorrect per-receiver loss location predictions as hits and misses,respectively.In the subsequent sections,we present and compare the hit rates achieved by our loss location prediction scheme for several cache sizes.A cache of size1predicts that the location of the next loss is that of the most recent loss whose location has been identified.An infinite cache records the location of all prior losses whose locations have been identified.Predictions made based on an infinite cache correspond to the most frequent loss location iden-tified by the receiver up to that point in the trace.We analyze the performance of our loss location predic-tion scheme using both virtual and concrete link trace representations.As noted above,the virtual link repre-sentation may under-estimate the expected effectiveness of caching in multicast loss recovery,while the concrete link representation may over-estimate it.In Section4.1,we assume that both the detection of losses and the identification of their location are immediate.In Section4.2,we assume that losses are detected upon the receipt of later packets and their locations are identified immediately.In Section4.3,we evaluate the performance of our loss location prediction scheme as the delay in iden-tifying loss locations increases.In Section4.4,we ob-serve the degree to which all receivers that share a loss make the same predictions,under the assumption that loss detection is delayed and loss location identification is immediate.Prediction consistency would be required in cases when the loss recovery process requires the coordi-nation of all receivers that share each loss.In Sections4.1 through4.3,we consider caches of size1,10,and infinity. In Section4.5,we analyze the effect of the cache size on the shared hit rates.In order to estimate the times at which receivers detect losses and identify their locations,we need to know the packet reception times.Since the trace data contains no timing information,we assume that all packets received by each receiver incur the same transmission latency;that is,we assume that packets are received at a constant rate.4.1Immediate Detection/Immediate Identi-ficationWe present the hit rates achieved by our caching-based loss location prediction scheme,under the assumption that the detection of losses and the identification of their location are both immediate.That is,we assume that the loss location prediction scheme is aware of the location of all losses that precede the loss whose location is being predicted.Figure2presents the per-receiver hit rates for the virtual link trace representation for6out of the14traces.The per-receiver hit rates for the rest of the traces are similar. Each of the graphs in Figure2plots the percentage of predictions that are correct,i.e.,the hit rate,for each of the receivers in the given trace.We observe that the cache of size10outperforms the cache of size1in most cases.As observed by the multicast loss studies of[1,5,14,15],IP multicast transmissions involve a few highly lossy links that generate a large percentage of the losses and a large number of slightly lossy links. With a larger cache,it is more likely that each prediction corresponds to a highly lossy link.We also observe that caches of size1and10often outper-form the infinite cache size.In fact,the infinite cache size performs as well as the others only for receivers whose losses are predominantly due to single locations.Con-sider,for instance,the hit rates achieved by receivers2 and3of trace WRN951128.The caches of size1andFigure 2Virtual Link Trace Representation —Immedi-gle location.In this case,the infinite cache size predictsthat all losses occur at the highly lossy location and thusperforms similarly to the smaller cache sizes.Figure 4presents the per-receiver hit rates for the concrete link trace representation for the same 6traces.Again,the per-receiver hit rates for the rest of the traces are simi-lar.The per-receiver hit rates for the concrete link trace representation are substantially higher than those for the virtual link trace representation.This is not surprising given the fact that in the case of the concrete link repre-sentation each receiver witnesses a small number of dis-Figure 3Virtual Link Trace Representation —Per-tinct losses —equal to the path length from the source toeach receiver.Moreover,in the case of the concrete linktrace representation,loss patterns resulting from simulta-neous losses on highly lossy links are not misinterpreted as losses occurring at distinct locations;rather,each receiver attributes each loss to one of the IP multicast tree links that are on the path from the source to the particular receiver.Figure 5Virtual Link Trace Representation —Delayed4.2Delayed Detection/Immediate Identifica-tionThe packet loss locality exhibited in the previous section may not be exploitable,since losses may not be immedi-ately detectable.Many reliable multicast protocols detect losses upon the receipt of later packets.Thus,in the case of loss bursts,losses are detected all at once upon the re-ceipt of a packet following the loss burst.In this section,we observe the effect of delayed loss detection.In par-ticular,we assume that:i)losses are detected upon the receipt of a later packet (delayed detection),and ii)the loss location prediction scheme is aware of the location of all losses that are detected earlier than the detection time of the loss whose location is being predicted (immediate loss location identification).Figure 5presents the per-receiver hit rates of our loss location prediction scheme for the virtual link trace rep-resentation of 6out of the 14traces.By comparing the hit rates presented in Figures 2and 5,we observe that the delay in detecting losses heavily affects the hit rates of some traces;the trace RFV960508is the most heavily affected trace and achieves the lowest hit rates of all 14Figure 6Loss Distribution wrt Burst Length,Receivers in log scale.Receiver 3suffers predominantly isolated losses.Conversely,receiver 4suffers a couple of long loss bursts.The adverse effect of these loss bursts on the hit rate of receiver 4is evident when one compares receiver 4’s hit rates in Figures 2and 5;the hit rates of receiver 3are barely affected by the delayed detection,while those of receiver 4are nearly cut in half.The adverse effect of the delay in detecting losses suggests that it would be beneficial to design schemes for detecting losses sooner.SRM’s exchange of session messages is one such scheme.Session messages are used by receivers to pe-riodically advertise the per-source transmission progress they have observed.Thus,receivers may discover losses by detecting discrepancies in the observed transmission progress of the receivers.When packets are transmitted at a fixed frequency,as is done in audio and video trans-missions,an alternative approach may be to track the inter-packet delays and to declare a packet missing when its arrival with respect to its predecessor has exceeded some jitter threshold.In order for such schemes to allow the early detection and recovery of packets,session and re-covery packets must avoid the congested links responsible for the loss burst,e.g.,using a source-based IP multicast tree implementation [13].。