图表作文范文 15 1 23 插图
- 格式:docx
- 大小:487.04 KB
- 文档页数:4
图表作文特点:图表作文就是根据图表传递的信息和提供的资料来进行写作。
图表作文有用线条表示的图形,统计图表,曲线坐标图和圆形分析图,条形分析图等。
这些图表都可以用来提供一组或几组数据,反映某种变化或某种趋势。
写作步骤:1、描述图表,得出变化或趋势2、分析变化或趋势产生的原因3、得出结论或提出自己的看法模板:It is obvious in the graphic/table that the rate/ number/ amount Y has undergone dramatic changes. It has gone up/ grown/ fallen/ dropped considerably in recent years(as X varies). At the point of X1, Y reaches its peak value of ….(具体数字)What is the reason for this change? Mainly there are … reasons behind the situation reflected in the graphic/table. First of all, …. More importantly, …. Most important of all, ….From the above discussions, we have enough reason to predict what will happen in the near future. The trend described in the graphic/table will continue for quite a long time (if necessary measures are not taken 括号里的部分用于那些不太好的变化或趋势)Exercises:How People Spent Their HolidayYear 1990 1995 2000Travelling 37% 51% 76%Staying at Home 63% 49% 24%1.上图所示1990年、1995年、2000年某城市人们的度假方式的情况,请描述其变化。
高考英语作文高三英语复习时要覆盖各类作文题材,以便在考场上看到任何类型的题目都能轻松搞定。
以下为大家整理了图表分析类作文题目及范文,供同学们参阅。
图表作文是高中英语作文中较常见的类型,要求学生通过图中数据和提示内容写一短文,属于比较、对照类。
也可根据提示写为议论文。
通常我们采取三段式写法:第一段:描述图表,得出结论。
第二段:紧扣主题,根据图表比较分析原因,论证结论。
第三段:发表议论,提出自己的看法。
常用句式:1. As can be seen from the chart,...As is shown in the chart,...2. The chart shows that about 60 percent of students want to go to college...3. From the graph/data/results/information above,it can be seen/concluded/show/estimated...4.The graph shows the changes in the number of...over the period from...to...pared with...,the number of the students of...高中英语作文图表作文万能模板:As is shown by the figure/percentage in the table /picture,____ has been on rise/ decrease,significantly/dramatically rising/decreasing from ____ in _____ to _____ in _____. From the sharp rise/decline in the chart,it goes without saying that _____.There are at least two good reasons accounting for _____. In one hand,____.In the other hand,_____ is due to the fact that ______.In addition,______ is responsible for _____. Maybe there are some other reasons to show ______.But it is generally believed that the above mentioned reasons are commonly convincing.As far as I am concerned,I hold the point of view that _______. I am sure my opinion is both sound and well-grounded.DIY:高考英语图表分析类作文题目1最近,你参加了高三年级组织的“你最重视哪科作业”的调查,结果见下面的饼状图。
高考备考写作专题:图表分析作文第一篇:全球二氧化碳排放量变化趋势随着工业化和现代化的发展,全球二氧化碳排放量不断增加,给地球的生态环境带来了巨大挑战。
下面是一幅描述全球二氧化碳排放量变化趋势的图表。
从图表中可以看出,自20世纪50年代开始,全球二氧化碳排放量呈现出逐年增加的趋势。
在20世纪70年代到80年代之间,排放量增速开始明显加快,到了90年代更是达到了高峰。
然而,在近几年,尽管二氧化碳排放量仍然在增加,但增速明显放缓。
造成全球二氧化碳排放量增加的原因有很多,但主要是工业生产、能源消耗和交通运输等活动所引起的。
这些活动大量使用化石燃料,例如煤炭、石油和天然气,导致了大量的二氧化碳释放到大气中。
全球二氧化碳排放量的增加给地球的生态环境带来了诸多问题。
首先,大量的二氧化碳排放导致大气中温室气体浓度升高,进而造成气候变化,例如全球气温上升、极端天气事件增多等。
其次,二氧化碳还会导致海洋酸化,对海洋生物造成威胁。
此外,由于空气污染加剧,人们的健康也受到了威胁。
为了应对全球二氧化碳排放量增加的问题,各国政府和国际组织已经采取了一系列的措施,例如限制工业排放、推广清洁能源和绿色交通等。
但要真正解决二氧化碳排放问题,还需要全球各方共同努力,包括改变生活方式、提高环保意识等。
第二篇:中国城市人口增长随着城市化进程的不断推进,中国城市人口呈现出快速增长的趋势。
下面是一幅描述中国城市人口增长的图表。
从图表中可以看出,1990年以前,中国城市人口增长较为缓慢,但之后迅速加快。
尤其是在2000年以后,城市人口增长速度急剧提升。
目前,中国的城市化率已经超过了50%。
城市人口增长的原因有很多,主要是农村人口向城市转移和城市自然增长导致的。
一方面,农村居民为了追求更好的生活条件和就业机会,纷纷涌向城市。
另一方面,由于医疗水平的提高和生活条件的改善,城市人口的自然增长也较快。
城市人口增长给中国带来了很多挑战。
首先,城市人口的快速增加导致了城市基础设施和公共服务压力的加大。

图画,图表和话题写作万能模板万能模板⼀:图画或图表作⽂模板⼤作⽂From the drawing/chart, we can learn that (描述图表内容). It can easily be seen that (容易的就可以看出)quite a lot of people think it is important for them (做某事很重要,当然这个important还可以换成1:必要的necessary、2:critical关键的、3:meaningful有意义的)to understand this situation. We can deduce that people’s opinions on this issue vary from person to person(我们可以推断出来⼈们对此观点是因⼈⽽异的).Some people take it for granted that (认为…理所当然的)it’s not their duty to show their concern to it and there’s one in million chan ces for them to have such an experience(⼤部分认为⾃⼰亲⾝遇到这个问题的机遇⽐较⼩并且也没必义务去关注此问题). For example, they firmly believe that they should not know how to confront and deal with it. (他们坚定地认为⾃⼰没必要知道该如何⾯对和解决这个问题)But they often neglect that fact that once everyone just has such an attitude towards this, something practical need to be changed will make it progress slowly(但是他们通常忽视这个事实,⼀旦⼤家都采取⽆为态度的话,事情本⾝就会慢慢发展到需要做出相应改变的状态). On the contrary(相反地), there are also another group of people who hold a different point of view. (相反,还有另外⼀群⼈有不同的观点)They think that they should take their shoulder on this matter and tell people what to do and how to do step by step. (他们认为他们应当对这件事情肩负起责任,并且告诉他⼈做什么,⼀步⼀步⼜该怎么做)At the same time, their duty should be strengthened to make it into the unconscious aware. (同时,⼈们应该慢慢培养起对这件事的责任感,并且成为⼀种共识)As far as I am concerned(我认为In my opinion,或改成总之:In a word / to sum up/All in all), my attitude for this matter is positive(根据图表是⽀持还是反对还可以换成消极:negative), with reasons as follows. (我对这件事情持有积极态度)As the problem has a far effect/influence on(造成影响)both society and our life, we should pay more attention to it.学⽣范⽂1:学⽣范⽂学⽣范⽂(图表写作)这篇范⽂中的话题是responsibility,责任感。
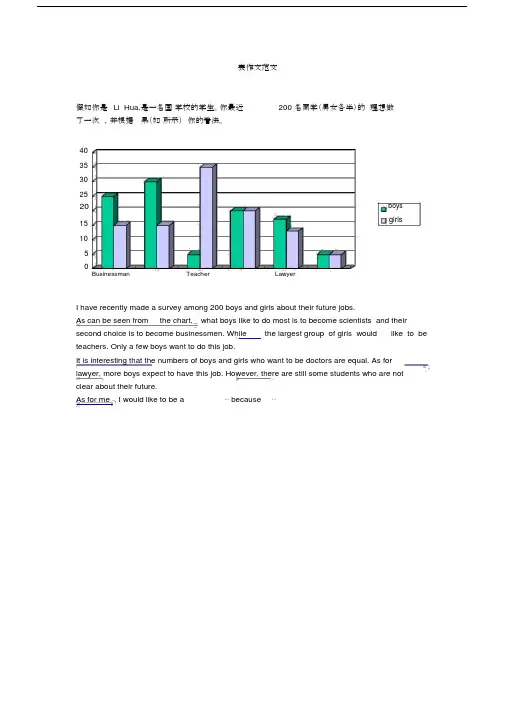
表作文范文假如你是Li Hua,是一名国学校的学生。
你最近200 名同学(男女各半)的理想做了一次,并根据果(如所示)你的看法。
4035302520boysgirls15105Businessman Teacher LawyerI have recently made a survey among 200 boys and girls about their future jobs.As can be seen from the chart, what boys like to do most is to become scientists and their second choice is to become businessmen. While the largest group of girls would like to be teachers. Only a few boys want to do this job.It is interesting that the numbers of boys and girls who want to be doctors are equal. As for lawyer, more boys expect to have this job. However, there are still some students who are notclear about their future.As for me , I would like to be a⋯because⋯7崇文一模某英文报纸正在开展题为“中学生课堂注意力”的专栏讨论,你校准备参加,并请你代表学校写一篇文章给该英文报纸投稿。
下面的图表为你校的调查结果,请你根据所提供的信息做简要说明,并根据提示给出改善的建议。
注意:图中数据为学生人数百分比。
中学生课堂注意力集中的情况中学生课堂注意力不能集中的原因40%30%70%60%能够集中注意力不能集中注意力课堂干扰睡眠不足与疲劳改善注意力的建议:教室课堂课间通风、明亮积极参与课堂活动适量活动或适当休息注意: 1.词数:不少于60。

英语作文图表作文(五篇范文)第一篇:英语作文图表作文图表分析作文1As is clearly shown in the table/ figure/ graph / chart, 图表总体描述 between 年代 and 年代.Especially, 突出的数据变化.There are three reasons for 具体表示急剧上升、下降或特殊现象的词.To begin with, 原因一.In addition / Moreover, 原因二.For example, 具体例证.Last but no least, 原因三.In short,总结上文.As far as I am concerned, / For my part, / As for me,作者自己的观点.On the one hand, 理由一.On the other hand, 理由二.In brief,总结上文.图表分析作文2The table / figure / graph / chart shows that 图表总述from 年代to年代.It is self-evident that突出的数据变化.Three possible reasons contribute to 具体表示急剧上升、下降或特殊现象的词或代词代替上文内容.One reason is that原因一.Another reason is that 原因二.For instance,举例证.What’s more原因三.As a result, 重述上文之趋势.However, in my opinion 作者观点.For one thing,理由一.For another, 理由二.T o sum up,总结上文.图表分析作文3It can be seen from the table / figure / graph / chart that图表总述between年代and年代.Especially,突出的数据变化.Why are there such great changes during 图表涉及的年头数years? There are mainly two reasons explaining具体表示急剧上升、下降或特殊现象的词或代词代替上文内容.First,原因一.In the old days,比较法说明过去的情况.But now,说明现在的情况.Second,原因二.As a result,总结上文.In my viewpoint,作者自己的观点.On the one hand,论点一.On the other hand,论点二.图表分析作文4As the table / figure / graph / chart shows,图表总述in the past years年代.Obviously,突出的数据变化.Why are there suchsharp contrasts during 图表涉及的年头 years?Two main factors contribute to具体表示急剧上升、下降或特殊现象的词或代词代替上文内容.First of all,原因一.In the past,比较法说明过去的情况.But now 说明现在的情况.Moreover,原因二.Therefore,总结上文.As I see it,作者自己的观点.For one thing,论点一.For another,论点二.图表作文补充句型• As is shown in the graph…如图所示…•The graph shows that…图表显示…•As can be seen from the table,…从表格中可以看出…•From the chart, we know that…从这张表中,我们可知…• All these data clearly prove the fact that… 所有这些数据明显证明这一事实,即…• The increase of ….In the ci ty has reached to 20%.….在这个城市的增长已达到20%.• In 1985, the number remained the same.1985年,这个数字保持不变.• There was a gradual decline in 1989.1989年,出现了逐渐下降的情况.第二篇:英语图表作文图表描述专题训练(一)这类作文时,注意以下几点:第一,审题时,除了要把握好图表的表层信息外,还要分析图标的深层含义,如原因、根源、可能的发展趋势等。
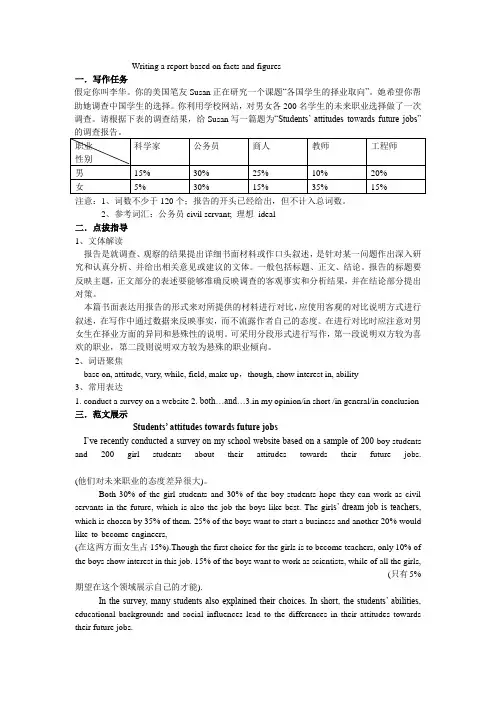
Writing a report based on facts and figures一.写作任务假定你叫李华。
你的美国笔友Susan正在研究一个课题“各国学生的择业取向”。
她希望你帮助她调查中国学生的选择。
你利用学校网站,对男女各200名学生的未来职业选择做了一次调查。
请根据下表的调查结果,给Susan写一篇题为“Students’ attitudes towards future jobs”注意:1、词数不少于120个;报告的开头已经给出,但不计入总词数。
2、参考词汇:公务员civil servant; 理想ideal二.点拔指导1、文体解读报告是就调查、观察的结果提出详细书面材料或作口头叙述,是针对某一问题作出深入研究和认真分析、并给出相关意见或建议的文体。
一般包括标题、正文、结论。
报告的标题要反映主题,正文部分的表述要能够准确反映调查的客观事实和分析结果,并在结论部分提出对策。
本篇书面表达用报告的形式来对所提供的材料进行对比,应使用客观的对比说明方式进行叙述,在写作中通过数据来反映事实,而不流露作者自己的态度。
在进行对比时应注意对男女生在择业方面的异同和悬殊性的说明。
可采用分段形式进行写作,第一段说明双方较为喜欢的职业,第二段则说明双方较为悬殊的职业倾向。
2、词语聚焦base on, attitude, vary, while, field, make up,though, show interest in, ability3、常用表达1. conduct a survey on a website2. both…and…3.in my opinion/in short /in general/in conclusion 三.范文展示Students’ attitudes towards future jobsI’ve recently conducted a survey on my school website based on a sample of 200 boy students and 200 girl students about their attitudes towards their future jobs. _________________________________________________________________________(他们对未来职业的态度差异很大)。
英语图表作⽂范例⼀、图表作⽂写作常识1、图形种类及概述法:泛指⼀份数据图表:a data graph/ch art/diagram/illustration/table 饼图:pie chart直⽅图或柱形图:bar chart / histo gram趋势曲线图:line chart / curve di agram表格图:table流程图或过程图:flow chart / sequ ence diagram程序图:processing/procedures dia gram2、常⽤的描述⽤法The table/chart diagram/graph sho ws (that)According to the table/chart diag ram/graphAs (is) shown in the table/char t diagram/graphAs can be seen from the table/cha rt/diagram/graph/figures,figures/statistics shows (tha t)……It can be seen from the figures/s tatisticsWe can see from the figures/stati sticsIt is clear from the figures/stat isticsIt is apparent from the figures/s tatisticstable/chart/diagram/graph figures (that)……table/chart/diagram/graph shows/d esc ribes/illustrates how……3、图表中的数据(Data)具体表达法数据(Data)在某⼀个时间段固定不变:fixed in time在⼀系列的时间段中转变:changes o ver time持续变化的data在不同情况下:增加:increase / raise / rise / g o up ……减少:decrease / grow down / drop / fall ……波动:fluctuate / rebound / undul ate / wa ve ……稳定:remain stable / stabilize / level off ……最常⽤的两种表达法:动词+副词形式(Verb+Adverb form)形容词+名词形式(Adjective+Noun f orm)⼆、相关常⽤词组1、主章开头图表类型:table、chart、diagramgr aph、column chart、pie graph描述:show、describe、illustrate、can be seen from、clear、apparent、re veal、represent 内容:figure、statistic、number、p ercentage、proportion2、表⽰数据变化的单词或者词组rapid/rapidly 迅速的,飞快的,险峻的dramatic/dramatically 戏剧性的,⽣动的significant/significantly 有意义的,重⼤的,重要的sharp/sharply 锐利的,明显的,急剧的steep/steeply 急剧升降的steady/steadily 稳固的,坚定不移的gradual/gradually 渐进的,逐渐的slow/slowly 缓慢的,不活跃的slight/slightly 轻微的、略微地stable/stably 稳定的3、其它在描述中的常⽤到的词significant changes 图中⼀些较⼤变化noticeable trend 明显趋势during the same period 在同⼀时期grow/grew 增长distribute 分布,区别unequally 不相等地in the case of adv. 在……的情况下in terms of / in respect of / reg arding 在……⽅⾯in contrast 相反,⼤不相同government policy 政府政策market forces 市场规率measure n.尺⼨,⽅法,措施v.估量,调节forecast n.先见,预见v.预测三、考研英语图表写作套句精选1.the table shows the changes in the number of……over the period fro m……to……该表格描述了在……年之……年间……数量的变化。
图表作文万能模板it is obvious in the table that the rate of## (就是某个事物或者时间再数据中)has udnergone dramtic change(正在经历巨变),it has gone considerably in recent years(在近些年). The## has been increasing dramtically sine##(这个事情或事件自从多少年渐渐变化明显). it had a much sharper increase from## to ##,reaching the peak at##.what is the reason for this change (原因)? i think , mainly there are## reason behind the situation reflected in the table(我想有很多原因反映在这些数据的背后). first of all##(第一)more importantly##(第二)most important of all## (第三)from above discussion ,we have enough reason to prdict what will happen in the near future ,the trend described in the table will continue for quite a long time.人口增长对野生动物的影响(99年真题)[2.图画/图表描述段] From these graphs, we can draw a conclusion that, with the growth of human population, the number of species has decreased rapidly in America, and some species have even vanished from our planet.[6.原因列军段]Why does this phenomenon appear? There are several possible reasons for this. Above all, as the human population grows rapidly, a growing number of people came to live where some wild species have been living. Then these species have to move to other places. Some of them probably can not adapt to the new environment and die. In addition, although many people look on the wildlife as their friends, some people may not think so. They catch a lot of wild animals and sell them in order to get more money. Even worse(坏)/More importantly(好), as the result(中性)/consequence(贬义)of the industry, the natural balance and the ecologic environment are destroyed. The clear cutting has become increasingly serious. So some of the wildlife become homeless and extinct.[10.建议措施段]In order to protect the wildlife, I have some suggestions. First, the governments should make laws to prevent them from being caught and killed. Second, the governments should educate people to love nature and protect it. Third, as for ourselves, we should take practical actions to protect our living environment.烟草生产和消费(01年大纲样题)[1.现象/现状说明段]The majority of people would agree that cigarette smoking has caused serious problems. But the tobacco companies insist that they contribute greatly to the world economy by paying taxes to the government and employing hundreds of workers.[4.利弊说明段]Personally, I believe that cigarette production and consumption threatens to do more harm than good. Firstly, smoking is responsible for many fatal diseases such as lung cancer, heart diseases and so on. According to the survey, tobacco consumers account for about 20% of the world population, and among them,three million people die from smoking-related diseases every year. The fact that the output of tobacco production is reduced from 143.64 billion pounds in 1994 to 142 billion pounds in 1995 also suggests that people have come to realize the negative effects of smoking. Secondly, tobacco consumption is extremely wasteful of money. As is indicated in the pictures, 200 billion US dollars is lost due to smoking each year. Obviously, the total loss of money around the globe substantially exceeds the gain in the industry.[8.归纳结论段]In conclusion, as the economic development aims at making our life better, we cannot sacrifice our health for short-term financial benefits. If we have to spend more and more money providing medical services for those who suffer from smoking-related illnesses, the notion of promoting economy via tobacco production is not justifiable. It is high time that we fought for the total tobacco ban.日用花销统计Statistics in People's Daily Expenses in Xi'anYearItem 1995 1996 1997 1998 1999Food 66% 61% 48% 41% 36%Clothing 9% 10% 12% 15% 18%Recreation 4% 5% 8% 9% 11%[2.图画/图表描述段]What is shown in the table above indicates that dramatic changes have taken place in the daily expenses in Xi' an from 1995 to 1999. The expenses on food have declined by 30% while those on clothing and recreation have increased respectively by 9% and 7%. The statistics of rise and fall seem to exist in isolation but closely related to one another.[6.原因列军段]There are two factors accounting for these changes. Development in economy is an essential one in the five years. The increased income resulting from economic growth plays an important part in the less expense on food. Hence, a small percentage of total income is enough to cover food expense. Another one is the changes in life style. When food presents no worry to the average, people begin to focus more of interest on handsome appearance and happy leisure time. As a result of such a shift, spending on clothing and recreation increased year after year.[9.趋势预测段]From the analyses made above, we may come to the conclusion that people's living standards in Xi' an have been constantly improved between 1995 and 1999. With the further growth in economy and more changes in life style, the tendency indicated in the table will continue in the table will continue in the better direction.。
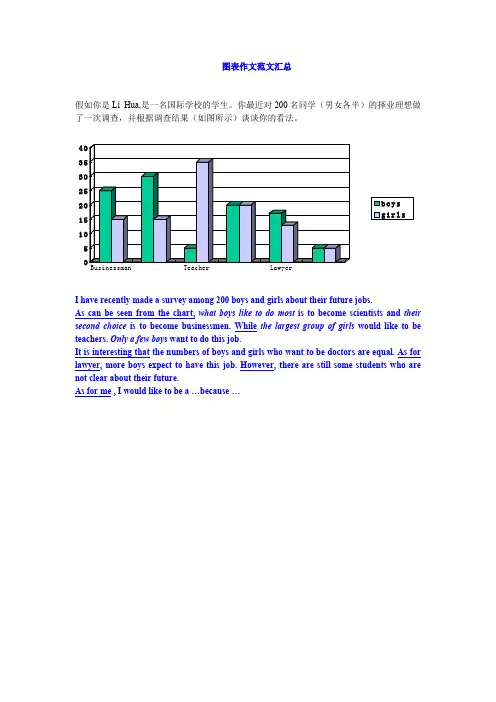
n e图表作文范文汇总假如你是Li Hua,是一名国际学校的学生。
你最近对200名同学(男女各半)的择业理想做了一次调查,并根据调查结果(如图所示)谈谈你的看法。
I have recently made a survey among 200 boys and girls about their future jobs.As can be seen from the chart, what boys like to do most is to become scientists and their second choice is to become businessmen. While the largest group of girls would like to be teachers. Only a few boys want to do this job.It is interesting that the numbers of boys and girls who want to be doctors are equal. As for lawyer, more boys expect to have this job. However, there are still some students who are not clear about their future.As for me , I would like to be a …because …BusinessmanTeacherLawyeri n t h07崇文一模某英文报纸正在开展题为“中学生课堂注意力”的专栏讨论,你校准备参加,并请你代表学校写一篇文章给该英文报纸投稿。
下面的图表为你校的调查结果,请你根据所提供的信息做简要说明,并根据提示给出改善的建议。
注意:图中数据为学生人数百分比。
改善注意力的建议:教室通风、明亮课堂积极参与课堂活动课间适量活动或适当休息注意:1.词数:不少于60。
我们在备考作文的时候,一般会从以下几个方面着手准备,如何描述现象、如何分析原因、如何分析影响、如何给出解决措施、如何进行观点论战等。
其实,图表作文也是从这几个方面展开,只是将第一段的描述现象改为描述图表即可。
可见,无论是考察哪种作文题,我们都可以将它转化为我们熟悉的提纲式。
这次作文题目是Educational Pays(教育回报),图表显示的是教育水平越高,收入越高。
我们能得出一个主题:教育是值得投资的。
两篇范文都是采取三段式的描述方法。
标准版:The above bar chart clearly shows us education pays in 2010. We see that one with higher education background earns more money weekly than those with lower ones. For instance, the college students with no degree get paid$712 per week whereas those with a Bachelor’s degree can earn $1038.Several reasons, in my opinion, can be identified to account for this phenomenon. To begin with, compared with those with comparatively lower education degree, people who have received higher education possess considerably wider knowledge, more remarkable learning and research ability, greater innovation and most of all, resourceful social network, all of which are essential to a high-income work. Also, the higher one’s education degree is, the bigger platform he will have to show his ability. For example, his college, university, or research institute will organize various job fairs for them to communicate face to face with employers.This phenomenon tells us that education is a worthy investment. Therefore, substantial educationinvestment should be strengthened while we, as college students, should study harder to build our country and strive for a better life for ourselves.写好这篇作文,主要抓住三点:第一段:描述图表内容。
注:红色字体为框架,绿色字体为经典表达或常用词/词组;其他为强调P.S. 每篇字数都在200左右,已达六级水平,如遇到此类作文,可以在解决问题(第三段)部分稍缩减。
图表类作文范文Student Use of Computers1.下图所示为1990年、1995年、2002年某校大学生适用计算机的情况,请描述其变化2.请说明发生这些变化的原因(可以从计算机的使用,价格或社会发展等方面加以说明)3.你认为目前大学生在计算机使用中有什么困难或问题(图表略)From the chart we can see clearly that the average number of hours a student spends on the computer per week has increased from less than two hours in 1990 to nearly four hours in 1995, and then to 18 hours in 2002. (第一段描述图表数据)In my mind, the reasons why computers are more and more widely used are as follows. First, computers can help us accomplish many tasks, including both work and study. With the advent of (随着…的出现)internet, searching for information and contacting friends become just a click away. Besides, computers are becoming cheaper and cheaper---- many university students can afford it. (分析原因)The negative effects of computers are also are also clear. T o begin with, computers may be out of order(发生故障) from time to time,and repairing them can be both expensive and time-consuming. Second, more and more students spend too much time playing computer games or chatting online, which are both bad habits. (问题或困难)All in all, I should say the advantages outweigh(及物动词,后直接加宾语;意思:[重要性]胜过,超过,重于…)the disadvantages. The key lies in whether we can make good use of it to enhance work and study. (结论)Changes in the Ownership of Houses1.根据下图描述该市住房产权的变化2.分析产生这些变化的原因3.说明这些变化对个人和社会产生的影响From the chart, we can see clearly that in a big city in China, state-owned houses declined abruptly from 75% in 1990 to 60% in 2000, while private houses rose from 25% to 40% and then to80 during the same period. (描述图表数据)Two reasons, in my mind, can account for the fundamental changes in the ownership of houses. On the one hand,the housing reform(改革)is one of the most important urban(城市的)economic reforms and the old system of house distribution(分配)isreplaced by individual purchase of real estate. On the other hand, as the income level goes up, people want to live in larger and more comfortable houses. (分析原因)Such changes have a significant impact on both individuals and the whole society. For one thing,with the deepening of (随着…的深化)the housing reform, private housing investment witness an unprecedented (空前的) boom(繁荣). For another, national urban construction undergoes sustainable development, which is of great importance to the national economy as a whole (总的来说). In a word,the housing reform is beneficial to both individuals and the whole society. (说明所产生影响)Traveling Abroad1.近十年来X市有越来越多的人选择处境旅游2.出现这种现象的原因3.这种现象可能产生的影响As is vividly indicated in the above chart,the number of people in City X traveling abroad has increased considerably in the past decade. Especially in the recent 5 years, the figure has been more than triple d (使…成三倍),surging from 40,000 to 120,000. (描述图表数据)The reasons for the increasing of people traveling abroad are as follows. Firstly, with the development of economy, people are richenough to afford to travel abroad. Secondly,tourism has been greatly developed over the decade and it is safe and convenient to travel abroad. Thirdly, people are encouraged to go abroad to widen their horizon and to keep themselves informed of (使…了解) what is going on around the world. (分析原因)From the changes reflected in the chart, we can predict that this trend will bring lots of benefits for us.On the one hand, traveling abroad will help tourists learn great amount of experiences and cultures which will be inevitably beneficial for their own development. On the other hand, it may facilitate(促进,帮助) the cultural exchange and enhance the friendship between our country and the rest of the world. (说明影响)附:应用文类作文,如果为信件,格式为January 1, 2011Dear XXX,………………………………………………………………………………….…………………………………………..Best regards.Yours sincerely/ truly/ faithfully,Li Xiaoming(不要写真名)。
2024届新高考英语高频考点专项练习:专题十五考点23 图表作文B卷(含答案)2024届新高考英语高频考点专项练习:专题十五考点23 图表作文(B卷)1. 你校高三英文社团就"What is the most effective way to ease stress "话题进行了一次调查,请根据下面调查结果写一篇调查报告,内容包括:1. 简述调查结果;2. 分析原因。
注意:1. 词数80左右;2. 可以适当增加细节,以使行文连贯。
THE MOST EFFECTIVE WAY TO EASE STRESS___________________________________________________________ ___________________________________________________________ ___________________________________________________________ ___________________________________________________________ ___________________________________________________________ _____2. 下面是某高中对150名高三学生睡眠时间不足及其原因所做的调查的结果。
请根据图1提供的信息描述高三学生的睡眠情况,并针对图2中的任何一个数据所反映的情况表达你的看法。
参考词汇:chart 图表高三学生每天的睡眠情况高三学生睡眠不足的原因所占比例注意:1. 词数80左右;2. 可以适当增加细节,以使行文连贯。
___________________________________________________________ ___________________________________________________________ ___________________________________________________________ ___________________________________________________________ ___________________________________________________________ _____3. 假设你是中华中学学生姚平,最近参加了一项研究性学习调研,课题为"父母是否以子女为荣"。
英语作文图表分析范文(汇总30篇)(经典版)编制人:__________________审核人:__________________审批人:__________________编制单位:__________________编制时间:____年____月____日序言下载提示:该文档是本店铺精心编制而成的,希望大家下载后,能够帮助大家解决实际问题。
文档下载后可定制修改,请根据实际需要进行调整和使用,谢谢!并且,本店铺为大家提供各种类型的经典范文,如工作总结、工作计划、合同协议、条据文书、策划方案、句子大全、作文大全、诗词歌赋、教案资料、其他范文等等,想了解不同范文格式和写法,敬请关注!Download tips: This document is carefully compiled by this editor. I hope that after you download it, it can help you solve practical problems. The document can be customized and modified after downloading, please adjust and use it according to actual needs, thank you!Moreover, our store provides various types of classic sample essays for everyone, such as work summaries, work plans, contract agreements, doctrinal documents, planning plans, complete sentences, complete compositions, poems, songs, teaching materials, and other sample essays. If you want to learn about different sample formats and writing methods, please stay tuned!英语作文图表分析范文(汇总30篇)英语作文图表分析范文第1篇图表类写作模版(1)模版1According to the chart / graph / diagram / table, we clearly learn that _________.As early as _________,___________.Then,_________.Last,__________.In contrast, by _________,__________.There are many reasons accounting for _________.Firstly, _________.Secondly,__________.Finally,_________.As a result,_________.As far as I am concerned,_________.For one thing,__________.For another,________.In brief, I hold that__________.(2)模版2What is shown in the chart / graph / diagram / table above indicates that in recent years, more and more people payattention to _________.The number of those who _________has increased ________,and furthermore,____________.There are two factors responsible for the changes.In the first place,_________.Moreover,__________.Yet, it is noticeable that __________.From the analysis, we can safely draw the conclusion that__________.It is possible that in the future,the tendency will__________.(3)模版3As is shown in the chart / graph / diagram / table above,__________has charged drastically in the past _________.While ___________,now the percentage of__________is __________.Meanwhile,the number of _________has soared up to ________.There are mainly two possible reasons contributing to the rapid changes.The first is that _________.Secondly,__________.In my point of view, the changes have a great influence on _________.At the same time,_______.To sum up ,_________.英语作文图表分析范文第2篇1、图形种类及概述法:泛指一份数据图表: a data graph/chart/diagram/illustration/table饼图:pie chart直方图或柱形图:bar chart / histogram趋势曲线图:line chart / curve diagram表格图:table流程图或过程图:flow chart / sequence diagram程序图:processing/procedures diagram2、常用的描述用法The table/chart diagram/graph shows (that)According to the table/chart diagram/graphAs (is)shown in the table/chart diagram/graphAs can be seen from the table/chart/diagram/graph/figures,figures/statistics shows (that)……It can be seen from the figures/statisticsWe can see from the figures/statisticsIt is clear from the figures/statisticsIt is apparent from the figures/statisticstable/chart/diagram/graph figures (that)……table/chart/diagram/graph shows/describes/illustrates how……3、图表中的数据(Data)具体表达法数据(Data)在某一个时间段固定不变:fiXed in time在一系列的时间段中转变:changes over time持续变化的data在不同情况下:增加:increase / raise / rise / go up ……减少:decrease / grow down / drop / fall ……波动:fluctuate / rebound / undulate / wave ……稳定:remain stable / stabilize / level off ……最常用的两种表达法:动词+副词形式(Verb+Adverb form)形容词+名词形式(Adjective+Noun form)英语作文图表分析范文第3篇雅思考试学术类图表作文分析考试学术类图表作文要求考生观察一幅图表并用自己的语言呈现出图表中的信息。
【系列】雅思A类小作文范文合辑(第一辑)2012年11月21日14:51:52The chart below gives information about global sales of games software, CDs and DVD or video.Write a report for a university lecturer describing the information.You should write at least 150 words.You should spend about 20 minutes on this task.model answer:The chart shows the changes in the sales of video material / DVDs, games software and CDs around the world in billions of dollars over a three-year period. It can be seen that the sales of videos / DVDs and games software have increased, while the sales of CDs have gone down slightly.Between 2000 and 2003, the sale of videos and DVDs rose by approximately 13 billion dollars. In 2000, just under 20 billion dollars worth of these items were sold, but in 2003, this figure had risen to a little over 30 billion dollars.The sales of games software also rose during this period, but less sharply. Sales increased from about 13 billion dollars in 2000 to just under 20 billion dollars three years later. By contrast, during the same time period, the sale of CDs fell from 35 billion dollars in 2000 to about 32.5 billion dollars in 2003.Eating sweet foods produces acid in the mouth, which can cause tooth decay. (High acid levels are measured by low pH values)Describe the information below and discuss the implications for dental health.You should write at least 150 words.Allow yourself 20 minutes for this task.model answer:Anyone who has visited a dentist has been told that eating excessive amounts of sweets risks harming the teeth. This is because sweets lower pH levels in the mouth to dangerous levels.When the pH level in the mouth is kept above 5.5, acidity is such that teeth are unlikely to be in danger of decay. Sweet foods, however, cause pH in the mouth to drop for a time, and the longer pH levels remain below 5.5, the greater the opportunity for decay to occur.By comparing fruit sugar, cane sugar and honey, which are all common ingredients of sweet foods, we find that cane sugar lowers pH levels for the longest period, thus producing the greatest risk of the three. Approximately five minutes aftfter consuming cane sugar, pH levels drop to as little as pH 3.5. They then begin to rise slowly, but do notrise above pH 5.5 until at least 30 minutes have elapsed. By contrast, fruit sugar, which causes the mouth's acidity to fall to just above pH 4, poses a danger for a shorter period: tooth decay is unlikely 20 minutes after consumption. Honey appears an even less risky substance. Though acidity falls to about pH 4.75 within five minutes of consumption, it returns to above pH 5.5 in under fifteen minutes.The implications, then, are that people who insist on eating sweet foods should be aware of the ingredients, and that fruit sugar or honey appear preferable to cane sugar.Write a report for a university lecturer describing the information in the two graphs below.You should write at least 150 words.Allow yourself 20 minutes for this task.model answer:The pie charts compare the highest level of education achieved by women in Someland across two years, 1945 and 1995. It can be clearly seen that women received a much higher level of education in Someland in 1995 than they did in 1945.In 1945 only 30% of women completed their secondary education and 1% went on to a first degree. No women had completed post-graduate studies. This situation had changed radically by 1995. In 1995, 90% of women in Someland had completed secondary education and of those, half had graduated from an initial degree and 20% had gone on to postgraduate studies. At the other end of the scale we can see that by 1995 all girls were completing lower secondary, although 10% ended their schooling at this point. This is in stark contrast with 1945 when only 30% of girls completed primary school, 35% had no schooling at all and 35% only completed the third grade.In conclusion, we can see that in the 50 years from 1945 to 1995 there have been huge positive developments to the education levels of women in Someland.Write a report for a university lecturer describing the information in the table below.You should write at least 150 words.Allow yourself 20 minutes for this task.model answer:The table shows how people in different age groups spend their leisure time in Someland over the course of a year. It can be clearly seen that the amount of leisure time available varies considerably across the age groups and that people of different age levels have very different ways of spending their leisure time.According to the figures, as people age in Someland their social lives reduce. Teenagers and people in their twenties spend on average 500 hours per year on socialising and 350 hours of that time is with a group of more than 4 people. Although the total hoursof socialising in their 30s, 40s, 50s and 60s is fairly constant (between 300-350), socialising with more than 4 people drops dramatically to 50 hours in the 30s and 40s age groups and only 25 from 50 years old. Group and individual exercise follow a similar pattern.People of all ages spend a good part of their leisure time on entertainment such asTV/video viewing and cinema. In both cases, teenagers and retired people spend around twice as much time as those who are at working age. Home entertainment ranges from just over a thousand hours for teenagers and retired people and an average of 600 hours for everyone else. Cinema accounts for 100 hours of the teenagers and retired people’s leisure time and 25-50 hours for the rest.In conclusion we can see there is a significant trend towards solitary and smaller group activities as people grow older and that teenagers and retired people spend a lot more time on entertainment than those of working age do.The map below is of the town of Garlsdon. A new supermarket (S) is planned for the town. The map shows two possible sites for the supermarket.Summarise the information by selecting and reporting the main features, and make comparisons where relevant.You should write at least 150 words.Allow yourself 20 minutes for this task.model answer:The first potential location (S1) is outside the town itself, and is sited just off the main road to the town of Hindon, lying 12 kms to the north-west. This site is in the countryside and so would be able to accommodate a lot of car parking. This would make it accessable to shoppers from both Hindon and Garlsdon who could travel by car. As it is also close to the railway line linking the who towns to Cransdon (25 km to the south-east), a potentially large number of shoppers would also be able to travel by train.In contrast, the suggested location, S2, is right in the town centre, which would be good for local residents. Theorically the store could be accessed by road or rail from the surrounding towns, including Bransdon, but as the central area is a no-traffic zone, cars would be unable to park and access would be difficult.Overall, neither site is appropriate for all the towns, but for customers in Cransdon, Hindon and Garlsdon, the out-of-town site (S1) would probably offer more advantages.The diagram below shows the typical stages of consumer goods manufacturing, including the process by which information is fed back to earlier stages to enable adjustment.Write a report for a university lecturer describing the process shown.You should write at least 150 words.You should spend about 20 minutes on this task.model answer:Most consumer goods go through a series of stages before they emerge as finished products ready for sale.Raw materials and manufactured components comprise the initial physical input in the manufacturing process. Once obtained, these are stored for later assembly. But assembly first depends upon the production planning stage, where it is decided how and in what quantities the stored materials will be processed to create sufficient quantities of finished goods. The production planning stage itself follows the requirements of the goods' design stage that proceeds from extensive research. After assembly, the products are inspected and tested to maintain quality control l Those units that pass the inspection and testing stages are then packaged, despatched and offered for sale in retail outlets. The level of sales, which is the end point of the manufacturing process, helps determine production planning.A product's design is not only the result of product research, but is also influenced by testing and market research. If the testing stage (after assembly and inspection) reveals unacceptable problems in the finished product, then adjustments will have to be made to the product's design. Similarly, market research, which examines the extent and nature of the demand for products, has the role of guiding product design to suit consumer demands which may change with time. Market research, while influenced by product sales, also serves to foster future sales by devising suitable advertising for the goods.Thus the reality of consumer goods manufacturing goes well beyond a simple linear production process.。