Matplotlib_slides-python matplotlib使用教程
- 格式:pdf
- 大小:1.49 MB
- 文档页数:69
Python利⽤matplotlib模块数据可视化绘制3D图⽬录前⾔1matplotlib绘制3D图形2绘制3D画⾯图2.1源码2.2效果图3绘制散点图3.1源码3.2效果图4绘制多边形4.1源码4.2效果图5三个⽅向有等⾼线的3D图5.1源码5.2效果图6三维柱状图6.1源码6.2效果图7补充图7.1源码7.2效果图总结前⾔matplotlib实际上是⼀套⾯向对象的绘图库,它所绘制的图表中的每个绘图元素,例如线条Line2D、⽂字Text、刻度等在内存中都有⼀个对象与之对应。
为了⽅便快速绘图matplotlib通过pyplot模块提供了⼀套和MATLAB类似的绘图API,将众多绘图对象所构成的复杂结构隐藏在这套API内部。
我们只需要调⽤pyplot模块所提供的函数就可以实现快速绘图以及设置图表的各种细节。
pyplot模块虽然⽤法简单,但不适合在较⼤的应⽤程序中使⽤。
为了将⾯向对象的绘图库包装成只使⽤函数的调⽤接⼝,pyplot模块的内部保存了当前图表以及当前⼦图等信息。
当前的图表和⼦图可以使⽤plt.gcf()和plt.gca()获得,分别表⽰"Get Current Figure"和"Get Current Axes"。
在pyplot模块中,许多函数都是对当前的Figure或Axes对象进⾏处理,⽐如说:plt.plot()实际上会通过plt.gca()获得当前的Axes对象ax,然后再调⽤ax.plot()⽅法实现真正的绘图。
可以在Ipython中输⼊类似"plt.plot??"的命令查看pyplot模块的函数是如何对各种绘图对象进⾏包装的。
1 matplotlib绘制3D图形matplotlib可以绘制3D图形,有的版本中不具备该模块,可以进⼊python环境,输⼊from mpl_toolkits.mplot3d import Axes3D 进⾏测试,如果导⼊成功则可以,否则需要安装matplotlib其他版本,这⾥我⽤的是2.0.2版本。
Python数据可视化库Matplotlib的使用随着数据的不断增加和呈现方式的多样化,数据可视化变得越来越重要。
当我们处理大量数据时,可视化图表是一个非常好的选择,它们可以帮助我们更好地理解和分析数据。
Matplotlib是一个广泛使用的Python数据可视化库,它可以用来创建各种图表,比如线图、散点图、柱状图等。
本文将介绍Matplotlib的基本知识,包括安装、常用函数和创建不同类型的图表等。
一、Matplotlib的安装Matplotlib需要安装在Python环境中才能使用。
安装Matplotlib的方法有很多,最简单的方法是使用pip命令。
在命令行中输入以下命令:pip install matplotlib当然,Matplotlib也可以通过Anaconda等Python发行版来安装。
二、Matplotlib的基本知识Matplotlib提供了丰富的接口来创建图表,支持各种类型的图表。
在使用Matplotlib之前,我们需要了解Matplotlib的核心对象:Figure、Axes和Axis。
Figure是最上层的容器,代表整个图形窗口。
在Matplotlib中,我们可以在Figure上添加一个或多个Axes来绘制图表。
Axes是绘图区域,它是Figure的一个子类。
在Axes内可以添加坐标轴(Axis)、文字(Text)、网格(Grid)和数据(Data)等。
Axis是数据的基本轴。
在Matplotlib中,我们可以创建一个或多个Axis对象,以及为每个Axis对象设置其属性和样式。
三、Matplotlib的基本用法1.绘制曲线图在Matplotlib中,我们可以使用plot()函数来绘制曲线图。
plot()函数的参数包括x轴和y轴的数据,以及设置曲线的样式和颜色等。
例如,我们可以使用以下代码来绘制一个简单的曲线图:import matplotlib.pyplot as pltx = np.linspace(-np.pi, np.pi, 256, endpoint=True)y = np.sin(x)plt.plot(x, y)plt.show()在这个例子中,我们使用numpy库中的linspace()函数生成一个区间内的等差数列,并使用numpy库中的sin()函数生成对应的sin曲线。

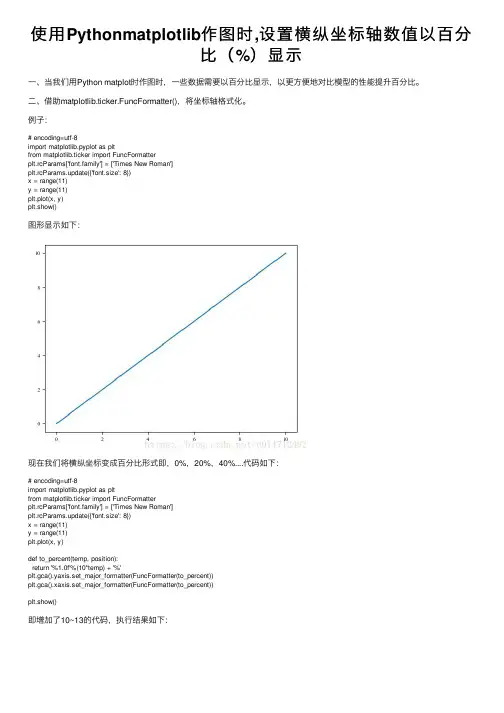
使⽤Pythonmatplotlib作图时,设置横纵坐标轴数值以百分⽐(%)显⽰⼀、当我们⽤Python matplot时作图时,⼀些数据需要以百分⽐显⽰,以更⽅便地对⽐模型的性能提升百分⽐。
⼆、借助matplotlib.ticker.FuncFormatter(),将坐标轴格式化。
例⼦:# encoding=utf-8import matplotlib.pyplot as pltfrom matplotlib.ticker import FuncFormatterplt.rcParams['font.family'] = ['Times New Roman']plt.rcParams.update({'font.size': 8})x = range(11)y = range(11)plt.plot(x, y)plt.show()图形显⽰如下:现在我们将横纵坐标变成百分⽐形式即,0%,20%,40%....代码如下:# encoding=utf-8import matplotlib.pyplot as pltfrom matplotlib.ticker import FuncFormatterplt.rcParams['font.family'] = ['Times New Roman']plt.rcParams.update({'font.size': 8})x = range(11)y = range(11)plt.plot(x, y)def to_percent(temp, position):return '%1.0f'%(10*temp) + '%'plt.gca().yaxis.set_major_formatter(FuncFormatter(to_percent))plt.gca().xaxis.set_major_formatter(FuncFormatter(to_percent))plt.show()即增加了10~13的代码,执⾏结果如下:可见已经实现我们的需求。
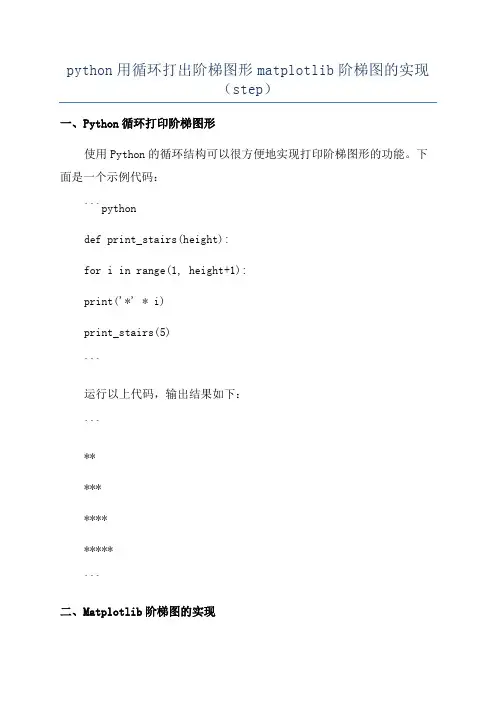
python用循环打出阶梯图形matplotlib阶梯图的实现(step)一、Python循环打印阶梯图形使用Python的循环结构可以很方便地实现打印阶梯图形的功能。
下面是一个示例代码:```pythondef print_stairs(height):for i in range(1, height+1):print('*' * i)print_stairs(5)```运行以上代码,输出结果如下:```**************```二、Matplotlib阶梯图的实现Matplotlib是一个常用的绘图库,提供了丰富的绘图函数和方法。
其中的`step(`函数可以用来绘制阶梯图。
下面是一个使用Matplotlib绘制阶梯图的示例代码:```pythonimport matplotlib.pyplot as pltimport numpy as npx = np.arange(1, 6)y = np.arange(1, 6)plt.step(x, y)plt.xlabel('x')plt.ylabel('y')plt.title('Step Chart')plt.show```运行以上代码,将会显示一个阶梯图以上代码中,我们首先使用NumPy创建了一个长度为5的一维数组,然后使用`step(`函数绘制了阶梯图。
`step(`函数的第一个参数是x轴的值,可以是一个一维数组或者是一个标量。
第二个参数是y轴的值,也可以是一个一维数组或者是一个标量。
如果是两个一维数组,则长度必须相同。
在上述代码中,x轴和y轴都是从1到5的整数数组,所以阶梯图上的点的纵坐标分别为1、2、3、4和5,而横坐标为1到5最后使用`plt.show(`函数来显示图表。
绘制阶梯图时,也可以通过参数调整线段的形状、颜色等属性。
有关更多可用参数的信息,可以查阅Matplotlib官方文档。
一、matplotlib的简介matplotlib是一个Python绘图库,它能够生成2D图形,包括线图、散点图、柱状图、饼图等,并且能够以高质量输出文件的形式保存这些图形。
matplotlib可以与NumPy一起使用,能够方便地对数据进行可视化。
二、matplotlib的安装要使用matplotlib,首先需要安装它。
可以通过pip命令来进行安装:```pip install matplotlib```安装完成后,在Python脚本中引入matplotlib库:```import matplotlib.pyplot as plt```三、matplotlib的基本用法1. 创建图形与坐标系要在matplotlib中绘制图形,首先需要创建一个图形对象和坐标系对象。
图形对象可以通过`plt.figure()`来创建,坐标系对象可以通过`plt.subplot()`来创建。
```pythonfig = plt.figure()ax = fig.add_subplot(111)```2. 绘制直线图要绘制直线图,可以使用`plt.plot()`方法。
这个方法可以传入x轴和y 轴上的数据点,并且可以指定线条的颜色、形状、宽度等参数。
```pythonx = [1, 2, 3, 4, 5]y = [2, 3, 5, 7, 11]plt.plot(x, y, color='r', linestyle='--', linewidth=2)```3. 绘制散点图要绘制散点图,可以使用`plt.scatter()`方法。
这个方法也可以传入x 轴和y轴上的数据点,并且可以指定点的大小、颜色等参数。
```pythonx = [1, 2, 3, 4, 5]y = [2, 3, 5, 7, 11]plt.scatter(x, y, s=50, c='b', marker='o')```4. 绘制柱状图要绘制柱状图,可以使用`plt.bar()`方法。
python matplotlib 参数python matplotlib 参数matplotlib是Python最常用的可视化库之一,它提供了丰富的绘图工具和一系列的参数设置,使得我们可以通过灵活的参数调整绘图效果。
下面我们来详细了解一下matplotlib常用的参数。
1. figure参数在matplotlib中,最顶层的容器是Figure(图形),在Figure中可以包含1个或多个Axes(坐标系),而Axes则包含了2个Axis(坐标轴)。
当我们要创建一个画布时,可以通过设置一些figure参数来控制画布的大小、背景颜色、分辨率等。
常用的figure参数包括:(1)figsize:用来设置画布的大小,单位是英寸,如figsize=(8,6)表示画布的宽度为8英寸,高度为6英寸。
(2)dpi:用来设置图像的分辨率,一般默认的dpi为100,我们可以设置为更高的值以获得更高的清晰度。
(3)facecolor:用来设置画布的背景色,如facecolor='white'表示背景色为白色。
(4)edgecolor:用来设置画布边框的颜色,默认为黑色。
2. axes参数在matplotlib中,Axes(坐标系)是最基本的绘图单位,它负责绘制图形中的各种图形元素,如线条、散点、柱状图等。
当我们要控制绘图中的各种元素时,可以通过设置一些axes参数来实现。
常用的axes参数包括:(1)xlim、ylim:用来设置坐标轴的范围,如xlim=(0,10)表示X轴的范围为0~10。
(2)xlabel、ylabel:用来设置坐标轴的标签,如xlabel='X轴',ylabel='Y轴'。
(3)title:用来设置图像的标题,如title='图像标题'。
(4)legend:用来设置图例,表示每个曲线的含义,在绘制多条曲线时非常实用。
(5)grid:用来设置网格线,True表示显示网格线,False表示隐藏网格线。
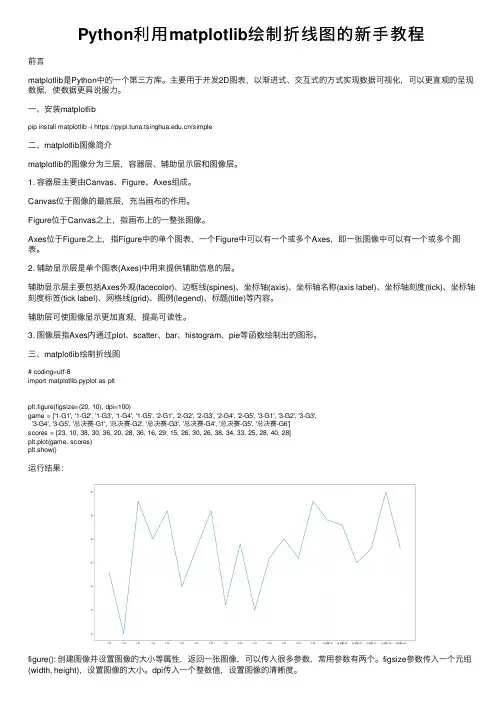
Python利⽤matplotlib绘制折线图的新⼿教程前⾔matplotlib是Python中的⼀个第三⽅库。
主要⽤于开发2D图表,以渐进式、交互式的⽅式实现数据可视化,可以更直观的呈现数据,使数据更具说服⼒。
⼀、安装matplotlibpip install matplotlib -i https:///simple⼆、matplotlib图像简介matplotlib的图像分为三层,容器层、辅助显⽰层和图像层。
1. 容器层主要由Canvas、Figure、Axes组成。
Canvas位于图像的最底层,充当画布的作⽤。
Figure位于Canvas之上,指画布上的⼀整张图像。
Axes位于Figure之上,指Figure中的单个图表,⼀个Figure中可以有⼀个或多个Axes,即⼀张图像中可以有⼀个或多个图表。
2. 辅助显⽰层是单个图表(Axes)中⽤来提供辅助信息的层。
辅助显⽰层主要包括Axes外观(facecolor)、边框线(spines)、坐标轴(axis)、坐标轴名称(axis label)、坐标轴刻度(tick)、坐标轴刻度标签(tick label)、⽹格线(grid)、图例(legend)、标题(title)等内容。
辅助层可使图像显⽰更加直观,提⾼可读性。
3. 图像层指Axes内通过plot、scatter、bar、histogram、pie等函数绘制出的图形。
三、matplotlib绘制折线图# coding=utf-8import matplotlib.pyplot as pltplt.figure(figsize=(20, 10), dpi=100)game = ['1-G1', '1-G2', '1-G3', '1-G4', '1-G5', '2-G1', '2-G2', '2-G3', '2-G4', '2-G5', '3-G1', '3-G2', '3-G3','3-G4', '3-G5', '总决赛-G1', '总决赛-G2', '总决赛-G3', '总决赛-G4', '总决赛-G5', '总决赛-G6']scores = [23, 10, 38, 30, 36, 20, 28, 36, 16, 29, 15, 26, 30, 26, 38, 34, 33, 25, 28, 40, 28]plt.plot(game, scores)plt.show()运⾏结果:figure(): 创建图像并设置图像的⼤⼩等属性,返回⼀张图像,可以传⼊很多参数,常⽤参数有两个。
python使⽤pip安装SciPy、SymPy、matplotlib教程背景:使⽤pip install SciPy的格式安装python函数库SciPy的时候,发现⽼是报错,从⽹上找信息也没找到合适的解决办法,最后使⽤whl格式⽂件安装成功。
过程:本⼈事先电脑安装了python3.5.2,电脑是64位的。
由于我已经安装了numpy,只安装了下⾯的whl⽂件。
>>pip install E:\360安全浏览器下载\scipy-0.19.1-cp35-cp35m-win_amd64.whl>>pip install E:\360安全浏览器下载\matplotlib-1.5.3-cp35-cp35m-win_amd64.whl>>pip install E:\360安全浏览器下载\sympy-1.1.1-py2.py3-none-any.whl注意:下载的.whl⽂件不要重命名;安装顺序有讲究,可以先装numpy、scipy模块后装matplotlib,因为各模块之间有相互依赖关系。
如果第⼀次安装不成功可以重新安装⼏次,matplotlib、scipy都是安装了两次才成功,安装还是不成功的时候可以选择下载低版本的函数库试⼀下。
如果以上安装过程嫌⿇烦,也可以直接安装已经集成了很多有⽤的第三⽅包的发⾏版anaconda,或者安装python(x,y)。
后续:使⽤过程中的⼀些错误提⽰及解决办法:下⾯两个报错信息是我使⽤from scipy.optimize import leastsq报出的。
报错:RuntimeError:module compiled against API version 0xb but this version of numpy is 0xa。
⽹上的资料说是numpy 版本不对。
解决办法:pip install numpy –upgradepip install -U numpy我⽤第⼆个成功将numpy从numpy-1.12.1升级到numpy-1.13.1。
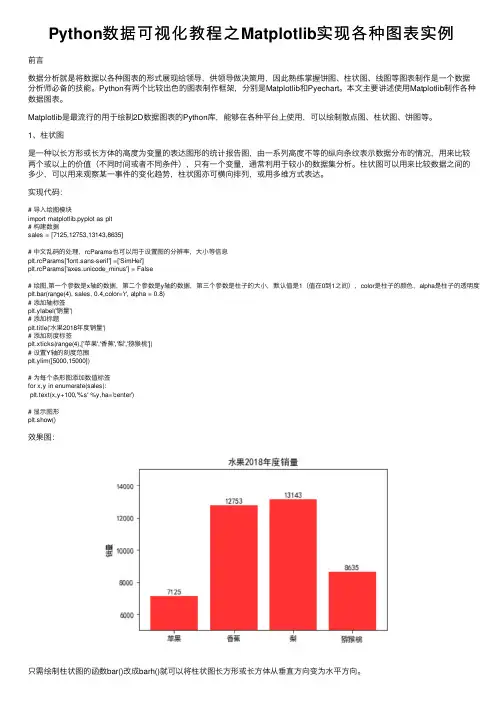
Python数据可视化教程之Matplotlib实现各种图表实例前⾔数据分析就是将数据以各种图表的形式展现给领导,供领导做决策⽤,因此熟练掌握饼图、柱状图、线图等图表制作是⼀个数据分析师必备的技能。
Python有两个⽐较出⾊的图表制作框架,分别是Matplotlib和Pyechart。
本⽂主要讲述使⽤Matplotlib制作各种数据图表。
Matplotlib是最流⾏的⽤于绘制2D数据图表的Python库,能够在各种平台上使⽤,可以绘制散点图、柱状图、饼图等。
1、柱状图是⼀种以长⽅形或长⽅体的⾼度为变量的表达图形的统计报告图,由⼀系列⾼度不等的纵向条纹表⽰数据分布的情况,⽤来⽐较两个或以上的价值(不同时间或者不同条件),只有⼀个变量,通常利⽤于较⼩的数据集分析。
柱状图可以⽤来⽐较数据之间的多少,可以⽤来观察某⼀事件的变化趋势,柱状图亦可横向排列,或⽤多维⽅式表达。
实现代码:# 导⼊绘图模块import matplotlib.pyplot as plt# 构建数据sales = [7125,12753,13143,8635]# 中⽂乱码的处理,rcParams也可以⽤于设置图的分辨率,⼤⼩等信息plt.rcParams['font.sans-serif'] =['SimHei']plt.rcParams['axes.unicode_minus'] = False# 绘图,第⼀个参数是x轴的数据,第⼆个参数是y轴的数据,第三个参数是柱⼦的⼤⼩,默认值是1(值在0到1之间),color是柱⼦的颜⾊,alpha是柱⼦的透明度plt.bar(range(4), sales, 0.4,color='r', alpha = 0.8)# 添加轴标签plt.ylabel('销量')# 添加标题plt.title('⽔果2018年度销量')# 添加刻度标签plt.xticks(range(4),['苹果','⾹蕉','梨','猕猴桃'])# 设置Y轴的刻度范围plt.ylim([5000,15000])# 为每个条形图添加数值标签for x,y in enumerate(sales):plt.text(x,y+100,'%s' %y,ha='center')# 显⽰图形plt.show()效果图:只需绘制柱状图的函数bar()改成barh()就可以将柱状图长⽅形或长⽅体从垂直⽅向变为⽔平⽅向。
matplotlib用法Matplotlib 是一个 Python 的绘图库,广泛应用于数据可视化。
它可以用于创建各种类型的图表,包括线图、散点图、柱状图、饼图、直方图等。
Matplotlib的使用非常灵活,可以满足各种绘图需求。
1. 安装Matplotlib:在使用Matplotlib之前,需要先安装这个库。
可以通过以下命令在终端中安装最新版本的Matplotlib:```pip install matplotlib```2. 导入Matplotlib:在开始使用Matplotlib之前,需要先导入这个库。
一般将其导入为`plt`:```import matplotlib.pyplot as plt```3.创建图像:在Matplotlib中,图像作为一个整体存在,可以在图像上绘制不同种类的图表。
使用`plt.figure(`函数可以创建一个图像对象:```fig = plt.figure```4.创建子图:在图像上可以创建多个子图,用于绘制不同类型的图表。
使用`fig.add_subplot(`函数可以创建一个子图:```ax = fig.add_subplot(nrows, ncols, index)````nrows`表示子图的行数,`ncols`表示子图的列数,`index`表示子图的索引。
5.绘制线图:绘制线图可以使用`plt.plot(`函数。
可以传入x和y坐标的列表,也可以只传入一个参数(此时默认使用索引作为x坐标):```x=[1,2,3,4,5]y=[2,4,6,8,10]plt.plot(x, y)plt.show```6.绘制散点图:散点图可以使用`plt.scatter(`函数绘制。
通过传入x和y坐标的列表,可以将数据点绘制在图上:```x=[1,2,3,4,5]y=[2,4,6,8,10]plt.scatter(x, y)plt.show```7.绘制柱状图:柱状图可以使用`plt.bar(`函数绘制。
pythonmatplotlib画图刻度、图例等字体、字体大小、刻度密度、线条样式设置设置输出的图片大小:1.figsize = 11,92.figure, ax = plt.subplots(figsize=figsize)画简单的折线图,同时标注线的形状、名称、粗细:A,=plt.plot(x1,y1,'-r',label='A',linewidth=5.0,ms=10)其中线条样式以及颜色设置可参考:https:///code_segment/article/details/79217700,个人觉得介绍非常详尽。
线条粗细使用linewidth设置,对应线条上的marker大小设置为ms参数。
因为有时候粗线条,所以对应marker大小也需要增加。
如果想要标记marker为空心,可以在后面加上markerfacecolor='none'设置图例以及对应属性:legend = plt.legend(handles=[A,B],prop=font1)图例的字体格式在prop中进行设置,赋值font1可以是一个字典,包含各个属性及其对应值,属性包括family(字体)、size(字体大小)等常用属性,更详细的解释可参考matplotlib手册中关于legend prop的解释。
一种比较简单的设置为:1.font1 = {'family' : 'Times New Roman',2.'weight' : 'normal',3.'size' : 23,4.}坐标轴刻度密度/间隔设置:ax.xaxis.set_major_locator(MultipleLocator(10))括号中的数字为对应的刻度间隔值,y轴对应类似。
坐标轴刻度值属性设置:1.plt.tick_params(labelsize=23)bels = ax.get_xticklabels() + ax.get_yticklabels()3.[label.set_fontname('Times New Roman') for label in labels]其中tick_params中可设置一系列属性,包括刻度值字体大小、方向、大小,颜色等一系列属性,具体可参见手册中关于tick_params的解释。
matplotlib使用手册Matplotlib是一个用于绘制数据可视化图形的Python库,它提供了各种各样的功能和工具,使得数据分析和探索变得非常简单和直观。
在本篇文章中,我们将深入探讨Matplotlib的使用方法并展示一些实例,以帮助读者更好地理解该库的强大功能。
1. 导入Matplotlib和创建基本图形在使用Matplotlib之前,我们需要先导入库。
常用的导入语句是:```pythonimport matplotlib.pyplot as plt```在导入之后,我们可以开始创建各种各样的图形。
最简单的是创建一个基本的折线图。
```pythonplt.plot([1, 2, 3, 4])plt.show()```这段代码会生成一个包含了四个点的折线图,其中y轴的数据是[1, 2, 3, 4]。
我们可以通过调整数据来创建不同的图形。
2. 自定义图形Matplotlib允许我们对图形进行多种自定义操作,从简单的调整轴的范围到添加图例等高级功能。
下面是一些常用的自定义操作:2.1. 调整轴的范围我们可以使用`plt.xlim()`和`plt.ylim()`函数来调整x轴和y轴的显示范围,以便更好地突出显示数据的变化趋势。
```pythonplt.plot([1, 2, 3, 4])plt.xlim(0, 5)plt.ylim(0, 5)plt.show()```2.2. 添加标签和标题为了让图形更加易读和易懂,我们可以添加标签和标题。
使用`plt.xlabel()`和`plt.ylabel()`函数添加x轴和y轴的标签,使用`plt.title()`函数添加图形的标题。
```pythonplt.plot([1, 2, 3, 4])plt.xlabel('x轴')plt.ylabel('y轴')plt.title('这是一个折线图')plt.show()```2.3. 添加图例当我们在同一个图表中绘制多个数据集时,通常需要为每个数据集添加图例以便更好地区分它们。
Python中的matplotlib库是一个功能强大的数据可视化工具,可以帮助用户创建各种类型的图表和图形。
在使用matplotlib库时,一些常用的函数可以帮助用户更高效地实现数据可视化的目标。
本文将介绍一些常用的matplotlib函数,帮助读者更好地掌握数据可视化技巧。
1. plt.plot()plt.plot()函数是matplotlib中最常用的函数之一,用于绘制折线图。
该函数可以接受多个参数,包括x轴数据,y轴数据以及线条样式等。
我们可以使用plt.plot(x, y, color='r', linestyle='-', linewidth=2)来绘制一条红色实线并设置线宽为2的折线图。
这个函数非常灵活,可以满足各种折线图的需求。
2. plt.scatter()plt.scatter()函数用于绘制散点图,可以展示变量之间的关系以及离群点的分布情况。
该函数接受x轴数据和y轴数据作为参数,并可以指定点的颜色,大小和形状等样式。
使用plt.scatter(x, y, c='b', s=50, marker='o')可以绘制出蓝色的点,大小为50,并且形状为圆形的散点图。
3. plt.bar()plt.bar()函数用于绘制条形图,可以展示不同类别之间的数量或大小对比情况。
该函数接受x轴数据和y轴数据作为参数,并可以指定条形的宽度,颜色和透明度等样式。
使用plt.bar(x, y, width=0.5,color='g', alpha=0.5)可以绘制出绿色、宽度为0.5并且透明度为0.5的条形图。
4. plt.pie()plt.pie()函数用于绘制饼图,可以展示不同类别占比的情况。
该函数接受一个数据列表作为参数,并可以指定饼图的颜色,标签和旋转角度等样式。
使用plt.pie(data, colors=['r', 'g', 'b'], labels=['A', 'B', 'C'], startangle=90)可以绘制出红绿蓝三种颜色的饼图,并且指定起始角度为90度。
python使⽤matplotlib在⼀个图形中绘制多个⼦图以及⼀个⼦图中绘制多条动态折线问题 在讲解绘制多个⼦图之前先简单了解⼀下使⽤matplotlib绘制⼀个图,导⼊绘图所需库matplotlib并创建⼀个等间隔的列表x,将[0,2*pi]等分为50等份,绘制函数sin(x)。
当没有给定x轴数值时,默认以下标作为x的值,如果x值确定,则绘图时写为 plt.plot(x,y) 。
如若想要绘制⼀个图时写⼊标签,则写为 plt.plot(x,y,label="figure1")。
from numpy import *import matplotlib.pyplot as pltx = linspace(0, 2 * pi, 50)plt.plot(sin(x))plt.xlabel('x-label')plt.ylabel('y-label', fontsize='large')plt.title('title')以下先将整体代码插⼊,再分布讲解:import numpy as npimport matplotlib.pyplot as pltfrom matplotlib.ticker import MultipleLocator, FormatStrFormatterdef minmax_value(list1):minvalue=min(list1)maxvalue=max(list1)return minvalue,maxvalueplt.figure(figsize=(16,14),dpi=98)xmajorLocator = MultipleLocator(1) #将x主刻度标签设置为1的倍数plt.rcParams['font.sans-serif']=['SimHei']plt.rcParams['axes.unicode_minus'] = Falsep1 = plt.subplot(121)p2 = plt.subplot(122)#图中展⽰点的数量pointcount=5x=[i for i in range(20)]print(x)y1=[i**2 for i in range(20)]y2=[i*4 for i in range(20)]y3=[i*3+2 for i in range(20)]y4=[i*4 for i in range(20)]for i in range(len(x)-1):if i<pointcount:minx,maxx=minmax_value(x[:pointcount])minx,maxx=minmax_value(x[:pointcount])minyA,maxyA=minmax_value(y1[:pointcount])minyB,maxyB=minmax_value(y2[:pointcount])maxy1=max(maxyA,maxyB)miny1=min(minyA,minyB)p1.axis([minx,maxx,miny1,maxy1])p1.grid(True)A,=p1.plot(x[:pointcount],y1[:pointcount],"g-")B,=p1.plot(x[:pointcount],y2[:pointcount],"b-")#设置主刻度标签的位置,标签⽂本的格式p1.xaxis.set_major_locator(xmajorLocator)legend=p1.legend(handles=[A,B],labels=["图1","图2"]) minx,maxx=minmax_value(x[:pointcount])minx,maxx=minmax_value(x[:pointcount])minyA,maxyA=minmax_value(y3[:pointcount])minyB,maxyB=minmax_value(y4[:pointcount])maxy1=max(maxyA,maxyB)miny1=min(minyA,minyB)p2.axis([minx,maxx,miny1,maxy1])p2.grid(True)A,=p2.plot(x[:pointcount],y3[:pointcount],"r-")B,=p2.plot(x[:pointcount],y4[:pointcount],"y-")#设置主刻度标签的位置,标签⽂本的格式p2.xaxis.set_major_locator(xmajorLocator)legend=p2.legend(handles=[A,B],labels=["图3","图4"]) elif i>=pointcount:minx,maxx=minmax_value(x[i-pointcount:i])minx,maxx=minmax_value(x[i-pointcount:i])minyA,maxyA=minmax_value(y1[i-pointcount:i])minyB,maxyB=minmax_value(y2[i-pointcount:i])maxy1=max(maxyA,maxyB)miny1=min(minyA,minyB)p1.axis([minx,maxx,miny1,maxy1])p1.grid(True)A,=p1.plot(x[i-pointcount:i],y1[i-pointcount:i],"g-")B,=p1.plot(x[i-pointcount:i],y2[i-pointcount:i],"b-") #设置主刻度标签的位置,标签⽂本的格式p1.xaxis.set_major_locator(xmajorLocator)legend=p1.legend(handles=[A,B],labels=["图1","图2"]) minx,maxx=minmax_value(x[i-pointcount:i])minx,maxx=minmax_value(x[i-pointcount:i])minyA,maxyA=minmax_value(y3[i-pointcount:i])minyB,maxyB=minmax_value(y4[i-pointcount:i])maxy1=max(maxyA,maxyB)miny1=min(minyA,minyB)p2.axis([minx,maxx,miny1,maxy1])p2.grid(True)A,=p2.plot(x[i-pointcount:i],y3[i-pointcount:i],"r-")B,=p2.plot(x[i-pointcount:i],y4[i-pointcount:i],"y-") #设置主刻度标签的位置,标签⽂本的格式p2.xaxis.set_major_locator(xmajorLocator)legend=p2.legend(handles=[A,B],labels=["图3","图4"]) p1.set_xlabel("横轴属性名⼀",fontsize=14)p1.set_ylabel("纵轴属性名⼀",fontsize=14)p1.set_title("主题⼀",fontsize=18)p2.set_xlabel("横轴属性名⼆",fontsize=14)p2.set_ylabel("纵轴属性名⼆",fontsize=14)p2.set_title("主题⼆",fontsize=18)plt.pause(0.3)plt.tight_layout(pad=4, w_pad=4.0, h_pad=3.0)运⾏结果为:1、导⼊库import numpy as npimport matplotlib.pyplot as pltfrom matplotlib.ticker import MultipleLocator, FormatStrFormatter2、由于绘图过程中多次使⽤获取最⼤最⼩值,将获取最⼤最⼩值写⼊函数,后⾯直接调⽤函数即可。