ENGG1801_Engineering Computing_2013 summer course_lecture_9_2_1pp
- 格式:pdf
- 大小:470.06 KB
- 文档页数:34
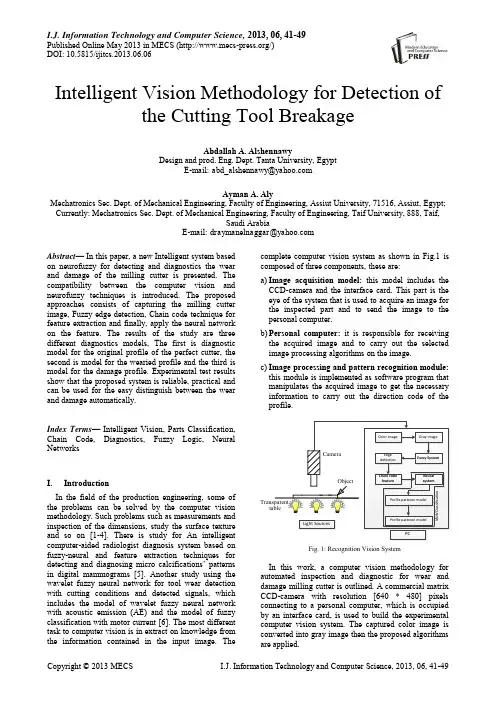
/bbs/read.php?tid=3163计算机方面EI收录的外文期刊( 有“*”是同时被《EI》收录的期刊)1、738B0006 ISSN 0018-8646 IF:2、560 “*”IBM Journal of Research and Development. 《国际商用机器公司研究与开发杂志》,1957. 4/yr. IBM Corp.Old Orchard Rd, Armonk, NY, 10504.http://elib.cs.sfu.ca/Collections/CMPT/cs-journals/P-IBM/J-IBM-JRD.html 2、738B0008-1 ISSN 0004-5411 IF:1、078 “*”Journal of the Association for Computiong Machinery. 《美国计算机学会志》,4/yr. Association for Computing Machinery, 1515Broadway, 17th FL., New York, NY 10036-5701, USATel: 212 869 7440Fax: 212 944 1318/jacm3、738B0008-2 ISSN 0001-0782 IF:2、238 “*”Communications of the ACM. 《美国计算机学会通讯》,1958. 12/yr.Association for Computing Machinery. 1515 Broadway, 17th FL.,New York, NY 10036-5701, USA.Tel: 212 869 7440/jacm4、738B0012 ISSN 0022-0000 IF:0、661 “*”Journal of Computer and System Sciences. 《计算机与系统科学杂志》,1967. 6/yr. Academic Press Inc., Journal Subseription Fulfillment Dept., 6277 Sea Harbor Drive.Tel: 407 345 4040Fax: 407 363 9661E-mail: *************http://www.apnet.Con5、738B0018 ISSN 0360-0333 IF:0、641 “*”ACM Computing Surveys. 《美国计算机学会计算概观》,1969. 4/yr.Association for Computing Machinery, 1515 Broadway. 17th FL.,New York, NY 10036-5701, USA.Tel: 212 869 7440Fax: 212 944 1318/jacm6、738B0029-2 ISSN 1077-3142 IF:1、298Computer Vision and Image Undwestanding. 《计算机视觉与图像理解》1969. Academic Press Inc., Journal Subscription Fulfillment Dept., 6227 Sca Harbor Drive, Orlando,FL 32887-4900, USA.Tel: 407 345 4040Fax: 407 363 9661E-mail: *************7、738B0031 ISSN 0362-5915 IF:1、20 “*”ACM Transactions on Database System. 《美国计算机学会数据库系统汇刊》,1976. 4/yr. Association for Computing Machinery. 1515 Broadway,17th FL., New York, NY 10036-5701. USA.Tel: 212 869 7440Fax: 212 944 1318/jacm8、738B0033 ISSN 0164-0925 IF:0、950 “*”ACM Transactions on Programming Languages & Systems. 《美国计算机学会程序设计语言与系统汇刊》,1979. 6/yr.Association for Computing Machinery. 1515 Broadway, 17th FL.,New York NY 10036-5701. USA.Fax: 212 944 1318/jacm9、738B0040 ISSN 0730-0301 IF:1、88 “*”ACM Transactions on Graphics. 《美国计算机学会图形学汇刊》,1982. 4/yr. Association for Computing Machinery.1515 Broadway, 17th FL., New York, NY 10036-5701, USA.Fax: 212 944 1318/jacm10、738B0045 ISSN 1046-8188 IF:2、036 “*”ACM Transactions on Information Systems. 《美国计算机学会信息系统汇刊》,1983. 4/yr. Association for Computing Machinery. 1515 Broadway.17th FL. New York. NY 10036-5701 USA.Fax: 212 944 1318/jacm11、738B0046 ISSN 0734-2071 IF:1、238 “*”ACM Transactions on Computer Systems. 《美国计算机学会计算机系统汇刊》,1983. 4/yr. Association for Computing Machinery. 1515 Broadway.17th FL. New York. NY 10036-5701 USA.Fax: 212 944 1318/jacm12、738B0224 ISSN 0098-3500 IF:0、649 “*”ACM Transations on Mathematical Software. 《美国计算机学会数学软件汇刊》,1975. 4/yr. Association for Computing Machinery. 1515 Broadway.17th FL. New York. NY 10036- 5701 USA.Tel: 212 869 7440Fax: 212 944 1318/jacm13、738B0488 ISSN 0743-7315 IF:0、353Journal of Parallel and Distributed Computing. 《并行与分布式计算杂志》,1984. 12/yr. Academic Press Inc., Journal SubscriptionFulfillment Dept., 6277Sea Harbor Drive, Orlando, FL32887-4900, USATel: 407 345 4040Fax; 407 363 9661E-mail: *************14、738B0494 ISSN 0743-1066 IF:0、819 “*”Journal of Logic Programming. 《逻辑程序设计杂志》,1984. 12/yr.Elsevier Science Inc., Regional Sales Office, Customer Support Department, Po Box 945, New York, NY 10159-0945, USA.Fax: 212 633 3680E-mail: *******************http://www.elsevier.nl/15、738B0514 ISSN 0738-4602 IF:1、286 “*”AI Magazine. ( Artificial Intelligence ). 《人工智能杂志》,1979. 4/yr.American Association For Artificial Intelligence, 445 Burgess Dr.,Menlo Park, CA94025, USA.Fax: 415 321 445716、738B0547 ISSN 0884-8173 IF:0、398 “*”International Journal of Intelligent Systems. 《国际智能系统杂志》,1986. 12/yr. John Wiley & Sons Inc., Subscription Department,605 Third Avenue, New York, NY 10158-0012, USA.Fax: 212 850 6021E-mail: ******************17、738B0548 ISSN 0178-4617 IF:0、477 “*”Algorithmica: A International Journal in Computer Science. 《算法》,1986. 12/yr. Springer-Verlag New York Inc.,175 Fifth Ave., New York, NY 10010, USA.Fax: 212 473 6272E-mail: **********************/journals/45318、723B0578 ISSN 1094-3420 IF:0、833International Journal of High Performance Computing Application. 《高性能计算应用国际杂志》,1987. 4/yr. Sage Publications Inc.,2455 Teller Road, Thousand Oaks, CA 91320, USA.Tel: 805 499 0721Fax: 805 499 0871E-mail: *********************19、738B0663 ISSN 0899-7667 IF:2、727Neural Computation. 《神经计算》,1989. 8/yr. MIT Press Journal Department, 5 Cambridge Center, Cambridge, MA 02142-1399, USA.Tel: 617 253 2889Fax: 617 577 1545E-mail: ***********************20、738B0703 ISSN 0896-8438 IF:0、886 “*”Journal of Object-Oriented Programming. 《面向对象程序设计杂志》,1988. 9/yr. Sigs Publications Inc., 71 W. 23rd St.,New York, NY 10010-4102, USA.Tel: 212 242 7447Fax: 212 242 7574E-mail: **********************21、738B0705 ISSN 1044-7318 IF:0、359International Journal of Human-Computer Interaction. 《国际人与计算机相互作用杂志》,1989. 4/yr. Lawrence Erlbaum Associates Inc., Journal Customer Service Dept., 10Industrial Ave., Mahwah, NJ 07430-2262 USA.Tel: 201 236 9500Fax: 201 236 0072E-mail: ******************22、738B0780 ISSN 0028-3045 IF:0、368Networks. 《网络》,1971. 8/yr. John Wiley & Sons Inc,605 Third Ave, New York, NY, 10158-0012.ask.ca/ejournals23、738B0788 ISSN 1054-7460 IF:1、544Presence: Teleoperators and Virtual Environments. 《存在:远程操作设备与虚拟环境》,1992. 6/yr. MIT Press, Journals Department,5 Cambridge Center, Cambridge, MA 02142-1399, USA.Tel: 617 253 2889Fax: 617 577 1545E-mail: ***********************24、738B0798 ISSN 1049-331X IF:0、889 “*”ACM Transactions on Software Engineering and Methodology. 《美国计算机学会软件工程与方法论汇刊》,1992. 4/yr. Association for Computing Machinery, 1515 Broadway, 17th FL., New York, NY 10036-5701, USA.Tel: 212 869 7440Fax: 212 944 1318/jacm25、738B0899 ISSN 1063-293X IF:0、353 “*”Concurrent Engineering Research and Applications. 《并行工程研究与应用》,4/yr. Managing Editor: Biren Prasad, Ph. D.,International Institute of Concurent Engineering, CETEAM JournalDepartment, Po Box, 3882, Tustin, CA 92782, USA.Tel: (714) 389 2662Fax: (714) 389 2662E-mail: ****************/26、738C0017 ISSN 0305-0548 IF:0、031Computers & Operations Research. 《计算机与运筹学研究》,14/yr.Editor: G. Laporte, HEC, Montreal, Canada.E-mail: *********************.ca/wps/find/science/journal/27、738C0019 ISSN 0097-8485 IF:1、632 “*”Computer & Chemistry. 《计算机与化学》,1974. 6/yr.Elsevier Science, Regional Sales Office, Customer Support Department, Po Box 211, 1000 AE Amsterdam, The Netherlands.Tel: (31) 20 485 3757Fax: (31) 20 485 3432E-mail: nlinfo-f@elsevierhttp://www.elsevier.nl28、738C0022 ISSN 0098-3004 IF:0、424 “*”Computers & Geosciences. 《计算机与地学》,1957. 10/yr. CustomerSupport Department, Po Box 211, 1000 AE Amsterdam, The Netherlands.Tel: (31) 20 485 3757Fax:(31) 20 485 3432E-mail: ********************http://www.elsevier.nl29、738C0028 ISSN 1367-4803 IF:3、421Bioinformatics. 《生物信息学》,1984. 12/yr.Oxford University Press. Journal SubscriptionsDepartment, Great Clarendon Street, Oxford, OX2 6DP, UK.Fax: (01865) 267 485E-mail: *****************.uk/journalsBarbara Cox, Embl-Ebi, Hinxlon, Cambridge Cb10 1sd, UK./30、738C0030 ISSN 0747-7171 IF:0、525Journal of Symbolic Computation. 《符号与计算杂志》,1985. 12/yr. Harcourt Brace & CO. Ltd.,Foots Cray High Street, Sidcup, Kent DA14 5HP, UKFax: (0181) 309 0807E-mail: ****************.uk31、738C0065 ISSN 0031-3203 IF:1、353 “*”Pattern Recognition. 《图形识别》,1969. 12/yr. Elsevier Science,Regional Sales Office, Customer Support Department,Po Box 211, 1000 AE Amsterdam, The Netherlands.Tel: (31) 20 485 3757E-mail: *******************http://www.elsevier.nl32、738C0067 ISSN 0010-4485 IF:1、048Computer-Aided Design. 《计算机辅助设计》,1968. 14/yr.Elsevier Science, Regional Sales Office, Customer Support Department, Po Box 211, 1000 AE Amsterdam, The Netherlands.Tel: (31) 20 485 375733、738C0070 ISSN 0045-7949 IF:0、418 “*”Computers & Structures. 《计算机与结构》,1971. 24/yr.K. J. Bathe, Department of Mechanical Engineering,Massachusetts Institute of Technology, Cambridge, MA 02139-4307, USA.Tel: 1 617 923 3407Fax: 1 617 923 3408C. H. V. Topping, Department of Mechanics and Chemical Engineering, Heriot-Watt University, Riccarton, Edinburgh EH14 4AS, UK.Fax: 44 (0) 131 451 3593http://www.elsevier.nl34、738C0073 ISSN 0045-7906 IF:0、105 “*”Computers & Electrical Engineering. 《计算机与电工》,1973. 6/yr.Elsevier Science, Regional Sales Office, Customer Support Department, Po Box 211, 1000 AE Amsterdam, The Netherlands.Tel: (31) 20 485 3757Fax: (31) 20 485 3432E-mail: ********************http://www.elsevier.nl35、738C0074 ISSN 0045-7930 IF:0、679 “*”Computers & Fluids. 《计算机与流体》,1973. 8/yr.Elsevier Science, Regional Sales Office, Customer Support Department, Po Box 211, 1000 AE Amsterdam, The Netherlands.Tel: (31) 20 485 3757Fax: (31) 20 485 3432E-mail: ********************http://www.elsevier.nl36、738C0081 ISSN 0898-1221 IF:0、383 “*”Computers & Mathematics with Applications. 《计算机与数学及其应用》1974. 24/yr. Elsevier Science, Regional Sales Office,Customer Support Department, Po Box 211,1000 AE Amsterdam, The Netherlands.Tel: (31) 20 485 3757Fax: (31) 20 485 3432E-mail: ********************http://www.elsevier.nl37、738C0093 ISSN 0306-4379 IF:3、018 “*”Information System. 《信息系统》,1975. 8/yr. Elsevier Science,Regional Sales Office, Customer Support Department, Po Box 211,1000 AE Amsterdam, The Netherlands.Fax: (31) 20 485 3432E-mail: ********************http://www.elsevier.nl38、738C0153 ISSN 0950-7051 IF:0、275 “*”Knowledge-Based Systems. 《知识库系统》,1987. 4/yr.Elsevier Science Bv, Po Box 211, Amsterdam, The Netherlands, 1000 Ae.http://www.elsevier.nl/inca/publications/store/5/2/5/4/4/8/39、738C0164 ISSN 0269-8889 IF:0、707 “*”Knowledge Engineering Review. 《知识工程评价》,1986. 4/yr.118. 00/GBP Cambridge University Press,The Edinburgh Building, Shaftesbury Road, Cambridge CB2 2RU, UK.Fax: (0223) 315 052E-mail: journals *********************40、738C0177 ISSN 0954-0091 IF:0、964Connection Science. 《连接科学》,1989. 4/yr Carfax Publishing Ltd.,Po Box 25, Abingdon, Oxford Shire, OX14 3UE, UK.Fax: (01235) 401 550E-mail: ***************.uk41、738C0181 ISSN 0954-898X IF:1、333Network: Computation in Neural Systems. 《网络:神经系统计算》,1990. 4/yr. Iop Publishing Ltd, Dirac House,Temple Back, Bristol, England, Bs1 6be./EJ/journal/0954-898X42、738C0192 ISSN 1045-926X IF:0、431Journal of Visual Languages and Computing. 《视觉语言与计算杂志》,1990. 6/yr. Harcourt Brace & Co. Ltd.,Foots Cray High Street, Sidcup, Kent DA14 5HP, UK.Fax: (0181) 309 0807E-mail: ****************.uk43、738C0199 ISSN 1049-8907 IF:0、487Journal of Visualization and Computer Animation. 《显像与计算机动画片制作杂志》,1990. 4/yr. John Wiley & Sons Ltd., Journal Administration,1 Oldlands Way, Bognor Regis, West Sussex PO22 9SA, UK.E-mail: ********************.uk44、738E0032 ISSN 0943-4962 《多媒体系统》,IF:1、290Multimedia Systems. (Text in English). 1993. 6/yr.Spring-Verlag, Heidelberger Platz 3, D-14197 Berlin, Germany.Fax: (030) 827 87 448E-mail: *************************http://www.springer.de45、738GL069 ISSN 0217-5959 IF:0、031ASIA-PACIFIC Journal of Operational Research. 《亚太操作研究杂志》2/yr. Editors: Assoc. Prof. G. Y. Zhao Department of Mathematics,National University of Singapore, Singapore..sg/ORSS/apjor.html46、738KA001 ISSN 0332-7353 IF:0、500Modeling Identification and Control. 《建模、识别与控制》,1980. 4/yr.Mic, Div Eng Cybernetics, Trondheim, Norway, 7034.47、738LB002 ISSN 0010-4655 IF:1、082Computer Physics Communications. 《计算机物理学通讯》,1969. 15/yr.Elsevier Science Bv, Po Box 211, Amsterdam, The Netherlands, 1000 Ae /inca/publications/store/5/0/5/7/1/0/48、738LB003 ISSN 0004-3702 IF:1、683Artificial Intelligence. 《人工智能》,1970. 18/yr.Elsevier Science B. V., Trade Relations Department,Po Box 211, 1000 AE Amsterdam, The Netherlands.Fax: 31 20 6854171E-mail: ********************http://www.elsevier.nl49、738LB004 ISSN 0304-3975 IF:0、468 “*”Theoretical Computer Science. 《理论计算机科学》,1975. 40/yr.Elsevier Science B. V., Trade Relations Department,Po Box 211, 1000 AE Amsterdam, The Netherlands.Tel: 31 20 5153210Fax: 31 20 6854171E-mail: ********************http://www.elsevier.nl50、738LB017 ISSN 0924-9907 IF:0、780 “*”Journal of Mathematical Imaging and Vision. 《数学成像与显示杂志》1991. 6/yr. Kluwer Academic Publishers, Journals Department,Distribution Centre, Po Box 322, 3300 AH Dordrecht, The Netherlands.Tel: 31 78 6392392Fax: 31 78 6546474E-mail: *****************51、738LB061 ISSN 0166-5316 IF:0、629 “*”Performance Evaluation. 《性能评价》,1981. 16/yr. Elsevier ScienceB. V., Trade Relations Department,Po Box 211, 1000 AE Amsterdam, The Netherlands.Tel: 31 20 5153210Fax: 31 20 6854171E-mail: ********************;www.elsevier.nl52、738LB073 ISSN 0167-9236 IF:0、781 “*”Decision Support Systems. 《决策支持系统》,11/yr.Editor-in-Chief: A. Whinston, MSIS Department,CBA 5-202, University of Texas, Austin, TX 78712-1175, USA./wps/find53、738LB076 ISSN 0167-8396 IF:0、929 “*”Computer-Aided Geometric Design. 《计算机辅助几何设计》,1984.9/yr. Elsevier Science B. V., Trade Relations Department,Po Box 211, 1000 AE Amsterdam, The Netherlands.Tel: 31 20 5153210E-mail: ********************http://www.elsevier.nl54、738LB087 ISSN 0885-6125 IF:1、476 “*”Machine Learning. 《机器学习》,1986. 12/yr.Kluwer Academic Publishers, Journals Department, Distribution Centre, Po Box 322, 3300 AH Dorderecht, The Netherlands.Tel: 31 78 6392392E-mail: *****************55、738LB088 ISSN 0920-5691 IF:1、600 “*”International Journal of Computer Vision. 《国际计算机视觉杂志》,1987. 15/yr. Kluwer Academic Publishers, Journals Department,Distribution Centre, Po Box 322, 3300 AH Dordrecht, The Netherlands.Fax: 31 78 6546474E-mail: *****************56、738LB092 ISSN 0921-8542 IF:0、130 “*”Journal of Supercomputing. 《高超速计算机杂志》,1987. 4/yr.Kluwer Academic Publishers, Journals Department, Distribution Centre, Po Box 322, 3300 AH Dordrecht, The Netherlands.Tel: 31 78 6392392Fax: 31 78 6546474E-mail: *****************57、738LB100 ISSN 0924-669X IF:0、493 “*”Applied Intelligence. 《应用智能》,1991. 6/yr. 900. 00/NLG KluwerAcademic Publishers, Journals Department, Distribution Centre,Po Box 322, 3300 AH Dordrecht, The Netherlands.Tel: 31 78 6546471E-mail: *****************58、738LB122 ISSN 0262-8856 IF:0、893Image and Vision Computing. 《图像与视觉计算》,1983. 14/yr.Elsevier Science B. V., Trade Relations Department,Po Box 211, 1000 AE Amsterdam, The Netherlands.Tel: 31 20 5153210E-mail: ********************/inca/publications/store/5/2/5/4/4/3/index.htthttp://www.elsevier.nl59、738LB128 ISSN 1384-5810 IF:1、407Data Mining and Knowledge Discovery. 《数据挖掘与知识发现》,1997.4/yr. Kluwer Academic Publishers, Journals Department, Distribution Centre, Po Box 322, 3300 AH Dordrecht, The Netherlands.Fax: 31 78 6546474E-mail: *****************60、738LE051 ISSN 0010-485X IF:0、667 “*”Computing. (Text in English). 《计算》,8/yr. Springer-VerlagWien, Sachsenplatz 4-6, Postfach 89, A-1201 Wien, Austria.Fax: (0043/1) 3 30 24 2661、738 ISSN 0004-5411 IF:1、078Journal of the ACM. 《美国计算机学会志》,4/yr.Assoc Computing Machinery, 1515 Broadway, New York, NY, 10036./jacm/62、738 ISSN 0018-9162 IF:1、062Computer. 《IEEE计算机杂志》,12/yr.IEEE Computer Soc, 10662 Los Vaqueros Circle,Po Box 3014, Los Alamitos, CA, 90720-1314.二、《EI》收录的外文期刊:1、738B0029-1 ISSN 1049-9652CVGIP:Graphical Models and Image Processing. 《计算机视觉、图示与图像处理:制图模型与图像处理》,1969. 6/yr. Academic Press, Inc.,Journal Subscription Fulfillment Dept., 6277 Sea Harbor Drive,Orlando, FL 32887-4900, USA.Fax: 407-363-96612、738B0029-2 ISSN 1077-3169Graphical Models and Image Processing. 《制图模型与图像处理》,1969.6/yr. Academic Press Inc., USA.Editors-in-Chief: Norman I. Badler and Rama Chellappa.E-mail: ***************/newjour/g/mag02304.html(as CVGIP: Graphical Models and Image Processing. 1049-9652)3、738B0052 ISSN 0011-6963Datamation. 《数据处理》,1955. 24/yr.275 Washington St., Newton, MA 02158, USA.Fax: 303-398-7691.4、738B0067 ISSN 0010-4566Computer Design. 《计算机设计》,1962. 12/yr. Computer Design,Circulation Department, Box 3466, Tulsa, OK 74101, USA.5、738B0079 ISSN 0018-8670IBM Systems Journal. 《国际商用机器公司系统杂志》,1962. 4/yr.International Busimess Machines Corp., USA. Editor: Cene Hofinagle.E-mail: *******************.com/newjour/i/msg02405.html6、738B0100 ISSN 0037-5497Simulation. 《仿真》,1963. 12/yr. Society for Computer Simulation,Box 17900, San Diego, CA 92117, USA.Editor:Vice-President, SCS Publications, Robert Judd, PhD, Ohio University.E-mail: *****************//pubs/siminfo.html7、738B0223 ISSN 0882-1666Systems and Computers in Japan. 《日本系统与计算机》,1970. 14/yr. 1229. John Wiley & Sons, Inc., P. O. Box 836,Bound Brook, NJ 08805, USA.Fax: 03-3556-9763.E-mail: ****************.ne.jp/jpages/0882-16668、738B0288 ISSN 0360-5280Byte. 《字节》,1975. 12/yr. McGraw-Hill Companies, Inc., P. O. 1221Avenue of the Americas, New York, NY 10020, USA.9、738B0100 ISSN 0037-5497Simulation. 1963. 12/yr. Society for Computer Simulation, Box 17900, San Diego, CA 92117, USA. Editor: Vice-President, SCS Publications, Robert Judd, PhD, Ohio University.E-mail: *****************//pubs/siminfo.html10、738B0291 ISSN 0146-5422Online. 《联机》,6/yr. Online Inc.462 Danbury Road, Wilton, CT 06897-2126, USA.11、738B0292 ISSN 0363-6399Data Communications. 《数据通信》,1972. 12/yr.McGraw-Hill Companies, Inc., P. O.1221 Avenue of the Americas, New York, NY 10020, USA.12、738B0309 ISSN 0162-4105Database. 《数据库》,1978. 6/yr. 1970. Bonanza Drive,Suite 219, P. O. Box 70, Park City, UT 84060, USA.13、738B0318 ISSN 0164-1212Journal of Systems & Software. 《系统与软件杂志》,Elsevier ScienceInc.,655 Avenue of the Americas, New York, NY 10010, USA.Fax: 212-633-376414、738B0325 ISSN 0702-0481International Journal of Mini and Microcomputers. 《国际小型与微计算机杂志》,1979. 3/yr. Editor-in- Chief: Dr. B. Furht,Dep. Of Computer Sci. & Eng. Florida AltanticUniversity, Boca Raton, FL 33431, USA.15、738B0337 ISSN 0820-0750Microcomputer Applications. 《微机应用》,1982. 3/yr.ISMM, P. O. Box 2481, Anaheim, CA 92814, USA.16、738B0346 ISSN 0277-0865Computer Security Journal. 《计算机安全杂志》,1981. 2/yr. Computer Security Institute, 600 Harrisan St., San Francisco, CA 94107, USA.E-mail: ***********/17、738B0360 ISSN 1044-789XDr. Dobb’s Journal. 《多布氏杂志》,1976. 12/yr. M & T Publishing,Inc., 501 Galveston Dr., Redwood City, CA 94063, USA.18、738B0405 ISSN 0737-8939PC World. 《个人计算机世界》,1982. 12/yr. PCW Communications, Inc., 501 Second St., 600, San Francisco, CA 94107, USA.19、738B0407 ISSN 0271-4159Computer Graphics World. 《计算机图学界》,1978. 12/yr.PennWell Publishing Co., 1421 South Sheridan,P. O. Box 1260, Tulsa, OK 74101, USA./home/home.cfm20、738B0485 ISSN 0740-6797Transactions of the Society for Computer Simulation. 《计算机仿真学会汇刊》,1984. 4/yr. Society for Computer Simulation.Box 17900, San Diego, CA 92117, USA./pubs/transinfo.htm/21、738B0513 ISSN 0278-9647Computer Technology Review; The Systems Integration Sourcebook.《计算机技术评论》,1981. 16/yr. West World Pioductions, Inc.924 Westwood Blvd., 650, Los Angeles, CA 90024, USA.22、738B0536 ISSN 0742-3136UNIX Review. 《UNIX评论》,1983. 12/yr. 1 Miller FreemanPublication Co., 600 Harrison St., San Francisco, CA 94107, USA.23、738B0556 ISSN 0883-9514Applied Artificial Intelligence. 《应用人工智能》,1986. 4/yr. Taylor &Francis / Hemisphere,1900 Frost Rd., Suite 101, Bristol, PA 19007, USA.24、738B0557 ISSN 0885-7474Journal of Scientific Computing. 《科学计算杂志》,1986. 4/yr.Plenum Publishing Corp., 233 Spring St.,New York, NY 10013-1578, USA.Fax: 212-807-104725、738B0584 ISSN 1094-3420International Journal of High Performance Computing Application.《高性能计算应用国际杂志》,1987. 4/yr. 96pp. 12k.282.00/USD Sage Publications Inc., USA.26、738B0589 ISSN 0894-9077International Journal of Expert Systems. 《国际专家系统杂志》,1987.4/yr. JAI Press, Inc., 55 Old Post Rd.,No. 2, P. O. Box 1678, Greenwich, CT 06836, USA.Fax: 203-661-079227、738B0604 ISSN 0895-6340Computing Systems. 《计算系统》,1988. 4/yr. University of CaliforniaPress,Periodical Dept., 2120 Berkeley Way,Berkeley, CA 94720, USA.Fax: 415-643-7127.Edit: Usenix Association & EUUG.28、738B0658 ISSN 1045-389XJournal of Intelligent Material Systems and Structures. 《智能材料系统与结构杂志》,1990 4/yr. Technomic Publishing Co., Inc.,851 New Holland Ave., Box 3535, Lancaster, PA 17604, USA.Fax: 717-295-453829、738B0702 ISSN 1043-6464Journal of End User Computing. 《最后用户计算杂志》,1989. 4/yr.112. 00/USD Idea Group Publishing, Olde Liberty Square, Suite 230, 4811 Jonestown Rd., Harrisburg, PA 17109, USA.Edit: Information Resources Management Association.30、738B0736 ISSN 1050-1827International Journal of Microwave and Millimeter-Wave Computer-Aided Engineering. 《国际微波与毫米波计算机辅助工程杂志》,1991. 4/yr.John Wiley & Sons, Inc., P. O. Box 836, Bound Brook, NJ 08805, USA.Fax: 212-850-608831、738B0741 ISSN 1049 3301ACM Transactions on Modeling and Computer Simulation. 《美国计算机学会模型建立与计算机仿真汇刊》,1991. 4/yr. Association forComputing Machinery, P. O. Box 12105, Church StreetStation, New York, NY 10249, USA.Fax: 212-944-131832、738B0766 ISSN 0748-0016Personal Engineering and Instrumentation News. 《个人计算机工程与设备新闻》,1984. 12/yr. PEC Inc., Sales Office,Box 152, Pine Brook, NJ 07058, USA.Fax: 201-808-016733、738B0778 ISSN 0228-6203International Journal of Modeling & Simulation. 《国际模式与仿真杂志》,1981. 4/yr. IASTED,P. O. Box 2481, Anaheim, CA 92814-2481, USA.34、738B0779 ISSN 1058-9244Scientific Programming: Tools & Techniques. 《科学程序设计》,1991.4/yr.John Wiley & Sons, Inc., P. O. Box 836,Bound Brook, NJ 08805, USA.Fax: 212-850-608835、738B0782 ISSN 0824-7935Computational Intelligence. 《计算智能》,1985. 4/yr.Blackwell Scientific Publications, Inc., Three Cambridge Center,Cambridge, MA 02142, USA.36、738B0826Winter Simulation Conference Proceedings. 《冬季仿真会议录》,1/yr.125. 00/USD Society for Computer Simulation,Box 17900, San Diego, CA 92117, USA.37、738B0851 ISSN 1064-7570Journal of Network and Systems Management. 《网络与系统管理杂志》,1993. 4/yr. Plenum Publishing Corp.,233 Spring St., New York, NY10013-1578, USA.Fax: 212-807-104738、738B0918 ISSN 1042-0711Mainframe Computing. 《主机计算》,1988. 12/yr.E-mail: *****************39、738C0005 ISSN 0010-4531Computer Bulletin. 《计算机通报》,4/yr. The British Computer Society1 Sanfrod Street Swindon SN1 1HJ, UK40、738C0011 ISSN 1351-3249Natural Language Engineering. 《自然语言工程》,1995. 4/yr.Cambridge University Press,UK/newjour/n/msg02371.html41、738C0017 ISSN 0305-0548Computers & Operations Research. 《计算机与运筹学》,1974. 8/yr.Editor: Jesus R. Arralejo Faculatad de Matematics,Dept de Estadistica e I. O., Universidad Complutense de Madrid,Madrid 28040, Spain.Editor: Samuel J. Raff, 8312 Snug Hill Lane, Potomac, MD 20854, USA.E-mail: *******************.ukhttp://www.elsevier.nl/inca/publications/store/3/0/0/42、738C0018 ISSN 0038-0644Software: Practice & Experience. 《软件;实践与经验》,1974. 15/yr.575. 00/USD John Wiley & Sons Ltd.,1 Oklands Way, Bognor Regis, West Sussex P. O. 22, 9SA, UK.43、738C0020 ISSN 0098-1354Computers & Chemical Engineering. 《计算机与化工》,1977. 12/yr.Editor-in-Chief: G. V. Reklaitis, School of Chemical Engineering,CHME Building 1283, West Lafayette, Purdue University, IN 47907, USA.E-mail: *************************http://www.elsevier.nl/inca/publications/store/3/4/9/44、738C0023 ISSN 0360-8352Computers & Industrial Engineering. 《计算机与工业工程》,1976. 8/yr.Editor: Mohamed I. Dessouky,Ph. D., P. E. Research Professor, Dept. Of Industrial & Systems Eng’g., University of Southem California, University Park-MC 0193, LosAngeles, CA, 90089-0193. USA.E-mail: ****************.eduhttp://www.umoncton.ca/cie/index.html45、738C0026 ISSN 0275-9136Engineering Simulation. 《工程模拟》,6/yr. STBS Ltd.,Order Department, P. O. Box 90, Rerkshire Rg1 8JL, UK.Fax: 0734-568211.46、738C0029 ISSN 0747- 5632Computers in Human Behavior. 《计算机在人类行为中的应用》,1985.4/yr. 18k, 180. 00/GBP Editorial Office: Robert D Tennyson Dept.Of Educational Psychology, 211A Burton Hall, 178 PillsburyDr., S. E., University of Minnesot Minneapolis, MN 55455, USA.47、738C0031 ISSN 0267-6192Computer Systems Science and Engineering. 《计算机系统科学与工程》,1985. 6/yr. Editor: Wil van Der Aalst,Department of Mathematics and Computing Science, EindhovenUniversity of Technology, P. O. Box 513, NL-5600 MB, Eindhoven,The Netherlands.E-mail: **************.nlhttp://wwwis.win.tue.nl/~wsinwa/csse_special_issue.html48、738C0033 ISSN 0167-7055Computer Graphics Forum. 《计算机图形学论坛》,1982. 4/yr.Editor: David Duke, Department of Mathematical Sciences,University of Bath, UK.E-mail: **************/EG/Publications/CGF49、738C0034 ISSN 1077-2014Real-Time Imaging. 《实时成像》,1995. 6/yr.Harcourt Brace & Co. Ltd., UK. Editors: Phillip A.Laplant and Alrxander D. Stoyenko.E-mail: ***************/newjour/r/msg02194.html50、738C0089 ISSN 0096-0551Computer Languages. 《计算机语言》,1976. 8/yr.c/o National Biomedical Foundation, Georgetown University Medical Center, 3900 Resservoir Road, N. W., Washington, DC20007, USA.51、738C0092 ISSN 0198-9715Computers, Environment and Urban Systems. 《计算机、环境与城市系统》,1975. 6/yr. Editor: P. Longley,Centre for Advanced Spatial Analysis, University College London,1-19 Torrington Place, London, WCIE 6BT.E-mail: *******************.ukhttp://www.elsevier.nl/inca/publications/store/3/0/4/52、738C0103 ISSN 0141-9331Microprocessors and Microsystems. 《微处理机与微型系统》,1978, 10/yr.Hardware Systems and North American Editor: A. K. Somani,Dept. Of Electrical & Computer Engineering, 223 Coover Hall,Iowa State University, Ames, IA 50011, USA.E-mail: ****************Software Editor: J. E. Cooling, 35 Croftway, Markfield,Leicestershire, LE67 9UG, UK.E-mail: *********************.comSection Coordinating Editor Chip ARCHITECTURES: p. W. Thompson,Degree 2 Innovations Ltd. University Gate, Park Row, Bristol BS1 5UB. UK.E-mail: **************************http://www.elsevier.nl/inca/publications/store/5/2/5/4/4/9/53、738C0106 ISSN 0140-3664Computer Communications. 《计算机通讯》,1978. 12/yr.Editor: J. B. Thompson, Troubador Publishing Ltd.,12 Manor Walk, Coventry Road, Market Harborough,Leicester LE16 9PB, UK.E-mail: ************************http://www.elsevier.nl/locate/comcom54、738C0109 ISSN 0965-9978Advances in Engineering Software. 《工程软件进展》,1978. 8/yr.Editors: R. A. Adey, Wessex Institute of Technology,Ashurst Lodge, Ashurst, Southampton SO40 7AA,UK.Fax: 44-1703-292-853E-mail: *******************N. Kamiya, Department of Informatics & Natural Sciences, School ofInformatics and Sciences, Nagoya University, Chikusa-ku, Nagoya 464-01, Japan.A. K. Noor, University of Virginia, Mail Stop 369, NASA Langley Research Center, Hampton, VA 23681, USA.Fax: 1-804-864-8089E-mail: ******************.govhttp://www.elsevier.nl/inca/publications/store/4/2/2/9/1/1/。

天线变形曲面的一种拟合方法
华慕麟
【期刊名称】《现代雷达》
【年(卷),期】1994(16)1
【摘要】各种雷达天线、卫星通信地面站天线的实际反射面都是变形曲面。
这种
变形曲面可以是具有一定制造误差的反射面,也可以是设计曲面在设计载荷作用下的变形反射面。
对变形曲面通过计算求其最佳拟合(又称吻合)曲面作为理想曲面,可以提高变形曲面的精度,从而达到降低成本、改善性能的效果。
本文介绍一种从最小二乘法原理出发求取最佳拟合曲面(包括平面)的方法,该方法实用、规范且思路清晰。
【总页数】8页(P75-82)
【关键词】天线反射面;曲面拟合;天线
【作者】华慕麟
【作者单位】南京电子技术研究所
【正文语种】中文
【中图分类】TN82
【相关文献】
1.大型天线变形反射面的新拟合方法 [J], 王从思;段宝岩;仇原鹰
2.Coons曲面结合B样条拟合大型面天线变形反射面 [J], 王从思;段宝岩;仇原鹰
3.变形面天线的分块Coons拟合方法 [J], 王从思;段宝岩;仇原鹰
4.一种改进的移动曲面拟合DEM插值方法 [J], 黄长军;夏红梅;周吕
5.一种多尺度拟合曲面的LiDAR数据建筑物脚点提取方法 [J], 陈亚伟;张良;马海池
因版权原因,仅展示原文概要,查看原文内容请购买。
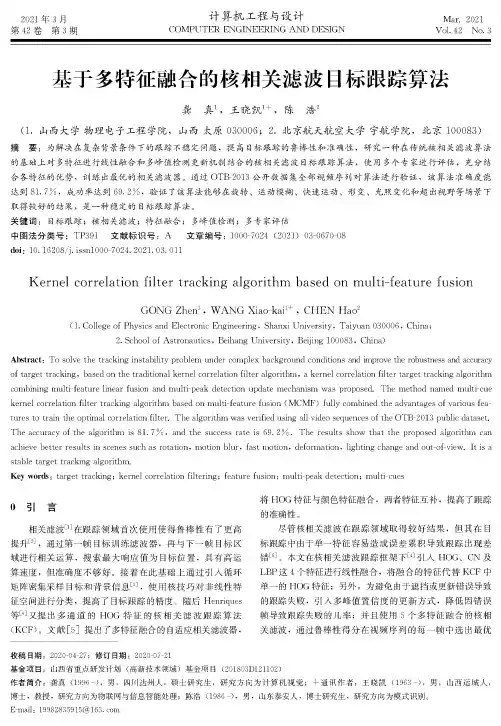
2021年3月计算机工程与设计Mar.2021第42卷第3期COMPUTER ENGINEERING AND DESIGN Vl42No.3基于多特征融合的核相关滤波目标跟踪算法龚真s王晓凯1+,陈浩2(1.山西大学物理电子工程学院,山西太原030006; 2.北京航天航空大学宇航学院,北京100083)摘要:为解决在复杂背景条件下的跟踪不稳定问题,提高目标跟踪的鲁棒性和准确性,研究一种在传统核相关滤波算法的基础上对多特征进行线性融合和多峰值检测更新机制结合的核相关滤波目标跟踪算法,使用多个专家进行评估,充分结合各特征的优势,训练出最优的相关滤波器。
通过OTB-2013O开数据集全部视频序列对算法进行验证,该算法准确度能达到81.7%,成功率达到69.2%,验证了该算法能够在旋转、运动模糊、快速运动、形变、光照变化和超出视野等场景下取得较好的结果,是一种稳定的目标跟踪算法。
关键词:目标跟踪;核相关滤波;特征融合;多峰值检测;多专家评估中图法分类号:TP391文献标识号:A文章编号:1000-7024(2021)03-0670-08doi:10.16208/j.issnl000-7024.2021.03.011Kernel correlation filter tracking algorithm based on multi-feature fusionGONG Zhen1,WANG Xiao-kai1+,CHEN Hao2(1.College of Physics and Electronic Engineering&Shanxi University,Taiyuan030006,China;2.School of Astronautics,Beihang University,Beijing100083,China)Abstract:To solve the tracking instability problem under complex background conditions and improve the robustness and accuracy of target tracking&based on the traditional kernel correlation filter algorithm&a kernel correlation filter target tracking algorithm combining multi-feature linear fusion and multi-peak detection update mechanism was proposed6The method named multi-cue kernel correlation filter tracking algorithm based on multi-feature fusion(MCMF)fully combined the advantages of various features to train the optimal correlation filter.The algorithm was verified using all video sequences of the OTB-2013public dataset. TheaccuracyofQhealgorihmis81.7%,andQhesuccessraQeis69.2%.TheresulsshowQhaQQheproposedalgorihmcan achieve better results in scenes such as rotation&motion blur,fast motion,deformation&lighting change and out-of-view.It is a stabletargettrackingalgorithm6Key words:target tracking;kernel correlation filtering;feature fusion;multi-peak detection;multi-cues1引言相关滤波m在跟踪领域首次使用使得鲁棒性有了更高提升也,通过第一帧目标训练滤波器,再与下一帧目标区域进行相关运算,搜索最大响应值为目标位置,具有高运算速度,但准确度不够好。
当前,计算机技术与网络技术得到了较快发展,计算机软件工程进入到社会各个领域当中,使很多操作实现了自动化,得到了人们的普遍欢迎,解放了大量的人力.为了适应时代的发展,社会各个领域大力引进计算机软件工程.下面是软件工程英文参考文献105个,供大家参考阅读。
软件工程英文参考文献一:[1]Carine Khalil,Sabine Khalil. Exploring knowledge management in agile software development organizations[J]. International Entrepreneurship and Management Journal,2020,16(4).[2]Kevin A. Gary,Ruben Acuna,Alexandra Mehlhase,Robert Heinrichs,Sohum Sohoni. SCALING TO MEET THE ONLINE DEMAND IN SOFTWARE ENGINEERING[J]. International Journal on Innovations in Online Education,2020,4(1).[3]Hosseini Hadi,Zirakjou Abbas,Goodarzi Vahabodin,Mousavi Seyyed Mohammad,Khonakdar Hossein Ali,Zamanlui Soheila. Lightweight aerogels based on bacterial cellulose/silver nanoparticles/polyaniline with tuning morphology of polyaniline and application in soft tissue engineering.[J]. International journal of biological macromolecules,2020,152.[4]Dylan G. Kelly,Patrick Seeling. Introducing underrepresented high school students to software engineering: Using the micro:bit microcontroller to program connected autonomous cars[J]. Computer Applications in Engineering Education,2020,28(3).[5]. Soft Computing; Research Conducted at School of Computing Science and Engineering Has Updated Our Knowledge about Soft Computing (Indeterminate Likert scale: feedback based on neutrosophy, its distance measures and clustering algorithm)[J]. News of Science,2020.[6]. Engineering; New Engineering Findings from Hanyang University Outlined (Can-based Aging Monitoring Technique for Automotive Asics With Efficient Soft Error Resilience)[J]. Journal of Transportation,2020.[7]. Engineering - Software Engineering; New Findings from University of Michigan in the Area of Software Engineering Reported (Multi-criteria Test Cases Selection for Model Transformations)[J]. Journal of Transportation,2020.[8]Tamas Galli,Francisco Chiclana,Francois Siewe. Software Product Quality Models, Developments, Trends, and Evaluation[J]. SN Computer Science,2020,1(2).[9]. Infotech; Infotech Joins BIM for Bridges and Structures Transportation Pooled Fund Project as an Official Software Advisor[J]. Computer TechnologyJournal,2020.[10]. Engineering; Study Findings from Beijing Jiaotong University Provide New Insights into Engineering (Analyzing Software Rejuvenation Techniques In a Virtualized System: Service Provider and User Views)[J]. Computer Technology Journal,2020.[11]. Soft Computing; Data on Soft Computing Reported by Researchers at Sakarya University (An exponential jerk system, its fractional-order form with dynamical analysis and engineering application)[J]. Computer Technology Journal,2020.[12]. Engineering; Studies from Henan University Yield New Data on Engineering (Extracting Phrases As Software Features From Overlapping Sentence Clusters In Product Descriptions)[J]. Computer Technology Journal,2020.[13]. Engineering; Data from Nanjing University of Aeronautics and Astronautics Provide New Insights into Engineering (A Systematic Study to Improve the Requirements Engineering Process in the Domain of Global Software Development)[J]. Computer Technology Journal,2020.[14]. Soft Computing; Investigators at Air Force Engineering University Report Findings in Soft Computing (Evidential model for intuitionistic fuzzy multi-attribute group decision making)[J]. Computer Technology Journal,2020.[15]. Engineering; Researchers from COMSATS University Islamabad Describe Findings in Engineering (A Deep CNN Ensemble Framework for Efficient DDoS Attack Detection in Software Defined Networks)[J]. Computer Technology Journal,2020.[16]Pedro Delgado-Pérez,Francisco Chicano. An Experimental and Practical Study on the Equivalent Mutant Connection: An Evolutionary Approach[J]. Information and Software Technology,2020.[17]Koehler Leman Julia,Weitzner Brian D,Renfrew P Douglas,Lewis Steven M,Moretti Rocco,Watkins Andrew M,Mulligan Vikram Khipple,Lyskov Sergey,Adolf-Bryfogle Jared,Labonte Jason W,Krys Justyna,Bystroff Christopher,Schief William,Gront Dominik,Schueler-Furman Ora,Baker David,Bradley Philip,Dunbrack Roland,Kortemme Tanja,Leaver-Fay Andrew,Strauss Charlie E M,Meiler Jens,Kuhlman Brian,Gray Jeffrey J,Bonneau Richard. Better together: Elements of successful scientific software development in a distributed collaborative community.[J]. PLoS computational biology,2020,16(5).[18]. Mathematics; Data on Mathematics Reported by Researchers at Thapar Institute of Engineering and Technology (Algorithms Based on COPRAS and Aggregation Operators with New Information Measures for Possibility Intuitionistic Fuzzy SoftDecision-Making)[J]. Journal of Mathematics,2020.[19]. Engineering - Medical and Biological Engineering; Reports from Heriot-Watt University Describe Recent Advances in Medical and Biological Engineering (A Novel Palpation-based Method for Tumor Nodule Quantification In Soft Tissue-computational Framework and Experimental Validation)[J]. Journal of Engineering,2020.[20]. Engineering - Industrial Engineering; Studies from Xi'an Jiaotong University Have Provided New Data on Industrial Engineering (Dc Voltage Control Strategy of Three-terminal Medium-voltage Power Electronic Transformer-based Soft Normally Open Points)[J]. Journal of Engineering,2020.[21]. Engineering; Reports from Hohai University Add New Data to Findings in Engineering (Soft Error Resilience of Deep Residual Networks for Object Recognition)[J]. Journal of Engineering,2020.[22]. Engineering - Mechanical Engineering; Study Data from K.N. Toosi University of Technology Update Understanding of Mechanical Engineering (Coupled Directional Dilation-Damage Approach to Model the Cyclic-Undrained Response of Soft Clay under Pure Principal Stress Axes Rotation)[J]. Journal of Engineering,2020.[23]. Soft Computing; Researchers from Abes Engineering College Report Details of New Studies and Findings in the Area of Soft Computing (An intelligent personalized web blog searching technique using fuzzy-based feedback recurrent neural network)[J]. Network Weekly News,2020.[24]. Engineering; Studies from University of Alexandria in the Area of Engineering Reported (Software Defined Network-Based Management for Enhanced 5G Network Services)[J]. Network Weekly News,2020.[25]. Soft Computing; Data on Soft Computing Discussed by Researchers at Department of Electrical and Communication Engineering [A metaheuristic optimization model for spectral allocation in cognitive networks based on ant colony algorithm (M-ACO)][J]. Computer Technology Journal,2020.[26]. Engineering - Software Engineering; Complutense University Madrid Reports Findings in Software Engineering (Recolibry Suite: a Set of Intelligent Tools for the Development of Recommender Systems)[J]. Computer Technology Journal,2020.[27]. Engineering - Software Engineering; Data on Software Engineering Reported by Researchers at Gautam Buddha University (A novel quality prediction model for component based software system using ACO-NM optimized extreme learning machine)[J]. Computer Technology Journal,2020.[28]. Soft Computing; New Soft Computing Study Findings Recently Were Reported by Researchers at University College of Engineering (A novel QIM-DCT based fusion approach for classification of remote sensing images via PSO and SVM models)[J]. Computer Technology Journal,2020.[29]Morshedloo Fatemeh,Khoshfetrat Ali Baradar,Kazemi Davoud,Ahmadian Mehri. Gelatin improves peroxidase-mediated alginate hydrogel characteristics as a potential injectable hydrogel for soft tissue engineering applications.[J]. Journal of biomedical materials research. Part B, Applied biomaterials,2020.[30]Jung-Chieh Lee,Chung-Yang Chen. Exploring the team dynamic learning process in software process tailoring performance[J]. Journal of Enterprise Information Management,2020,33(3).[31]. Soft Computing; Study Results from Velammal Engineering College in the Area of Soft Computing Reported (Efficient routing in UASN during the thermohaline environment condition to improve the propagation delay and throughput)[J]. Mathematics Week,2020.[32]. Soft Matter; Findings from School of Materials Science and Engineering Provide New Insights into Soft Matter (A practical guide to active colloids: choosing synthetic model systems for soft matter physics research)[J]. Physics Week,2020.[33]Julio César Puche-Regaliza,Alfredo Jiménez,Pablo Arranz-Val. Diagnosis of Software Projects Based on the Viable System Model[J]. Systemic Practice and Action Research,2020,33(1).[34]Meinert Edward,Milne-Ives Madison,Surodina Svitlana,Lam Ching. Agile requirements engineering and software planning for a digital health platform to engage the effects of isolation caused by social distancing: A case study and feasibility study protocol.[J]. JMIR public health and surveillance,2020.[35]. Engineering - Civil Engineering; Studies Conducted at Shandong Jianzhu University on Civil Engineering Recently Published (Seismic Response Analysis and Control of Frame Structures with Soft First Storey under Near-Fault Ground Motions)[J]. Journal of Engineering,2020.软件工程英文参考文献二:[36]Chao-ze Lu,Guo-sun Zeng,Ying-jie Xie. Bigraph specification of software architecture and evolution analysis in mobile computing environment[J]. Future Generation Computer Systems,2020,108.[37]Ompal Singh, Saurabh Panwar, P. K. Kapur.. Determining SoftwareTime-to-Market and Testing Stop Time when Release Time is a Change-Point[J]. International Journal of Mathematical, Engineering and Management Sciences,2020,5(2).[38]Ayushi Verma,Neetu Sardana,Sangeeta Lal. Developer Recommendation for Stack Exchange Software Engineering Q&A Website based on K-Means clustering and Developer Social Network Metric[J]. Procedia Computer Science,2020,167.[39]Jagdeep Singh,Sachin Bagga,Ranjodh Kaur. Software-based Prediction of Liver Disease with Feature Selection and Classification Techniques[J]. Procedia Computer Science,2020,167.[40]. Engineering - Software Engineering; Studies from Concordia University Update Current Data on Software Engineering (On the impact of using trivial packages: an empirical case study on npm and PyPI)[J]. Computer Technology Journal,2020.[41]. Engineering - Software Engineering; Study Findings from University of Alberta Broaden Understanding of Software Engineering (Building the perfect game - an empirical study of game modifications)[J]. Computer Technology Journal,2020.[42]. Engineering - Software Engineering; Investigators at National Research Council (CNR) Detail Findings in Software Engineering [A Framework for Quantitative Modeling and Analysis of Highly (Re)Configurable Systems][J]. Computer Technology Journal,2020.[43]. Engineering - Knowledge Engineering; Data from University of Paris Saclay Provide New Insights into Knowledge Engineering (Dynamic monitoring of software use with recurrent neural networks)[J]. Computer Technology Journal,2020.[44]. Engineering - Circuits Research; Findings from Federal University Santa Maria Yields New Data on Circuits Research (A New Cpfsk Demodulation Approach for Software Defined Radio)[J]. Computer Technology Journal,2020.[45]. Soft Computing; Investigators from Lovely Professional University Release New Data on Soft Computing (An intensify Harris Hawks optimizer for numerical and engineering optimization problems)[J]. Computer Technology Journal,2020.[46]. GlobalLogic Inc.; GlobalLogic Acquires Meelogic Consulting AG, a European Healthcare and Automotive-Focused Software Engineering Services Firm[J]. Computer Technology Journal,2020.[47]. Engineering - Circuits and Systems Research; Data on Circuits and Systems Research Described by Researchers at Northeastern University (Softcharge: Software Defined Multi-device Wireless Charging Over Large Surfaces)[J]. TelecommunicationsWeekly,2020.[48]. Soft Computing; Researchers from Department of Electrical and Communication Engineering Report on Findings in Soft Computing (Dynamic Histogram Equalization for contrast enhancement for digital images)[J]. Technology News Focus,2020.[49]Mohamed Ellithey Barghoth,Akram Salah,Manal A. Ismail. A Comprehensive Software Project Management Framework[J]. Journal of Computer and Communications,2020,08(03).[50]. Soft Computing; Researchers from Air Force Engineering University Describe Findings in Soft Computing (Random orthocenter strategy in interior search algorithm and its engineering application)[J]. Journal of Mathematics,2020.[51]. Soft Computing; Study Findings on Soft Computing Are Outlined in Reports from Department of Mechanical Engineering (Constrained design optimization of selected mechanical system components using Rao algorithms)[J]. Mathematics Week,2020.[52]Iqbal Javed,Ahmad Rodina B,Khan Muzafar,Fazal-E-Amin,Alyahya Sultan,Nizam Nasir Mohd Hairul,Akhunzada Adnan,Shoaib Muhammad. Requirements engineering issues causing software development outsourcing failure.[J]. PloS one,2020,15(4).[53]Raymond C.Z. Cohen,Simon M. Harrison,Paul W. Cleary. Dive Mechanic: Bringing 3D virtual experimentation using biomechanical modelling to elite level diving with the Workspace workflow engine[J]. Mathematics and Computers in Simulation,2020,175.[54]Emelie Engstr?m,Margaret-Anne Storey,Per Runeson,Martin H?st,Maria Teresa Baldassarre. How software engineering research aligns with design science: a review[J]. Empirical Software Engineering,2020(prepublish).[55]Christian Lettner,Michael Moser,Josef Pichler. An integrated approach for power transformer modeling and manufacturing[J]. Procedia Manufacturing,2020,42.[56]. Engineering - Mechanical Engineering; New Findings from Leibniz University Hannover Update Understanding of Mechanical Engineering (A finite element for soft tissue deformation based on the absolute nodal coordinate formulation)[J]. Computer Technology Journal,2020.[57]. Science - Social Science; Studies from University of Burgos Yield New Information about Social Science (Diagnosis of Software Projects Based on the Viable System Model)[J]. Computer Technology Journal,2020.[58]. Technology - Powder Technology; Investigators at Research Center Pharmaceutical Engineering GmbH Discuss Findings in Powder Technology [Extended Validation and Verification of Xps/avl-fire (Tm), a Computational Cfd-dem Software Platform][J]. Computer Technology Journal,2020.[59]Guadalupe-Isaura Trujillo-Tzanahua,Ulises Juárez-Martínez,Alberto-Alfonso Aguilar-Lasserre,María-Karen Cortés-Verdín,Catherine Azzaro-Pantel. Multiple software product lines to configure applications of internet of things[J]. IET Software,2020,14(2).[60]Eduardo Juárez,Rocio Aldeco-Pérez,Jose.Manuel Velázquez. Academic approach to transform organisations: one engineer at a time[J]. IET Software,2020,14(2).[61]Dennys García-López,Marco Segura-Morales,Edson Loza-Aguirre. Improving the quality and quantity of functional and non-functional requirements obtained during requirements elicitation stage for the development of e-commerce mobile applications: an alternative reference process model[J]. IET Software,2020,14(2).[62]. Guest Editorial: Software Engineering Applications to Solve Organisations Issues[J]. IET Software,2020,14(2).[63]?,?. Engine Control Unit ? ? ?[J]. ,2020,47(4).[64]. Engineering - Software Engineering; Study Data from Nanjing University Update Understanding of Software Engineering (Identifying Failure-causing Schemas In the Presence of Multiple Faults)[J]. Mathematics Week,2020.[65]. Energy - Renewable Energy; Researchers from Institute of Electrical Engineering Detail New Studies and Findings in the Area of Renewable Energy (A Local Control Strategy for Distributed Energy Fluctuation Suppression Based on Soft Open Point)[J]. Journal of Mathematics,2020.[66]Ahmed Zeraoui,Mahfoud Benzerzour,Walid Maherzi,Raid Mansi,Nor-Edine Abriak. New software for the optimization of the formulation and the treatment of dredged sediments for utilization in civil engineering[J]. Journal of Soils and Sediments,2020(prepublish).[67]. Engineering - Concurrent Engineering; Reports from Delhi Technological University Add New Data to Findings in Concurrent Engineering (Systematic literature review of sentiment analysis on Twitter using soft computing techniques)[J]. Journal of Engineering,2020.[68]. Engineering; New Findings from Future University in Egypt in the Area of Engineering Reported (Decision support system for optimum soft clay improvementtechnique for highway construction projects)[J]. Journal of Engineering,2020.[69]Erica Mour?o,Jo?o Felipe Pimentel,Leonardo Murta,Marcos Kalinowski,Emilia Mendes,Claes Wohlin. On the performance of hybrid search strategies for systematic literature reviews in software engineering[J]. Information and Software Technology,2020,123.[70]. Soft Computing; Researchers from Anna University Discuss Findings in Soft Computing (A novel fuzzy mechanism for risk assessment in software projects)[J]. News of Science,2020.软件工程英文参考文献三:[71]. Software and Systems Research; New Software and Systems Research Study Results from Chalmers University of Technology Described (Why and How To Balance Alignment and Diversity of Requirements Engineering Practices In Automotive)[J]. Journal of Transportation,2020.[72]Anupama Kaushik,Devendra Kr. Tayal,Kalpana Yadav. A Comparative Analysis on Effort Estimation for Agile and Non-agile Software Projects Using DBN-ALO[J]. Arabian Journal for Science and Engineering,2020,45(6).[73]Subhrata Das,Adarsh Anand,Mohini Agarwal,Mangey Ram. Release Time Problem Incorporating the Effect of Imperfect Debugging and Fault Generation: An Analysis for Multi-Upgraded Software System[J]. International Journal of Reliability, Quality and Safety Engineering,2020,27(02).[74]Saerom Lee,Hyunmi Baek,Sehwan Oh. The role of openness in open collaboration:A focus on open‐source software development projects[J]. ETRI Journal,2020,42(2).[75]. Soft Computing; Study Results from Computer Science and Engineering Broaden Understanding of Soft Computing (Efficient attribute selection technique for leukaemia prediction using microarray gene data)[J]. Computer Technology Journal,2020.[76]. Engineering - Computational Engineering; Findings from University of Cincinnati in the Area of Computational Engineering Described (Exploratory Metamorphic Testing for Scientific Software)[J]. Computer Technology Journal,2020.[77]. Organizational and End User Computing; Data from Gyeongnam National University of Science and Technology Advance Knowledge in Organizational and End User Computing (A Contingent Approach to Facilitating Conflict Resolution in Software Development Outsourcing Projects)[J]. Computer Technology Journal,2020.[78]. Soft Computing; Findings from Department of Industrial Engineering in the Area of Soft Computing Reported (Analysis of fuzzy supply chain performance based on different buyback contract configurations)[J]. Computer Technology Journal,2020.[79]Hana Mkaouar,Bechir Zalila,Jér?me Hugues,Mohamed Jmaiel. A formal approach to AADL model-based software engineering[J]. International Journal on Software Tools for Technology Transfer,2020,22(5).[80]Riesch Michael,Nguyen Tien Dat,Jirauschek Christian. bertha: Project skeleton for scientific software.[J]. PloS one,2020,15(3).[81]. Computers; Findings from Department of Computer Sciences and Engineering Reveals New Findings on Computers (An assessment of software defined networking approach in surveillance using sparse optimization algorithm)[J]. Telecommunications Weekly,2020.[82]Luigi Ranghetti,Mirco Boschetti,Francesco Nutini,Lorenzo Busetto. “sen2r”: An R toolbox for automatically downloading and preprocessing Sentinel-2 satellite data[J]. Computers and Geosciences,2020,139.[83]Mathie Najberg,Muhammad Haji Mansor,Théodore Taillé,Céline Bouré,Rodolfo Molina-Pe?a,Frank Boury,José Luis Cenis,Emmanuel Garcion,Carmen Alvarez-Lorenzo. Aerogel sponges of silk fibroin, hyaluronic acid and heparin for soft tissue engineering: Composition-properties relationship[J]. Carbohydrate Polymers,2020,237.[84]Isonkobong Udousoro. Effective Requirement Engineering Process Model in Software Engineering[J]. Software Engineering,2020,8(1).[85]. Soft Computing; Research Conducted at Department of Computer Sciences and Engineering Has Updated Our Knowledge about Soft Computing [Hyperparameter tuning in convolutional neural networks for domain adaptation in sentiment classification (HTCNN-DASC)][J]. Network Weekly News,2020.[86]. Engineering - Software Engineering; Data on Software Engineering Discussed by Researchers at Universita della Svizzera italiana (Investigating Types and Survivability of Performance Bugs In Mobile Apps)[J]. Computer Technology Journal,2020.[87]. Engineering - Software Engineering; Findings from Nanjing University Broaden Understanding of Software Engineering (Boosting Crash-inducing Change Localization With Rank-performance-based Feature Subset Selection)[J]. Computer Technology Journal,2020.[88]. Engineering - Software Engineering; Study Data from Queen's University Belfast Update Knowledge of Software Engineering (Practical relevance of software engineering research: synthesizing the community's voice)[J]. Computer Technology Journal,2020.[89]. Engineering - Software Engineering; Researchers from Concordia University Detail New Studies and Findings in the Area of Software Engineering (MSRBot: Using bots to answer questions from software repositories)[J]. Computer Technology Journal,2020.[90]Anonymous. DBTA LIVE[J]. Database Trends and Applications,2020,34(2).[91]Tachanun KANGWANTRAKOOL,Kobkrit VIRIYAYUDHAKORN,Thanaruk THEERAMUNKONG. Software Development Effort Estimation from Unstructured Software Project Description by Sequence Models[J]. IEICE Transactions on Information and Systems,2020,E103.D(4).[92]Reza Mohammadi,Reza Javidan,Negar Rikhtegar,Manijeh Keshtgari. An intelligent multicast traffic engineering method over software defined networks[J]. Journal of High Speed Networks,2020,26(1).[93]. Engineering - Civil Engineering; Hohai University Researchers Detail New Studies and Findings in the Area of Civil Engineering (An Experimental Study on Settlement due to the Mutual Embedding of Miscellaneous Fill and Soft Soil)[J]. Journal of Engineering,2020.[94]. Engineering - Biomechanical Engineering; Researchers from Washington University St. Louis Detail New Studies and Findings in the Area of Biomechanical Engineering (Estimation of Anisotropic Material Properties of Soft Tissue By Mri of Ultrasound-induced Shear Waves)[J]. Journal of Engineering,2020.[95]. Engineering - Rock Engineering; Reports from University of Alicante Add New Data to Findings in Rock Engineering (Evaluation of Strength and Deformability of Soft Sedimentary Rocks In Dry and Saturated Conditions Through Needle Penetration and Point Load Tests: a Comparative ...)[J]. Journal of Engineering,2020.[96]. Computers; Study Findings from Department of Electrical and Communication Engineering Broaden Understanding of Computers [Improved energy efficient design in software defined wireless electroencephalography sensor networks (WESN) using distributed ...][J]. Network Weekly News,2020.[97]Mouro Erica,Pimentel Joo Felipe,Murta Leonardo,Kalinowski Marcos,Mendes Emilia,Wohlin Claes. On the Performance of Hybrid Search Strategies for Systematic Literature Reviews in Software Engineering[J]. Information and SoftwareTechnology,2020(prepublish).[98]Osuna Enrique,Rodrguez Luis-Felipe,Gutierrez-Garcia J. Octavio,Castro LuisA.. Development of computational models of emotions: A software engineering perspective[J]. Cognitive Systems Research,2020,60(C).[99]Sharifzadeh Bahador,Kalbasi Rasool,Jahangiri Mehdi,Toghraie Davood,Karimipour Arash. Computer modeling of pulsatile blood flow in elastic artery using a software program for application in biomedical engineering[J]. Computer Methods and Programs in Biomedicine,2020.[100]Shen Xiaoning,Guo Yinan,Li Aimin. Cooperative coevolution with an improved resource allocation for large-scale multi-objective software project scheduling[J]. Applied Soft Computing,2020,88(C).[101]Jung Jaesoon,Kook Junghwan,Goo Seongyeol,Wang Semyung. Corrigendum to Sound transmission analysis of plate structures using the finite element method and elementary radiator approach with radiator error index [Advances in Engineering Software 112 (2017 115][J]. Advances in Engineering Software,2020,140(C).[102]Zhang Chenyi,Pang Jun. Preface for the special issue of the 12th International Symposium on Theoretical Aspects of Software Engineering (TASE 2018[J]. Science of Computer Programming,2020,187(C).[103]Karras Oliver,Schneider Kurt,Fricker Samuel A.. Representing software project vision by means of video: A quality model for vision videos[J]. Journal of Systems and Software,2020,162(C).[104]Sutanto Juliana,Jiang Qiqi,Tan Chuan-Hoo. The contingent role of interproject connectedness in cultivating open source software projects[J]. The Journal of Strategic Information Systems,2020(prepublish).[105]Weiner Iddo,Feldman Yael,Shahar Noam,Yacoby Iftach,Tuller Tamir. CSO A sequence optimization software for engineering chloroplast expression in Chlamydomonas reinhardtii[J]. Algal Research,2020,46(C).以上就是关于软件工程英文参考文献的分享,希望对你有所帮助。
![一种基于宽带跳频信号的相控阵波束对星跟踪系统与方法[发明专利]](https://uimg.taocdn.com/aaac3038a9114431b90d6c85ec3a87c240288a92.webp)
专利名称:一种基于宽带跳频信号的相控阵波束对星跟踪系统与方法
专利类型:发明专利
发明人:李靖,潘申富,蒋宝强,李强,智开宇,杨锁强
申请号:CN202110263928.9
申请日:20210311
公开号:CN113093257B
公开日:
20220412
专利内容由知识产权出版社提供
摘要:本发明公开了一种基于宽带跳频信号的相控阵波束对星跟踪系统与方法,属于相控阵天线的波束指向跟踪领域。
空间来波信号由接收子阵单元接收,经子阵延迟补偿单元补偿瞬时频率跳变造成的相位误差后,波束合成网络合成的波束信号由跳频解跳单元完成同步解跳、变频,送到波束跟踪单元提取波束指向误差,经由波束控制单元控制接收子阵完成波束的闭环指向跟踪。
本发明在空间域和频率域同时进行搜索捕获,快速实现波束对星跟踪、跳频图案同步;设计的子阵延迟补偿和偏轴增益补偿技术,可实现在跳频抗干扰系统应用中相控阵波束的高精度跟踪;同时,充分利用相控阵波束快速扫描的能力,实现波束偏转跟踪,大大简化设备复杂度。
申请人:中国电子科技集团公司第五十四研究所
地址:050081 河北省石家庄市中山西路589号第五十四所卫通部
国籍:CN
代理机构:河北东尚律师事务所
代理人:王文庆
更多信息请下载全文后查看。
第42卷第10期2023年10月硅㊀酸㊀盐㊀通㊀报BULLETIN OF THE CHINESE CERAMIC SOCIETY Vol.42㊀No.10October,2023g-C 3N 4/Ag 基二元复合光催化剂降解环境污染物的研究进展柏林洋1,蔡照胜2(1.江苏旅游职业学院,扬州㊀225000;2.盐城工学院化学化工学院,盐城㊀224051)摘要:光催化技术在太阳能资源利用方面呈现出良好的应用前景,已受到世界各国的广泛关注㊂g-C 3N 4是一种二维结构的非金属聚合物型半导体材料,具有合成简单㊁成本低㊁化学性质稳定㊁无毒等特点,在环境修复和能量转化方面应用潜力较大㊂但g-C 3N 4存在对可见光吸收能力差㊁比表面积小和光生载流子复合速率高等缺点,限制了其实际应用㊂构筑异质结光催化剂是提高光催化效率的有效途径之一㊂基于Ag 基材料的特点,前人对g-C 3N 4/Ag 基二元复合光催化剂进行了大量研究,并取得显著成果㊂本文总结了近年来AgX(X =Cl,Br,I)/g-C 3N 4㊁Ag 3PO 4/g-C 3N 4㊁Ag 2CO 3/g-C 3N 4㊁Ag 3VO 4/g-C 3N 4㊁Ag 2CrO 4/g-C 3N 4㊁Ag 2O /g-C 3N 4和Ag 2MoO 4/g-C 3N 4复合光催化剂降解环境污染物的研究进展,并评述了g-C 3N 4/Ag 基二元复合光催化剂目前面临的主要挑战,展望了其未来发展趋势㊂关键词:g-C 3N 4;Ag 基材料;二元复合光催化剂;光催化性能;环境污染物中图分类号:TQ426㊀㊀文献标志码:A ㊀㊀文章编号:1001-1625(2023)10-3755-09Research Progress on g-C 3N 4/Ag-Based Binary Composite Photocatalysts for Degradation of Environmental PollutantsBAI Linyang 1,CAI Zhaosheng 2(1.Jiangsu Institute of Tourism,Yangzhou 225000,China;2.School of Chemistry and Chemical Engineering,Yancheng Institute of Technology,Yancheng 224051,China)Abstract :Photocatalysis technology shows a good application prospect in the utilization of solar energy resource and has attracted worldwide attention.g-C 3N 4is a two-dimensional polymeric metal-free semiconductor material with the characteristics of facile synthesis,low cost,high chemical stability and non-toxicity,which has great potential in environmental remediation and energy conversion.However,g-C 3N 4has the drawbacks of poor visible light absorption capacity,low specific surface area and high recombination rate of photogenerated charge carriers,which limits its practical application.Constructing heterojunction photocatalyst has become one of effective pathways for boosting photocatalytic efficiency.Based on the inherent merits of Ag-based materials,a lot of researches have been carried out on g-C 3N 4/Ag-based binary photocatalysts and prominent results have been achieved.Recent advances on AgX (X =Cl,Br,I)/g-C 3N 4,Ag 3PO 4/g-C 3N 4,Ag 2CO 3/g-C 3N 4,Ag 3VO 4/g-C 3N 4,Ag 2CrO 4/g-C 3N 4,Ag 2O /g-C 3N 4and Ag 2MoO 4/g-C 3N 4composite photocatalysts for the degradation of environmental pollutants were summarized.The major challenges of g-C 3N 4/Ag-based binary composite photocatalysts were reviewed and the future development trends were also forecast.Key words :g-C 3N 4;Ag-based material;binary composite photocatalyst;photocatalytic performance;environmental pollutant㊀收稿日期:2023-05-15;修订日期:2023-06-12基金项目:江苏省高等学校自然科学研究面上项目(19KJD530002)作者简介:柏林洋(1967 ),男,博士,副教授㊂主要从事光催化材料方面的研究㊂E-mail:linybai@通信作者:蔡照胜,博士,教授㊂E-mail:jsyc_czs@0㊀引㊀言随着全球经济的快速增长和工业化进程的加快,皮革㊁印染㊁制药和化工等行业排放的环境污染物总量3756㊀陶㊀瓷硅酸盐通报㊀㊀㊀㊀㊀㊀第42卷也不断增长㊂这些环境污染物存在成分复杂㊁毒性大㊁难以降解等特点,对人们的身体健康和生态环境产生严重威胁,已成为制约经济和社会发展的突出问题㊂如何实现环境污染物的高效降解是目前亟待解决的重要问题㊂效率低㊁能耗高及存在二次污染是利用传统处理方法处置环境污染物的主要缺陷[1]㊂光催化技术作为一种新型的绿色技术,具有环境友好㊁成本低㊁反应效率高和无二次污染等优点,在解决环境污染问题方面具有很大的发展潜力,深受人们的关注[2-4]㊂g-C3N4属于一种非金属聚合物型半导体材料,具有二维分子结构,即C原子和N原子通过sp2杂化形成的共轭石墨烯平面结构,具有适宜的禁带宽度(2.7eV)和对460nm以下可见光良好的响应能力㊂g-C3N4具有合成原料成本低㊁制备工艺简单㊁耐酸耐碱和稳定性好等特点,在催化[5]㊁生物[6]和材料[7]等领域应用广泛㊂然而,g-C3N4较小的比表面积㊁较弱的可见光吸收能力和较快的光生载流子复合率等不足导致其光量子利用率不高,给实际应用带来较大困难[8]㊂为了克服上述问题,前人提出了对g-C3N4进行形貌调控[9]㊁元素掺杂[10-11]和与其他半导体耦合[12-13]等方法㊂其中,将g-C3N4与其他半导体耦合形成异质结光催化剂最为常见㊂Ag基半导体材料因具有成本合理㊁光电性能好和光催化活性高等特点而深受青睐,但仍存在光生载流子快速复合和光腐蚀等缺陷㊂近年来,人们将Ag基材料与g-C3N4进行复合,整体提高了复合光催化剂的催化性能,并由此取得了大量极有价值的科研成果㊂本文综述了近年来g-C3N4/Ag银基二元复合光催化剂的制备方法㊁性能和应用等方面的研究现状,同时展望了未来的发展趋势,期望能为该领域的研究人员提供新的思路㊂1㊀g-C3N4/Ag基二元复合光催化剂近年来,基于Ag基半导体材料能与g-C3N4能带结构匹配的特点,构筑g-C3N4/Ag基异质结型复合光催化体系已成为国内外的研究热点㊂这类催化剂通常采用沉淀法在g-C3N4表面负载Ag基半导体材料㊂其中,Ag基体的成核和生长是关键问题㊂通过对Ag基材料成核和生长工艺的控制,实现了Ag基材料在g-C3N4上的均匀分布㊂此外,通过对g-C3N4微观结构进行调控,使其具有较大的比表面积和较高的结晶度,从而进一步提高复合光催化剂的催化性能㊂相对于纯g-C3N4和Ag基光催化剂,g-C3N4/Ag基二元复合光催化剂通过两组分的协同效应和界面作用,不仅能提高对可见光的吸收利用率,而且能有效抑制g-C3N4和Ag基材料中光生e-/h+对的重组,从而提高复合光催化剂的活性和稳定性㊂在g-C3N4/Ag基二元复合光催化材料中,以AgX(X=Cl,Br,I)/g-C3N4㊁Ag3PO4/g-C3N4㊁Ag2CO3/g-C3N4㊁Ag3VO4/g-C3N4㊁Ag2CrO4/g-C3N4㊁Ag2O/g-C3N4和Ag2MoO4/g-C3N4为典型代表㊂1.1㊀AgX(X=Cl,Br,I)/g-C3N4二元复合光催化剂AgX(X=Cl,Br,I)在杀菌㊁有机污染物降解和光催化水解产氢等方面展现出优异的性能㊂但AgX (X=Cl,Br,I)是一种光敏材料,在可见光下容易发生分解,形成Ag0,从而影响其催化活性及稳定性㊂将AgX(X=Cl,Br,I)与g-C3N4复合是提升AgX(X=Cl,Br,I)使用寿命㊁改善光催化性能最有效的方法之一㊂Li等[14]采用硬模板法制备出一种具有空心和多孔结构的高比表面积g-C3N4纳米球,并以其为载体,通过沉积-沉淀法得到AgBr/g-C3N4光催化材料㊂XRD分析显示AgBr的加入并没有改变g-C3N4的晶体结构,瞬态光电流试验表明AgBr/g-C3N4光电流密度高于g-C3N4,橙黄G(OG)染料经10min可见光照射后的降解率达到97%㊂Shi等[15]报道了利用沉淀回流法制备AgCl/g-C3N4光催化剂,研究了AgCl的量对催化剂结构及光催化降解草酸性能的影响,确定了最佳修饰量,分析了催化剂用量㊁草酸起始浓度㊁酸度和其他有机成分对光催化活性影响,通过自由基捕获试验揭示了光降解反应中起主要作用的活性物质为光生电子(e-)㊁羟基自由基(㊃OH)㊁超氧自由基(㊃O-2)和空穴(h+)㊂彭慧等[16]采用化学沉淀法制备具有不同含量AgI的AgI/g-C3N4光催化剂,SEM测试表明AgI纳米颗粒分布在层状结构g-C3N4薄片的表面,为催化反应提供了更多的活性位㊂该系列催化剂应用于光催化氧化降解孔雀石绿(melachite green,MG)的结果显示,AgI/g-C3N4(20%,质量分数,下同)的光催化性能最好,MG经2h可见光辐照后去除率达到99.8%㊂部分AgX(X=Cl,Br,I)/g-C3N4二元复合光催化剂的研究现状如表1所示㊂第10期柏林洋等:g-C 3N 4/Ag 基二元复合光催化剂降解环境污染物的研究进展3757㊀表1㊀AgX (X =Cl ,Br ,I )/g-C 3N 4二元复合光催化剂光降解环境污染物的研究现状Table 1㊀Research status of AgX (X =Cl ,Br ,I )/g-C 3N 4binary composite photocatalysts forphotodegradation of enviromental pollutantsPhotocatalytst Synthesis method TypePotential application Photocatalytic activity Reference AgBr /g-C 3N 4Sonication-assisted deposition-precipitation II-schemeDegradation of RhB,MB and MO 100%degradation for RhB,95%degradation for MB and 90%degradation for MO in 10min [17]AgCl /g-C 3N 4Precipitation Z-schemeDegradation of RhB and TC 96.1%degradation for RhB and 77.8%degradation for TC in 120min [18]AgCl /g-C 3N 4Solvothermal +in situ ultrasonic precipitation Z-scheme Degradation of RhB 92.2%degradation in 80min [19]AgBr /g-C 3N 4Deposition-precipitation II-schemeDegradation of MO 90%degradation in 30min [20]AgI /g-C 3N 4In-situ growth II-scheme Degradation of RhB 100%degradation in 60min [21]㊀㊀Note:MO-methyl orange,RhB-rhodamine B,TC-tetracycline hydrochloride,MB-methyl blue.1.2㊀Ag 3PO 4/g-C 3N 4二元复合光催化剂纳米Ag 3PO 4禁带宽度为2.5eV 左右,对可见光有很好的吸收作用,且光激发后具有很强的氧化性,在污染物降解和光解水制氢等领域有良好的应用前景[22]㊂但是,纳米Ag 3PO 4易团聚,光生载流子的快速重组使光催化活性大大降低,此外,Ag 3PO 4还易受光生e -的腐蚀,从而影响稳定性㊂Ag 3PO 4与g-C 3N 4复合可显著降低e -/h +对的重组,有效提高光催化性能㊂Wang 等[23]采用原位沉淀法获得Z-型异质结构g-C 3N 4/Ag 3PO 4复合光催化剂,并有效地提高了e -/h +对的分离效率㊂TEM 结果显示,Ag 3PO 4粒子被g-C 3N 4纳米片所覆盖,UV-DRS 结果表明,Ag 3PO 4的添加使g-C 3N 4吸收边发生红移,且吸收光强度显著增强,光降解实验结果显示,30%g-C 3N 4/Ag 3PO 4光催化剂在40min 内能去除约90%的RhB㊂胡俊俊等[24]利用了原位沉淀法合成了一系列Ag 3PO 4/g-C 3N 4复合光催化剂,研究了Ag 3PO 4和g-C 3N 4的物质的量比对催化剂在可见光下催化降解MB 性能的影响,发现在最优组分下,MB 经可见光辐照30min 后可以被完全降解㊂Mei 等[25]采用焙烧-沉淀法制备了一系列Ag 3PO 4/g-C 3N 4复合光催化剂,并用于可见光条件下降解双酚A(bisphenol A,BPA),发现Ag 3PO 4质量分数为25%时,光催化降解BPA 的性能最好,3h 能降解92.8%的BPA㊂潘良峰等[26]采用化学沉淀法制备出一种具有空心管状的Ag 3PO 4/g-C 3N 4光催化剂,SEM 结果表明,Ag 3PO 4颗粒均匀分布于空心管状结构g-C 3N 4的表面,两者形成一个较强异质结构,将其用于盐酸四环素(tetracycline hydrochloride,TC)光催化降解,80min 能降解98%的TC㊂Deonikar 等[27]研究了采用原位湿化学法合成催化剂过程中使用不同溶剂(去离子水㊁四氢呋喃和乙二醇)对Ag 3PO 4/g-C 3N 4的结构和光降解MB㊁RhB 及4-硝基苯酚性能的影响,发现不同溶剂对复合光催化剂的形貌有着重要影响,从而影响光催化性能,其中以四氢呋喃合成的复合光催化剂的催化降解性能最佳,这是由于g-C 3N 4纳米片均匀包裹在Ag 3PO 4的表面,从而促使两者界面形成较为密切的相互作用,有利于e -/h +对的分离㊂部分Ag 3PO 4/g-C 3N 4二元复合光催化剂的研究进展见表2㊂表2㊀Ag 3PO 4/g-C 3N 4二元复合光催化剂光降解环境污染物的研究现状Table 2㊀Research status of Ag 3PO 4/g-C 3N 4binary composite photocatalysts for photodegradation of environmental pollutantsPhotocatalyst Synthesis method Type Potential application Photocatalytic activity Reference g-C 3N 4/Ag 3PO 4In situ precipitation Z-scheme Degradation of BPA 100%degradation in 180min [28]g-C 3N 4/Ag 3PO 4Hydrothermal Z-schemeDecolorization of MB Almost 93.2%degradation in 25min [29]g-C 3N 4/Ag 3PO 4In situ prepcipitation II-scheme Reduction of Cr(VI)94.1%Cr(VI)removal efficiency in 120min [30]g-C 3N 4/Ag 3PO 4Chemical precipitation Z-scheme Degradation of RhB 90%degradation in 40min [31]g-C 3N 4/Ag 3PO 4In situ precipitation Z-scheme Degradation of levofloxacin 90.3%degradation in 30min [32]Ag 3PO 4/g-C 3N 4Chemical precipitation Z-schemeDegradation of gaseous toluene 87.52%removal in 100min [33]Ag 3PO 4/g-C 3N 4Calcination +precipitation Z-scheme Degradation of diclofenac (DCF)100%degradation in 12min [34]Ag 3PO 4/g-C 3N 4In situ deposition Z-scheme Degradation of RhB and phenol 99.4%degradation in 9min for RhB;97.3%degradation in 30min for phenol [35]3758㊀陶㊀瓷硅酸盐通报㊀㊀㊀㊀㊀㊀第42卷续表Photocatalyst Synthesis method Type Potential application Photocatalytic activity Reference Ag3PO4/g-C3N4In situ hydrothermal II-scheme Degradation of sulfapyridine(SP)94.1%degradation in120min[36] Ag3PO4/g-C3N4In situ growth Z-scheme Degradation of berberine100%degradation in15min[37] g-C3N4/Ag3PO4In situ deposition Z-scheme Degradation of ofloxacin71.9%degradation in10min[38] Ag3PO4/g-C3N4Co-precipitation Z-scheme Degradation of MO98%degradation in10min[39]g-C3N4/Ag3PO4Calcination+precipitation Z-scheme Degradation of MO,RhB and TC95%degradation for MO in30min;[40]96%degradation for RhB in15min;80%degradation for TC in30min1.3㊀Ag2CO3/g-C3N4二元复合光催化剂Ag4d轨道和O2p轨道杂化,形成Ag2CO3的价带(valence band,VB);Ag5s轨道和Ag4d轨道进行杂化,形成Ag2CO3导带(conduction band,CB),而CB中原子轨道杂化会降低Ag2CO3带隙能,从而提高光催化活性[41]㊂纳米Ag2CO3带隙能约为2.5eV,可见光响应性好,在可见光作用下表现出良好的光催化降解有机污染物特性[42-43]㊂然而,经长时间光照后,Ag2CO3晶粒中Ag+会被光生e-还原成Ag0,导致其光腐蚀,引起光催化性能下降[44]㊂Ag2CO3与g-C3N4耦合,能够有效地抑制光腐蚀,促进e-/h+对的分离,进而改善光催化性能㊂An等[45]通过构筑Z型核壳结构的Ag2CO3@g-C3N4材料来增强Ag2CO3和g-C3N4界面间的相互作用,从而有效防止光腐蚀发生,加速光生e-/h+对的分离,实现了催化剂在可见光辐照下高效降解MO㊂Yin等[46]通过水热法制备Ag2CO3/g-C3N4光催化剂,探讨了g-C3N4的含量㊁合成温度对催化剂结构和光降解草酸(oxalic acid,OA)性能的影响,获得最优条件下合成的催化剂能在45min光照时间内使OA去除率达到99.99%㊂Pan等[41]采用煅烧和化学沉淀两步法,制备了一系列Ag2CO3/g-C3N4光催化剂,TEM结果显示,Ag2CO3纳米粒子均匀分布在g-C3N4纳米片表面,且形貌规整㊁粒径均一,光催化性能测试结果表明,60% Ag2CO3/g-C3N4光催化活性最高,MO和MB分别经120和240min可见光光照后,其降解率分别为93.5%和62.8%㊂Xiu等[47]使用原位水热法构筑了Ag2CO3/g-C3N4光催化剂,光降解试验结果表明,MO经可见光辐照1h的去除率为87%㊂1.4㊀Ag3VO4/g-C3N4二元复合光催化剂纳米Ag3VO4带隙能约为2.2eV,可用于催化可见光降解环境污染物,是一种具有应用前景的新型半导体材料㊂然而,如何提高Ag3VO4光催化性能,仍然是学者研究的重点㊂构建Ag3VO4/g-C3N4异质结催化剂是提高Ag3VO4的催化性能的一种有效方法㊂该方法能够降低Ag3VO4光生载流子的复合率,拓宽可见光的吸收范围㊂Hind等[48]通过溶胶凝胶法制备出一种具有介孔结构的Ag3VO4/g-C3N4复合光催化剂,该复合催化剂经60min可见光照射能将Hg(II)全部还原,其光催化活性分别是Ag3VO4和g-C3N4的4.3倍和5.4倍,主要是由于异质结界面处各组分间紧密结合以及催化剂具有较高的比表面积和体积比,从而促进光生载流子的分离㊂蒋善庆等[49]利用化学沉淀法制备了系列Ag3VO4/g-C3N4催化剂,催化性能研究结果表明,Ag3VO4负载量为20%(质量分数)时,其光催化降解微囊藻毒素的效果最好,可见光辐照100min后降解率为85.43%,而g-C3N4在相同条件下的降解率仅为18.76%㊂1.5㊀Ag2CrO4/g-C3N4二元复合光催化剂纳米Ag2CrO4具有特殊的晶格和能带结构,其带隙能为1.8eV,可见光响应良好,是一种非常理想的可见光区半导体材料㊂然而,Ag2CrO4存在自身的电子结构和晶体的缺陷,导致其光催化效率性能较差,严重影响了实际应用[50-52]㊂将Ag2CrO4与g-C3N4复合形成异质结光催化剂是提高其光催化效率和稳定性的一种有效途径,因为Ag2CrO4在光照下产生的光生e-快速地迁移到g-C3N4表面,可避免光生e-在Ag2CrO4表面聚集而引起光腐蚀㊂Ren等[53]利用SiO2为硬模板,以氰胺为原料,合成出具有中空介孔结构的g-C3N4,再通过化学沉淀法制备了系列g-C3N4/Ag2CrO4光催化剂,并将其用于RhB和TC的可见光降解,研究发现g-C3N4/Ag2CrO4催化剂具有较高比表面积和丰富的孔道结构,在可见光辐射下表现出较高的光催化活性㊂Rajalakshmi等[54]利用水热方法合成了一系列Ag2CrO4/g-C3N4光催化剂,并将其用于对硝基苯酚的光催化降解,结果表明,Ag2CrO4质量分数为10%时,其降解率达到97%,高于单组分g-C3N4或Ag2CrO4,原因是与第10期柏林洋等:g-C 3N 4/Ag 基二元复合光催化剂降解环境污染物的研究进展3759㊀Ag 2CrO 4和g-C 3N 4界面间形成了S-型异质结,能提高e -/h +对的分离效率㊂1.6㊀Ag 2O /g-C 3N 4二元复合光催化剂纳米Ag 2O 是一种理想的可见光半导体材料,在受到光辐照后,其电子发生跃迁,CB 上光生e -能够将Ag 2O 晶粒中Ag +还原成Ag 0,而VB 上h +能够使Ag 2O 的晶格氧氧化为O 2,导致其结构不稳定㊂然而,纳米Ag 2O 在有机物污染物降解方面表现出良好的稳定性[55],这是因为Ag 2O 的表面会随着光化学反应的进行被一定数量的Ag 0纳米粒子所覆盖,而Ag 0纳米粒子作为光生e -陷阱,能够降低e -在Ag 2O 表面的富集,同时,由于光生h +具有较强的氧化性能力,既能实现对有机污染物的直接氧化,又能避免其对晶格氧的氧化,从而提高了纳米Ag 2O 光催化活性和稳定性㊂Liang 等[56]在常温下采用简易化学沉淀法制备了p-n 结Ag 2O /g-C 3N 4复合光催化剂,研究发现,起分散作用的g-C 3N 4为Ag 2O 纳米颗粒的生长提供了大量成核位点并限制了Ag 2O 纳米颗粒聚集,p-n 结的形成以及在光化学反应过程中生成的Ag 纳米粒子,加速了光生载流子的分离和迁移,拓宽了光的吸收范围,在可见光和红外光照下降解RhB 溶液过程中表现出良好的催化活性,其在可见光和红外光照下反应速率分别是g-C 3N 4的26倍和343倍㊂Jiang 等[57]通过液相法制备了一系列介孔结构的g-C 3N 4/Ag 2O 光催化剂,试验结果表明,Ag 2O 的添加显著提高了g-C 3N 4/Ag 2O 光催化剂的吸光性能和比表面积,因此对光催化性能的提升有促进作用,当Ag 2O 含量为50%时,光催化分解MB 的效果最好,经120min 可见光光照后,MB 的脱除率达到90.8%,高于g-C 3N 4和Ag 2O㊂Kadi 等[58]以Pluronic 31R 1表面活性剂为软模板,以MCM-41为硬模板,合成出具有多孔结构的Ag 2O /g-C 3N 4光催化剂,TEM 结果显示,球形Ag 2O 的纳米颗粒均匀地分布于g-C 3N 4的表面,催化性能评价表明0.9%Ag 2O /g-C 3N 4复合光催化剂光催化效果最佳,60min 能完全氧化降解环丙沙星,其降解效率分别是Ag 2O 和g-C 3N 4的4倍和10倍㊂1.7㊀Ag 2MoO 4/g-C 3N 4二元复合光催化剂Ag 2MoO 4具有良好的导电性㊁抗菌性㊁环保性,以及优良的光催化活性,在荧光材料㊁导电玻璃㊁杀菌剂和催化剂等方面有着广阔的应用前景[59]㊂但Ag 2MoO 4带隙大(3.1eV),仅能对紫外波段光进行响应,限制了其对太阳光的利用㊂当Ag 2MoO 4与g-C 3N 4进行耦合时,可以将其对太阳光的吸收范围由紫外拓展到可见光区,从而提高太阳光的利用率㊂Pandiri 等[60]通过水热合成的方法,制备出β-Ag 2MoO 4/g-C 3N 4异质结光催化剂,SEM 结果显示该催化剂中β-Ag 2MoO 4纳米颗粒均匀地分布在g-C 3N 4纳米片的表面,光催化性能测试结果表明在3h 的可见光照射下,其降解能力是β-Ag 2MoO 4和g-C 3N 4机械混合物的2.6倍,主要原因在于β-Ag 2MoO 4和g-C 3N 4两者界面间形成更为紧密的异质结,使得e -/h +对被快速分离㊂Wu 等[61]采用简单的原位沉淀方法成功构建了Ag 2MoO 4/g-C 3N 4光催化剂,并将其应用于MO㊁BPA 和阿昔洛韦的降解,结果表明该催化剂显示出良好的太阳光催化活性,这主要是因为Ag 2MoO 4和g-C 3N 4界面间存在着一定的协同效应,可有效地提高对太阳光的利用率,降低载流子的复合概率㊂2㊀g-C 3N 4/Ag 基二元复合光催化剂电荷转移机理模型研究g-C 3N 4/Ag 基二元复合光催化剂在可见光的辐照下,价带电子发生跃迁,产生e -/h +对㊂e -被催化剂表面吸附的O 2捕获产生㊃O -2,并进一步与水反应生成㊃OH,形成的三种活性自由基(h +㊁㊃O -2和㊃OH),实现水中有机污染物的高效降解(见图1)㊂而光催化反应机理与载流子的迁移机制密切相关㊂目前,g-C 3N 4/Ag 基二元复合光催化剂体系中主要存在三种不同的光生载流子的转移机制,分别为I 型㊁II 型和Z 型㊂图1㊀g-C 3N 4/Ag 基二元复合光催化剂降解有机污染物的光催化反应机理Fig.1㊀Photocatalytic reaction mechanism of g-C 3N 4/Ag-based binary composite photocatalyst for degradation of organic pollutants3760㊀陶㊀瓷硅酸盐通报㊀㊀㊀㊀㊀㊀第42卷2.1㊀I 型异质结载流子转移机理模型图2(a)为I 型异质结构中的光生e -/h +对转移示意图㊂半导体A 和半导体B 均对可见光有响应,其中,半导体A 的带隙较宽,半导体B 的带隙较窄,并且半导体B 的VB 和CB 均位于半导体A 之间,在可见光的照射下,e -发生跃迁,从CB 到VB,半导体A 的CB 上的e -和VB 上的h +分别向半导体B 的CB 和VB 转移,从而实现了e -/h +对的分离㊂以Ag 2O /g-C 3N 4复合催化剂为例[58],当Ag 2O 和g-C 3N 4相耦合时,因为g-C 3N 4的VB 具有更正的电势,h +被转移到Ag 2O 的VB 上,同时,光激发e -在g-C 3N 4的CB 上,其电势较负,e -便传输到Ag 2O 的CB 上,CB 上e -与O 2结合形成㊃O -2,并进一步与H +结合生成了㊃OH,而有机物污染物被Ag 2O 的价带上h +氧化分解生成CO 2和H 2O㊂2.2㊀II 型异质结载流子转移机理模型II 型异质结是一种能级交错带隙型结构,如图2(b)所示,其中半导体A 的CB 电位较负,在可见光照射下,e -从CB 上转移到半导体B 的CB 上,h +从半导体B 的VB 转移到半导体A 的VB 上,从而使e -/h +对得以分离㊂以Ag 3PO 4@g-C 3N 4为例[62],由于g-C 3N 4的CB 的电势较Ag 3PO 4低,光生e -从g-C 3N 4迁移到Ag 3PO 4的CB 上,而Ag 3PO 4的CB 电势较g-C 3N 4高,h +从Ag 3PO 4的VB 迁移到g-C 3N 4的VB 上,从而实现e -/h +对的分离,g-C 3N 4表面的h +可直接氧化降解MB,而Ag 3PO 4表面积聚的电子又会被氧捕获,产生H 2O 2,并进一步分解成㊃OH,从而加快MB 的降解㊂上述I 型和II 型结构CB 的氧化能力和VB 还原能力低于单一组分,造成复合半导体的氧化还原能力降低[63]㊂2.3㊀Z 型异质结载流子转移机理模型构建Z 型异质结光光催化剂使得e -和h +沿着特有的方向迁移,有效解决复合催化剂氧化还原能力降低问题[64]㊂Z 型异质结催化剂e -/h +对的迁移方向如图2(c)所示,e -从半导体B 的电势较高的CB 转移到半导体A 的电势较低的VB 进行复合,从而实现半导体A 的e -和半导体B 的h +发生分离㊂h +在半导体B 表面氧化性能更强,在半导体A 上e -具有较高还原特性,两者共同作用使环境污染物得以顺利降解㊂为了更好地解释Z 型异质结h +和e -迁移机理,以Ag 3VO 4/g-C 3N 4复合光催化剂为例[48],复合光催化剂经可见光激发后,Ag 3VO 4和g-C 3N 4都发生了e -跃迁,在Ag 3VO 4的CB 上e -与g-C 3N 4的VB 上h +进行复合时,e -对Ag 3VO 4的腐蚀作用被削弱,同时,也实现了g-C 3N 4的CB 上e -和Ag 3PO 4的价带上h +发生分离,g-C 3N 4的CB 上e -具有较强的还原性,将Hg 2+还原成Hg 0,而Ag 3PO 4的VB 上h +具有较强的氧化性,可将HOOH氧化生成CO 2和H 2O㊂图2㊀电子-空穴对转移机理示意图Fig.2㊀Schematic diagrams of electron-hole pairs transfer mechanism 3㊀结语和展望g-C 3N 4/Ag 基二元复合光催化剂因其较强的可见光响应和优异的光催化性能,在环境污染物的降解方面具有广阔的发展空间㊂近年来,国内外研究人员在理论研究㊁制备方法和光催化性能等多个领域取得了重要进展,为光催化理论的发展奠定了坚实的基础㊂然而,g-C 3N 4/Ag 基二元复合光催化剂在实际应用中还面临诸多问题,如制备工艺复杂㊁光腐蚀㊁光催化剂回收利用困难㊁光催化降解污染物的反应机理尚不明确等,第10期柏林洋等:g-C3N4/Ag基二元复合光催化剂降解环境污染物的研究进展3761㊀现有的光催化降解模型仍有较大的分歧,亟待深入研究㊂为了获得性能优良的g-C3N4/Ag基复合光催化剂,实现产业化应用,应进行以下几方面的研究:1)在g-C3N4/Ag基二元光催化剂的基础上,构建多元复合光催化剂,是进一步提升光生载流子分离效率的有效㊁可靠手段,也是当今和今后光催化剂的研究重点㊂2)对g-C3N4/Ag基二元光催化剂体系中e-/h+对的转移㊁分离和复合等过程进行系统研究,并阐明其光催化反应机制㊂3)针对当前合成的g-C3N4材料多为体相,存在着颗粒大㊁比表面积小㊁活性位少等缺陷,应通过对g-C3N4材料的形状㊁形貌及尺寸的调控,来实现Ag 基材料在g-C3N4材料表面的均匀分布,降低e-/h+对的重组概率,从而大幅度提高复合光催化剂的性能㊂4)Ag基材料的光腐蚀是导致光催化活性和稳定性下降的重要因素,探索一种更为有效的光腐蚀抑制机制,是将其推广应用的关键㊂5)当前合成的g-C3N4/Ag基二元复合光催化剂多为粉末状,存在着易团聚㊁难回收等问题,从而限制了其循环利用㊂因此,需要开展g-C3N4/Ag基二元复合光催化剂回收和再利用的研究,这将有利于社会效益和经济效益的提高㊂参考文献[1]㊀LIN Z S,DONG C C,MU W,et al.Degradation of Rhodamine B in the photocatalytic reactor containing TiO2nanotube arrays coupled withnanobubbles[J].Advanced Sensor and Energy Materials,2023,2(2):100054.[2]㊀DIAO Z H,JIN J C,ZOU M Y,et al.Simultaneous degradation of amoxicillin and norfloxacin by TiO2@nZVI composites coupling withpersulfate:synergistic effect,products and mechanism[J].Separation and Purification Technology,2021,278:119620.[3]㊀ZHAO S Y,CHEN C X,DING J,et al.One-pot hydrothermal fabrication of BiVO4/Fe3O4/rGO composite photocatalyst for the simulated solarlight-driven degradation of Rhodamine B[J].Frontiers of Environmental Science&Engineering,2021,16(3):1-16.[4]㊀JUABRUM S,CHANKHANITTHA T,NANAN S.Hydrothermally grown SDS-capped ZnO photocatalyst for degradation of RR141azo dye[J].Materials Letters,2019,245:1-5.[5]㊀SUN Z X,WANG H Q,WU Z B,et al.g-C3N4based composite photocatalysts for photocatalytic CO2reduction[J].Catalysis Today,2018,300:160-172.[6]㊀LIN L,SU Z Y,LI Y,et parative performance and mechanism of bacterial inactivation induced by metal-free modified g-C3N4undervisible light:Escherichia coli versus Staphylococcus aureus[J].Chemosphere,2021,265:129060.[7]㊀DANG X M,WU S,ZHANG H G,et al.Simultaneous heteroatom doping and microstructure construction by solid thermal melting method forenhancing photoelectrochemical property of g-C3N4electrodes[J].Separation and Purification Technology,2022,282:120005. [8]㊀VAN KHIEN N,HUU H T,THI V N N,et al.Facile construction of S-scheme SnO2/g-C3N4photocatalyst for improved photoactivity[J].Chemosphere,2022,289:133120.[9]㊀LINH P H,DO CHUNG P,VAN KHIEN N,et al.A simple approach for controlling the morphology of g-C3N4nanosheets with enhancedphotocatalytic properties[J].Diamond and Related Materials,2021,111:108214.[10]㊀XIE M,TANG J C,KONG L S,et al.Cobalt doped g-C3N4activation of peroxymonosulfate for monochlorophenols degradation[J].ChemicalEngineering Journal,2019,360:1213-1222.[11]㊀ZHEN X L,FAN C Z,TANG L,et al.Advancing charge carriers separation and transformation by nitrogen self-doped hollow nanotubes g-C3N4for enhancing photocatalytic degradation of organic pollutants[J].Chemosphere,2023,312:137145.[12]㊀AL-HAJJI L A,ISMAIL A A,FAYCAL A M,et al.Construction of mesoporous g-C3N4/TiO2nanocrystals with enhanced photonic efficiency[J].Ceramics International,2019,45(1):1265-1272.[13]㊀CUI P P,HU Y,ZHENG M M,et al.Enhancement of visible-light photocatalytic activities of BiVO4coupled with g-C3N4prepared usingdifferent precursors[J].Environmental Science and Pollution Research,2018,25(32):32466-32477.[14]㊀LI X W,CHEN D Y,LI N J,et al.AgBr-loaded hollow porous carbon nitride with ultrahigh activity as visible light photocatalysts for waterremediation[J].Applied Catalysis B:Environmental,2018,229:155-162.[15]㊀SHI H L,HE R,SUN L,et al.Band gap tuning of g-C3N4via decoration with AgCl to expedite the photocatalytic degradation and mineralizationof oxalic acid[J].Journal of Environmental Sciences,2019,84:1-12.[16]㊀彭㊀慧,刘成琪,汪楚乔,等.AgI/g-C3N4复合材料制备及其降解孔雀石绿染料性能[J].环境工程,2019,37(4):93-97.PENG H,LIU C Q,WANG C Q,et al.Preparation of AgI/g-C3N4composites and their degradation performance of malachite green dyes[J].Environmental Engineering,2019,37(4):93-97(in Chinese).[17]㊀LIANG W,TANG G,ZHANG H,et al.Core-shell structured AgBr incorporated g-C3N4nanocomposites with enhanced photocatalytic activityand stability[J].Materials Technology,2017,32(11):675-685.[18]㊀LI Y B,HU Y R,LIU Z,et al.Construction of self-activating Z-scheme g-C3N4/AgCl heterojunctions for enhanced photocatalytic property[J].Journal of Physics and Chemistry of Solids,2023,172:111055.3762㊀陶㊀瓷硅酸盐通报㊀㊀㊀㊀㊀㊀第42卷[19]㊀XIE J S,WU C Y,XU Z Z,et al.Novel AgCl/g-C3N4heterostructure nanotube:ultrasonic synthesis,characterization,and photocatalyticactivity[J].Materials Letters,2019,234:179-182.[20]㊀YANG J,ZHANG X,LONG J,et al.Synthesis and photocatalytic mechanism of visible-light-driven AgBr/g-C3N4composite[J].Journal ofMaterials Science:Materials in Electronics,2021,32:6158-6167.[21]㊀HUANG H,LI Y X,WANG H L,et al.In situ fabrication of ultrathin-g-C3N4/AgI heterojunctions with improved catalytic performance forphotodegrading rhodamine B solution[J].Applied Surface Science,2021,538:148132.[22]㊀GUO C S,CHEN M,WU L L,et al.Nanocomposites of Ag3PO4and phosphorus-doped graphitic carbon nitride for ketamine removal[J].ACSApplied Nano Materials,2019,2(5):2817-2829.[23]㊀WANG H R,LEI Z,LI L,et al.Holey g-C3N4nanosheet wrapped Ag3PO4photocatalyst and its visible-light photocatalytic performance[J].Solar Energy,2019,191:70-77.[24]㊀胡俊俊,丁同悦,陈奕桦,等.Ag3PO4/g-C3N4复合材料的制备及其光催化性能[J].精细化工,2021,38(3):483-488.HU J J,DING T Y,CHEN Y H,et al.Preparation and photocatalytic application of Ag3PO4/g-C3N4composites[J].Fine Chemicals,2021,38(3):483-488(in Chinese).[25]㊀MEI J,ZHANG D P,LI N,et al.The synthesis of Ag3PO4/g-C3N4nanocomposites and the application in the photocatalytic degradation ofbisphenol A under visible light irradiation[J].Journal of Alloys and Compounds,2018,749:715-723.[26]㊀潘良峰,阎㊀鑫,王超莉,等.中空管状g-C3N4/Ag3PO4复合催化剂的制备及其可见光催化性能[J].无机化学学报,2022,38(4):695-704.PAN L F,YAN X,WANG C L,et al.Preparation and visible light photocatalytic activity of hollow tubular g-C3N4/Ag3PO4composite catalyst[J].Chinese Journal of Inorganic Chemistry,2022,38(4):695-704(in Chinese).[27]㊀DEONIKAR V G,KOTESHWARA R K,CHUNG W J,et al.Facile synthesis of Ag3PO4/g-C3N4composites in various solvent systems withtuned morphologies and their efficient photocatalytic activity for multi-dye degradation[J].Journal of Photochemistry and Photobiology A: Chemistry,2019,368:168-181.[28]㊀DU J G,XU Z,LI H,et al.Ag3PO4/g-C3N4Z-scheme composites with enhanced visible-light-driven disinfection and organic pollutantsdegradation:uncovering the mechanism[J].Applied Surface Science,2021,541:148487.[29]㊀NAGAJYOTHI P C,SREEKANTH T V M,RAMARAGHAVULU R,et al.Photocatalytic dye degradation and hydrogen production activity ofAg3PO4/g-C3N4nanocatalyst[J].Journal of Materials Science:Materials in Electronics,2019,30(16):14890-14901.[30]㊀AN D S,ZENG H Y,XIAO G F,et al.Cr(VI)reduction over Ag3PO4/g-C3N4composite with p-n heterostructure under visible-light irradiation[J].Journal of the Taiwan Institute of Chemical Engineers,2020,117:133-143.[31]㊀YAN X,WANG Y Y,KANG B B,et al.Preparation and characterization of tubelike g-C3N4/Ag3PO4heterojunction with enhanced visible-lightphotocatalytic activity[J].Crystals,2021,11(11):1373.[32]㊀高闯闯,刘海成,孟无霜,等.Ag3PO4/g-C3N4复合光催化剂的制备及其可见光催化性能[J].环境科学,2021,42(5):2343-2352.GAO C C,LIU H C,MENG W S,et al.Preparation of Ag3PO4/g-C3N4composite photocatalysts and their visible light photocatalytic performance[J].Environmental Science,2021,42(5):2343-2352(in Chinese).[33]㊀CHENG R,WEN J Y,XIA J C,et al.Photo-catalytic oxidation of gaseous toluene by Z-scheme Ag3PO4-g-C3N4composites under visible light:removal performance and mechanisms[J].Catalysis Today,2022,388/389:26-35.[34]㊀ZHANG W,ZHOU L,SHI J,et al.Synthesis of Ag3PO4/g-C3N4composite with enhanced photocatalytic performance for the photodegradation ofdiclofenac under visible light irradiation[J].Catalysts,2018,8(2):45.[35]㊀ZHANG M X,DU H X,JI J,et al.Highly efficient Ag3PO4/g-C3N4Z-scheme photocatalyst for its enhanced photocatalytic performance indegradation of rhodamine B and phenol[J].Molecules,2021,26(7):2062.[36]㊀LI K,CHEN M M,CHEN L,et al.In-situ hydrothermal synthesis of Ag3PO4/g-C3N4nanocomposites and their photocatalytic decomposition ofsulfapyridine under visible light[J].Processes,2023,11(2):375.[37]㊀汲㊀畅,王国胜.Ag3PO4/g-C3N4异质结催化剂可见光降解黄连素[J].无机盐工业,2022,54(4):175-180.JI C,WANG G S.Degradation of berberine by visible light over Ag3PO4/g-C3N4heterojunction catalyst[J].Inorganic Chemicals Industry, 2022,54(4):175-180(in Chinese).[38]㊀CHEN R H,DING S Y,FU N,et al.Preparation of a g-C3N4/Ag3PO4composite Z-type photocatalyst and photocatalytic degradation ofOfloxacin:degradation performance,reaction mechanism,degradation pathway and toxicity evaluation[J].Journal of Environmental Chemical Engineering,2023,11(2):109440.[39]㊀HAYATI M,ABDUL H A,ZUL A M H,et al.In-depth investigation on the photostability and charge separation mechanism of Ag3PO4/g-C3N4photocatalyst towards very low visible light intensity[J].Journal of Molecular Liquids,2023,376:121494.[40]㊀DING M,ZHOU J J,YANG H C,et al.Synthesis of Z-scheme g-C3N4nanosheets/Ag3PO4photocatalysts with enhanced visible-lightphotocatalytic performance for the degradation of tetracycline and dye[J].Chinese Chemical Letters,2020,31(1):71-76.[41]㊀PAN S G,JIA B Q,FU Y S.Ag2CO3nanoparticles decorated g-C3N4as a high-efficiency catalyst for photocatalytic degradation of organiccontaminants[J].Journal of Materials Science:Materials in Electronics,2021,32(11):14464-14476.。
Simulation of the Global Routing Protocol based on NS-3Keng YeSchool of Information and Communication Engineering Beijing Information Science and Technology UniversityBeijing, Chinae-mail:**************Jinhe ZhouSchool of Information and Communication Engineering Beijing Information Science and Technology UniversityBeijing, Chinae-mail:*******************.cnAbstract—NS-3 (Network Simulator version 3) could construct a network environment to simulate protocols in computer network. The purpose of this paper is implementing global routing by using the NS-3 with modified OSPF source code. The processing of simulation had been described with C++ code. Furthermore, the result of the network simulation had been analyzed with different software tools such as gawk, gunplot. In this paper we focused on simulating the global routing of Internet by NS-3 and analyzing the related theories about the routing protocol, at last, this paper was analyzing the average delay under different rates.Keywords-routing protocol; NS-3; OSPF; simulationI.I NTRODUCTIONNS-3 not only had abandoned shortcomings of the current mainstream network simulation software such as OPNET and NS-2, but also integrated the advantages of them. NS-3 had excellence including the following aspects: (1) documenting kernel of the standard components; (2) using scripting language such as C + + or Python; (3) applying to real system (network interface, device, driver interface) perfectly; (4) software integration; (5) virtualization and test-bed integration; (6) excellent documented property system; (7) updating the model in real time.NS-3 is a kind of unique simulator which includes integrity, openness, scalability and etc, and these feathers make it superior to most of the existing mainstream network simulator software. NS-3 has extremely powerful function to simulate a variety of network, protocols at all levels.NS-3 is different from the NS-2, although NS-3 is still using the C++ language to realize the simulation node. It hadn’t supported on NS-2 API and obsoleted Otcl language to control the processing of simulation. The framework of NS-3, whose simulation process can be described by pure C++ code, is much clearer than other software [1].II.T HE P RINCIPLE OF G LOBAL R OUTING P ROTOCOLIn NS-3, a C++ object builds an OSPF (Open Shortest Path First) routing database of information about the network topology [2], and executes a Dijkstra SPF (Shortest Path First) algorithm on the topology for each node, and stores the computed routes in each node's layer 3 forwarding table by making use of the routing API(Application Program Interface). The format of the data exported harmonizes with the OSPFv2 standard. In particular, the information is exported in the form of ns3::GlobalLSA objects that semantically conform to the LSA (Link State Advertisements) of OSPF. By utilizing a standard data format for informing topology, existing OSPF route computation code can be reused, and that is what can be done by ns3::GlobalRouteManager objects.OSPF is one kind of IGP (Interior Gateway Protocol), which is used for making routing decision in a single AS (Autonomous System). OSPF is a kind of link-state routing protocol, while RIP is a kind of distance vector routing protocol. In the other words, link is called router interface, so OSPF is also known as the interface state routing protocol. The OSPF is establishing the link state database, generating the shortest path tree through the network interface state of router notice, each OSPF router using the shortest path to construct the routing table [3].The routing algorithm is the core of the OSPF routing protocol. The SPF algorithm is also called Dijkstra algorithm as shown in Fig. 1, because of the shortest path first algorithm SPF is invented by Dijkstra. The SPF algorithm utilize each router as root node to calculate the distance from root node to each destination router, according to a unified database each router will be worked out the topological structure in routing domain, which is similar to a tree called SPT( shortest path tree )in the SPF algorithm. In the OSPF routing protocol, the trunk length of SPT is the distance from the root router to other routers. Smaller Cost means that the OSPF distance between source and destination is shorter.S represents the set of nodes which have not found the shortest path to the root node.R [i]represents the node which is located in front the node i on the path from the specified source node to node i.D [i]represent the shortest distance from the specified source to the node i.Initialization of the algorithm:The set S is initialized as a set which include all nodes but the source node.D[i]: If there is a link from the source node to node v, D (v) is the Cost of the link; otherwise D (v) is infinity.R[i]: If there is a link from source node to node v, R (v) is source node; otherwise R (v) =0International Conference on Software Engineering and Computer Science (ICSECS2013)Figure 1. Pseudo code for Dijstra algorthmWhen the router is initializing or the network structure is changing (for example, increasing or decreasing in the router, link state changing), the router will generate LSA, which contains all of the routers connected to the link, and calculate the shortest path.All routers exchange data of link state with each other through a Flooding, which is that the routers sent LSA to all adjacent OSPF routers. Basing on which the routers received, they have been updating their database and forwarding link state information to the adjacent routers until a stable process When the network is re-stabilized, the convergences of OSPF routing protocol have been completed. All routers will be calculated by the respective link state database of information to generate routing table, which contains the router to another reachable one and the destination to the next router.III.T HE SIMULATION PROCESS OF GLOBAL ROUTINGIn this section, we’ll introduce some important terms that are realizing specific function in ns-3.A.NodeIn NS-3 the basic abstraction of network device is called the Node. The class Node provides methods for managing the functions of network devices in simulation. You should consider a Node as a computer or a router to which you will add functionality by yourself [1]. One adds things like topology, channel, protocol stacks and peripheral devices with their associated drivers to activate the Node to do practical function.Class NodeContainer provides a very convenient way to create, manage, and access nodes, set as follows,NodeContainer c;c.Create (7); B.TopologyClass NodeContainer can connect any two nodes, set asfollows,NodeContainer n0n4 = NodeContainer(c.Get(0), c.Get(4));C.ChannelThe class Channel provides methods for constructingcommunication subnetwork objects and connecting nodes toeach other. Channels may also be specialized by us in theobject- oriented programming method. The specializedChannel can simulate things as complicated as a wire, alarge Ethernet switch, or three-dimensional space full ofobstructions in the case of wireless networks [1].We will utilize specialized versions of the Channelcalled CsmaChannel, PointToPointChannel and WifiChannel in NS-3. This paper choosesPointToPointHelper to simulate, set as follows,PointToPointHelper p2p;DeviceIn ns-3 the abstraction of network device covers both thesoftware driver and the simulated hardware. A network device is “installed” in a Node so as to activate the Node tocommunicate with other Nodes in the simulation viaChannels. Just as in a real computer, a Node may beconnected to more than one Channel via multipleNetDevices. The abstraction of network device isrepresented in C++ by the class NetDevice. The classNetDevice provides methods for managing connections toNode and Channel objects; and may be specialized by us inthe object-oriented programming. We will utilize the severalspecialized versions of the NetDevice calledCsmaNetDevice, PointToPointNetDevice, andWifiNetDevice in NS-3[1]. This paper choosesPointToPointNetDevice to simulate, set as follows, p2p.SetDeviceAttribute ("DataRate", StringValue ("5Mbps"));NetDeviceContainer d0d4 = p2p.Install (n0n4);E.Protocol StackUntil now, nodes, devices and channels are created, wewill use class InternetStack to add stack, set as follows, InternetStackHelper internet;internet.Install (c);F.Assignning Ipv4 AddressThis paper chooses Class Ipv4AddressHelper assign IPaddresses to the device interfaces.NS_LOG_INFO ("Assign IP Addresses.");Ipv4AddressHelper ipv4;ipv4.SetBase ("10.1.1.0", "255.255.255.0");Ipv4InterfaceContainer i0i4=ipv4.Assign (d0d4); G.Setting OSPF Cost Metrici0i4.SetMetric (0, sampleMetric04);i0i4.SetMetric (1, sampleMetric04);H.Generating Routing TableNS_LOG_INFO is recording information on the progress of the program. This paper chooses global routing protocol which is introduced in section 2.Ipv4GlobalRoutingHelper::PopulateRoutingTables ();I.Sending Traffic And Setting Data Rate , The Size OfPacketNS_LOG_INFO ("Create Applications.");uint16_t port = 80; // Discard port (RFC 863)OnOffHelper onoff ("ns3::TcpSocketFactory",InetSocketAddress (i5i6.GetAddress (1), port));onoff.SetAttribute("OnTime", RandomVariableValue (ConstantVariable (1)));onoff.SetAttribute("OffTime", RandomVariableValue (ConstantVariable (0)));onoff.SetAttribute("DataRate",StringValue("5kbps") );onoff.SetAttribute ("PacketSize", UintegerValue (50)); J.Generating And Stopping TrafficApplicationContainer apps = onoff.Install (c.Get (0));apps.Start (Seconds (1.0));apps.Stop (Seconds (100.0));K.Class Packetsink Receive The Traffic OfPacketSinkHelper sink ("ns3::TcpSocketFactory",Address (InetSocketAddress (Ipv4Address::GetAny (), port)));apps = sink.Install (c.Get (6));apps.Start (Seconds (1.0));apps.Stop (Seconds (100.0));NS_LOG_INFO ("Configure Tracing.");L.Generating Trace File To Record SimulationInformationAsciiTraceHelper ascii;Ptr<OutputStreamWrapper> stream = ascii.CreateFileStream ("ospf.tr");p2p.EnableAsciiAll (stream);internet.EnableAsciiIpv4All (stream);M.Generating Routing File To Record Route Information Ipv4GlobalRoutingHelper g;Ptr<OutputStreamWrapper>routingStream=Create<OutputStreamWrapper>("ospf.routes",std::ios::out);g.PrintRoutingTableAllAt(Seconds(12), routingStream);N.Executing SimulatorNS_LOG_INFO ("Run Simulation.");Simulator::Run ();Simulator::Destroy ();NS_LOG_INFO ("Done.");IV.S IMULATION R ESULTSimulation results verify that the shortest path tree conforms to Dijkstra algorithm in OSPF protocol and count package delay to check network performance.A.Generating Shortest PathAccording to the topology in Fig. 2, in the 1st second executes a Dijkstra SPF algorithm on the topology for each node, finds the shortest path between node 0 and node 3, as shown in Fig. 3 the shortest path is node 0->node 4-> node 1-> node 2-> node 5-> node 6-> node 3, rather than node 0->node 4-> node 1-> node 2-> node 3 which include the least node.In 2nd second, disconnecting the link node 1 and node 2, node 0 executes a Dijkstra SPF algorithm on the topology for each node, finds the shortest path between node 0 and node 3, as shown in Fig.4 at the moment, the shortest path is node 0->node 4-> node 1-> node 5-> node 6 -> node 3.In 4th second, reconnecting the link node 1 and node 2, node 0 executes a Dijkstra SPF algorithm on the topology for each node, finds the shortest path between node 0 and node 3, the shortest path is node 0->node 4-> node 1-> node 2-> node 5-> node 6-> node 3.In 6th second, disconnecting the link node 5 and node 6,node 0 executes a Dijkstra SPF algorithm on the topology for each node, finds the shortest path between node 0 and node 3, at the moment, the shortest path is node 0->node 4-> node 1-> node 2-> node 3.In 8th second, disconnecting the link node 2 and node 3,node 0 executes a Dijkstra SPF algorithm on the topology for each node, finds the shortest path between node 0 and node 3, at the moment, the shortest path is node 0->node 4-> node 1-> node 5-> node 2 -> node 3.In 12th second, reconnecting the link node 1 and node 2, node 0 executes a Dijkstra SPF algorithm on the topology for each node, finds the shortest path between node 0 and node 3, at the moment, the shortest path is node 0->node 4-> node 1-> node 5-> node 6 -> node 3.In 14th second, reconnecting the link node 1 and node 2, node 0 executes a Dijkstra SPF algorithm on the topology for each node, finds the shortest path between node 0 and node 3, at the moment, the shortest path is node 0->node 4-> node 1-> node 2-> node 5-> node 6-> node 3.Figure 2. topology with cost in simulationFigure 3. shortest path in 1stsecondFigure 4. shortest path in 2ndsecondB. DelayIn Fig. 5 are shown the simulation results of delay for the communication between node 0 and node 3. Under different shortest path, delay is diverse. The network delay is very close to the case when the packets take the same path. The path of least delay is not necessarily the shortest path.The average delay is the time of all data packets arrived at destination node from the source node. The characterization means the current status of the network. As shown in Fig. 6,V.C ONCLUSIONSummary, this paper describes an effective simulation method to realize global routing protocols, evaluate network performance, and carry out a detailed analysis of delay and shortest path tree. The conclusion has certain reference value.A CKNOWLEDGMENTThis work was supported by National Natural Science Foundation of China (61271198) and Beijing Natural Science Foundation (4131003).Figure 5.the packet delayFigure 6. the average delay under different rateR EFERENCES[1] NS-3 Tutorial. /, 12 Dev 2012[2] NS-3 project NS-3 Doxygen. /,12 Dev 2012 [3] Andrew S. Tanenbaum. Computer Network Fourth Edition. Beijing:Tsinghua University Press.pp.350-366,454-459(2008) [4] WANG Jianqiang,LI Shiwei,ZENG Junwei,DOUYingying.(2011)Simulation Research of VANETs Routing Protocols Performance Based on NS -3Microcomputer Applications Vol. 32 No. 11.[5] NS-3 project NS-3 Reference Manual. /,12Dev 2012[6] Timo Bingmann.( 2009). Accuracy Enhancements of the 802.11Model and EDCA QoS Extensions in ns-3. Diploma Thesis at the Institute of Telematics[7] Learmonth, G. Holliday, J. (2011) NS3 simulation and analysis ofMCCA: Multihop Clear Channel Assessment in 802.11 DCF .Consumer Communications and Networking Conference (CCNC). IEEE[8] Henderson T R,Floyd S,Riley G F(2006) NS-3 Project Goals.Proceedings of the Workshop of Network Simulation. Pisa, Italy.[9] Vincent.S,Montavont.J(2008).Implementation of an IPv6 Stack forNS-3. Proceedings of the Workshop of Network Simulation.AthensGreece:[s. n.].。
![一种基于宽度径向基神经网络的机械臂阻抗学习控制方法[发明专利]](https://uimg.taocdn.com/4d345aa7ed3a87c24028915f804d2b160b4e860d.webp)
专利名称:一种基于宽度径向基神经网络的机械臂阻抗学习控制方法
专利类型:发明专利
发明人:王敏,曾宇鹏,林梓欣
申请号:CN202110899746.0
申请日:20210806
公开号:CN113977572A
公开日:
20220128
专利内容由知识产权出版社提供
摘要:本发明公开了一种基于宽度径向基神经网络的机械臂阻抗学习控制方法,包括如下步骤:根据机械臂结构建立机械臂的运动学模型;基于拉格朗日方程及运动学模型,在任务空间下建立机械臂的动力学模型;建立期望的任务空间回归轨迹模型以及二阶阻抗模型;构造宽度径向基神经网络以实现神经网络节点的动态调整;利用宽度径向基神经网络结合二阶阻抗模型,构建自适应神经网络阻抗控制器;基于确定学习理论获取经验知识,构建常值神经网络阻抗控制器。
本方法不仅有效解决了机械臂在未知动力学信息条件下与环境交互的精确阻抗控制,而且提高了控制系统的实时性,为机械臂在与环境重复交互的情景下,提供一种新的安全可靠方法。
申请人:华南理工大学
地址:510640 广东省广州市天河区五山路381号
国籍:CN
代理机构:广州市华学知识产权代理有限公司
代理人:李斌
更多信息请下载全文后查看。
第52卷第12期表面技术2023年12月SURFACE TECHNOLOGY·135·基于超疏水表面的主被动复合防/除冰技术研究进展许露晴1,石珍旭1,刘祯达1,刘蕊迪2,杨邱程1,潘梦瑶1,刘森云2*,王德辉1*,邓旭1(1.电子科技大学 基础与前沿研究院,成都 610054;2.中国空气动力研究与发展中心 结冰与防除冰重点实验室,四川 绵阳 621000)摘要:介绍了光热、电加热、磁能、声波能与超疏水表面相结合的主被动复合防/除冰技术及其机理与应用,阐述了以上复合型防/除冰技术的优势与不足。
其中,光热复合技术具有耗能低、材料选择多样化等优点;电加热复合技术工艺简单,易于规模化制造;磁能复合技术可满足复杂场景的防/除冰应用需求;声波复合技术则具有结构简单的优势。
此外,同时复合多种能场可进一步提升防/除冰工作效率,是主被动复合技术的发展趋势之一。
最后,阐述了基于超疏水表面的主被动复合防/除冰技术的不足之处,并展望了复合防/除冰技术的应用研究前景。
关键词:超疏水;电加热;光热;磁能;声波能;防/除冰;主被动复合式中图分类号:TG176 文献标识码:A 文章编号:1001-3660(2023)12-0135-12DOI:10.16490/ki.issn.1001-3660.2023.12.012Research Progress of Active/Passive Composite Anti/De-icingTechnologies Based on Superhydrophobic SurfacesXU Lu-qing1, SHI Zhen-xu1, LIU Zhen-da1, LIU Rui-di2, YANG Qiu-cheng1,PAN Meng-yao1, LIU Sen-yun2*, WANG De-hui1*, DENG Xu1(1. Institute of Fundamental and Frontier Sciences, University of Electronic Science and Technology of China,Chengdu 610054, China; 2. Key Laboratory of Icing and Anti/De-icing, China Aerodynamics Researchand Development Center, Sichuan Mianyang 621000, China)ABSTRACT: The work aims to introduce composite anti-/deicing methods that combine superhydrophobic surfaces with active anti-icing methods of photothermal treatment, heating, magnetic energy, and acoustic energy, along with their mechanisms and applications. The advantages and shortcomings of the composite anti-/deicing technologies were summarized. Among them, the photothermal composite technology showed low energy consumption and diverse choice on materials. The electric heating composite technology possessed a simple process and was beneficial to preparation in a large area. The magnetic energy composite technology satisfied the needs of anti-/deicing in complex scenes. The acoustic wave composite technology had a收稿日期:2023-10-29;修订日期:2023-12-08Received:2023-10-29;Revised:2023-12-08基金项目:中国空气动力研究与发展中心结冰与防除冰重点实验室开放课题(IADL20210411)Fund:Key Laboratory of Icing and Anti/De-icing of CARDC (IADL20210411)引文格式:许露晴, 石珍旭, 刘祯达, 等. 基于超疏水表面的主被动复合防/除冰技术研究进展[J]. 表面技术, 2023, 52(12): 135-146.XU Lu-qing, SHI Zhen-xu, LIU Zhen-da, et al. Research Progress of Active/Passive Composite Anti/De-icing Technologies Based on Superhydrophobic Surfaces[J]. Surface Technology, 2023, 52(12): 135-146.*通信作者(Corresponding author)·136·表面技术 2023年12月simple structure. In addition, the simultaneous combination of multiple energy fields could further enhance the efficiency of anti/deicing performance, so it was one of the trends for developing active-passive composite technologies. Finally, the shortcomings of the current active-passive composite technologies were elaborated based on superhydrophobic surfaces, and the application of those composite anti-/deicing technologies was prospected.KEY WORDS: superhydrophobic; heating; photothermal; magnetic energy; acoustic energy; anti/deicing; active-passive composite结冰是一种普遍的自然现象,严重的表面结冰会对船舶[1]、海上平台[2]、电力线[3]、飞机[4]、风力涡轮机[5]、道路[6]、光伏发电[7]的正常运行和安全造成严重影响[8]。
专利名称:可重构智能表面辅助的无线通信方法及装置专利类型:发明专利
发明人:王莹,陈源彬,唐子行
申请号:CN202011584901.1
申请日:20201228
公开号:CN112804695A
公开日:
20210514
专利内容由知识产权出版社提供
摘要:本发明提供一种可重构智能表面辅助的无线通信方法及装置,该方法包括:根据UE发射功率、UE到BS的信道增益、UE到可重构智能平面RIS的信道增益以及RIS到BS的信道增益,确定每一UE上行SINR;根据UE上行SINR,确定所有UE可达速率,以最大化所有UE可达速率的期望为目标,以每一UE上行SINR小于预设信干噪比的概率,小于最大中断概率为约束条件,确定对应的UE功率分配和RIS反射系数。
该方法以每一UE上行SINR小于预设信干噪比的概率,小于最大中断概率为约束条件,能够实现所有UE可达速率期望值的最大化,并确定此条件下的UE功率分配和RIS反射系数,实现了智能表面辅助的优化配置。
申请人:北京邮电大学
地址:100876 北京市海淀区西土城路10号北京邮电大学
国籍:CN
代理机构:北京路浩知识产权代理有限公司
代理人:郭亮
更多信息请下载全文后查看。
Lecture 6-2Functions (2)Summer School, 2013School of Information TechnologiesThe University of Sydney, Australia.au/~engg1801engg1801help@.auJason Chanj.chan@.auENGG1801 Engineering Computing 1Day Date (Jan 2013)Lecture topics Assessment1Fri 4Introduction, Part 1: Excel–Basics2Sat 5Functions, Plotting, Solving equations, File I/OSun 6---3Mon 7Matrix algebra Lab Exam 1 (10%) [9-10am] 4Tue 8Part 2: Matlab–Basics, If statements, Arrays5Wed 9Loops6Thu 10Functions (1)7Fri 11Functions (2)8Sat 12Character strings, Text & File I/O Lab Exam 2 (15%) [9-11am] Sun 13---9Mon 142-D and 3-D plotting, Surface plots10Tue 15Creating movies from matrices, Matrix algebra11Wed 16Matrix algebra, Interpolation and curve fitting12Thu 17Polynomial regression, Images13Fri 18Help for the Final Exam Lab Exam 3 (25%) [9-11am] Sat 19 –Sun 20---Exam Mon 21---Final Exam (50%)ENGG1801 Engineering Computing2•Functions–More about functions so that they can givevalues that can be used in other parts of theprogram3ENGG1801 Engineering Computing13ENGG1801 Engineering ComputingDoes this function make sense?Is it written correctly?f(n) = 3n + 214ENGG1801 Engineering ComputingWhat is the value of n in this function?And what is the specific value of f(n)?f(n) = 3n + 2•The function is a general case•n can have many values, depending on what specific value we give it when we use it:f(2)or f(-1)etc…•Same with functions in Matlab:Parameters are NOT given valuesinside the function. They are givenvalues when the function is usedENGG1801 Engineering Computing1516ENGG1801 Engineering ComputingWhat is the value of n in this function?function print1toN(n)for i = 1:ndisp(i);endend17ENGG1801 Engineering ComputingDoes this function make sense?function print1toN(n)for i = 1:ndisp(i);endendfunction print1toN(n)for i = 1:ndisp(i);endend•This function is written correctly•The value of the parameter n is given when the function is used, it is NOT given a value inside of the function18ENGG1801 Engineering Computing•We need to give the parameter value when we use the function like this:% Print the integers 1 to 4maxNumber = 4;print1toN(maxNumber);•This code belongs in another file, and goes outside of the function we are using19ENGG1801 Engineering Computing20ENGG1801 Engineering ComputingJust looking at this function,what specific numberswill this function print?function print1toN(n)for i = 1:ndisp(i);endend•Our functions should work in the general case, for any input value we give it •When we use a function, we then have to use it in a specific case•That’s why we have parameters–the function can be used with different (and specific) input values, and the function behaves differently depending on the specific input value given21ENGG1801 Engineering Computing22ENGG1801 Engineering ComputingCan you see what is wrongwith this function?function print1toN(n)n = 4;for i = 1:ndisp(i);endend•On the previous slide, the function only works for a specific case, because in the function, the parameter value was set to a specific value(4) when we wrote:n = 4;•Parameter values are supposed to be given when the function is used, NOT inside the function23ENGG1801 Engineering Computing•So now if we use the function like this: % Try to print the integers 1 to 6,% but it will print 1 to 4 because the% function has been written to only% work in a specific casemaxNumber = 6;print1toN(maxNumber);the function only prints the integers 1to 424ENGG1801 Engineering Computing•We have learnt to use parameters to pass data into a function•But how do we get a function to pass data out of the function?•Remember the problem of variable scope (lecture 6-1) means that a variable created in a function cannot be seen outside of that function25ENGG1801 Engineering Computing•So if we write the function like this:% This function squares the given% number (multiplies the given% number by itself), but the result% cannot be seen outside of the% functionfunction squareBad(n)result = n*n;end26ENGG1801 Engineering Computing•We can’t get the result like this:% Try to calculate 4 squarednumber = 4;squareBad(number);% This gives an error message,% because the variable ‘result’ can% only be seen inside the functiondisp(result);27ENGG1801 Engineering Computing28•When we run the previous code (saved in variableScopeDemo5.m ), we get this error message:ENGG1801 Engineering Computing•The function below also doesn’t work, because it only prints onto the screen: function squareBad2(n)result = n*n;disp(result);end•It does not give back a value / result that can be used elsewhere in the program29ENGG1801 Engineering Computing•In maths, a function has a result or value, and it can be used like this:f(n) = 3n + 2y= f(2) + 2xf(1)= [3x2+2] + 2x[3x1+2]= 18•We would like to do the same in programs •Our functions should be able to give back a value or result that can be used somewhere else in the programENGG1801 Engineering Computing30•We want to use the function like this:% Calculate 4 squared using a% function, and store the result in a% variable which can be used later% in the program (such as to print)number = 4;result = square(number);disp(result);31ENGG1801 Engineering Computing•But the way we have been writing functions so far wont work:function squareBad(n)result = n*n;end32ENGG1801 Engineering Computing•We need to tell Matlab that we want this function to return a value, like this:function result = square(n)result = n*n;end33ENGG1801 Engineering Computing34•We do this by putting a variable name and the =sign on the left of the function name •Whatever value this variable has when the function is finished is returned to the code that called this functionENGG1801 Engineering Computing•Now we can use the function as much as we want, with different values each time: % Use a function that returns to us a valuenumber = 4;result1 = square(number);disp(result1);% Let’s use the function again in a different wayresult2 = square(5);disp(result2);% And yet another different waydisp(square(6));35ENGG1801 Engineering Computing36•We can assign the returned value from the function to a variableENGG1801 Engineering Computing37•But it only makes sense to do this if the function returns a value% We can’t assign the result of a function to a% a variable if that function doesn’t return anything number = 4;result = print1toN(number);ENGG1801 Engineering Computing% This code prints the integers 1 to 3% See lecture 5-1for i = 1:3disp(i);end38ENGG1801 Engineering Computing% This function prints 1 to 3 using% a for loop. It takes no parameters,% which means always it does the% same thingfunction print1to3()for i = 1:3disp(i);endend39ENGG1801 Engineering Computing% To use the function on the previous % slide, we write code like this in% another fileprint1to3();40ENGG1801 Engineering Computing% This function prints 1 to 100 using% a for loopfunction print1to100()for i = 1:100disp(i);endend41ENGG1801 Engineering Computing% This function prints all the integers % from 1 to the given value, assuming % n >= 1. It does different things% depending on what it has been given function print1toN(n)for i = 1:ndisp(i);endend42ENGG1801 Engineering Computing% To use the function on the previous % slide, we write code like this in% another filemaxNumber = 4;print1toN(maxNumber);43ENGG1801 Engineering Computing% This function prints all the integers % between the 2 given values,% assuming low <= highfunction printIntegers(low, high)for i = low:highdisp(i);endend44ENGG1801 Engineering Computing% This function prints all the elements % in the given arrayfunction printElements(numbers)for n = numbersdisp(n);endend45ENGG1801 Engineering Computing% This function prints to the screen the % square of the given number. But no % other part of the program will know % the resultfunction square(n)result = n*n;disp(result);end46ENGG1801 Engineering Computing% To use the function on the previous % slide, we write code like this in% another filenumber = 4;square(number);47ENGG1801 Engineering Computing% This function returns the square of% the given number. This allows other % parts of the program to know the% resultfunction result = square(n)result = n*n;end48ENGG1801 Engineering Computing% To use the function on the previous % slide, we write code like this in% another filenumber = 4;% Notice that we store the result% returned from the function into a% variable, so that we can use it later numberSquared = square(number); disp(numberSquared);49ENGG1801 Engineering Computing% This function returns more than 1 thing.% The only way to do this is to return an array function [sum, product] = sumAndProduct(a, b) sum= a + b;product= a * b;end50ENGG1801 Engineering Computing% To use the function on the previous % slide, we write code like this in% another fileresult = sumAndProduct(3, 5);% The returned result is an array, so we % can use it like a normal arraydisp(result(1));disp(result(2));51ENGG1801 Engineering Computing•Parameters are the input to a function –There can be 0, 1, or more parameters •Returned values are the output of a function–There can be no returned values, or there can be 1 returned value–To return many things, put them into an array •Parameters and returned values do NOT have to be the same52ENGG1801 Engineering Computing% This function takes a mark (numeric parameter) and returns % the grade (string, or series of characters on the keyboard) function grade = convertMarkToGrade(mark)if mark >= 85grade = ‘HD’;elseif mark >= 75grade = ‘D’;elseif mark >= 75grade = ‘CR’;elseif mark >= 75grade = ‘P’;elsegrade = ‘F’;endend53ENGG1801 Engineering Computing% This function takes a numeric parameter, % and returns a boolean / logical result (true % if the given number is 0, otherwise false is % returned)function result = isZero(n)if n == 0result = true;elseresult = false;endend54ENGG1801 Engineering Computing55ENGG1801 Engineering Computing data typeDescription Examples Numeric Any kind of number:-Integer-Decimal number-Scientific notation34-637473.141596.022e23String Any series ofcharacters onthe keyboard‘abc’‘I love Matlab’‘engg1801help@.au’Logical*Boolean values(true or false)true false * Logical values, when printed out, appear as 1 (for true) and 0 (for false), but that is just how they appear on screen. They are actually stored as true and false values, not numeric values.% This function prints the integers from 1 up % to the given integer n, assuming that% n >= 1. Nothing is returnedfunction print1toN(n)for i = 1:ndisp(i);endend56ENGG1801 Engineering Computing% This function takes 2 numbers, and returns% just 1 number: the difference between the 2% given numbersfunction difference = getDifference(a, b)% This difference could be negativedifference = a –b;% Make sure difference is positiveif difference < 0difference = difference * –1;endend57ENGG1801 Engineering Computing•Almost always, it’s better to return a value instead of printing something to the screen –The calling code may be in the middle ofprinting something else, and doesn’t want toprint out the result of this function (it justneeds the result to do something)–If the function prints something, then thecalling code can’t control how it is printed (e.g.in a sentence, formatted neatly, certainnumber of decimal places, etc).58ENGG1801 Engineering Computing•Your function should not print anything unless there is a specific reason to do so:–The function specifically has to print, e.g.•Print a menu to screen•Exam Q tells you to print something–The user of the program needs to see whatthe result is, and the output format is clear–You are trying to debug your program, andwant to know what a variable’s value is atdifferent points of the program59ENGG1801 Engineering Computing。
Lecture 9-23-D Surface PlottingSemester 1, 2012School of Information TechnologiesThe University of Sydney, Australia.au/~engg1801engg1801help@.auJason Chanj.chan@.auENGG1801 Engineering Computing 1Day Date (Jan 2013)Lecture topics Assessment1Fri 4Introduction, Part 1: Excel–Basics2Sat 5Functions, Plotting, Solving equations, File I/OSun 6---3Mon 7Matrix algebra Lab Exam 1 (10%) [9-10am] 4Tue 8Part 2: Matlab–Basics, If statements, Arrays5Wed 9Loops6Thu 10Functions (1)7Fri 11Functions (2)8Sat 12Text & File I/O, Character strings Lab Exam 2 (15%) [9-11am] Sun 13---9Mon 142-D and 3-D plotting, Surface plots10Tue 15Creating movies from matrices, Matrix algebra11Wed 16Matrix algebra, Interpolation and curve fitting12Thu 17Polynomial regression, Images13Fri 18Help for the Final Exam Lab Exam 3 (25%) [9-11am] Sat 19 –Sun 20---Exam Mon 21---Final Exam (50%)ENGG1801 Engineering Computing2•Surface plotting–How to draw shapes and surfaces in 3-D3ENGG1801 Engineering Computing4•We can plot z = x 2+ y 2ENGG1801 Engineering Computingmesh()only shows the connecting lines -3-2-10123-2251015xz = x 2 + y 2yz-3-2-10123-2251015xz = x 2 + y 2yzsurf()shows the faces of the surfaces% Set the x and y valuesx = -3:3;y = x;% Create a matrix, 'xx', which contains the x% values for all the points on the x-y plane% (similar for 'yy')[xx,yy] = meshgrid(x,y);% Calculate the corresponding z values for each of % the (x,y) points on the x-y planezz = xx.^2 + yy.^2;% Continued on next slide...5ENGG1801 Engineering Computing6% ... continued from previous slide% Plot the mesh given the x, y and z values mesh(xx,yy,zz);% Set the axes so that they reach only to the % limits of the values axis tight;% Add labelstitle('z = x^2 + y^2');xlabel('x');ylabel('y');zlabel('z');ENGG1801 Engineering Computing-3-2-10123-2251015xz = x 2 + y 2yz7•Instead of mesh(), we can use the surf()function to plot a surface% Plot the surface given the % x, y and z values surf(xx,yy,zz);ENGG1801 Engineering Computing-3-2-10123-2251015xz = x 2 + y 2yz•We can also plot one after the other on the same figure using pause:% Plot the meshmesh(xx,yy,zz);% Wait until the user presses somethingpause;% Now, overwrite the mesh and plot the% surface on the same figuresurf(xx,yy,zz);8ENGG1801 Engineering Computing•meshgrid()creates 2 matrices with the values of x and y for each point on the x-y plane–It takes 2 arrays x and y and returns 2matrices xx and yy–The rows of xx are copies of x–The columns of yy are copies of y9ENGG1801 Engineering Computing10>> x = -3:1:3x = -3 -2 -1 0 1 2 3 >> y = x;>> [xx,yy] = meshgrid(x,y)xx = -3 -2 -1 0 1 2 3-3 -2 -1 0 1 2 3-3 -2 -1 0 1 2 3-3 -2 -1 0 1 2 3-3 -2 -1 0 1 2 3-3 -2 -1 0 1 2 3-3 -2 -1 0 1 2 3yy = -3 -3 -3 -3 -3 -3 -3-2 -2 -2 -2 -2 -2 -2-1 -1 -1 -1 -1 -1 -10 0 0 0 0 0 01 1 1 1 1 1 12 2 2 2 2 2 23 3 3 3 3 3 3ENGG1801 Engineering Computing-3-2-10123-2251015xz = x 2 + y 2yz111) Use meshgrid()to generate matrices ofrepeated rows of x andcolumns of y over thedomain of the function2)Calculate z = f(x,y)3)Call either mesh()or surf()that accepts the x-y grid and z values to produce the plotENGG1801 Engineering Computing[xx,yy] = meshgrid(x,y);mesh(xx,yy,zz)surf(xx,yy,zz)zz = xx.^2 + yy.^2;12•Matlab as 13 in-built colormaps•User-defined colormaps canalso be created•The default is JetENGG1801 Engineering Computing-3-2-10123-2251015x z = x 2 + y 2y z -3-2-10123-202051015x z = x 2 + y 2y z -3-2-10123-202051015x z = x 2 + y 2y zcolormap bone colormap coolcolormap autumn•Plot part of the top half of a sphere, defined by the equation:x2+ y2+ z2= r2where r is the radius–Vary x and y from -1 to 1 with a step of 0.01–Set the radius of the sphere r to 3–The surface should be colored in gray shades –Name the plot “hemisphere” and label axes13ENGG1801 Engineering Computing% Define r, x and y valuesr = 3;x = -1:0.01:1;y = x;% Create the x-y grid[xx yy] = meshgrid(x, y);% Calculate the z values using the x-y% gridzz = sqrt(r.^2 -xx.^2 -yy.^2)14ENGG1801 Engineering Computing15% Use grey shades for the surface colormap bone% Generate the surface plotsurf(xx,yy,zz)% Add a title and% labelsxlabel('x');ylabel('y');zlabel('z');title('Hemisphere');ENGG1801 Engineering Computing16•We can smooth the surface with:shading interpENGG1801 Engineering Computing•Given 2 files:atlanta.txt–coordinates of streets of Atlantattimes.txt–travel times to the city centrefrom different parts of Atlanta•Visualize these datasets17ENGG1801 Engineering Computing•Here are the first few lines of atlanta.txt53423.00 53343.00 -84546100.00 33988160.00 -84556050.00 33993620.00 1.00 3025.0054528.00 53351.00 -84546080.00 33988480.00 -84558400.00 33995480.00 1.00 3025.00130081.00 128176.00 -84243880.00 33780010.00 -84249980.00 33800840.00 1.00 3025.00130105.00 128192.00 -84243590.00 33780060.00 -84249740.00 33800840.00 1.00 3025.0058150.00 71086.00 -84509920.00 33944340.00 -84517200.00 33958190.00 1.00 3025.0058190.00 71102.00 -84510420.00 33944930.00 -84516490.00 33957280.00 1.00 3025.00166861.00 168241.00 -84252840.00 33895840.00 -84247360.00 33899290.00 1.00 66.00168241.00 169968.00 -84247360.00 33899290.00 -84240250.00 33903630.00 1.00 71.00169968.00 169984.00 -84240250.00 33903630.00 -84216090.00 33911010.00 1.00 64.00169984.00 173303.00 -84216090.00 33911010.00 -84203990.00 33913990.00 1.00 70.00•Each row corresponds to a street •Columns 1, 2 and 8 are irrelevant •Columns 3 and 4: the x and y coordinates of the beginning of the street18ENGG1801 Engineering Computing53423.00 53343.00 -84546100.00 33988160.00 -84556050.00 33993620.00 1.00 3025.0054528.00 53351.00 -84546080.00 33988480.00 -84558400.00 33995480.00 1.00 3025.00130081.00 128176.00 -84243880.00 33780010.00 -84249980.00 33800840.00 1.00 3025.00130105.00 128192.00 -84243590.00 33780060.00 -84249740.00 33800840.00 1.00 3025.0058150.00 71086.00 -84509920.00 33944340.00 -84517200.00 33958190.00 1.00 3025.0058190.00 71102.00 -84510420.00 33944930.00 -84516490.00 33957280.00 1.00 3025.00166861.00 168241.00 -84252840.00 33895840.00 -84247360.00 33899290.00 1.00 66.00168241.00 169968.00 -84247360.00 33899290.00 -84240250.00 33903630.00 1.00 71.00169968.00 169984.00 -84240250.00 33903630.00 -84216090.00 33911010.00 1.00 64.00169984.00 173303.00 -84216090.00 33911010.00 -84203990.00 33913990.00 1.00 70.00•Columns 5 and 6: the x and y coordinates of the end of the street•Columns 3 to 6: need to be divided by1,000,000 to convert to latitude / longitude19ENGG1801 Engineering Computing53423.00 53343.00 -84546100.00 33988160.00 -84556050.00 33993620.00 1.00 3025.0054528.00 53351.00 -84546080.00 33988480.00 -84558400.00 33995480.00 1.00 3025.00130081.00 128176.00 -84243880.00 33780010.00 -84249980.00 33800840.00 1.00 3025.00130105.00 128192.00 -84243590.00 33780060.00 -84249740.00 33800840.00 1.00 3025.0058150.00 71086.00 -84509920.00 33944340.00 -84517200.00 33958190.00 1.00 3025.0058190.00 71102.00 -84510420.00 33944930.00 -84516490.00 33957280.00 1.00 3025.00166861.00 168241.00 -84252840.00 33895840.00 -84247360.00 33899290.00 1.00 66.00168241.00 169968.00 -84247360.00 33899290.00 -84240250.00 33903630.00 1.00 71.00169968.00 169984.00 -84240250.00 33903630.00 -84216090.00 33911010.00 1.00 64.00169984.00 173303.00 -84216090.00 33911010.00 -84203990.00 33913990.00 1.00 70.00•Column 7: a number representing which type of street (e.g. quiet street, highway) –the values range from 1 to 620ENGG1801 Engineering Computing21•We wantour plotto looklike this:ENGG1801 Engineering Computing-84.6-84.55-84.5-84.45-84.4-84.35-84.3-84.25-84.2-84.1533.5533.633.6533.733.7533.833.8533.933.9534% Read the street data from fileraw = dlmread('atlanta.txt');% Get only the relevant columns;% ':' on it's own means all (e.g. all rows)streets = raw(:,3:7);% Count the number of rows and columns[rows,cols] = size(streets);% The different colors for the different street% typescolors = 'rgbkcmo';% Now plot each of the streets (see next slide)22ENGG1801 Engineering Computing% For each streetfor i = 1:rows% x and y coordinates of the start and end of the streetx = streets(i,[1 3])/1000000;y = streets(i,[2 4])/1000000;% The type of streettype = streets(i,5);% If the type of street is not between 1 and 6, set it to 7if type < 1 || type > 6type = 7;end% Plot each streetplot(x,y,colors(type));% Plot all streets on the same graphhold on;end ENGG1801 Engineering Computing23% ... continued from previous slide% Max/min values on the x and y axes should be% max/min data valuesaxis tight;24ENGG1801 Engineering Computing•Here are the first few lines of ttimes.txt1 1 76 -84575725 33554573 14.341 2 77 -84569612 33554573 01 3 78 -84563499 33554573 01 4 79 -84557387 33554573 01 5 80 -84551274 33554573 51.661 6 81 -84545161 33554573 50.21 7 82 -84539049 33554573 49.41 8 83 -84532936 33554573 49.651 9 84 -84526823 33554573 01 10 85 -84520710 33554573 0•Columns 4 and 5: x and y coordinates of a point•Column 6: travel time to city centre from that point (mins)25ENGG1801 Engineering Computing1 1 76 -84575725 33554573 14.341 2 77 -84569612 33554573 01 3 78 -84563499 33554573 01 4 79 -84557387 33554573 01 5 80 -84551274 33554573 51.661 6 81 -84545161 33554573 50.21 7 82 -84539049 33554573 49.41 8 83 -84532936 33554573 49.651 9 84 -84526823 33554573 01 10 85 -84520710 33554573 0•We need to plot column 6 (time) (z) vs columns 4 (x) and 5 (y), but first we need to create the x-y grid similarly to what meshgrid()does26ENGG1801 Engineering Computing1 1 76 -84575725 33554573 14.341 2 77 -84569612 33554573 01 3 78 -84563499 33554573 01 4 79 -84557387 33554573 01 5 80 -84551274 33554573 51.661 6 81 -84545161 33554573 50.21 7 82 -84539049 33554573 49.41 8 83 -84532936 33554573 49.651 9 84 -84526823 33554573 01 10 85 -84520710 33554573 0•Values in column 1 correspond to values in column 5 (same with columns 2 and 4)•That is, columns 1 and 2 define the indices of the points in the x-y plane: (1,1), (1,2), … (1,75), (2,1), … (2,75), … (75,75)27ENGG1801 Engineering Computing1 1 76 -84575725 33554573 14.341 2 77 -84569612 33554573 01 3 78 -84563499 33554573 01 4 79 -84557387 33554573 01 5 80 -84551274 33554573 51.661 6 81 -84545161 33554573 50.21 7 82 -84539049 33554573 49.41 8 83 -84532936 33554573 49.651 9 84 -84526823 33554573 01 10 85 -84520710 33554573 0•These indices (columns 1 and 2), together with the values of the points in the x-y plane (columns 4 and 5), can be used to create the matrices that meshgrid() produces28ENGG1801 Engineering Computing29•We wantour plotto looklike this:•Our codewillcontinuefrombefore…ENGG1801 Engineering Computing% Read the travel time data from filett = dlmread('ttimes.txt');% Count the number of rows and columns[rows,cols] = size(tt);% For each coordinatefor i = 1:rows% The x and y indices for the x-y gridr = tt(i, 1);c = tt(i, 2);% The x and y coordinates for the x-y gridxc(r,c) = tt(i, 4)/1000000;yc(r,c) = tt(i, 5)/1000000;% The travel times for the (x,y) point to the city centrezc(r,c) = tt(i, 6);end30ENGG1801 Engineering Computing% ... continued from previous slide% Plot the function z = f(x,y)surf(xc, yc, zc);% Smooth the surfaceshading interp;% Set the degree of transparency% alpha(0) –totally transparent (invisible surface)% alpha(1) –totally opaque (cannot see through surface)alpha(0.5);% Show the dotted grid linesgrid on;% Max/min values on the x and y axes should be max/min data values axis tight;31ENGG1801 Engineering Computing% ... continued from previous slide% Add meaningful labelsxlabel('Longitude');ylabel('Latitude');zlabel('Travel time (min)');% Change the angle at which we view the 3-D plotview(-30, 45);% Display the legend, which shows what the different colors mean colorbar;32ENGG1801 Engineering Computing33•view(2)can beused to view in2-D, looking downat the 3-D picture•You can also usethe Rotate 3Dbuttonon thetoolbarENGG1801 Engineering Computing•3-D Surface Plots–mesh()and surf()–meshgrid()–Creating a function of 2 variables z = f(x,y)We can now create 3-D surface plots34ENGG1801 Engineering Computing。