Policies for Caching OLAP Queries
in Internet Proxies
Thanasis Loukopoulos and Ishfaq Ahmad,Senior Member,IEEE Abstract—The Internet now offers more than just simple information to the users.Decision makers can now issue analytical,as opposed to transactional,queries that involve massive data(such as,aggregations of millions of rows in a relational database)in order to identify useful trends and patterns.Such queries are often referred to as On-Line-Analytical Processing(OLAP).Typically,pages carrying query results do not exhibit temporal locality and,therefore,are not considered for caching at Internet proxies.In OLAP processing,this is a major problem as the cost of these queries is significantly larger than that of the transactional queries.This paper proposes a technique to reduce the response time for OLAP queries originating from geographically distributed private LANs and issued through the Web toward a central data warehouse(DW)of an enterprise.An active caching scheme is introduced that enables the LAN proxies to cache some parts of the data,together with the semantics of the DW,in order to process queries and construct the resulting pages.OLAP queries arriving at the proxy are either satisfied locally or from the DW,depending on the relative access costs.
We formulate a cost model for characterizing the respective latencies,taking into consideration the combined effects of both common Web access and query processing.We propose a cache admittance and replacement algorithm that operates on a hybrid Web-OLAP input,outperforming both pure-Web and pure-OLAP caching schemes.
Index Terms—Distributed systems,data communication aspects,Internet applications databases,Web caching,OLAP.
?
1I NTRODUCTION
C ACHING has emerged as a primary technique for coping
with high latencies experienced by the Internet users. There are four major locations where caching is performed:
1.proxy at the front-end of a server farm[7],
https://www.doczj.com/doc/441281064.html,work cache at the end-points of the backbone
network[13],
https://www.doczj.com/doc/441281064.html,N proxy[1],[39],and
4.browser.
Although caching at these locations has been shown to significantly reduce Web traffic[3],dynamically generated pages are not cacheable.Dynamic pages typically consist of a static part and a dynamic one(for example,query results).
On the other hand,the need for decision support systems has become of paramount importance in today’s business, leading many enterprises to building decision support databases called data warehouses(DWs)[14].Decision makers issue analytical,as opposed to transactional,queries that typically involve aggregations of millions of rows in order to identify interesting trends.Such queries are often referred to as OLAP(On-Line-Analytical-Processing).Users perceive the data of the DW as cells in a multidimensional data-cube[15].Fetching from the DW the parts of the cube needed by queries and performing aggregations over them is an extremely time consuming task.A common technique to accelerate such queries is to precalculate and store some results.Such stored fragments are essentially parts of views in relational database terms and hence we will refer to their storage as materialization/caching of OLAP views.Most of the past work on view selection for materialization is limited to the central server.
In this paper,we address the problem of caching OLAP queries posed by ad hoc,geographically spanned users, through their Web browsers.Unlike previous approaches, e.g.,[18],[20],we employ the existing proxy infrastructure and propose a method of caching both Web pages and OLAP query results in common proxy servers.Our work is applicable to other caching points,provided that significant traffic towards the DW passes through them(e.g.,edge servers of a Content Distribution Network[22]).Some preliminary results were presented in[25].
Web pages carrying OLAP query results,abbreviated as WOQPs(Web OLAP query pages),are essentially dynamic pages and are normally marked as uncacheable.This is not because their content changes frequently(as is the case for instance with sport pages where continuous updates occur in the server),but is rather due to the fact that it is unlikely that successive queries bear the same results.Therefore, unless the caching entity is enhanced with query processing capabilities,it is impossible to use a cached WOQP in order to answer future queries inquiring a subset of the cached results.The proposed active caching framework enables the proxies to answer queries using the views cached locally and construct the WOQPs needed to present the results in the users’browsers.For tackling cache replacement issues, we develop an analytical cost model and propose strategies that are empirically proven to lead to high quality solutions. Although active caching has been employed before in answering transactional queries[26],to the best of our
.T.Loukopoulos is with the Department of Computer and Communication
Engineering,University of Thessaly,37Glavani—28th October str.,
Deligiorgi Bld.,38221Volos,Greece.E-mail:luke@inf.uth.gr.
.I.Ahmad is with the University of Texas at Arlington,Box19015,CSE,
UTA,Arlington,TX76019.E-mail:iahmad@https://www.doczj.com/doc/441281064.html,.
Manuscript received13Sept.2004;revised4July2005;accepted8Sept.2005;
published online24Aug.2006.
Recommended for acceptance by J.Fortes.
For information on obtaining reprints of this article,please send e-mail to:
tpds@https://www.doczj.com/doc/441281064.html,,and reference IEEECS Log Number TPDS-0231-0904.
1045-9219/06/$20.00?2006IEEE Published by the IEEE Computer Society
knowledge,this is the first time that OLAP data are considered.The special case of OLAP involves unique challenges(for instance the results may vary in size by many orders of magnitude)and provides new opportu-nities for optimizations(e.g.,the interdependencies of the views in a lattice).
The rest of the paper is organized as follows:Section2 provides an overview of OLAP queries and illustrates the lattice notion to describe OLAP views.Section3presents the proposed framework for caching OLAP queries in departmental LAN proxies.Section4deals with the caching and replacement strategies for OLAP views.Section5 discusses the simulation results,while Section6presents the related work.Finally,Section7includes some summar-izing remarks.
2O VERVIEW OF OLAP Q UERIES
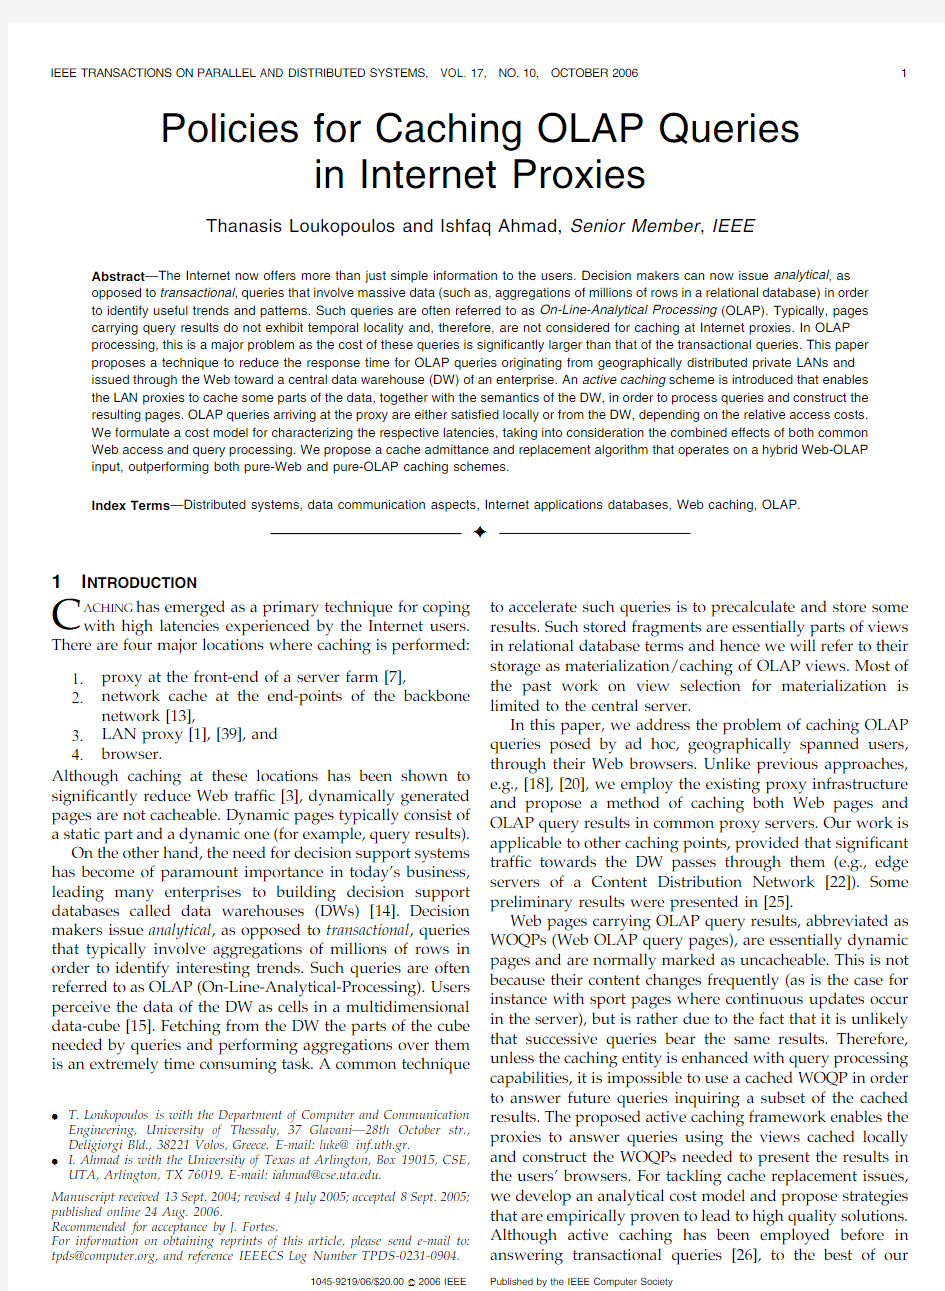
DWs are collections of historical,summarized,and con-solidated data,originating from several different databases (sources).Analysts and knowledge workers issue analytical (OLAP)queries over very large data sets,often millions of rows.DW’s contents are multidimensional and the typical OLAP queries consist of group_by and aggregate operations along one or more dimensions.Fig.1depicts an example of a2D space with the dimensions being the customer’s name and the product id.
The value at each cell in the2D grid gives the volume of sales for a specific
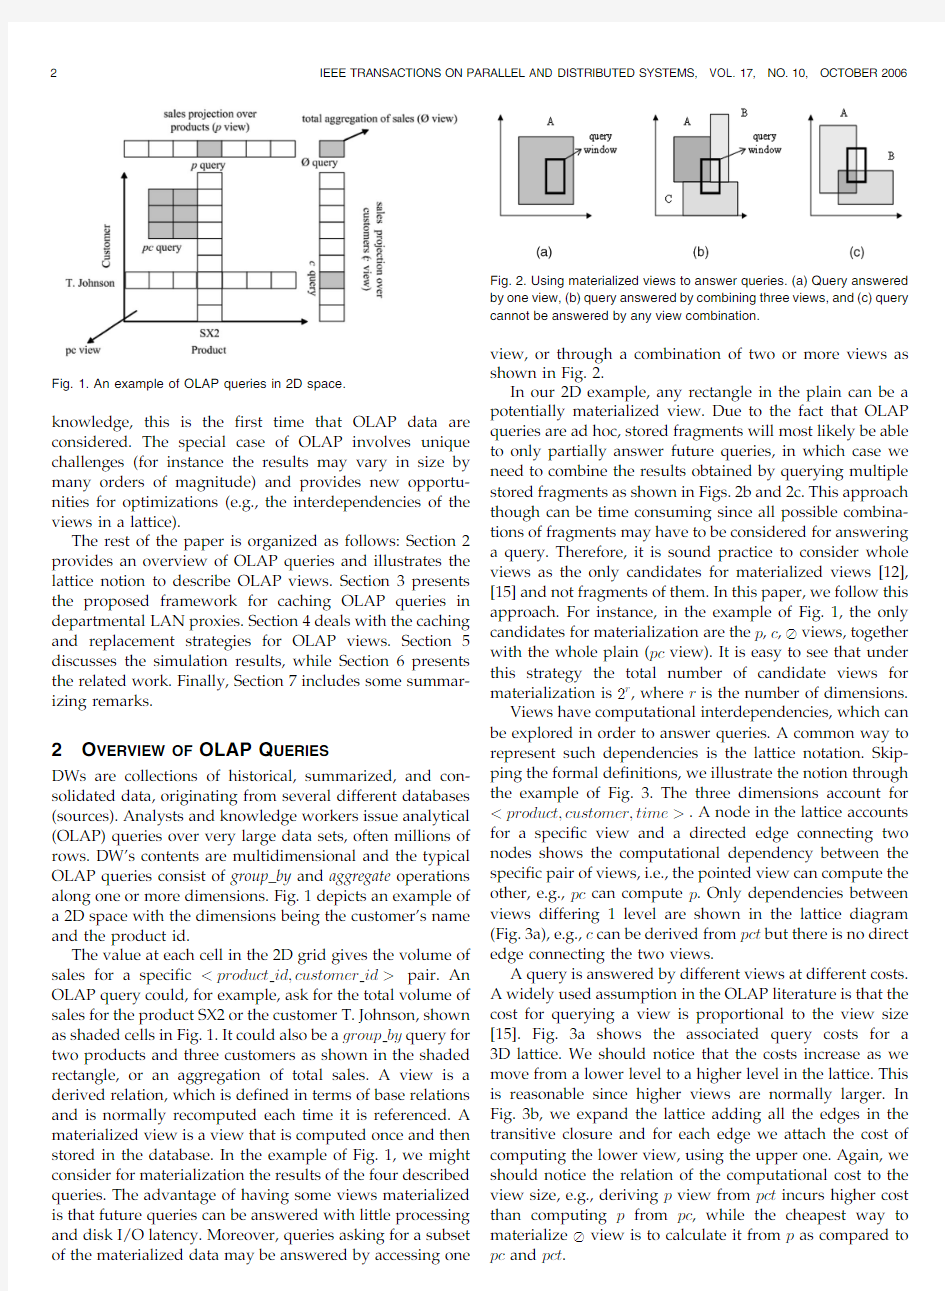
In our2D example,any rectangle in the plain can be a potentially materialized view.Due to the fact that OLAP queries are ad hoc,stored fragments will most likely be able to only partially answer future queries,in which case we need to combine the results obtained by querying multiple stored fragments as shown in Figs.2b and2c.This approach though can be time consuming since all possible combina-tions of fragments may have to be considered for answering a query.Therefore,it is sound practice to consider whole views as the only candidates for materialized views[12], [15]and not fragments of them.In this paper,we follow this approach.For instance,in the example of Fig.1,the only candidates for materialization are the p,c, views,together with the whole plain(pc view).It is easy to see that under this strategy the total number of candidate views for materialization is2r,where r is the number of dimensions.
Views have computational interdependencies,which can be explored in order to answer queries.A common way to represent such dependencies is the lattice notation.Skip-ping the formal definitions,we illustrate the notion through the example of Fig.3.The three dimensions account for
A query is answered by different views at different costs.
A widely used assumption in the OLAP literature is that the cost for querying a view is proportional to the view size [15].Fig.3a shows the associated query costs for a 3D lattice.We should notice that the costs increase as we move from a lower level to a higher level in the lattice.This is reasonable since higher views are normally larger.In Fig.3b,we expand the lattice adding all the edges in the transitive closure and for each edge we attach the cost of computing the lower view,using the upper one.Again,we should notice the relation of the computational cost to the view size,e.g.,deriving p view from pct incurs higher cost than computing p from pc,while the cheapest way to materialize view is to calculate it from p as compared to pc and pct.
Fig.1.An example of OLAP queries in2D
space.
https://www.doczj.com/doc/441281064.html,ing materialized views to answer queries.(a)Query answered
by one view,(b)query answered by combining three views,and(c)query
cannot be answered by any view combination.
Answering an OLAP query of the form:
SELECT
WHERE
involves the following steps:1)the query dimensions are defined as the union of the selection and grouping predicates,2)the corresponding to the dimensions view is located,and 3)in case the view is not cached,we check whether any of its ancestors are present and select the one with the minimum cost to answer the query.
Since recomputing views from the raw data is an expensive procedure,it is common practice that the central DW always keeps the topmost view materialized,in order to be able to handle all OLAP queries [20].We follow the same policy in the central DW but not in the proxy,since the size of the topmost view may be prohibitively large.A well-studied problem in the database community is the view selection under storage and update constraints (see Section 6),which can be defined as:Given the query frequencies and the view sizes,select the set of views to materialize so as to minimize the total query cost under storage capacity constraints and with respect to an update window.The problem is solved with static centralized solutions that are inefficient in the Web environment.Our approach is fundamentally different since we consider a distributed environment where OLAP views are cached together with normal Web pages.
3S YSTEM M ODEL
We consider an environment consisting of an enterprise with a central DW located at its headquarters and multiple regional departments having their own LANs.Each LAN is assumed to be connected to the Internet through a proxy server.Clients from the regional departments access the Web site of the company and issue OLAP queries as well as other Web traffic.The Web server of the company forwards the queries to the DW,fetches the results,creates the relevant WOQP and sends it back.In general,a WOQP has a static part possibly consisting of many files (e.g.,HTML document,gif images),and a dynamic part consisting of the
query results.Throughout the paper,we treat the static files as one composite object and assume that all WOQPs have the same static part.This is done without loss of generality,since extending the framework to account for different static parts is straightforward.
3.1Limitations of Existing Caching Schemes
A brute force approach for caching WOQPs at a client proxy is to treat them as static HTML documents,putting an appropriate TTL (time-to-live)value.The main drawback of this strategy is that the proxy will be able to satisfy a query only if it had been submitted in the past in its exact form.For instance,a user request for the projection at each year of the volume of products sold between 2000and 2002will not be answered,although the proxy might have cached a WOQP referring to the volumes sold between 1999and 2002.Treating WOQPs as normal Web pages will also affect the overall system performance when it comes to cache replacement decisions.The majority of replacement algorithms proposed in the literature [9],[17]assume that only network latency determines cache miss cost.This is not sufficient in our environment,since the processing time for answering an OLAP query at the server side is another significant factor.Therefore,we need to develop a new cache replacement policy that can take into account both delays.
3.2The Proposed Caching Policy
Our aim is to allow WOQP construction at the proxy using locally cached views.Active caching [10]was proposed in order to allow front-end network proxies to dynamically generate pages.A cache applet is kept together with the static part of the page and in the presence of a request the applet fetches the dynamic data from the original site and combines them with the cached static part to create the HTML document.The main benefit of this approach is that Web page construction is done close to the client and network latencies are avoided.We implement a similar scheme as follows:
The first time an OLAP query arrives at the central site,it triggers a number of different files to be sent to the client proxy:.The WOQP answering the query..
The static part of the WOQP.
LOUKOPOULOS
AND AHMAD:POLICIES FOR CACHING OLAP QUERIES IN INTERNET PROXIES 3
https://www.doczj.com/doc/441281064.html,ttice and expanded lattice diagrams for
.A cache applet.
.The view lattice diagram together with the asso-ciated query costs(Fig.3a)and a flag indicating
whether the view is materialized at the server or not.
.The id of the view used by the server to answer the query.
The proxy forwards the WOQP to the end-user without caching it and caches the applet,the lattice diagram and the static part of the WOQP.Afterward,it runs the cache applet,which is responsible for deciding whether to fetch the answering view from the server or not.Subsequent queries are intercepted and the cache applet is invoked to handle them.The applet checks whether the currently cached views can answer the query at a cost lower than sending the request to the server and selects the minimum cost cached view to do so.Then,it combines the query results with the static part of the WOQP to create the answering page.In case the views currently cached in the proxy cannot answer the query or answering the query from the proxy is more costly than doing so from the server, the request is forwarded to the Web server.
The Web server responds with the WOQP carrying the results,together with the id of the view used to satisfy the query.The WOQP is forwarded to the client without being cached and,subsequently,the applet decides whether to download the answering view or not.The alternative of sending only the query results to the proxy and constructing the WOQP there is not considered in this paper,although the model can encapsulate this case as well.We found that unless the results are very small(not common in OLAP),the additional overhead of going through two connections to reach the client instead of one nullifies any traffic gains. Moreover,it is reasonable to assume that WOQP construction in the proxy is more expensive than in the Web server(when the later operates under normal workload)and,therefore,it should only happen when query results are computable from the locally cached views which is more beneficial than redirecting the request to the Web server.If the storage left in the cache is not sufficient to store a newly arrived object(view or Web page),the proxy decides which objects to remove from the cache.In order to do so,it asks the cache applet for the benefit values of the cached views.The cache applet,the lattice diagram,and the static part of the WOQPs are never considered in the cache replacement phase for possible eviction.They are deleted from the cache only when the traffic towards the central DW falls below a threshold specified by an administrating entity.
4C ACHING V IEWS
Deriving an analytical cost model in order to decide whether to fetch a view or not is necessary.Furthermore, a suitable cache replacement strategy must be developed that takes into account both the nature of the normal Web traffic and the additional characteristics of OLAP queries. We tackle both problems by enhancing the GDSP(Popu-larity-Aware Greedy-Dual-Size)[17]algorithm to take into account query processing latencies.The resulting algorithm is referred to as VHOW(Virtual Hybrid OLAP Web). Similar enhancements are applicable to most proxy cache replacement algorithms proposed in the literature.Table1 summarizes the notation used.4.1The VHOW Algorithm
Let W i denote the i th Web page(either normal page,or WOQP),assuming a total ordering of them,seW iTits size and feW iTits access frequency.The basic form of VHOW algorithm computes a benefit value BeW iTfor each page using the following formula:
BeW iT?feW iTMeW iT=seW iT;e1Twhere MeW iTstands for the cost of fetching W i from the server in case of a cache miss.In other words BeW iTrepresents the per byte cost saved as a result of all accesses to W i during a certain time period.The access frequency of W i is computed as follows:
f jt1eW iT?2àt=T f jeW iTt1;e2Twhere j denotes the j th reference to W i,t is the elapsed number of requests between the jt1th and j th access and T is a constant controllin
g the rate of decay.The intuition behind(2)is to reduce past access importance.In our experiments f1was set to1/2and T to1/5t
h of the total number of requests.VHOW inherits a dynamic aging mechanism from GDSP,in order to avoid cache pollution by previously popular objects.
Each time a page is requested,its cumulative benefit value HeW iTis computed by summing its benefit BeW iTwith the cumulative benefit L of the last object evicted from cache.Thus,objects that were frequently accessed in the past,but account for no recent hits are forced out of the cache,whereas,if eviction was only based on the benefit values(and not on the cumulative benefit)they would have stayed for a larger time period.Below is the basic description of VHOW in pseudocode:
L?0
IF(W i requested)
IF(W i is cached)
HeW iT?LtBeW iT
ELSE
WHILE(available space L?min f HeW kT:W k are cached g Evict from cache W x:HeW xT??L Store W i HeW iT?LtBeW iT In order to compute the cost MeW iTvarious functions can be chosen.For instance,by selecting MeW iT?18W i,the algorithm behaves like LFU.A more suitable metric is the latency for fetching an object from the server.Most of research papers compute this latency as the summation of the time required to setup a connection and the actual transfer time.This is clearly not appropriate in case of OLAP queries since the miss penalty depends also on the query processing time at the central site,which in terms depends on which views are already materialized in the server.In the sequel,we provide a cost model to compute the miss and benefit costs for caching views in the proxy. 4.2Cost Model Let V be the set of views in an r-dimensional datacube (V j j?2r).A page W i that arrives at the proxy is the answer for a unique query Q i.In case W i refers to normal Web traffic,Q i? .Let VePTdenote the set of views currently 4IEEE TRANSACTIONS ON PARALLEL AND DISTRIBUTED SYSTEMS,VOL.17,NO.10,OCTOBER2006 cached at the proxy and V eS Tthe ones materialized at the server.Furthermore,let V eS T i be the view among the set V eS T that can answer Q i with minimum cost and V eP T i ,a similar view among set V eP T.Hence,we refer to the corresponding query costs as C eV eS Ti Tand C eV eP T i T.Moreover,let V all i be the view that would answer Q i with the minimum cost if all views were materialized (either at the proxy or at the server).In case Q i can not be answered by V eP T,V eP T i ? and C eV eP T i T?1.We should notice that Q i can always be satisfied by V eS Tsince the topmost view is always materialized at the central server.Moreover,if Q i ? , C eV eS Ti T?C eV eP T i T?0.Let L eP !S Tbe the cost (in terms of latency)for establishing a connection between the proxy and the server,and T eS !P Tbe the average transfer rate at which the server sends data to the proxy.The network latency N i ,exhibited when fetching W i from the central server is given by:N i ?L eP !S Tts eW i T=T eS !P T, where s eW i T?s ew Tts eQ i T,with s ew Tdenoting the size of the static part of the page and s eQ i Tthe size of the query results. Finally,we denote the time required to construct W i (having obtained the query results)at the central server and the proxy by F eS Ti and F eP T i ,respectively.In case Q i ? ,F eS Ti ?F eP T i ?0.The total cost M eW i Tof a cache miss for W i in terms of latency is given by: M eW i T?C eV eS T i TtF eS T i tN i :e3T Notice that,in case W i comes from normal Web traffic (3)is reduced to: M eW i T?N i eQ i ? T: e4T Equations (3)and (4)define the miss cost for a WOQP and a normal Web page,respectively.The benefit and cumulative benefit values can then be derived using (1). LOUKOPOULOS AND AHMAD:POLICIES FOR CACHING OLAP QUERIES IN INTERNET PROXIES 5 TABLE 1 Notation Used in the Paper Under our scheme we do not consider caching WOQPs due to the ad hoc nature of OLAP queries. Concerning views,we can compute directly the benefit BeV jTof keeping V j view in the cache,by taking the difference in total cost for answering the queries before and after a possible eviction of V j from the cache.Let feV jTdenote the access frequency of V j.Since there are no direct hits for views we use the following alternative to compute feV jT.Whenever a query Q i arrives,the cache applet adapts the frequency of V all i using(2). Let A ieVePT;VeSTTdenote the cost for satisfying Q i in the whole system(both proxy and server).Q i can be answered either by VePTor by VeST,depending on the relative cost difference.Thus,we end up with the following equation: A ieVePT;VeSTT?min CeVePT i TtFePT i ; CeVeST i TtFeST i tN i () :e5T Let seV jTbe the size of view V j and seV jTbe the average query size for queries with V all i?V j.Since all queries satisfied by the same view incur the same processing cost (proportional to the view size),the benefit value of V j can be computed as follows: BeV jT?P 8V k feV kT?A V k eVePTàf V j g;VeSTTàA V k eVePT;VeSTT seV jT ; e6T where A V k eVePT;VeSTTstands for the cost of answering at the system a query:Q i:V all i?V k&&seQ iT?seV kT. 4.3Deriving the Parameters Here,we provide details on how to compute the parameters of(5),(6).CeVeST i Tand CeVePT i Tare computed by finding at the lattice diagram the query costs of the corresponding VeSTi and VePT i views as described in https://www.doczj.com/doc/441281064.html,puting CeVeST i Trequires each node of the cached lattice diagram to maintain two fields.The first one(materialized field)denotes whether the view is materialized at the central site or not, while the second(cached field)shows if it is cached at the proxy.Unless the central site follows a static view selection policy,we need a consistency mechanism in order to keep the materialized field up to date. The cache applet is responsible for defining which view can answer a query with the minimum cost.In order to avoid traversing the lattice upon every query arrival,each node stores two additional fields.The first(local_answer-ing_view),shows the cached view that can answer the queries related to the node at a minimum cost,while the second(remote_answering_view)keeps the id of the mini-mum cost answering view at the DW.This information can be maintained efficiently when a new view is added or deleted from the cache. Benefit calculation requires further discussion.When-ever a new query Q i corresponding to the V i view arrives, the benefit values of V i and all its ancestors in the lattice, must be updated(notice that the benefit of successor views in the lattice do not alter since V i is not computable by them).Straightforward calculation of(6)requires OeV j j2Ttime in the worst-case(V j j is the number of views in the lattice).However,we can incrementally compute the benefits in OeV j jTworst-case time,by noticing that only the coefficient of V i changes in(6).Finally,estimation of the network latency parameters can be done by keeping statistics of past downloads and predicting future latency, in a way similar to how RTT(Round-Trip-Time)is estimated by the TCP protocol[35]. 4.4Cache Admittance of Views in VHOW Web caching algorithms consider for caching all arriving objects,stemming from the fact that Web traffic exhibits temporal locality[6].However,when views come in question,such approach is inadequate since their size can be large,resulting in many objects being evicted from the cache in order to free space.To avoid this,we follow an alternative policy. When a view V j is considered for caching at the proxy,its benefit value BeV jTis calculated using(6)and,conse-quently,its cumulative benefit value HeV jTis defined as in Section4.1.In case there is not enough storage space left to cache V j,instead of evicting immediately the object with the least cumulative benefit which might still not free enough space,we calculate the aggregated cumulative benefit of a set of objects that if deleted from the cache,enough space would be freed.V j is cached only if HeV jTis greater than this aggregated value.Fig.4shows a description in pseudocode of the complete VHOW caching algorithm. Deleting objects from the cache in order to fit a new view deserves further attention.The problem can be formulated as: Given a set of n objects,each of benefit b i and size s i,find a subset D such as: P i2D b i B and P i2D s i!S,with B,S,b i, s i integers.Notice that by interchanging the roles of benefit and size we end with the(0,1)Knapsack problem[29],the decision problem of which is known to be NP-complete.(0,1) Knapsack can be solved to optimality using dynamic programming[29]however,the method incurs unacceptable (for caching purposes)running time.Therefore,we followed a heuristic approach.We start by adding in a candidate list D (evict_list in the pseudocode)the objects O j of minimum cumulative benefit HeO jT,until:1) P O j2D HeO jTHeVeST i Tand P O j2D seO jT!seVeST i Tor,2) P O j2D HeO jT!HeVeST i T.In the first case,the view is admitted after deleting the objects in the candidate list,while in the second case we check whether the last added object in D,let O k,satisfies HeO kTHeVeST i T and seO kT!seVeST i T,in which case O k is replaced with VeST i , otherwise VeST i is not admitted. 5E XPERIMENTAL E VALUATION Two series of experiments were conducted.The first aimed at investigating the throughput of a hybrid Web-OLAP proxy,while the second used simulation in order to determine the potential benefits in query cost terms. 5.1System Throughput Before proceeding with identifying the potential gains in query cost terms,we investigated whether augmenting a proxy with query answering capabilities has an adverse effect on the throughput of the rest of HTTP requests.For 6IEEE TRANSACTIONS ON PARALLEL AND DISTRIBUTED SYSTEMS,VOL.17,NO.10,OCTOBER2006 this reason,we built a limited HTTP server to act as a Web proxy.The Web proxy had a pool of 10,000files of 35Kbytes each.Answering OLAP queries was the task of another server process,while requests were generated by a client process.We conducted the experiments using two distinct machines (one hosting the two server processes and the other the client process),connected over an Ethernet LAN.OLAP queries were modeled as aggregations over a certain number of rows.Every experiment involved a total of 10,000requests sent by the client.We measured the average completion time for nonquery requests and compared it to the respective time if no queries existed in the system,i.e.,T hroughputChange ? T imeWithQueries àT imeNoQueries T imeNoQueries : Fig.5presents the results for two distinct request arrival rates (0.5and 5req/sec)as the number of rows each query aggregates increases.The OLAP traffic percentage was fixed to 10percent.Two observations can be drawn from the figure.First,the throughput of the system on nonquery requests is significantly reduced only when the queries operate on relatively large views (e.g.,10million rows).Second,the higher the overall request arrival rate,the higher the negative effects.However,in practice,it is quite unlikely that all queries will refer to large views.Never-theless,if we are to prevent an even temporary throughput drop (presumably due to a burst on highly computation demanding queries)the proxy must avoid caching very large views.Recall that the algorithm amortizes the view benefit to its size,thus favoring small views for caching purposes.Fig.6illustrates how increasing the OLAP ratio affects the completion time of the remaining HTTP requests.The figure shows an almost linear increase of the comple-tion time,while the negative effects are again more obvious for larger request arrival rates. In the final experiment,we tested whether fetching views has an adverse effect on the system throughput.Fig.7shows the results as the view size increases for two different frequencies of view transfers.The results show that the system performance remains almost unaffected,although there is a small throughput decrease especially toward the end of the figure.Note that the results were obtained over a LAN.In practice,we expect that whenever fetching large views over the Internet is required,it will lead to a further performance decrease.This adds another factor for which caching large views must be avoided. LOUKOPOULOS AND AHMAD:POLICIES FOR CACHING OLAP QUERIES IN INTERNET PROXIES 7 Fig.4.Pseudocode of VHOW algorithm. Fig.5.Effects of query computation cost (Web:OLAP ratio =90:10). Fig. 6.Effects of OLAP request percentage (rows to aggregate =100,000). Overall,we conclude from the first series of experiments that a hybrid Web-OLAP proxy will likely exhibit a small performance drop on the service of Web related traffic as compared to its pure Web counterpart.However,the negative effects can be restricted by avoiding loading the proxy with large views. 5.2Simulation Workload Here,we present the second series of experiments based on simulation runs.Three scenarios are considered for com-parison:1)a proxy that caches only normal Web pages using the GDSP algorithm,2)a proxy that caches only OLAP views using the benefit function of(6)for replace-ment,and3)a proxy that implements VHOW.We measure the performance of the alternatives,both in terms of Hit Ratio(HR)and in terms of Cost Saving(CS)defined as:eWCostàP CostT=WCost,where Wcost is the cost occurred when no proxy is available and P cost the cost of each of the proxy implementations. In order to simulate the environment,we generated representative workloads for both OLAP queries and Web requests.For the OLAP queries,we employed the data set from the APB benchmark[30].The size of the entire cube was around 3.5GB of tuples(each tuple being roughly 20bytes).For the Web traffic we used a synthetic workload with the page popularity following a Zipf distribution with 0.6parameter and the size following a heavy tail one.The average page size was35K and this is also the value we used for the static part of WOQP.We used a total of 2million distinct Web pages,thus,equalizing the potential traffic from OLAP and Web. OLAP queries were generated using:1)a uniform distribution,i.e.,the probability of a query to refer to a node in the lattice was equal for all nodes,and2)the80-20rule,i.e.,20percent of the lattice nodes(chosen as the ones at the lowest lattice levels)accounted for80percent of the queries(the remaining queries were distributed randomly).The first method represents the situation that is likely to appear when multiple users with diverse interests rest behind the same proxy,while the later depicts the case when users share common preferences.The final input stream consisted of10million requests and was created by first generating the pure Web traffic according to the page popularities and randomly combining it with the OLAP queries. Since the views materialized at the DW server affect the query costs and the caching decisions,we decided to employ the VHOW at the server side,too.Furthermore, we allowed the server to cache only10percent of the data-cube(total size of views).Note that the only factor that burdens the materialization of all the data-cube is the storage capacity,i.e.,we do not take into account update constraints. The query cost of a view(Fig.3a)was assumed to be the same(proportional to its size),regardless of whether it was cached at the proxy or at the DW server.Strictly speaking, this implies equal processing capabilities for the DW server and the proxies,which is not expected to be the case in practice.However,we were interested to test the scenario whereby if the same answering view is cached at both the proxy and the DW server,then the query is directed to the proxy.This is a reasonable policy to follow whenever offloading the DW server is of primary concern since it only directs queries to the DW in case1)the proxy is unable to answer,or2)the DW has a lower level(in the lattice)cached view that can answer the query. 5.3Simulation Results Intuitively,caching OLAP data into the proxy server pays off when there is a substantial amount of OLAP requests.In the first set of experiments,the goal is to identify the ratio of OLAP to common Web requests above which,VHOW is beneficial.Fig.8and Fig.9compare the alternatives of caching only normal Web pages(GDSP),OLAP views (OLAP),and both using VHOW.The cache size is fixed to be1percent of the data-cube,which also amounts to roughly1percent of the total size of Web pages.The network transfer rate is32KBps and the percentage of non-OLAP(i.e.,Web requests)varies from0percent to 100percent.Figs.8a and8b show the hit ratio achieved 8IEEE TRANSACTIONS ON PARALLEL AND DISTRIBUTED SYSTEMS,VOL.17,NO.10,OCTOBER 2006 Fig.7.Effects of view fetching(Web:OLAP ratio=90:10,arrival rate=5 req/sec,rows to aggregate= 100,000). Fig.8.Hit ratio versus percentage of Web requests(1percent cache).(a)Uniform queries and(b)80-20queries. by the algorithms when OLAP queries follow a uniform distribution and the 80-20rule,respectively. As expected,the performance of GDSP increases to the percentage of Web requests,while OLAP follows an inverse trend.The maximum hit ratio achieved by OLAP is higher by about 13percent compared to the one of GDSP.This is because view interdependencies enable the proxy to answer queries even if it does not have the referred view cached (by deriving it from a higher level view as explained in Section 2).VHOW combines the merits of both GDSP and OLAP and,not surprisingly,outperforms for the biggest part the alternatives.Note that when the Web percentage is 80percent or higher (Fig.8a)VHOW achieves slightly worse hit ratio compared to GDSP.This is because OLAP views are usually larger in size compared to Web pages and,therefore,caching them,results in evicting many pages.With only 20percent of the requests being OLAP oriented,the initial overhead of storing OLAP views is not amortized (in hit ratio terms).When OLAP queries follow the 80-20rule,the impact of the initial overhead for caching OLAP views is smoothened as it can be shown in Fig.8b.The same figure also shows that when queries are more “concentrated,”OLAP and,subsequently,VHOW achieve higher hit ratios compared to the uniform case. Fig.9shows the performance of the algorithms in terms of cost saving.The trends of the plots are the same as in Fig.8.Observe the cost difference between OLAP queries and Web page accesses (GDSP and OLAP plots cross each other at around 70percent in Fig.9a).This results in VHOW being only marginally worse to GDSP when the Web traffic accounts for 90percent of the total and significantly outperforming both alternatives in the rest of the cases.As in the hit ratio case,the 80-20rule results in increased cost savings for VHOW (Fig.9b).Fig.10shows the performance of the different policies when the cache size is 10percent.With the cache size being substantial,VHOW totally outperforms the other two strategies since enough space is provided to cache both the most beneficial views and the most popular pages.The plots for the hit ratio and the 80-20rule follow similar patterns and are not included.In order to gain further insight on the behavior of VHOW,we measured the average storage percentage allocated to OLAP views throughout a simulation run. Fig.11presents the results for the two query generation strategies when the cache size is fixed to 10percent.The first observation is that uniform queries lead to higher storage allocation for OLAP data,compared to queries following the 80-20rule.This can be explained since when queries are evenly distributed to the lattice nodes,a larger number of views becomes beneficial for caching purposes,while on the other hand the 80-20rule implies that caching 20percent of the views is sufficient.From Fig.11,we also observe that the storage space allocated to OLAP is disproportionably larger than its traffic when the majority of the requests are from Web (70percent and more).The reason being the view sizes are much larger compared to pages.This explains the slight performance advantage of GDSP over VHOW for very high values of Web traffic.In the general case,the experiments show that there exists a threshold on the percentage of OLAP traffic,above which caching OLAP data provides substantial benefits.The value of this threshold depends on both the query distribution and the cache size.For a small cache size of 1percent,it was found that when OLAP traffic exceeds 10-20percent,caching OLAP views becomes beneficial.When the cache size is 10percent,the performance of VHOW is marginally worse compared to GDSP in the case where the LOUKOPOULOS AND AHMAD:POLICIES FOR CACHING OLAP QUERIES IN INTERNET PROXIES 9 Fig.9.Cost saving versus percentage of Web requests (1percent cache).(a)Uniform queries and (b)80-20queries. Fig.10. Cost saving versus percentage of Web requests (uniform queries,10percent cache).Fig.11.Storage percentage allocated to OLAP versus percentage of Web requests (10percent cache). Web traffic accounts for more than94percent of the total (not shown in Fig.7).The results are encouraging since in a decision making environment such OLAP traffic levels can be easily reached.Notice that we did not record any case in our simulations where OLAP outperformed VHOW, probably due to the fact that Web pages follow a Zipf distribution and,therefore,even when traffic is OLAP predominant,caching the most popular Web pages is still advantageous. In the second set of experiments,we tested the performance of VHOW when cache size varies between 0.1percent and10percent of the total data-cube size.The network transfer rate is again fixed to32KBps and the percentage of OLAP requests is30percent(Fig.12a)and 70percent(Fig.12b).The performance for all algorithms increases to the available cache size.We observe that VHOW follows the same trend as GDSP when70percent of the load comes from the Web and the same trend as OLAP when70percent is for queries,while maintaining a clear lead against both OLAP and GDSP.Another observation is that the rate of performance increase for the algorithms tends to drop(increasing the cache size from1percent to 10percent accounts for an increase in performance that is comparable to the one achieved by moving from0.1percent to1percent). In the final experiment,we investigate the performance of the algorithms as a function of the transfer rates between the proxy and the central DW.The ratio of Web requests was fixed to70percent(solid lines)and30percent(dashed lines),queries followed a uniform distribution,and the network transfer rate varied from32KBps to4MBps. Fig.13a presents the results for1percent cache size,while Fig.13b for10percent.We observe that CS decreases as the network transfer rate increases.Recall from Section4that the decision of whether to satisfy a query using the cached views at the proxy or redirecting it to the DW depends on both the processing cost and the network cost.Since the DW materializes a substantial part of the data-cube there is a high probability that the processing cost for answering a query at the DW is lower than the one at the proxy.With a higher transfer rate,more queries will be redirected to the DW resulting to lowering the gains of VHOW.Since this behavior is due to OLAP traffic,the performance drop is more prominent in the30percent Web case(dashed lines), while GDSP’s performance remains almost constant. The above results indicate that in the presence of OLAP queries traditional Web caching schemes can be inefficient. The proposed architecture together with the cache algo-rithm(VHOW)can result in improving the overall system performance. 6R ELATED W ORK A relevant previous work is on the view selection problem [15]where the authors proposed a greedy algorithm that chooses a near-optimal set of views,given the storage 10IEEE TRANSACTIONS ON PARALLEL AND DISTRIBUTED SYSTEMS,VOL.17,NO.10,OCTOBER 2006 Fig.12.Cost saving versus cache size(uniform queries).(a)Web:OLAP ratio70:30and(b)Web:OLAP ratio 30:70. Fig.13.Cost saving versus network transfer rate for different Web:OLAP ratios(uniform queries).(a)1percent cache and(b)10percent cache. capacity constraint and an expected query workload.View selection under update constraints was studied in[12].The approximation algorithm achieves in the worst-case solu-tion quality within63percent of the optimal.In[5],the search space of the problem is reduced by a heuristic that excludes views irrelevant to the most frequent queries. Another method for view selection,which is based on sorting[34],has smaller computational overhead than the method proposed in[15],while ensuring the same lower worst case bound provided that the view sizes satisfy certain conditions.In[36],the authors study the minimiza-tion of both query execution and view maintenance costs, under the constraint that all queries should be answered from the selected views.The above methods aim at solving a resulting optimization problem in a static and centralized manner.Even though they can be considered for imple-menting view selection in a central site if the query patterns do not change frequently,they are not suitable for materializing views in a dynamic environment. In[20],the authors propose a method to dynamically materialize and maintain fragments of OLAP views with respect to both space and time constraints in a DW.In[21],the authors consider a Web server linked to a DBMS and tackle the problem of whether to cache views at the server,at the DBMS,or compute them on the fly.In[20]and[21],the authors propose caching algorithms that consider views as the only objects to be cached.Thus,they can suffer from cache pollution(i.e.,previously popular documents fill the cache),if applied directly to a Web environment.The work in[21] assumes also transactional queries further differentiating it from our work.A normalized cost caching and admission algorithm for DW is presented in[32].The same authors proposed similar caching algorithms for Web proxies in[33], without considering OLAP queries.Related also is the view-based query containment problem,i.e.,defining which views can answer a query.Theoretical results for various problem formulations are presented in[8].The authors in[2]tackle the problem from a template-based query caching perspective, while[4]and[28]consider the case of materialized XPath views.Here,once the query dimensions are defined,selecting an appropriate view to answer the query involves a search in the lattice(since only whole dimensions are considered for materialization). In[26],active caching is employed to store database results in proxies,but only transactional(i.e.,non-OLAP) workloads are considered.The same authors in[27]use a template-based approach to tackle the case of queries with embedded calls to user defined functions.The problem of caching OLAP results in a distributed environment is studied in[18].The same authors in[19]consider the use of a P2P network for answering OLAP queries.Our work differs from both[18]and[19]since we study OLAP query caching under a Web context.Although in this paper we used the Web proxy paradigm to illustrate our framework, it is straightforward that our work is applicable in other cases too,e.g.,at a CDN(Content Distribution Network) server should a CDN subscriber hosting a DW,deems necessary to offload its servers by shifting part of the query processing overhead to the CDN. Various Web proxy caching algorithms exist in the Internet literature[3],[9],[17],[24],[33],[38].Our approach is applicable in conjunction with these algorithms.Our aim is not to propose a new Web caching algorithm,but rather to provide a framework for caching OLAP views as well as illustrating the problems that rise and coping with them. Related to Web caching is the replica placement problem [16],[23],[31],where the aim is to allocate objects to proxies depending on past access frequencies.Although such problem formulations bear the merits of optimizing a global performance parameter(compared to the individual performance of each proxy),they often lead to static, centralized solutions,and are not widely deployed on the Internet(as opposed to caching proxies). 7C ONCLUSIONS In this paper,we considered the problem of minimizing the cost of online analytical processing queries issued through the Internet.Instead of depending on dedicated machines with full DBMS capabilities,we consider the existing Web proxy architecture.We proposed a novel scheme that allows a proxy to reply to OLAP queries without necessarily having to access the central DW.An analytical cost model is derived to quantify the actual benefits. Furthermore,a suitable cache algorithm(VHOW)is devel-oped that judiciously treats OLAP views and Web pages while taking into account the different costs involved in each case.Results from the simulation studies confirm the efficacy of the proposed framework,even when the ratio of OLAP queries to normal Web traffic is moderate.Naturally, deploying a distributed database system with sufficient replication capabilities would yield substantial performance benefits in such an environment.We consider this work complimentary to this option;for instance,when it is more cost effective due to lack of funds to use the already existing Web equipment. Strategies that refresh parts of the cached views and invalidate others will most likely lead to increased performance and are part of our future work.Moreover, we can take advantage of the ICP(Internet Cache Protocol) [37]and the proxy hierarchies as described in[11]to further reduce the query costs.The intuition is that a proxy can fetch a view or satisfy a query,by forwarding the request to a proxy located close to him,instead of sending it to the central site.Research in both directions can be extended using the proposed framework,cost model,and caching algorithm. A CKNOWLEDGMENTS The authors wish to thank anyonymous reviewers for their constructive suggestions. R EFERENCES [1]M.Abrams,C.Standridge,G.Abdulla,S.Williams,and E.Fox, “Caching Proxies:Limitations and Potentials,”Proc.Fourth Int’l World Wide Web Conf.:The Web Revolution,pp.119-133,Dec.1995. [2]K.Amiri,S.Park,R.Tewari,and S.Padmanabhan,“Scalable Template-Based Query Containment Checking for Web Semantic Caches,”Proc.19th IEEE Int’l Conf.Data Eng.(ICDE’03),pp.493-504,2003. [3]M.Arlitt,L.Cherkasova,J.Dilley,R.Friedrich,and T.Jin, “Evaluating Content Management Techniques for Web Proxy Caches,”Proc.ACM SIGMETRICS Performance Evaluation Rev., vol.27,no.4,pp.3-11,Mar.2000. LOUKOPOULOS AND AHMAD:POLICIES FOR CACHING OLAP QUERIES IN INTERNET PROXIES11 [4] A.Balmin,F.Ozcan,K.Beyer,R.Cochrane,and H.Pirahesh,“A Framework for Using Materialized XPath Views in XML Query Processing,”Proc.30th Int’l Conf.Very Large DataBases(VLDB’04), pp.60-71,2004. [5] E.Baralis,S.Paraboschi,and E.Teniente,“Materialized View Selection in a Multidimensional Database,”Proc.23rd Int’l Conf. Very Large DataBases(VLDB’97),pp.156-165,1997. [6]P.Barford,A.Bestavros,A.Bradley,and M.Crovella,“Changes in Web Client Access Patterns:Characteristics and Caching Implica-tions,”World Wide Web J.,vol.2,nos.1-2,pp.15-28,1999. [7] A.Bestavros,“WWW Traffic Reduction and Load Balancing through Server-Based Caching,”IEEE Concurrency,vol.5,no.1, pp.56-67,Jan.-Mar.1997. [8] D.Calvanese,G.Giacomo,M.Lenzerini,and M.Vardi,“View- Based Query Containment,”Proc.22nd ACM Symp.Principles of Database Systems(PODS’03),pp.56-67,2003. [9]P.Cao and S.Irani,“Cost-Aware WWW Proxy Caching Algorithms,”https://www.doczj.com/doc/441281064.html,ENIX Symp.Internet Technology and Systems, pp.193-206,Dec.1997. [10]P.Cao,J.Zhang,and K.Beach,“Active Cache:Caching Dynamic Contents on the Web,”Proc.Middleware’98Conf.,pp.373-388, Sept.1998. [11] A.Chankhunthod,P.B.Danzig,C.Neerdals,M.F.Schwartz,and K.J.Worrell,“A Hierarchical Internet Object Cache,”Proc. USENIX Technical Conf.,pp.153-163,Jan.1996. [12]H.Gupta and I.S.Mumick,“Selection of Views to Materialize Under a Maintenance-Time Constraint,”Proc.Int’l Conf.Database Theory(ICDT’99),pp.453-470,1999. [13]J.S.Gwertzman and M.Seltzer,“The Case for Geographical Push- Caching,”Proc.Fifth Workshop Hot Topics in Operating Systems (HotOS-V),pp.51-55,1995. [14]J.Hammer,H.Garcia-Molina,J.Widom,https://www.doczj.com/doc/441281064.html,bio,and Y.Zhuge, “The Stanford Data Warehousing Project,”IEEE Data Eng.Bull., vol.18,no.2,pp.41-48,1995. [15]V.Harinarayan,A.Rajaraman,and J.D.Ullman,“Implementing Data Cubes Efficiently,”Proc.ACM SIGMOD Int’l Conf.Manage-ment of Data,pp.205-216,1996. [16]S.Jamin,C.Jin,Y.Jin,D.Riaz,Y.Shavitt,and L.Zhang,“On the Placement of Internet Instrumentation,”Proc.IEEE INFOCOM’00 Conf.,pp.295-304,Mar.2000. [17]S.Jin and A.Bestavros,“Popularity-Aware Greedy Dual-Size Web Proxy Caching Algorithms,”Proc.20th IEEE Int’l Conf.Distributed Computing Systems(ICDCS’00),pp.254-261,Apr.2000. [18]P.Kalnis and D.Papadias,“Proxy-Sever Architectures for OLAP,” Proc.ACM SIGMOD Int’l Conf.Management of Data,pp.367-378, 2001. [19]P.Kalnis,W.Siong,B.Ng,C.Ooi,D.Papadias,and K.L.Tan,“An Adaptive Peer-to-Peer Network for Distributed Caching of OLAP Results,”Proc.ACM SIGMOD Int’l Conf.Management of Data, pp.25-36,2002. [20]Y.Kotidis and N.Roussopoulos,“DynaMat:A Dynamic View Management System for Data Warehouses,”Proc.ACM SIGMOD Int’l Conf.Management of Data,pp.371-382,1999. [21] https://www.doczj.com/doc/441281064.html,brinidis and N.Roussopoulos,“WebView Materialization,” Proc.ACM SIGMOD Int’l Conf.Management of Data,pp.367-378, 2000. [22]https://www.doczj.com/doc/441281064.html,outaris,V.Zissimopoulos,and I.Stavrakakis,“On the Optimization of Storage Capacity Allocation for Content Distribu-tion,”Computer Networks,vol.47,no.3,pp.409-428,2005. [23] B.Li,M.Golin,G.Italiano,and X.Deng,“On the Optimal Placement of Web Proxies in the Internet,”Proc.IEEE INFOCOM ’99Conf.,pp.1282-1290,1999. [24]P.Lorenzetti,L.Rizzo,and L.Vicisano,“Replacement Policies for a Proxy Cache,”IEEE/ACM https://www.doczj.com/doc/441281064.html,working,vol.8,no.2, pp.158-170,Apr.2000. [25]T.Loukopoulos,P.Kalnis,I.Ahmad,and D.Papadias,“Active Caching of On-Line-Analytical-Processing Queries in WWW Proxies,”Proc.30th Int’l Conf.Parallel Processing(ICPP’01), pp.419-426,Sept.2001. [26]Q.Luo,J.F.Naughton,R.Krishnamurthy,P.Cao,and Y.Li, “Active Query Caching for Database Web Servers,”Proc.Int’l Workshop Web and Databases(WebDB),pp.92-104,2000. [27]Q.Luo and W.Xue,“Template-Based Proxy Caching for Table- Valued Functions,”Proc.Ninth Int’l Conf.Database Systems for Advanced Applications(DASFAA’04),pp.339-351,2004.[28] B.Mandhani and D.Suciu,“Query Caching and View Selection for XML Databases,”Proc.31st Int’l Conf.Very Large Databases (VLDB’05),pp.469-480,2005. [29]S.Martello and P.Toth,Knapsack Problems:Algorithms and Computer Implementations.John Wiley and Sons,1990. [30]OLAP Council,“OLAP Council APB-1OLAP Benchmark,Release II,”https://www.doczj.com/doc/441281064.html,,2001. [31]L.Qiu,V.Padmanabhan,and G.Voelker,“On the Placement of Web Server Replicas,”Proc.IEEE INFOCOM’01Conf.,pp.1587-1596,Apr.2001. [32]P.Scheuermann,J.Shim,and R.Vingralek,“WATCHMAN:A Data Warehouse Intelligent Cache Manager,”Proc.22nd Int’l Conf. Very Large Databases(VLDB’96),pp.51-62,1996. [33]J.Shim,P.Scheuermann,and R.Vingralek,“Proxy Cache Algorithms:Design,Implementation and Performance,”IEEE Trans.Knowledge and Data Eng.,vol.11,no.4,pp.549-562,July/ Aug.1999. [34] A.Shukla,P.M.Deshpande,and J.F.Naughton,“Materialized View Selection for Multidimensional Data sets,”Proc.24th Int’l Conf.Very Large Databases(VLDB’98),pp.488-499,1998. [35]W.R.Stevens,TCP/IP Illustrated,vol.3.Addison-Wesley,1996. [36] D.Theodoratos and T.K.Sellis,“Data Warehouse Configuration,” Proc.23rd Int’l Conf.Very Large Databases(VLDB’97),pp.126-135, 1997. [37] D.Wessels and K.Claffy,“Internet Cache Protocol(ICP)version 2,”RFC2186,1998. [38]R.Wooster and M.Abrams,“Proxy Caching that Estimates Page Load Delays,”Proc.Sixth Int’l World Wide Web Conf.,pp.977-986, Apr.1997. [39]N.E.Young,“On-Line Caching as Cache Size Varies,”Proc.Symp. Discrete Algorithms(SODA’91),pp.241-250,Jan.1997. Thanasis Loukopoulos received a diploma in computer engineering and Informatics from the University of Patras,Greece,in1997.He was awarded the PhD degree in computer science by the Hong Kong University of Science and Technology(HKUST)in2002.After receiving the PhD,he worked as a visiting scholar in HKUST.Currently,he is a visiting lecturer in the Department of Computer and Communication Engineering of the University of Thessaly, Greece.His research interests include data management in content distribution networks,video servers,P2P,and ad hoc networks. Ishfaq Ahmad received the BSc degree in electrical engineering from the University of Engineering and Technology,Lahore,Pakistan, in1985,and the MS degree in computer engineering and a PhD degree in computer science from Syracuse University,New York,in 1987and1992,respectively.His recent re- search focus has been on developing parallel programming tools,scheduling and mapping algorithms for scalable architectures,heteroge-neous computing systems,distributed multimedia systems,video compression techniques,and grid computing.His research work in these areas is published in close to200technical papers in refereed journals and conferences.He is currently a full professor of computer science and engineering in the CSE Department of the University of Texas at Arlington(UTA).At UTA,he leads IRIS(Institute for Research In Security),a multidisciplinary research center engaged in safety and security related technologies.He is an associate editor of Cluster Computing,Journal of Parallel and Distributed Computing,IEEE Transactions on Circuits and Systems for Video Technology,IEEE Concurrency,and IEEE Distributed Systems Online.He is a senior member of the IEEE. .For more information on this or any other computing topic, please visit our Digital Library at https://www.doczj.com/doc/441281064.html,/publications/dlib. 12IEEE TRANSACTIONS ON PARALLEL AND DISTRIBUTED SYSTEMS,VOL.17,NO.10,OCTOBER 2006 思维可视化概述 1思维可视化(Thinking visualization)是指运用一系列图示技术把本来不可视的思维(思考方法和思考路径)呈现出来,使其清晰可见的过程。被可视化的“思维”更有利于理解和记忆,因此可以有效提高信息加工及信息传递的效能。实现“思维可视化”的技术主要包括两类:图示技术(思维导图、模型图、流程图、概念图等)及生成图示的软件技术(Mindmanager、mindmapper、FreeMind、Sharemind、XMIND、Linux、Mindv、imindmap等)。随着“思维可视化”技术的发展,其在各领域的应用防越来赿广泛,越来赿深入:比如在商业领域出现的“可视化思考”会议;在教育领域出现的“思维可视化教学”;在科研领域出现的“思维可视化研究”等。 2概念的提出 思维可视化概念是由华东师范大学现代教育技术研究所思维可视化教学实验中心刘濯源主任首先提出,“思维可视化”( Thinking visualization)是指运用一系列图示技术把本来不可视的思维(包括:思考方法和思考路径)呈现出来,使其清晰可见的过程。“思维可视化”( Thinking visualization)技术的研究历时十年,经过“理念构建——技术整合——学科结合——模板开发——模式构建——教师培训——系统导入”七个阶段的深入研究及实践,并于2011年获全国教育信息技术研究“十二五”规划重点课题《思维可视化技术与学科整合的理论和实践研究》立项。2012年3月24日课题开题大会在无锡成功举办,来自全国的教育专家及80多所学校的校长对思维可视化教学模式表示了高度的认可,一致认为该教学模式对提升学生学习能力及教师的教学品质具有关键性作用。 3概念区分 “思维可视化”与“知识可视化”的异同 “知识可视化”的概念较“思维可视化”的概念出现得更早一些,它主要强调的对知识表征的可视化呈现,北京师范大学“知识工程研究中心”在这方面的研究比较深入。而由华东师范大学现代教育技术研究所提出的“思维可视化”则更侧重于知识表征背后的思维规律、思考方法、思考路径,在可视化的过程中更强调对思考方法及思考路径的梳理及呈现。 4关于思维 思维是人脑对客观现实间接的和概括的反映,反映的是事物的本质和事物间规律性的联系,这是人与动物的本质区别,传统的教学模式把时间主要用在“感知记 30 个把数据可视化的简单工具 s Big Data 的重要性与日俱增,许多企业的资料库内都收集了非常多消费者资料,但要将这一笔笔冷僻又繁杂的数字与名目资料转化为有价值、为企业带来效益的策略拟定参考,需要倚赖资料科学家的脑袋与适当的统计软体,再把结果图表化,让一般企业、大众都看的懂,也就是「看图说故事」与「数字会说话」两者的结合。 但有哪些简单又实用性高、不需要专业的编码知识、也不需要特别的训练就可以用的软体呢?以下介绍30 个着名的资料图表化软体给大家参考,想要让顾客听懂你在说什么、说服你的客户就靠它们了! 1. iCharts iCharts 是能够连接市场研究出版者、经济及产业面的资料和专业的消费者的平台,拥有数以万计的图表,涵盖层面包刮商业、经济、运动和其他类别,它让大众能够简单的了解并能够跟上世界最新统计资料的脚步。 为了拥有庞大的资料量,它提供以云端为基础和受专利保护的图表工具,让企业和个人都能推出品牌、行销以及用图表分享他们的资料,透过网站分享给数百万的人。很棒的是,iChart 提供免费帐户给使用者,让你能够使用基本的互动是图表,当你花钱购买更进阶的版本,你就能使用更多不同的功能;图表本身是具有互动性的,因此可以从Google Docs、Excel spreadsheet 和其他来源撷取。 2. Fusion Charts Suit XT Fusion Charts Suit XT 是一个专业的、进阶版的JavaScript chart library,让我们能够建出任何形式的图表。 採用SVG(Scalable Vector Graphics,可缩放向量图形)和支持超过90 种以上的图表类型,包括3D、甘特图(gantt)、各种不同的压力表图(gauges chart)、漏斗图(funnel chart),甚至世界/ 各州/ 个国家的地图。同样地,大部分的图表包含2D 及3D 的视图,图表是完全可客制化的,标籤、字体、边界等等全部都是可以依使用者作改变。 除此之外,他们也重视工具间的互动性,提示框(tooltips)、向下延伸资料(drill down)、可点选的图例关键字(legend keys)、缩放及上下捲动,以及一次按键进行图表输出或列印。 3. Modest Maps 科学思维教学策略[思维可视化的教学策略] 思维可视化的教学策略 --------食物的消化 摘要: 任何教学活动,都应以学生已有的认知结构为基础,在动态生成的过程中让学生主动建构自己对世界的理解。采用科学合理的教学 策略,让学生的思维活动在教学过程中“可视化”,能帮助教师依 照学生的认知需要和特征,去组织、调控教学活动,有效引导学生 经历探求知识的形成过程。 思维可视化的教学策略有动手画,学生前概念可视化;交流分类,矛盾揭示可视化;搜寻证据,自我校正可视化;反映学生思维发展 轨迹,概念建立过程可视化。 关键词: 思维可视化;教学策略;解暗箱;调控 思维可视化的教学策略 --------食物的消化 任何教学活动,都应以学生已有的认知结构为基础,在动态生成的过程中让学生主动建构自己对世界的理解。采用科学合理的教学 策略,让学生的思维活动在教学过程中可视化,能帮助教师依照学 生的认知需要和特征,去组织、调控教学活动,有效引导学生经历 探求知识的形成过程。 在这个案例教学中,教师主要采用了以下思维可视化的教学策略: 1、动手画,学生前概念可视化 教学前,学生对人体消化器官和食物流程并非白纸一张,采用在人体轮廓图中画出食物的“旅行”,学生喜欢,也适合每个学生详 尽地、有效率地表达出自己原认知信息,使教师能更全面了解把握学生的认知背景,更准确地预测学生的认知活动需要和指向,把教学活动建立在可靠的信息源的基础上,以学生的前概念作为探究活动的生长点。 2、交流分类,矛盾揭示可视化 不同的学生有不同的认知背景,矛盾是求知的动力,问题是探究的方向。在教学中教师指导学生用语言描述与视频展示相结合的方法交流分享,在鲜活、生动的直观中引发学生从自己原认知中去发现矛盾,从而激起学生想办法去寻求证据的探究愿 望,把探究人体消化器官和食物流程及其方法,转化为自我建构知识的自主需要。 3、搜寻证据,自我校正可视化 4、反映学生思维发展轨迹,概念建立过程可视化 在这个案例教学中,反映出学生经历前概念、发展中的概念、形成较科学的概念,以及产生新问题需要等,新概念的连续发展做到了可视化。这样为学生自我评价反思有生动具体可视依据。教师对自己教学反思评价也有实在可靠具体的可视依据,对教师进一步改进教学,提升理念具有很强的实效性。 我们认为这样的方法,对当前课改倡导学生自主、合作学习交流主动建构,课堂教学充满生命的活力具有重要借鉴意义。 当然,有好方法让学生思维可视化,这就要求教师一定要更加关注学生,关注学生的思维活动,在教学过程中,根据学生的思维发展,适时地修改教学设计,调控教学过程,对教师的教学能力要求更高。 附:教学实录 思维可视化的教学策略 ————《食物的消化》 50个大数据可视化分析工具 在大数据时代,数据可视化工具必须具有以下特性: (1)实时性:数据可视化工具必须适应大数据时代数据量的爆炸式增长需求,必须快速的收集分析数据、并对数据信息进行实时更新; (2)简单操作:数据可视化工具满足快速开发、易于操作的特性,能满足互联网时代信息多变的特点; (3)更丰富的展现:数据可视化工具需具有更丰富的展现方式,能充分满足数据展现的多维度要求; (4)多种数据集成支持方式:数据的来源不仅仅局限于数据库,数据可视化工具将支持团队协作数据、数据仓库、文本等多种方式,并能够通过互联网进行展现。 Excel 是快速分析数据的理想工具,也能创建供内部使用的数据图,但在颜色、线条和样式上可选择的范围有限。 Google Charts 提供了大量现成的图表类型,从简单的线图表到复杂的分层树地图等,还内置了动画和用户交互控制。 D3 能够提供大量线性图和条形图之外的复杂图表样式,例如V oronoi图、树形图、圆形集群和单词云等。 R语言 是主要用于统计分析、绘图的语言和操作环境。 Visual.ly 如果你需要制作信息图而不仅仅是数据可视化,Visual.ly是最流行的一个选择。 Processing 是数据可视化的招牌工具,只需要编写一些简单的代码,然后编译成Java,可在几乎所有平台上运行。 Leaflet 用来开发移动友好地交互地图。 OpenLayers 对于一些特定的任务来说,能够提供一些其他地图库都没有的特殊工具。 Polymaps 是一个地图库,主要面向数据可视化用户。可以将符号字体与字体整合,创建出漂亮的矢量化图标。 Gephi 是一个可视化的网络探索平台,用于构建动态的、分层的数据图表。 可以用CartoDB很轻易就把表格数据和地图关联起来。 Weka是数据分析的强大工具,还能生成一些简单的图表。 NodeBox是OS X上创建二维图形和可视化的应用程序。 Kartograph不需要任何地图提供者像Google Maps,用来建立互动式地图。 Modest Maps在一些扩展库的配合下,例如Wax,Modest Maps立刻会变成一个强大的地图工具。 Tangle是个用来探索、Play和查看文档更新的交互式库。既是图表,又是互动图形用户界面的小程序。当你调整一个图表中的输入范围时,其他关联图表的数据也会随之改变。 Rapha憀与其他库最大的不同是输出格式仅限SVG和VML。 jsDraw2DX用来创建任意类型的SVG交互式图形,可生成包括线、举行、多边形、椭圆、弧线等等图形。 Pizza Pie Charts是个响应式饼图图表。 FusionCharts XT是一款跨平台、跨浏览器的JavaScript图表组件,可提供令人愉悦的JavaScript图表体验。 iCharts有交互元素,可以从Google Doc、Excel 表单和其他来源中获取数据。 一、公司介绍 XX幸福缘农业生产开发XX于2009年9月正式成立,是XX灾后一个新型的,健康的农业项目,是利国利民的绿色项目。公司的所在地仁寿县曹家镇地理位置特殊,资源丰富,被誉为“中国枇杷之乡”、“中国百年梨乡”。公司通过农业产业化经营建立的无公害产品基地,坚持实施土壤改良、品种优化为方针,整个生产过程中不施用农药、化肥、不使用除草剂,被XX市定点为绿色食品配送基地。公司现有研发、种植等科技示X园区一万多亩,原料供应保障基地五万多亩,并将在政府的扶持下三年内大规模的扩充原料保障种植基地。公司的前景: 第一、顺应天意(天时) 我们国家提倡绿色生态,低碳生活,号召我们吃绿色产品,享受健康,而且国家对农业这方面投资力度非常大,特别是XX灾区,地震灾后,国家政策大力倾斜灾区,灾后重建家园,在国家和政府的大力支持下,许多专家踊跃参加灾区建设,我们公司在这个好的政策下,根据营养免疫学专家陈昭妃博士的理论和营养专家的指导下,根据当地的自然资源,科学合理的配方,通过物理冷冻加工的方式,配置了两款产品,营养餐和福缘茶。 第二、自然资源丰富(地利) XX仁寿地处XX大山环抱的山区,自然环境非常好,天然的自然资源,充足了阳光,清泉的河流,沐浴着仁寿的整个现场,到处是绿色,没有任何污染,没有污染企业,大山上都是天然的魔芋产地,到处是葛根,特别是金花梨香脆可口,营养丰富,自然资源非常丰富,公司陈总在专家的精心指导下,充分利用当地的自然资源,建立幸福缘食品加工厂,生产出幸福缘营养餐和福缘茶。 第三、人性化的制度(人和) 公司领导,为了把我们的产品广泛的宣传出去,就把做广告的钱直接或间接返给大家,也就是说让有钱的没钱的都能吃到绿色的、营养丰富的、低廉的产品,所以公司在三年时间内做了一个人性化的制度,就是谁吃我们产品,谁就有资格得到公司的奖金,只要一次性购买公司11盒产品,就能得到公司每个月300元的补助,或者累计达到11盒产品,同样得到公司的补助,这样一来,有钱的能吃到我们这么好的产品,没钱的也能吃到。 公司:.zgxfy. 6. 相关函数的估计(循环相关) 6.1. 相关函数与协方差函数 6.1.1. 自相关函数和自协方差函数 1、 自相关和自协方差函数的定义 相关函数是随机信号的二阶统计特征,它表示随机信号不同时刻取值的关联程度。 设随机信号)(t x 在时刻j i t t ,的取值是j i x x ,,则自相关函数的定义为 j i j i j i j i N n n j n i N j i j i x dx dx t t x x f x x x x N x x E t t R ??∑= ===∞ →),;,(1lim ] [),(1 ) ()( 式中,上角标“(n )”是样本的序号。 自协方差函数的定义与自相关函数的定义相似,只是先要减掉样本的均值函数再求乘积的数学期望。亦即: j i j i j i x j x i N n x n j x n i N x j x i j i x dx dx t t x x f m x m x m x m x N m x m x E t t C j i j i j i ??∑--= --=--==∞ →),;,())(() )((1lim )] )([(),(1 ) ()( 当过程平稳时,);,(),;,(τj i j i j i x x f t t x x f =。这时自相关函数和自协方差函数只是i j t t -=τ的函数,与j i t t ,的具体取值无关,因此可以记作)(τx R 和)(τx C 。 对于平稳且各态历经的随机信号,又可以取单一样本从时间意义上来求这些统计特性: 时间自相关函数为: ? + - ∞ →+=22 )()(1lim )(T T T x dt t x t x T R ττ 时间自协方差函数为: ? + - ∞ →-+-=22 ])(][)([1lim )(T T x x T x dt m t x m t x T C ττ 在信号处理过程中,有时会人为地引入复数信号。此时相应的定义变成 ][),(* j i j i x x x E t t R = )]()[(),(* j i x j x i j i x m x m x E t t C --= 式中,上角标*代表取共轭。 2、 自相关和自协方差函数的性质 自相关和自协方差函数的主要性质如下: (1) 对称性 当)(t x 时实函数时,)(τx R 和)(τx C 是实偶函数。即 ) ()(), ()()()(),()(* * ττττττττx x x x x x x x C C R R C C R R =-=-== 当)(t x 时复值函数时,)(τx R 和)(τx C 具有共轭对称性。即 )()(), ()(* * ττττx x x x C C R R =-=- (2) 极限值 )(, )()0(,)0(2=∞=∞==x x x x x x x C m R C D R σ (3) 不等式 当0≠τ时, )()0(), ()0(ττx x x x C C R R ≥≥ 因此, )0()()(x x x R R ττρ= 模块二作业: 活动一 模块二必选案例分析.doc 1、请指出王老师列出的目标分别对应布卢姆目标层次的哪一层? 答:在布卢姆的教学目标分类理论中,将认知领域的教学目标分为知道、理解、运用、分析、综合和评价六个层次。王老师所设置的“知识与技能目标”、“过程与方法目标”、“情感态度与价值观”的三维目标很 好地切合了布卢姆的教学目标分类理论。我认为: (1)“了解杜甫的生平和主要代表作”,“了解创作背景”,“了解古风这种文体的基本特征”,对应了布 卢姆“知道”这一层次; (2)“准确理解字、词、句的含义”对应了布卢姆“理解”这一层次; (3)“活学活用课文中出现的生词”对应布卢姆“运用”这一层次; (4)“分辨出古诗文中的虚写部分和实写部分”这一目标对应布卢姆“分析”这一层次; (5)“掌握学习古诗的方法”,“提高阅读和欣赏古诗文的能力”,“领会作者含蓄、悲婉的艺术风格”,“培养关注民生、关注现实的人文素养”对应“综合”这一层次; (6)“学生们要能体会到差役的凶恶、老妇一家的不幸”,“战乱时代劳动人民的苦难”和“作者关心民 生疾苦的思想感情”对应“评价”这一层次。 2、王老师在分析教学目标时,采用了什么方法分析教学目标的? 答:王老师在分析教学目标时,采用了归类分析法,将教学目标分为三个方面进行分析;层级分析法,王老师在讲解课文时先是逐句分析,层层深入;信息加工分析法,引入伊拉克战争的新闻图片和国民党抓壮丁;结构模型分析法将课文内容用树状图来表明它们之间的关系等方法分析了教学目标。 3、在进行教学目标分析时,除了使用思维导图工具,还可以使用哪个软件辅助?请对比这两种软件 支持教学目标分析的特点。 答:在进行教学目标分析时,除了使用思维导图工具,还可以使用word、Powerpoint等软件来进行辅助。相对而言,思维导图更方便、快捷,能清楚地体现出各个教学目标之间的关系。而Word在处理文字方面有优势,Powerpoint也是常用软件,操作简单,内容展示也更具象些。 4、案例中,第一堂课效果不理想时,王老师对教学做出了调整,这种调整体现了来自学习者特征分 析的哪些信息?你怎么评价王老师在第一次课教学效果不理想的情况下,所做出的思考和调整? 答:王老师在第一堂课效果不理想后能够自我反思,及时对教学做出调整,通过与校长交谈,体现了老师对学习者特征分析的“起点能力水平分析”、“认知结构分析”、“学习动机分析”和“学习风格分析”等信息。他能够深入了解学生,抓住学生心里,感知学生心里,及时调整教学实施,表现出王老师的应变能力和课堂驾御能力。同时,我觉得教师在备课时,不仅要备教材,更重要的是备学生,备学生的知识储备。这是 上好一堂课的前提。 王老师能在第一节课后及时反思,深入了解学生情况,对学习者特征进行恰当的分析。抓住学习的主体,很好的关注了学生,及时调整教学思路和教学环节的设置,值得我们所以一线教师学习。 5、王老师对教学目标的阐述是否规范?如果不规范,应该怎样修改? 上海立信会计学院 班级:学号: 姓名:指导教师: 专业: 习题六p150 -、简述子过程与函数过程的共同点和不同之处。 答:相同之处:都是功能相对独立的一种子程序结构,它们有各自的过程头、变量声明和过程体,在程序的设计过程中可以提高效率。 不同之处: (1)声明的关键字不同。子过程为Sub,而函数过程为 Funct ion。 (2)了过程无值就无类型说明,函数过程有值因此有类型的说明 (3)函数的过程名称同时是结果变量,因此在函数过程体 内至少要对函数的过程名赋值一次数据,而子过程内不能赋 值。 (4)调用的方式不同,子过程是一条独立的语句,可以用 Cal I子过程名或省略Call直接以子过程名调用;函数的过 程不是一条独立的语句,是一个函数值,必须参与表达式运算。(5)通常,函数过程可以被子过程代替,只需要在调用的 过程中改变一下过程调用的形式,并在子过程的形参表中增加一个地址传递的形参来传递结果。 二、什么是形参,实参?什么是值引用?地址引用?地址应用 对实参有什么限制? 答:形参:在定义过程时的一种假设的参数,只代表该过程的参数的个数、类型,它的名字不重要,没有任何的值, 只表示在过程体内将进行的一种操作。 实参:在调用子过程时提供过程形参的初始值,或通过过程体处理后的结果。 值引用:系统将实际参数的值传到形参之后,实参与形参断开联系,过程中对于形参的修改不会影响到实际参数的变化。 地址引用:实参与形参共同使用一个存储单元,在过程中对形参进行修改,则对应的实际参数也同时变化。 在地址引用时,实参只能是变量,不能是常量或表达式。 三、指出下面过程语句说明中的错误: Sub f1 (n%) as Integer Function f1%(f1%) Sub fl (ByVa I n% 0) Sub fl(X(i) as Integer) 答:(1) Sub子过程名没有返回值,因此就没有数据的类型 (2)函数名与形参名称相同 (3)形参n为数组,不允许声明为By Vai值传递 (4)形参x(i)不允许为数组元素 四、已知有如下求两个平方数和的fsum子过程: Publ ic Sub fsum (sum%, ByVaI a%, ByVaI b%) sum =a*a+b*b End Sub 在事件过程中若有如下变量声明: Pr ivate Sub Commandl Cl ick() 掌握这些数据可视化工具,再也不愁给领导做汇报了! ?Charting Fonts Charting Fonts是将符号字体与字体整合(把符号变成字体),创建出漂亮的矢量化图标。 ?Timeline Timeline即时间轴,用户通过这个工具可以一目了然的知道自己在何时做了什么。 Echarts 经常使用开源软件的朋友应该很熟悉ECharts,大家都知道去年春节以及近期央视大规划报道的百度大数据产品,如百度迁徙、百度司南、百度大数据预测等等,这些产品的数据可视化均是通过ECharts来实现的。 Insights - 智慧芽专利报告系统 是一款分析公司和行业专利情报的软件,简单又智能,输入关键词即可一键生成分析报告。图表分析维度有专利概况、诉讼信息、关键词、研发策略、专利价值等,可视化效果备受用户好评。 如下,笔者输入“西门子”,可看到关键词圆形图: 以下为对比半导体巨头“日月光”和“矽品”的研发策略雷达图: CartoDB 借助CartoDB网站,你可以用CartoDB很轻易就把表格数据和地图关联起来,这方面CartoDB是最优秀的选择。 ?Weka Weka是一个能根据属性分类和集群大量数据的优秀工具,Weka不但是数据分析的强大工具,还能生成一些简单的图表。 ?Google Chart API Google Chart提供了一种非常完美的方式来可视化数据,提供了大量现成的图标类型,从 简单的线图表到复杂的分层树地图等。它还内置了动画和用户交互控制。 Landscape - 智慧芽3D专利地图 研发人员想了解竞争对手专利布局,查看新领域/市场的技术情况,只需要一条检索式,剩下的事都可以交给智慧芽3D专利地图了!这是国内首款3D地图分析成像,利用3D的方式更容易让使用者理解技术层次。 如下图,山峰代表专利技术密集区,海洋代表专利技术空白区。颜色较深代表专利较多,为技术红海区,竞争程度越强烈;颜色较浅代表专利数量少,为技术蓝海区,存在技术空白点或难点。 上海立信会计学院 班级:学号:姓名:指导教师: 系部:专业: 习题六p150 一、简述子过程与函数过程的共同点和不同之处。 答:相同之处:都是功能相对独立的一种子程序结构,它们有各自的过程头、变量声明和过程体,在程序的设计过程中可以提高效率。 不同之处: (1)声明的关键字不同。子过程为Sub,而函数过程为Function。 (2)了过程无值就无类型说明,函数过程有值因此有类型的说明 (3)函数的过程名称同时是结果变量,因此在函数过程体内至少要对函数的过程名赋值一次数据,而子过程内不能赋值。 (4)调用的方式不同,子过程是一条独立的语句,可以用Call子过程名或省略Call直接以子过程名调用;函数的过程不是一条独立的语句,是一个函数值,必须参与表达式运算。 (5)通常,函数过程可以被子过程代替,只需要在调用的过程中改变一下过程调用的形式,并在子过程的形参表中增加一个地址传递的形参来传递结果。 二、什么是形参,实参?什么是值引用?地址引用?地址应用对实参有什么限制? 答:形参:在定义过程时的一种假设的参数,只代表该过程的参数的个数、类型,它的名字不重要,没有任何的值,只表示在过程体内将进行的一种操作。 实参:在调用子过程时提供过程形参的初始值,或通过过程体处理后的结果。 值引用:系统将实际参数的值传到形参之后,实参与形参断开联系,过程中对于形参的修改不会影响到实际参数的变化。 地址引用:实参与形参共同使用一个存储单元,在过程中对形参进行修改,则对应的实际参数也同时变化。 在地址引用时,实参只能是变量,不能是常量或表达式。 三、指出下面过程语句说明中的错误: (1)Sub f1(n%) as Integer (2)Function f1%(f1%) (3)Sub f1(ByVal n%()) (4)Sub f1(x(i) as Integer) 答:(1)Sub子过程名没有返回值,因此就没有数据的类型 (2)函数名与形参名称相同 (3)形参n为数组,不允许声明为ByVal值传递 (4)形参x(i)不允许为数组元素 四、已知有如下求两个平方数和的fsum子过程: Public Sub fsum(sum%, ByVal a%, ByVal b%) sum = a * a + b * b End Sub 在事件过程中若有如下变量声明: Private Sub Command1_Click() Dim a%, b%, c! a = 10: b = 20 则指出如下过程调用语句的错误所在: (1)fusum 3, 4, 5 (2)fsum c, a, b (3)fsum a + b, a, b (4)Call fsum(Sqr(c), Sqr(a), Sqr(b)) (5)Call fsum c,a,b 答:(1)furm子过程的第一个形参是地址传递,因此对应的实参3不能是常量 (2)furm的第一个形参是整型而且是地址传递,对应的实参c是单精度,数据类型不匹配(3)furm的第一个形参是地址传递,因此对应的实参a+b不应当是表达式 (4)furm的第一个形参是地址传递,因此对应的实参Sqr(c)不应当是表达式 (5)用Call语句调用furm子过程时,必须用圆括号来描述实参 六、要使变量在某事件过程中保留值,有哪几种变量声明的方法? 答:声明为static或者全局变量 七、为了使某变量在所有的窗体中都能使用,应在何处声明该变量? 答:应在窗体\模块的通用声明段用Public关键字声明为全局变量。 小议科学实验中思维可视化教学模式 江苏扬中三跃中心小学孙厚荣(212214)论文摘要:作为省级课题《小学科学活动中学生思维可视化的探索与研究》中的核心环节,科学实验中的思维可视化不可忽视。本文就实验活动的几个主要环节的思维可视化构建了一种教学模式,作了简要的阐述。 关键词:科学实验思维可视化教学模式 我们把科学课堂活动作为课题实验的主阵地,通过大胆的探索与实践,成功构建了“活动前的预测中——实验方案的设计中――实验现象的描摹中——活动后的交流中”的思维可视化教学模式。 第一步:预测中的思维可视化 预测就是利用已有的主观认识经验和逻辑判断与推理方法为主,对事物未来发展状况与趋势进行的推测和判断。科学活动前的预测,是学生学习科学的一种基本技能。在教学中我们合理地挖掘此类教学内容,精心引导学生把自己的预测用形象化的手段展示出来,达到思维可视化的目的。 (1) 明确预测的目的、任务。 如《植物的生长与环境的影响》实验的预测,一棵植物幼苗,罩上一个左上角开口的纸盒,几天后,会朝着哪个方向生长呢?目的任务明确,不是朝左上角,就是朝右边黑暗处生长。记录自己的预测?我们的学生用简单的箭头符号就能展示自己的思维了。 (2) 教给预测的方法。 科学预测方法的掌握,是对自己知识经验的验证。如《种子的萌发》一课,哪颗种子会萌发呢?空气中的?水中的?还是一半在水中一半在空气中的呢?首先让学生明白,空气中的少了水分,水中的少了空气,中间的则既有水,也有空气,要做全面的分析,结合植物生长需要的条件考虑,可以预测得更准确一些。如此,文字与画圈相结合,哪颗种子会萌发一目了然。 (3)合理记录预测内容。 预测内容是学生自己的思维结果,要用合理的方式记录下来。记录的目的可以等实验活动结束时让学生自己去验证预测的准确性。文字、画图、箭头符号等等都可以,只要他自己明白,只要他能解释清楚都行!一句话,用他自己喜欢的方式。 第二步:设计中的思维可视化 活动方案的设计,目的在于更好地研究想要解决的问题。如何让自己的方案合理明了,思维导图应运而生。思维导图能激发我们的右脑,因为我们在创作导图的时候还使用颜色、形状和想象力。可以把关键字和颜色、图案联系起来。 在学生设计的同时,教师要予以适当指导。比如:《空气占据空间吗》一课,教师首先向每个小组提供这些实验材料:装有水的水槽、烧杯、餐巾纸、气球、塑料袋各一份;其次创设情境,激起学生求知欲望:教师手拿一只空烧杯让学生观察里面有什么?有些学生说:“没有东西。”但也有学生说:“有空气。”接着教师引导:用什么方法证明你的观点呢?生答:用实验方法。师问:谁能设计一个实验方法来加以证明——杯中有空气。小组研讨,设计方案。结果到视频展台上展示的实验方案有好几种: (1)用杯子口朝下放入水槽中,再倾斜杯子,杯口旁边向上冒“气泡”; (2)将餐巾纸塞于杯子底部,杯子口朝下放入水槽中(要直),然后轻轻提起,餐巾纸不湿; (3)用嘴向周围吸气后吹入气球,使气球鼓起来,再对准人的脸放开,人就感觉到有空气,从中说明人的周围有空气,再推理出杯子内也有空气; 28个强大的数据可视化工具 我们现在与多个客户合作,进行WEB应用程序(再)设计。这些客户都使用有大量数据的应用程序,于是也需要强大的数据可视化工具帮助他们和顾客快速有效地分析数据。 让我的工作真正变得有意思的是,这些客户从事不同的行业,使用不同的技术。因此,我们收集了28个工具,用于在Flash, Flex , Ajax 或Silverlight里创建图表、甘特图、流程图创建软件、日历/日程表、量仪、制图、数据透视表、OLAP立方,波形图。 https://www.doczj.com/doc/441281064.html, https://www.doczj.com/doc/441281064.html,平台是个纯粹的javascript应用程序框架,用于创建在浏览器里运行的实时协作应用程序。 AnyChart AnyChart是一个灵活的基于Flash的解决方案,你可以用来创建互动的,漂亮的F lash 图表。 Axiis Axiis是针对Flex 的一个数据可视化框架。它被设计成一个精确和模块化的表述框架。开发人员和设计人员可以用来创建强大的数据可视化解决方案。 可以看看saturnboy 博客上,出彩的“窗口中窗口”设计。saturnboy BirdEye BirdEye是一个社区项目,促进为Adobe Flex 设计和开发的广泛的开源信息可视化和可视分析研究库。有了这个基于actionscript的库,用户可以创建多维数据可视化界面,用于信息分析和显示。 Degrafa Degrafa是一个声明式图形框架,用于创建丰富的用户界面,数据可视化、制图、图形编辑,还有其它等等。 DojoX Data Chart Dojo1.3版本里的一个新加的功能,就是dojox.charting类。它的最初目的就是,把表格和“数据存储”连接变成一个简单的过程。 Chronoscope 如果你需要可视化成千上万甚至几百万的数据点,看看这个。设计得非常好,可以用键盘或鼠标导航。有一个Javascript API,Google Visualization API或把它当作Google Spreadsheets 上的Google Gadget,iGoogle, 或Open Social。 Dundas Dundas有大量针对微软技术的数据可视化解决方案。它们提供诸多数据可视化工具,如,网路使用的图表、量仪、制图和日历以及Silverlight的表板。 第六章函数 二、选择题 1.C语言程序由函数组成。正确的说法是____B______。 A)主函数写在必须写在其他函数之前,函数内可以嵌套定义函数 B)主函数可以写在其他函数之后,函数内不可以嵌套定义函数 C)主函数必须写在其他函数之前,函数内不可以嵌套定义函数 D)主函数必须在写其他函数之后,函数内可以嵌套定义函数 2.一个C语言程序的基本组成单位是_____C_____。 A)主程序B)子程序C)函数D)过程 3.以下说法正确的是____ C ______。 A)C语言程序总是从第一个定义的函数开始执行 B)C语言程序中,被调用的函数必须在main()函数中定义 C)C语言程序总是从主函数main()开始执行。 D)C程序中的main()函数必须放在程序的开始处 4.已知函数fun类型为void,则void的含义是____ A ______。 A)执行函数fun后,函数没有返回值B)执行函数fun后,可以返回任意类型的值 C)执行函数fun后,函数不再返回D)以上三个答案都是错误的 5.下列对C语言函数的描述中,正确的是____ A ______。 A)在C语言中,调用函数时只能将实参的值传递给形参,形参的值不能传递给实参B)函数必须有返回值 C)C语言函数既可以嵌套定义又可以递归调用 D)C程序中有调用关系的所有函数都必须放在同一源程序文件中 6.以下叙述中错误的是_____ B _____。 A)函数形参是存储类型为自动类型的局部变量 B)外部变量的缺省存储类别是自动的。 C)在调用函数时,实参和对应形参在类型上只需赋值兼容 D)函数中的自动变量可以赋初值,每调用一次赋一次初值 7.C语言中的函数____D______。 A)不可以嵌套调用B)可以嵌套调用,但不能递归调用 C)可以嵌套定义D)嵌套调用和递归调用均可 8.C语言中函数返回值类型由____D_____决定。 A)调用该函数的主调函数类型B)函数参数类型 C)return语句中的表达式类型D)定义函数时指定的函数类型 9.C语言规定,调用一个函数,实参与形参之间的数据传递方式是___D_____。 A)由实参传给形参,并由形参传回来给实参B)按地址传递 C)由用户指定方式传递D)按值传递 10.下列叙述错误的是____C______。 A)形参是局部变量 B)复合语句中定义的变量只在该复合语句中有效 C)主函数中定义的变量在整个程序中都有效 D)其他函数中定义的变量在主函数中不能使用 11.若函数类型和return语句中的表达式类型不一致,则____B______。 思维可视化在小学数学教学中的运用 思维可视化在小学数学教学中的运用 思维可视化的运用在国外已经比较成功,研究内容涉及思维可视化的内涵、结构和特征、评析标准等诸多方面。我校目前处于引进阶段,小学数学教育对思维可视化的专题研究还不多闻,本文将从思维可视化的内涵,思维可视化在小学数学教学中的应用以及绘图的策略、应用的注意问题几方面做初步研究。 一、思维可视化的定义 思维可视化是用来组织和表象知识的工具,它一般将某一主题的有关概念置于圆圈或方框之中,再用连线将相关的概念和命题连接,连线上注明两个概念之间的意义关系。思维可视化能够构造清楚的知识网,便于学习者对知识结构的掌握,有利于发散思维可视化的形成,促进知识的迁移。 二、思维可视化在小学数学教学中的运用 (一)教学设计的工具 思维可视化的运用为教师进行教学设计提供了支持与帮助,通过思维可视化老师能够更清楚地呈现知识的结构,更有条理地进行教学。教师可以运用思维可视化对教学内容进行归纳与整理,突出教学重、难点,将教学中的主要概念和原理以一种可视化的方式展示出来,简明扼要地表明概念的逻辑性,呈现概念的主体地位以及相关性,以便学生发现概念间的区别与关系,从而,提高课堂教学。 (二)创造思维可视化的工具 思维可视化的创作过程其实就是学生创造的过程,学生拥有较为宽泛的想象力,可以根据自己的爱好设计出符合条件的思维可视化。在思维可视化的创作过程中,学生要进行很多的思考,在头脑中会萌发各种新颖的想法,而且在构建成自己的思维可视化之后与他同学的作品比较时还会有新的想法出现。便有利于培养学生的创造精神与实践能力。 (三)知识整理的工具 新课程标要求在小学数学教学中要联系实际,提高对数学整体的认知,使学生了解知识之间的结构关系,感受数学知识的整体性。在小学数学中很多知识表面看起来毫无关联,其实它们之间存在着密不可分的关系,把它们关联在一起的就是“数学思想与方法”。贯入了思维可视化的教学让学生从散乱的机械式学习,提升为注重思想并充满主动探究活力的有价值学习。 (四)教学反思的工具 思维可视化有利于师生对教学活动成果进行反思。学生通过创作思维可视化可以发觉自己在知识掌握方面存在的不足。如,所学重点概念掌握的是否牢固,知识的理解是否透彻等,从而不断完善自己的知识结构,增加学习的自我导向性,因而使学生自我反思能力和认知水平能力有所提高。同时,在师生共同创造与修正思维可视化的过程中,老师可以及时发现学生知识对掌握的不足之处,反思教学过程,更有利于发现教学环节的薄弱之处,为教学的改进提供 盘点10款最受欢迎数据可视化工具 在数字经济时代,人们需要对大量的数字进行分析,帮助用户更直观的察觉差异,做出判断,减少时间成本。当然,你可能想象不到这种数据可视化的技术可以追溯到2500年前世界上的第一张地图,但是,如今利用各种形态的数据可视化图表帮助用户减少分析时间,快速做出决策一直扮演着重要的作用。 世界上的第一张地图(公元前550年) 这里给你推荐十款现今最受欢迎的数据可视化工具,供你参考。 1、Tableau Tableau 数据可视化工具除了图片美观之外,是否容易上手,海量数据的处理速度等都是考量工具优劣的标准。而Tableau以其高度的灵活性和动态性高居榜首。Tableau不仅可以制作图表、图形还可以绘制地图,用户可以直接将数据拖拽到系统中,不仅支持个人访问,还可以进行团队协作同步完成数据图表绘制。输出方便,同时Tableau也是免费的哦。 2、Excel Excel 额,笔者并没有疯掉。笔者恰恰想说的是Excel作为一种简单、方便、覆盖面广的offi ce软件,无疑是数据可视化工具的典型。我们平时会经常使用Excel制作简单表格,实际上,Excel的功能十分强大,你完全可以用它来做一些让人眼前一亮的图表。 Excel可以说是典型的入门级数据可视化工具,但同时,它也支持3D的可视化展示,微软发布了一款叫做GeoFlow的插件,它是结合Excel和Bing地图所开发出来的3D数据可视化工具。GeoFlow的概念最早提出于2011年6月,据悉可以支持的数据行规模最高可达100万行,并可以直接通过Bing地图引擎生成可视化3D地图。 2FusionCharts、Modest Maps、WolframAlpha 3、FusionCharts 模块二总结与反馈 1在这个模块中,你做了哪些事情? 答:在模块二中,我做了以下事情: ㈠活动1中,我对“必选案例:《精心分析,适应变化》案例分析”进行了充分的准备:我学习了有关的案例知识点,在《石壕吏》教学目标分析这一知识点中,我先了解了教学目标分析的作用:1.有利于课程的规范,2.有利于学生的学习,3.有利于教师的教学,4.有利于交流和沟通;掌握了教学目标分类方式:1.布卢姆教学目标分类理论,他将教学活动将认知领域的教学目标分为知道、理解、运用、分析、综合和评价六个层次。2.加涅的学习结果分类理论,他对学习结果进行了分类,提出了五种学习结果:言语信息、智力技能、认知策略、动作技能和态度。3.新课程标准中的三维目标分类,从“知识与技能”、“过程与方法”、“情感态度与价值观”三方面提出了要求,构成了新课程的“三维目标”。理解了常见的教学目标分析方法:1.归类分析法,2.层级分析法,3.信息加工分析法,4.解释结构模型法。明白了教学目标阐明方法:1.认知\动作类教学目标阐明方法,2.情感类教学目标阐明方法。3.清楚了教学目标分析和编写中应注意到的问题。在学习者特征分析这一知识点中,我了解了学习者特征分析的作用和学习者特征分析的主要内容,熟悉了学习者特征分析的作用,明白了学习者特征分析的主要内容,对于不同学段的学习者特征有了清晰的把握。接着回答了有关案例分析的五个问题,并放入了档案袋,在必选案例分析这一版块中发了贴, 与其他同学分享并在其他同学的分析贴中回了贴。 ㈡活动2教学前期分析案例观摩与改进中,我认真阅读了例子《要下雨了》,学习了“对教学目标的评析”和“对学习者特征分析的评析”,选取了中学数学:《平行四边形的判定》(学习者分析)和小学语文:《称赞》(教学目标分析)并根据要求发了主帖,完成了作业。 ㈢活动3中我选取了《左老师碰到的难题》,看到教数学的左老师在面对一群年龄跨度较大的参加数学冬令营的学生时,是如何进行学习者分析,确定教学内容的。系统地学习了教学目标分析2.1:布卢姆教学目标分类理论,教学目标分析2.3:新课程标准中的三维目标分类,学习者特征分析2.1:起点能力水平分析,学习者特征分析2.1:起点能力水平分析,学习者特征分析2.2:认知结构分析:奥苏贝尔理论,学习者特征分析2.4:学习动机分析,学习者特征分析3:不同学段的学习者特征,学习者特征分析4:学习风格特征与信息技术环境的适应性,并在阅读案例后详细回答了以下问题:你是否认同左老师对这次活动的教学目标的设定?你认为左老师设定的教学目标是否符合新课程标准的理念?左老师在分析这次冬令营的学生特点时,了解到了学生哪些方面的特征?从学生的认知特点来看,你认为左老师选择的教学内容是否恰当?你认为左老师更改后的故事情景是否恰当?你觉得对于什么样的学生适合用故事引入?然后新建一个word文档,起名为:“《左老师碰到的难题》案例分析.doc”,将你对5个问题的思考和回答,写在文档中,然后进入“作业区”,在模块二的作业:模块二可选案例分析中上交了这个文档。 ㈣在活动4中,学习了使用可视化工具Freemind对教学目标进行分析以及对分析结果进行表述,发现可以借助一些知识可视化工具画出思维导图,这样比较简洁、直观,而且有利于清楚地描述各教学目标之间的关系。于是根据样例学习了可视化工具Freemind的使用方法,并动手制作了“有理数的混合运算”的思维导图,完成制作后,选择“文件”菜单的“导出”,然后选择导出JPEG格式,完成思维导图的创作。然后进入作业区,在模块二的作业:可视化工具作品上交中上传我完成的作品,又进入课程讨论区我的班级下的“可视化工具交流分享”板块,思考下列问题,将问题的答案以新贴的形式贴在板块中。然后仔细阅读其他成员的帖子,并对他们的观点进行评述。通过几个小时的辛苦努力终于顺利完成了以上四个活动,感觉自学真的非常辛苦劳累,也很有成就感。 2学完本模块后,你有哪些收获? 答:在模块二的学习中,从思想理论上我有了最大的收获:我对于模块二中所涉及的理论知识、相关文章、典型案例,都作了全面地阅读,特别是在当今信息技术环境下的学生特征的分析,有了进一步的了解;对思维导图的作用和使用方法,有了比较具体的认识,懂得自己今后需要改进和学习的地方有很多,学习态度、学习风格、学习风格、学习方法对需要分析,通过精心备课、准备,课堂才能活跃起来,才能有收获。只有适合孩子的教育才是成功的,课堂不能一成不变,应该在精致的预设中,有精彩的生成,只有全面的教学思考才能促进的课堂的高效率。从操作上有了进步,通过这个模块二的学习,我终于领会到团队合作的优势。我们学员之间除了在帖子里发信息外,大家还通过QQ、MSN进行交思维可视化教学参考资料
[整理]30个把数据可视化的简单工具
科学思维教学策略[思维可视化的教学策略]
50个大数据可视化分析工具
1、公司及产品介绍●
第六章 相关函数的估计
模块二活动4可视化工具交流分享
VB第六章习题答案(上海立信会计学院)
13款最好用的数据可视化工具
VB第六章习题答案(上海立信会计学院)
思维可视化教学模式
28个强大的数据可视化工具
第六章函数-选择题
思维可视化在小学数学教学中的运用教学内容
10款最受欢迎数据可视化工具
可视化工具作品
相关主题
文本预览