安全专业外语外文翻译
- 格式:docx
- 大小:61.13 KB
- 文档页数:23
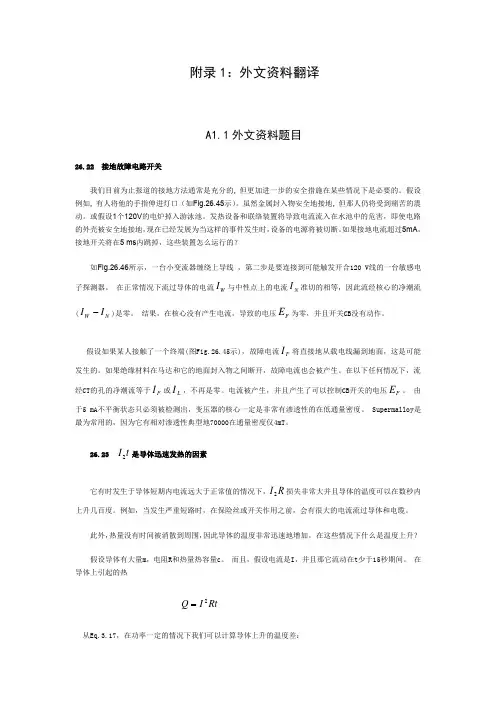
附录1:外文资料翻译A1.1外文资料题目26.22 接地故障电路开关我们目前为止报道的接地方法通常是充分的, 但更加进一步的安全措施在某些情况下是必要的。
假设例如, 有人将他的手指伸进灯口(如Fig.26.45示)。
虽然金属封入物安全地接地, 但那人仍将受到痛苦的震动。
或假设1个120V 的电炉掉入游泳池。
发热设备和联络装置将导致电流流入在水池中的危害,即使电路的外壳被安全地接地,现在已经发展为当这样的事件发生时,设备的电源将被切断。
如果接地电流超过5mA ,接地开关将在5 ms 内跳掉,这些装置怎么运行的?如Fig.26.46所示,一台小变流器缠绕上导线 ,第二步是要连接到可能触发开合120 V 线的一台敏感电子探测器。
在正常情况下流过导体的电流W I 与中性点上的电流N I 准切的相等,因此流经核心的净潮流(N W I I -)是零。
结果,在核心没有产生电流,导致的电压F E 为零,并且开关CB 没有动作。
假设如果某人接触了一个终端(图Fig.26.45示),故障电流F I 将直接地从载电线漏到地面,这是可能发生的。
如果绝缘材料在马达和它的地面封入物之间断开,故障电流也会被产生。
在以下任何情况下,流经CT 的孔的净潮流等于F I 或L I ,不再是零。
电流被产生,并且产生了可以控制CB 开关的电压F E 。
由于5 mA 不平衡状态只必须被检测出,变压器的核心一定是非常有渗透性的在低通量密度。
Supermalloy 是最为常用的,因为它有相对渗透性典型地70000在通量密度仅4mT 。
26.23 t I 2是导体迅速发热的因素它有时发生于导体短期内电流远大于正常值的情况下,R I 2损失非常大并且导体的温度可以在数秒内上升几百度。
例如,当发生严重短路时,在保险丝或开关作用之前,会有很大的电流流过导体和电缆。
此外,热量没有时间被消散到周围,因此导体的温度非常迅速地增加。
在这些情况下什么是温度上升? 假设导体有大量m ,电阻R 和热量热容量c 。
Strengths优势All these private sector banks hold strong position on CRM part, they have professional, dedicated and well-trained employees.所以这些私人银行在客户管理部分都持支持态度,他们拥有专业的、细致的、训练有素的员工。
Private sector banks offer a wide range of banking and financial products and financial services to corporate and retail customers through a variety of delivery channels such as ATMs, Internet-banking, mobile-banking, etc. 私有银行通过许多传递通道(如自动取款机、网上银行、手机银行等)提供大范围的银行和金融产品、金融服务进行合作并向客户零售。
The area could be Investment management banking, life and non-life insurance, venture capital and asset management, retail loans such as home loans, personal loans, educational loans, car loans, consumer durable loans, credit cards, etc. 涉及的领域包括投资管理银行、生命和非生命保险、风险投资与资产管理、零售贷款(如家庭贷款、个人贷款、教育贷款、汽车贷款、耐用消费品贷款、信用卡等)。
Private sector banks focus on customization of products that are designed to meet the specific needs of customers. 私人银行主要致力于为一些特殊需求的客户进行设计和产品定制。

市场营销部: SALES&MARKETING DEPARTMENT计财部:ACCOUNTING DEPARTMENT人力资源部: HUMAN RESOURCE DEPARTMENT工程部: ENGINEERING DEPARTMENT保安部: SECURITY DEPARTMENT行政部: EXECUTIVE DEPARTMENT前厅部: FRONT OFFICE客房部: HOUSEKEEPING DEPARTMENT餐饮部: FOOD&BEVERAGE DEPARTMENT外销部: EXPORT DEPARTMENT财务科: FINANCIAL DEPARTMENT党支部: BRANCH OF THE PARTY会议室: MEETING ROOM会客室: RECEPTION ROOM质检科: QUALITY TESTING DEPARTMENT内销部: DOMESTIC SALES DEPARTMENT厂长室: FACTORY DIRECTOR'S ROOM行政科: ADMINISTRATION DEPARTMENT技术部: TECHNOLOGY SECTION档案室: MUNIMENT ROOM生产科: MANUFACTURE SECTION总公司: Head Office分公司: Branch Office营业部: Business Office人事部: Personnel Department总务部: General Affairs Department财务部: General Accounting Department销售部: Sales Department促销部: Sales Promotion Department国际部: International Department出口部: Export Department进口部: Import Department公共关系: Public Relations Department广告部: Advertising Department企划部: Planning Department产品开发部: Product Development Department研发部: Research and Development Department (R&D) 秘书室: Secretarial Poo市场部Marketing Department技术服务部 Technical service Department人事部 Personnel Department(人力资源部)Human Resources DepartmentAccounting Assistant 会计助理Accounting Clerk 记帐员Accounting Manager 会计部经理Accounting Stall 会计部职员Accounting Supervisor 会计主管Administration Manager 行政经理Administration Staff 行政人员Administrative Assistant 行政助理Administrative Clerk 行政办事员Advertising Staff 广告工作人员Airlines Sales Representative 航空公司定座员Airlines Staff 航空公司职员Application Engineer 应用工程师Assistant Manager 副经理Bond Analyst 证券分析员Bond Trader 证券交易员Business Controller 业务主任Business Manager 业务经理Buyer 采购员Cashier 出纳员Chemical Engineer 化学工程师Civil Engineer 土木工程师Clerk/Receptionist 职员/接待员Clerk Typist & Secretary 文书打字兼秘书Computer Data Input Operator 计算机资料输入员Computer Engineer 计算机工程师Computer Processing Operator 计算机处理操作员Computer System Manager 计算机系统部经理Copywriter 广告文字撰稿人Deputy General Manager 副总经理Economic Research Assistant 经济研究助理Electrical Engineer 电气工程师Engineering Technician 工程技术员English Instructor/Teacher 英语教师Export Sales Manager 外销部经理Export Sales Staff 外销部职员Financial Controller 财务主任Financial Reporter 财务报告人F.X. (Foreign Exchange) Clerk 外汇部职员F.X. Settlement Clerk 外汇部核算员Fund Manager 财务经理General Auditor 审计长General Manager/President 总经理General Manager Assistant 总经理助理General Manager‘s Secretary 总经理秘书Hardware Engineer (计算机)硬件工程师Import Liaison Staff 进口联络员Import Manager 进口部经理Insurance Actuary 保险公司理赔员International Sales Staff 国际销售员Interpreter 口语翻译Legal Adviser 法律顾问Line Supervisor 生产线主管Maintenance Engineer 维修工程师Management Consultant 管理顾问Manager 经理Manager for Public Relations 公关部经理Manufacturing Engineer 制造工程师Manufacturing Worker 生产员工Market Analyst 市场分析员Market Development Manager 市场开发部经理Marketing Manager 市场销售部经理Marketing Staff 市场销售员Marketing Assistant 销售助理Marketing Executive 销售主管Marketing Representative 销售代表Marketing Representative Manager 市场调研部经理Mechanical Engineer 机械工程师Mining Engineer 采矿工程师Music Teacher 音乐教师Naval Architect 造船工程师Office Assistant 办公室助理Office Clerk 职员Operational Manager 业务经理Package Designer 包装设计师Passenger Reservation Staff 乘客票位预订员Personnel Clerk 人事部职员Personnel Manager 人事部经理Plant/Factory Manager 厂长Postal Clerk 邮政人员Private Secretary 私人秘书Product Manager 生产部经理Production Engineer 产品工程师Professional Staff 专业人员Programmer 电脑程序设计师Project Staff (项目)策划人员Promotional Manager 推销部经理Proof-reader 校对员Purchasing Agent 采购(进货)员Quality Control Engineer 质量管理工程师Real Estate Staff 房地产职员Recruitment Coordinator 招聘协调人Regional Manger 地区经理Research & Development Engineer 研究开发工程师Restaurant Manager 饭店经理Office Assistant 办公室助理Office Clerk 职员Operational Manager 业务经理Package Designer 包装设计师Passenger Reservation Staff 乘客票位预订员Personnel Clerk 人事部职员Personnel Manager 人事部经理Plant/Factory Manager 厂长Postal Clerk 邮政人员Private Secretary 私人秘书Product Manager 生产部经理Production Engineer 产品工程师Professional Staff 专业人员Programmer 电脑程序设计师Project Staff (项目)策划人员Promotional Manager 推销部经理Proof-reader 校对员Purchasing Agent 采购(进货)员Quality Control Engineer 质量管理工程师Real Estate Staff 房地产职员Recruitment Coordinator 招聘协调人Regional Manger 地区经理Research & Development Engineer 研究开发工程师Restaurant Manager 饭店经理Sales and Planning Staff 销售计划员Sales Assistant 销售助理Sales Clerk 店员、售货员Sales Coordinator 销售协调人Sales Engineer 销售工程师Sales Executive 销售主管Sales Manager 销售部经理Salesperson 销售员Seller Representative 销售代表Sales Supervisor 销售监管School Registrar 学校注册主任Secretarial Assistant 秘书助理Secretary 秘书Securities Custody Clerk 保安人员Security Officer 安全人员Senior Accountant 高级会计Senior Consultant/Adviser 高级顾问Senior Employee 高级雇员Senior Secretary 高级秘书Service Manager 服务部经理Simultaneous Interpreter 同声传译员Software Engineer (计算机)软件工程师Supervisor 监管员Systems Adviser 系统顾问Systems Engineer 系统工程师Systems Operator 系统操作员Technical Editor 技术编辑Technical Translator 技术翻译Technical Worker 技术工人Telecommunication Executive 电讯(电信)员Telephonist/Operator 电话接线员、话务员Tourist Guide 导游Trade Finance Executive 贸易财务主管Trainee Manager 培训部经理Translation Checker 翻译核对员Translator 翻译员Trust Banking Executive 银行高级职员Typist 打字员Word Processing Operator 文字处理操作员文案编辑词条B 添加义项?文案,原指放书的桌子,后来指在桌子上写字的人。

安全与救护英文作文英文:Safety and Rescue。
As a responsible citizen, I understand the importance of safety and rescue. In our daily lives, we often encounter situations where we need to ensure our safety and the safety of others. For instance, when we are driving, we need to follow traffic rules and wear seatbelts to avoid accidents. Similarly, when we are at home, we need to be careful while using electrical appliances and make surethat we have a fire extinguisher in case of emergencies.Moreover, we should also be prepared to provide rescue services in case of emergencies. For example, if we see someone drowning, we should immediately call for help and try to rescue them if possible. Similarly, if we see someone having a heart attack, we should know how to perform CPR and provide first aid until medical helparrives.In short, safety and rescue are important aspects of our lives, and we should always be prepared to handle any situation that may arise.中文:安全与救护。

外文文献翻译译稿1可用性和期望值来自Willliam S.Green, Patrick W.Jordan.产品的愉悦:超越可用性根据人机工程学会(HFES)的观点,人机工程学着眼于“发现和共享可用于各种系统和设备设计的、关于人的特点的知识”。
人们通常只是把它作为生物力学和人体测量所关注的内容,实际上它是从更广泛的意义上的一种对人(产品用户)的全面和综合的理解。
HFES从二战中有军方从事的系统分析中发展而来。
其中的三种主要研究的是人体测量、复杂信息的解释和管理,以及在部队和装备调配中应用的系统分析。
系统分析在尺度和复杂性方面跨度很大,大的系统分析有类似于诺曼底登陆准备的大型系统规划,小到去理解如何从合理性和规模的角度才最佳的布置和装备人员。
诺曼底登陆是20世纪最复杂的事件之一。
他要求建立一个在战斗开始之前还不确定的庞大的人员和物资的合理分配系统。
在更小的规模上,装备和军事人物的布置意味着如何去组织、训练和安排战士,最大限度的发挥他们的长处。
士兵必须迅速地接受训练,并且能够有效地使用和维护在二战中发展起来的一系列技术装备。
其中,对于飞行员、潜艇人员和坦克驾驶员有神采的限制。
复杂的新装备的开发要求找到最好的税收、密码便医院、破译人员、雷达和声纳操作员、轰炸机驾驶员和机组人员。
在战后,随着公司及其产品在尺度、领域和复杂性方面的增长,很多系统分析人员在商用领域找到了发展机会。
尽管是战后的发展才导致了1957年人机工程协会(HFES)的建立,但人机研究的起源可以追溯到大批量生产方式的成型阶段,是当时提高生产效率的要求。
随着工作方式从手工生产和农业生产中的转移,新的工厂工作的概念逐步发展起来。
福特的流水生产线和泰勒的效率理论开始对生产的规划和教育产生影响。
即使在家庭生活中,妇女们也开始接受了现代家庭管理理论,并运用这些理论来组织和规划家庭。
在20世纪末,一种涵盖面更广的人机工程正在发展之中。
新的人机工程学是为了适应已经被广泛意识到的对用户行为模式更深入的需求而诞生的,它开始应用定型研究方法,并探索人的情感和认知因素。
安全作文英文70字英文,Safety is a very important issue that we should always pay attention to. In our daily lives, we need to be aware of potential hazards and take measures to prevent accidents. For example, when crossing the street, we should always look both ways before crossing and obey traffic signals. In addition, we should wear protective gear when engaging in activities that may pose a risk to our safety, such as sports or construction work. It's also important to be cautious when using electronic devices, such as not texting while driving or not leaving a hot stove unattended. By being aware of potential dangers and taking precautions, we can ensure our own safety and the safety of those around us.中文,安全是一个非常重要的问题,我们应该始终关注。
在我们的日常生活中,我们需要注意潜在的危险并采取措施防止事故发生。
例如,过马路时,我们应该在过马路之前仔细看两边并遵守交通信号。
此外,在从事可能对我们的安全构成风险的活动时,我们应该穿戴防护装备,例如运动或建筑工作。
英语作文安全70字带翻译Title: Importance of Safety。
Safety is paramount in our daily lives. Firstly, it ensures our well-being and protects us from harm. For instance, wearing seat belts while driving reduces the risk of injury in accidents. Secondly, safety measures promote productivity in workplaces. Employees feel secure when safety protocols are in place, leading to better focus on tasks. Thirdly, safety fosters trust and confidence in communities. When people feel safe, they are more likely to engage in social activities and contribute positively to society. In conclusion, safety is indispensable for personal, professional, and societal harmony.中文翻译:标题,安全的重要性。
安全在我们的日常生活中至关重要。
首先,它确保我们的安全并保护我们免受伤害。
例如,驾驶时系安全带可以减少事故中受伤的风险。
其次,安全措施促进了工作场所的生产力。
当安全协议得到遵守时,员工会感到安全,从而更好地专注于工作。
第三,安全促进了社区的信任和信心。
当人们感到安全时,他们更有可能参与社会活动并积极为社会做出贡献。
工程力学外文翻译范文工程力学英文什么说工程力学,英文是:engineering mechanics。
例句:并基于工程力学对充填体强度及其安全性进行了分析研究。
An analysis study was conducted on the strength and safety of the backfill materialbased on the engineering mechanics.详细解释:engineering英[?end???n??r??] 美[?end???n?r??]n. 工程(学),工程师行业; 操纵,管理; 土木工程,工事; 开车技术;[例句]He has not studied mechanics or engineering.他没有学习过力学和工程学。
mechanics 英[m?'k?n?ks] 美[m??k?n?ks]n. 力学; 机械学; 构成法; 技术;[例句]He has not studied mechanics or engineering.他没有学习过力学和工程学。
机械学院工程力学专业的英文是Engineering Mechanics major in Mechanical Engineering。
工程力学专业本专业培养具备力学基础理论知识、计算和试验能力,能在各种工程(如机械、土建、材料、能源、交通、航空、船舶、水利、化工等)中从事与力学有关的科研、技术开发、工程设计和力学教学工作的高级工程科学技术人才。
本专业主要学习力学、数学基本理论和知识,受到必要的工程技能训练,具有应用计算机和现代实验技术手段解决与力学有关的工程问题的基本能力。
《工程力学》是土木工程专业主要的技术基础课,而且也是学生公认的一门比较难学的课程。
该课程不但要求学生能正确理解基本概念,而且要求学生要学会用所学内容求解各种工程和生活中的各种力学问题。
所以该课程要求学生具有较好的高等数学基础。
井冈山大学外文翻译题目施工组织设计与施工图预算学院建筑工程学院专业工程管理姓名谭智强学号90617008指导教师夏振华2012年11月20日开发一个评估施工现场安全管理系统有效性的模型Developing a model to measure the effectiveness of safety management systems of construction sites作者:Evelyn Ai Lin Teoa,_, Florence Yean Yng Linga起止页码:1584~1592出版日期(期刊号):2005年6月第005版出版单位:新加坡环境国立大学摘要:在新加坡,实施了建筑行业安全管理系统(SMS)和SMS审计大约有十年之久的现在,安全标准的提高并不显著。
为了回应需要改进的有效性(SMS)和安全管理体系审计的目的,本文提出了一种方法, 人员可以利用测试工具来评估审计建筑公司安全管理体系的有效性。
研究方法采用了15个步进行调查,安全专家被邀请通过面试或工作表达自己的意见。
层次分析法(AHP)及因子分析是用来协助识别影响最为关键的因素和属性的安全。
该模型开发利用多属性值模型(MAVT)的方法。
该方法可以通过网站得到验证审核,利用模型中施工安全指数(CSI)可以计算出来。
结果表明,该模型可以作为一个客观CSI衡量不同管理和评估。
关键词: 安全管理体系;安全审核;施工安全指数1 简介: 支撑这一工作的论据安全管理体系(SMS)作为建筑业一个正式制度的管理现场安全的体系。
承包商预期管理现场安全通过正常的安全管理体系。
如何有效地评价这些系统是很重要的,这样可以使不足之处得以更正。
该研究工作是在协作与职业安全部门监督下进行的,人力资源部门可根据当局评价审计协议来衡量一个建筑工地的有效性的安全管理体系。
新加坡建筑行业服务实施了安全管理体系审计大约有十年之久了,但是提高的安全效果并不显著。
这与影响船舶的修建行业一样,经历了一个稳定提高安全性能的阶段。

工业大学本科生毕业设计(论文)外文翻译毕业设计题目:楼宇门禁监管系统软件设计学院:信息科学与工程学院专业班级:通信工程0902学生:格根哈斯090404049指导教师:柏山2013年 03 月 18 日门禁管理系统原理门禁系统是最近几年才在国广泛应用的又一高科技安全设施之一,现已成为现代建筑的智能化标志之一。
门禁,即出入口控制系统,是对出入口通道进行管制的系统,门禁系统是在传统的门锁基础上发展而来的(英文E NTRANCE G UARD /A CCESS C ONTROL)。
在现实中访问控制是,我们的日常生活中的现象。
一车门上的锁,本质上是一种形式的访问控制。
在一家银行的ATM系统是一个PIN访问控制的另一种方式。
站在一家夜总会门前的安保人员是缺乏涉及信息技术,也许是更原始的访问控制模式。
拥有访问控制是当人寻求安全,或敏感的信息和设施时非常重要的.项目控制或电子钥匙管理的区域(和有可能集成),一个访问控制系统,它涉及到管理小资产或物理(机械)键的位置。
一个人可以被允许物理访问,根据支付,授权等。
有可能是单向交通的人,这些都可以执行人员,如边防卫兵,一个看门人,检票机等,或与设备,如旋转门。
有可能会有围栏,以避免规避此访问控制。
在严格意义上的访问控制(实际控制访问本身)的另一种方法是一个系统的检查授权的存在,例如,车票控制器(运输)。
一个变种是出口控制,例如的店(结帐)或一个国家。
在物理安全方面上的访问控制是指属性,建筑,或授权人一个房间,限制入口的做法。
在这些环境中,物理密钥管理还可以进一步管理和监控机械键区或某些小资产。
物理访问控制访问的一种手段,是谁,地点和时间的问题。
访问控制系统决定谁可以进入或退出,在那里他们被允许离开或进入,而当他们被允许进入或退出。
从历史上看,这已经部分实现通过钥匙和锁。
当门被锁定只有有人用一把钥匙可以通过门禁,这时取决于锁定如何配置。
机械锁和钥匙的钥匙持有人在特定的时间或日期允许访问。
介绍安全工程专业的英语作文As the world becomes increasingly digitalized, the demand for professionals in the field of security engineering is on the rise. 安全工程专业是一个涉及到计算机科学、网络安全和信息技术等多个领域的综合性学科,它旨在培养学生具备在互联网时代面临各种安全威胁和挑战时,能够设计、开发和维护安全系统的能力。
One of the primary focuses of security engineering is on developing strategies to protect sensitive information from unauthorized access or cyber-attacks. 安全工程专业的主要焦点之一是开发保护敏感信息免受未经授权访问或网络攻击的策略。
这需要学生掌握网络安全原理、密码学、防火墙技术等多种技能,以应对日益复杂的网络威胁。
In addition to technical skills, security engineering also emphasizes the importance of ethical considerations and legal compliance. 与技术技能相辅相成的是,安全工程也强调道德考虑和合法合规的重要性。
在处理安全问题时,学生需要考虑到不同利益相关者的权益,同时遵循法律法规,这对于培养学生的责任感和社会责任意识非常关键。
Furthermore, the curriculum for security engineering often includes hands-on experience and real-world case studies to provide students with practical skills and knowledge. 此外,安全工程专业的课程通常包括实践经验和真实案例研究,以提供学生实际技能和知识。
附录ANALYSIS ON RELATION BETWEEN HSE ADMISTRIATION SYSTEM AND SAFTY OF A COMPANYThe foundation of HSE administration system is a combination of factors which influence whether an institution will function safely and healthily. These factors are organized together in an advanced and scientific way in order to form an administration system. HSE administration system requires an institution to do the risk assessment systematically and periodically in order to identify any risk and be prepared. It emphasizes on a continual improvement, and possesses a high level of degree of self-restriction and self-improvement; therefore, it is an advanced administration system.HSE administration system is originally used by mining companies and it is developed based on HSE administration system through humongous practice. It has several foundational requirements such as participation of all employees and management, continual improvement, cooperation with suppliers, sustainable environmental and economic development, and relationship with customers. QHSE has helped Chinese mining companies to be ranked in the first-class of international mining companies.HSE administration system is one of the most developed administration systems in the world. It has been widely adopted in mining industry. In order to make HSE system more applicable, we must integrate it with the traditional administration systems. In fact, there are some common factors existing in the HSE system and traditional systems. However, the HSE system is much more advanced, scientific, and harmonious, and it possesses some unique characteristics. In order to gain full advantages on HSE system, the company has to develop a culture that is suitable for the application of the system.1、The central factor is the participation of management.The participation from all level of management will release the pressure on employees, lead employees to the right direction, and make employees fullyunderstand the core of the system. The management has to make the promise to allow all employees to participate; setup the clear direction and target; provide all resources required; and clearly setup responsibilities for each participant. Similar with the traditional system, those requirements above are all following government law and based on resources available. Compared with traditional system, the HSE system is more applicable, scientific, and detailed.2、anagement of responsibilities of participants.In order make the system run smoothly, the company has to setup clear responsibilities for all level of management and employees and reword and compensation system.2.1 esponsibilities for the high level management:1)enforce and implement the government laws;2)set up a HSE committee to constitute the company policies regarding thesafety and environmental issues;3)set up policies regarding the utilization of resources;4) evaluation system regarding the implementation process of the HSE system.2.2 Management is responsible for the delivery target and policy to all employees and implementation of the HSE system; evaluation on process of implementing the HSE system; report to the CEO, the board and the committee about how the system is implementing; report any problem in the procedure; correct any problem that is opposite and deleterious to the HSE system.2.3 Head of each department should setup policies and targets according to the corporation policies and targets based on each department’ funct ions and characteristics.2.4 Human resource department should setup evaluation and compensation system accordingly and implement them throughout the whole corporation.3、In order to create a healthy, safe and sustainable environment, the organization should make the implementation procedure of the HSE system simple, efficient, effective and applicable. It should be a process that started from simplicity to complexity, then from complexity to another stage of development. Practicality of theHSE system is based on simplicity. Once the organization carries out the system in day-to-day operation, the system can function more and more efficiently and effectively.3.1 Culture creation is the premise of HSE system.Corporation culture is one part of a modern corporation. It is created throughout daily operation, and long-term education.3.2 Corporation culture is one part of the HSE system. It is created through daily operation and long-term education; it is created subconsciously and it is unique for each corp oration. It should cover every aspect of the corporation and workers’ corporation life. The corporation should have a culture which is dealing with concrete matters relating to work, considering workers’ health and safety, continual improvement, being conscious on potential risks, self-evaluation, and ext.The creation of culture should be one part of the HSE system, and the corporation should encourage full participation of all management and employees.浅析HSE管理体系与企业安全文化HSE管理体系是将实施健康、安全与环境管理的组织机构、职责、做法、程序、过程和资源等要素有机构成的整体,这些要素通过先进、科学、系统的运行模式有机的融合在一起,相互关联、相互作用,形成动态管理体系。
食品安全专业蔬菜论文中英文外文翻译文献1. 王涛, 徐亚男. 我国蔬菜生产与安全的现状与对策[J]. 广东农业科学, 2010, 37(13): 45-47.2. 斯宪芳, 卢仁志. 蔬菜中的重金属和农药残留及其安全问题的调查分析[J]. 中国环境监测, 2007, 23(5): 116-118.3. 范翠华, 阮荣平, 段爱敏,等. 无公害蔬菜生产技术对蔬菜品质及其营养成分的影响[J]. 广东农业科学, 2009, 36(19): 98-100.4. Yeoh S H, Chua T H. Trace metal levels in vegetables from selected farms in Johor Bahru and Kluang[J]. Malaysian Journal of Nutrition, 2002, 8(1): 11-17.5. Mahdi Y, Richardson D G, Abdulla H K, et al. Heavy metal content of some vegetables collected from different areas of Baghdad city, Iraq[J]. Environmental Monitoring and Assessment, 2012, 184(11): 6813-6821.6. 潘云贤, 王振球. 现代环境背景下蔬菜农药安全问题的研究与探讨[J]. 科技资讯, 2007(19): 575.7. 鲍云飞, 顾振中. 蔬菜中农药残留标准及其对我国的启示[J]. 中国农业资源与区划, 2010, 31(2): 23-26.8. 杨忠伦. 我国现代农业生产与蔬菜种植技术的发展现状及对策思考[J]. 产业技术创新, 2018(17): 71.以上8篇文献主要探讨了蔬菜生产与安全问题,包括无公害蔬菜生产技术对蔬菜品质及其营养成分的影响,以及蔬菜中的重金属和农药残留及其安全问题的调查分析等方面。
本科生毕业设计(论文)专业外文翻译原文:Microcontroller Based Home Automation System With Security译文:基与单片机的智能家居系统与安全性指导教师:职称:副教授学生姓名:学号: 1002120106专业:电气工程及其自动化院(系):机电工程学院2014年3月20日Microcontroller Based Home Automation System With SecurityAbstract:With advancement of technology things are becoming simpler and easier for us. Automatic systems are being preferred over manual system. This unit talks about the basic definitions needed to understand the Project better and further defines the technical criteria to be implemented as a part of this project.Keywords-component; Automation, 8051 microcontroller, LDR,LED, ADC, Relays, LCD display, Sensors, Stepper motorI.NTRODUCTIONA home automation system integrates electrical devices in ahouse with each other. The techniques employed in home automation include those in building automation as well as the control of domestic activities, such as home entertainment systems, houseplant and yard watering, pet feeding, changing the ambiance "scenes" for different events (such as dinners or parties), and the use of domestic robots. Devices may be connected through a computer network to allow control by apersonal computer, and may allow remote access from the internet.Typically, a new home is outfitted for home automation during construction, due to the accessibility of the walls, outlets, and storage rooms, and the ability to make design changes specifically to accommodate certain technologies. Wireless systems are commonly installed when outfitting a pre-existing house, as they reduce wiring changes. These communicate through the existing power wiring, radio, or infrared signals with a central controller. Network sockets maybe installed in every room like AC power receptacles. Although automated homes of the future have been staple exhibits for World's Fairs and popular backgrounds in science fiction, complexity, competition between vendors, multiple ncompatible standards and the resulting expense have limited the penetration of home automation to homes of the wealthy or ambitious hobbyists.II.HOME AUTOMATIONHome/office automation is the control of any or all electrical devices in our home or office, whether we are there or away. Home/office automation is one of the most exciting developments in technology for the home that has come along in decades. There are hundreds of products available today that allow us control over the devices automatically, either by remote control; or even by voice command. Home automation (also called domotics) is the residential extension of "building automation". It is automation of the home,housework or household activity. Home automation may include centralized control of lighting, HV AC (heating,ventilation and air conditioning), appliances, and other systems,to provide improved convenience, comfort, energy efficiency and security. Disabled can provide increased quality of life for persons who might otherwise require caregivers or institutional care. Earlier, we looked into the face of future when we talked about automated devices, which could do anything on instigation of a controller, but today it has become a reality.III.NEED OF AUTOMATIONWith advancement of technology things are becoming simpler and easier for us. Automation is the use of control systems and information technologies to reduce the need for human work in the production of goods and services. In the scope of industrialization, automation is a step beyond mechanization. Whereas mechanization provided human operators with machinery to assist them with the muscularrequirements of work, automation greatly decreases the need for human sensory and mental requirements as well. Automation plays an increasingly important role in the world economy and in daily experience. Automatic systems are being preferred over manual ystem. Through this project we have tried to show automatic control of a house as a result of which power is saved to some extent.a) An automated device can replace good amount of human working force, moreover humans are more prone to errors and in intensive conditions the probability of error increases whereas, an automated device can work with diligence,versatility and with almost zero error.Replacing human operators in tasks that involve hard physical or monotonous work.Replacing humans in tasks done in dangerous environments (i.e. fire, space, volcanoes, nuclear facilities,underwater, etc)Performing tasks that are beyond human capabilities of size, weight, speed, endurance, etc.Economy improvement. Automation may improve in economy of enterprises, society or most of humankind. For example, when an enterprise that has invested in automation technology recovers its investment, or when a state or country increases its income due to automation like Germany or Japan in the 20th Century.b) This is why this project looks into construction and implementation of a system involving hardware to control a variety of electrical and electronics system.IV.SUPPY UNITA.Transformer:The main source of power(Fig 1) supply is a transformer. The maximum output power of power supply is dependent on maximum output power of transformer .We determine power from its current and voltage rating. e.g.: if there is a transformer of 12V, 500mA then maximum power delivered by transformer is 6Watt.It means we can drive a load from this transformer up to 6w. In our project our maximum power requirement is 1watt. So to provide this power we use 12V/250mA transformer. The maximum output power of this transformer is 4watt.it means it can easily drive load up to 4 watt.B.RectifierRectifier is a circuit which is used to convert ac to dc.Every electronic circuit requires a dc power supply for rectification. We have used four diodes.C.Input filter:After rectification we obtain dc supply from ac but it is not pure dc it may have some ac ripples .To reduce these ripples we use filters. It comprises of two filters –low frequency ripple filter and high frequency ripple filter. To reduce low frequency ripples we use electrolytic capacitor. The voltage rating of capacitor must be double from incoming dc supply. It blocks dc and passes ripples to ground.D.RegulatorInitial stage of every electronic circuit is power supply system which provides required power to drive the whole system. The specification of power supply depends on the power requirement and this requirement is determined by its rating. The main components used in supply system are.Regulator is a device which provides constant output voltage with varying input voltage. There are two types of regulators(a) Fixed voltage regulator(b) Adjustable regulatorWe have used fixed voltage regulator LM78XX last two digits signify output voltage. The voltage for our system is 5V that is why we have used 7805 regulator which provides 5V from 12V dc.E.Output filter:It is used to filter out output ripple if any.F.Output indicationWe use LED to observe the functioning of our system. If he LED glows it confirms proper functioning of our supply.We have used four power supply units.This supply is for the microcontroller,display and relay unit.The microcontroller requires 5 volt supply to perform any desired task.G.Control UnitTwo control units were used one for internal system and one for external system and these control unit based on ATMEL’sAT89S52 microcontroller(Fig 2). The given capture shows the pins and basic requirement of microcontroller to make it functional. Detailed description of the controller is 100uf / 50v.In addition, the AT89S52 is designed with static logic for operation down to zero frequency and supports two software electable power saving modes. The Idle Mode stops the CPUwhile allowing the RAM, timer/counters, serial port, and interrupt system to continue functioning.Mode saves the RAM contents but freezes the oscillator, disabling all other chip functions until the next interrupt or hardware reset.The Downloadable Flash can be changed a single byte at a time and is accessible through the SPI serial interface. Holding RESET active forces the SPI bus into a serial programming interface and allows the program memory to be written to or read from unless Lock Bit 2 has been activated.H.FeaturesCompatible with MCS-51™ProductsI.8KbytesofIn-SystemDownloadable Flash MemoryReprogrammableSPI Serial Interface for Program DownloadingEndurance: 1,000 Write/Erase Cycles4.0V to5.5V Operating RangeFully Static Operation: 0 Hz to 33 MHz56 x 8 bit Internal RAM32 Programmable I/O LinesThree 16 bit Timer/CountersEight Interrupt SourcesUll Duplex UART Serial ChannelLow Power Idle and Power Down ModesI .AdvantagesLess power consumptionLow costLess space requiredHigh speedFig 2-Chip BoardAT89S52 is an ATMEL controller with the core of Intel MCS-51. It has same pin configuration as give above. The AT89S52 is a low-power, high-performance CMOS 8-bit microcomputer with 8K bytes of Downloadable Flash programmable and erasable read only memory and 2K bytes of EEPROM. The device is manufactured using Atmel’s high density nonvolatile memory technology and is compatible with the industry standard 80C51 instruction set and pin out. The on-chip Downloadable Flash allows the program memory to be reprogrammed in-system through an SPI serial interface or by a conventional nonvolatile memory programmer. By combining a versatile 8-bit CPU with Downloadable Flash on a monolithic chip, the Atmel AT89S52 is a powerful microcomputer which provides a highly flexible and cost effective solution to many embedded control applications.The AT89S52 provides the following standard features: 8K bytes of Downloadable Flash, 2K bytes of EEPROM, 256 bytes of RAM, 32 I/O lines, programmable watchdog timer, two Data Pointers, three 16-bit timer/counters, a six-vectorJ .Pin DescriptionVCC: Supply voltage. GND: Ground., Port 0: Port 0 is an 8-bit open drain bidirectional I/O port. As an output port, each pin can sink eight TTL inputs. When 1s are written to port 0 pins, the pins can be used as high impedance inputs. Port 0 can also be configured to be the multiplexed low-order address/data bus during accesses to external program and data memory. In this mode, P0 has internal pull-ups. Port 0 also receives the code bytes during Flash programming and outputs the code bytes during program verification. External pull-ups are required during program verification.Port 1: Port 1 is an 8-bit bidirectional I/O port with internal pull-ups. The Port 1 output buffers can sink/source four TTL inputs. When 1s are written to Port 1 pins, they are pulled high by the internal pull-ups and can be used as inputs. As inputs, Port 1 pins that are externally being pulled low will source current (IIL) because of the internal pull-ups.In addition, P1.0 and P1.1 can be configured to be the timer/counter 2 external count input (P1.0/T2) and the timer/counter 2 trigger input (P1.1/T2EX), respectively, as shown in the following table .Port 1 also receives the low-order address bytes during Flash programming and verification.Port 2: Port 2 is an 8-bit bidirectional I/O port with internal pull-ups. The Port 2 output buffers can sink/source four TTL inputs. When 1s are written to Port 2 pins, they are pulled high by the internal pull-ups and can be used as inputs. As inputs, Port 2 pins that are externally being pulled low will source current (IIL) because of the internal pull-ups. Port 2 emits the high-order address byte during fetches from external program memory and during accesses to external data memory that uses 16-bit addresses (MOVX @ DPTR). In this application, Port 2 uses strong internal pull-ups when emitting 1s. During accesses to external data memory that uses 8-bit addresses (MOVX @ RI), Port 2 emits the contents of the P2 Special Function Register. Port 2 also receives the high-order address bits and some control signals during Flash programming and verification. Port 3 Port 3 is an 8-bit bidirectional I/O port with internal pull-ups. The Port 3 output buffers can sink/source four TTL inputs. When 1s are written to Port 3 pins, they are pulled high by the internal pull-ups and can be used as inputs. As inputs,Port 3 pins that are externally being pulled low will source current (IIL) because of the pull-ups. Port 3 receives some control signals for Flash programming and verification. Port 3 also serves the functions of various special features of the AT89S52.RST: Reset input. A high on this pin for two machine cycles while the oscillator is running resets the device. This pin drives high for 98 oscillator periods after the Watchdog times out. The DISRTO bit in SFR AUXR (address 8EH) can be used to disable this feature. In the default state of bit DISRTO,the RESET HIGH out feature is enabled. ALE/PROG: Address Latch Enable (ALE) is an output pulse for latching the low byte of the address during accesses to external memory. This pin is also the program pulse input (PROG) during Flash programming. In normal operation, ALE is emitted at a constant rate of 1/6 the oscillator frequency and may be used for external timing or clocking purposes. Note,however,that one ALE pulse is skipped during each access to external data memory.If desired, ALE operation can be disabled by setting bit 0 of SFR location 8EH. With the bit set, ALE is active only during a MOVX or MOVC instruction. Otherwise, the pin is weakly pulled high. Setting the ALE-disable bit has no effect if the microcontroller is in external execution mode.PSEN: Program Store Enable (PSEN) is the read strobe to external program memory. When the AT89S52 is executing code from external program memory, PSEN is activated twice each machine cycle, except that two PSEN activations are skipped during each access to external data memory.EA/VPP: External Access Enable. EA must be strapped to GND in order to enable the device to fetch code from external program memory locations starting at 0000H up to FFFFH. Note, however, that if lock bit 1 is programmed, EA will be internally latched on reset. EA should be strapped to VCC for internal program executions.This pin also receives the 12-volt programming enable voltage (VPP) during Flash programming.XTAL1: Input to the inverting oscillator amplifier and input to the internal clock operating circuit.XTAL2: Output from the inverting oscillator amplifier.H. Display UnitFig 3-Display UnitLiquid crystal displays (LCD) is an alphanumeric display and widely used in recent years as compared to LEDs. This is due to the declining prices of LCD, the ability to display numbers, characters and graphics, incorporation of a refreshing controller into the LCD, their by relieving the CPU of the task of refreshing the LCD and also the ease of programming for characters and graphics. We have used JHD162A advanced version of HD44780 based LCDs.V.WHAT CAN BE AUTOMATEDA.Virtually anything in the home/office that is powered by electricity can be automated and/or controlled. We can control our electrical devices. The password is given with the help of controller and can be changed by simply making a small change in the program and then burning the program in the controller.B.Counter dependent automatic switching system of roomAfter opening the lock when the person enters the room the counter gets incremented.Now if it is a day then the lights would not be switched on but if it is dark then the lights will automatically switch on. Now whatever may be the number of people entering the room the counter will automatically get incremented by itself and on leaving the room the counter will get decremented but the system will keep on working .Once the counter is zero in other words once everyone leaves the room the switching system will automatically stop working.C.Temperature controlled cooling systemOnce the person has entered the room he would not require to switch on anything everything will just happen automatically. Like if the temperature is high then the fan will switch on, on its own. Else it will remain in off state. This temperature is predefined by us in the controller. But this system will only work if there is a person in the room in other words if the counter is not zero.D.Light saving systemThis light saving system is used in two places for internal section and external section. If a person is not at home or sitting inside the room and it is dark outside then the lights will automatically get switched on and when its day the light will get switched off. This ensures power saving.Fire and Smoke sensorThis part detects any fire or smoke from a fire and set an alarm or an indication.VI. FEATURESPassword Based Locking SystemIn this system we have ensured a safe locking system. On seeing from outside the lock would not be visible but this inbuilt locking system ensures security. This lock can be opened and closed with the help of a password which we will give using a keypad. The door will only open or close only if the password is correct else it will remain in its original state. The lock cannot be broken because to the person standing Future of Automation: Future will be of Automation of all products. Each and every product will be smart devices that we use daily and that will be controlled through a smart chip called microcontrollers. Each and Every home appliances will be controlled either by PC or hand held devices like PDA or mobile handsets. Some examples of it are when you want you can switch on/off Fan of your home by mobile handset or PC.Smart Grid: Home automation technologies are viewed as integral additions to the Smart grid. The ability to control lighting, appliances, HV AC as well as Smart applications(load shedding, demand response, real-time power usage and price reporting) will become vital as Smart Grid initiatives are rolled out.VII. CONCLUSIONAn automated home can be a very simple grouping of controls, or it can be heavilyautomated where any appliance that is plugged into electrical power is remotelycontrolled. Costs mainly include equipment, components, furniture, and custom installation.Ongoing costs include electricity to run the control systems, maintenance costs for the control and networking systems, including troubleshooting, and eventual cost of upgrading as standards change. Increased complexity may also increase maintenance costs for networked devices.Learning to use a complex system effectively may take significant time and training.Control system security may be difficult and costly to maintain, especially if the control system extends beyond the home, for instance by wireless or by connection to the internet or other networks.基与单片机的智能家居系统与安全性摘要:随着技术的进步的东西变得更简单,更容易为我们服务。
安全工程英文作文英文:As a security engineer, my job is to ensure the safety of people, property, and information. This involves a variety of tasks, such as risk assessments, designing security systems, and implementing security measures.One of the biggest challenges in security engineering is staying ahead of the constantly evolving threats. Hackers and other malicious actors are always finding new ways to exploit vulnerabilities, so it's important to constantly update and improve security measures.Another important aspect of security engineering is communication. It's important to be able to effectively communicate with clients, stakeholders, and other team members to ensure everyone is on the same page and working towards the same goal.Overall, security engineering is a challenging but rewarding field. It requires a combination of technical skills, creativity, and communication abilities to ensure the safety and security of people, property, and information.中文:作为一名安全工程师,我的工作是确保人员、财产和信息的安全。
安全生产英文作文英文:As a responsible worker, I always prioritize safety in the workplace. Safety production is not only important for me but also for my colleagues and the company as a whole.In order to maintain a safe and healthy working environment, I always follow the safety guidelines and procedures that are set by the company.One of the most important things that I do is to wear personal protective equipment (PPE) such as safety glasses, gloves, and helmets. For example, when I work in the construction site, I always wear a hard hat to protect my head from falling objects. I also make sure to inspect my PPE regularly to ensure that they are in good condition.Another thing that I do to ensure safety is to be aware of my surroundings. I always pay attention to the potential hazards in the workplace and take necessary precautions toavoid accidents. For example, when I work with heavy machinery, I make sure to stay away from the moving parts and keep a safe distance.In addition, I always communicate with my colleagues about safety issues. We discuss potential hazards and waysto avoid accidents. We also report any safety concerns to our supervisors so that they can take appropriate action.Overall, safety production is everyone's responsibility. By following safety guidelines, wearing PPE, being aware of our surroundings, and communicating with our colleagues, we can create a safe and healthy working environment for everyone.中文:作为一名负责任的工人,我总是把安全放在第一位。
附录Application of Gas Content Test Data to the Evaluation of Gas Emission and Hazards During Longwall Developmentand ExtractionR. J. Williams GeoGAS Systems Pty. Ltd.AbstractThis paper compares aspects of fast and slow desorption methods and attempts to provide guidelines for their application and associated sampling strategies.The importance of determining Total Desorbable Gas Content (Q1+Q2+Q3) as opposed to Desorbable Gas Content (Q1+Q2) is highlighted. The former involves partial destruction of bore core, but provides considerably more accurate data. It is also more amenable for use in gas reservoir simulation modelling.Fast desorption techniques are shown to have considerable advantages over slow desorption techniques. These are, greater accuracy in gas composition assessment, the potential to rationalise sampling, fast turnaround involving fewer resources, finalization of geological logs and early application of the data. Q3 can still be differentiated. A more sensitive indicator of gas desorption rate is incorporated in GeoGAS’s fast desorption method (GeoGAS Desorption Rate Index).Gas reservoir size determination is facilitated by a sampling strategy where relationships between gas content and gas composition with depth and mineral matter are defined. This enables indirect assignment of gas content to those gas bearing strata not directly tested. The importance of testing/assigning gas contents to inferior coaly horizons is indicated. Gas content test results are basic input into any mining application. An overview of its application to modelling gas emission is given. Statistical analysis of the data enables modelling inputs and outputs to be expressed as means and probability distributions. IntroductionGas content testing has become a routine part of most surface borehole exploration programs for underground coal mining. The gas content test data are basic input into costed approaches to gas, ventilation and spontaneous combustion control.With the development over the past three years of fast desorption methods of gas content testing, the exploration geologist is confronted with additional choice of method and sampling strategy.This paper compares aspects of fast and slow desorption methods and attempts to provide guidelines for their application and associated sampling strategies.The most important of determinant of methodology is how the data will be used. Application to longwall development and extraction is broadly covered.Gas Content TestingTerminologyThe following terminology is used in this paper. It should generally be accepted across the industry.Total Desorbable Gas Content (TDGC) - the sum of Lost Gas (Q1), Desorbed Gas (Q2) and Residual Gas (Q3)Lost Gas (Q1) - Gas lost from the sample between coring and sealing in a gas canister.Desorbed Gas - The gas desorbed (per unit mass) from an uncrushed coal sample in the time between lost gas testing and crushing of the coal. The term is applied to fast desorption testing and is not the same as Q2.Q2 - The gas desorbed (per unit mass) from an uncrushed coal sample held within a seam gas atmosphere, to the point in time where the partial pressure of the gases in the gas bomb is in equilibrium with the remaining gas in the core. The ambient pressure is approximately 1 atmosphere.GeoGAS’s fast desorption method determines Q2 by difference by subtracting the separately determined Q3 value from the initial desorbed gas, plus the gas on crushing.Q2 = (“desorbed gas” + “gas on crushing”) - Q3Gas on Crushing - that gas released during crushing of the coal sample, at ambient pressure. Applies to fast desorption testing. The definition is not the same as Q3.Residual Gas (Q3) - The volume of gas per unit mass desorbed at atmospheric pressure from the crushed coal sample after it has been allowed to desorb to its equilibrium gas content level in a seam gas atmosphere.Desorbable Gas Content - the sum of Q1 and Q2.GeoGAS DRI - A measure of the rate of gas desorption during crushing of the coal sample, corrected to the TDGC of the sample. (The gas volume generated after 30 seconds of crushing a 200 g sample corrected from the “Gas on Crushing” value to the TDGC value).While AS 3980-1991 specifies reporting results to STP (0°C, 101.3 KPa), it is common practice in the industry to report results to 20°C and 101.3 KPa.A Comparison of Fast and Slow Desorption MethodsAustralian standard AS 3980-1991, Guide to the determination of the desorbable gas content of coal seams was developed to address the need to adopt a more uniform approach to gas content testing. Since then (1991), a number of limitations and deficiencies have been identified, to the point where a new standard, incorporating fast desorption techniques, is currently being developed.Traditionally, gas content testing has been undertaken by the slow desorption method (USBM), with testing being mainly confined to Desorbable Gas Content Q1+Q2 determinations. With the emergence of the fast desorption methods and associated review of these and slow desorption methods (as in Working Group MN/1/5/3 - Standards Australia), limitations of these methods have been more clearly recognized.The comments and comparisons th at follow refer only to GeoGAS’s method of fast desorption testing and experiences in its application. For a more complete view, the interested reader should contact other organizations who have developed fast desorption methods (ACIRL, BHP, CSIRO, KCC, Lunagas).The fast and slow desorption methods primarily differ in a number of ways, among the most important being destruction of the bore core during the test, the time taken to achieve a result and the accuracy of the result (Table 1).Table 1 Comparison of Slow and Fast DesorptionSlow Desorption Q1 + Q2SlowDesorptionWith Q3GeoGAS FastDesorptionQ1 + Q2 + Q3FastDesorptionWith Q3Core left intact Yes No (2 ×200 gcrushed) No (2 ×200gcrushed)No (additional2 ×200 gcrushed)Result Timing 30 days +30 Days +< 1 day 30 days +Accuracy re Gas Quantity Rough Potentiallygood whenadded toQ 1 + Q 2Good (+/ -0.5m3/t to 95%confidence)GoodAccuracy reGas Composition Rough unlesspure CH4Rough unlesspure CH4Good. DefineCO2 and N2Good defineCO2 and N2Accuracy DesorptionRate Rough N/A GoodGeoGAS DRIndexN/AResources Requires lotsof gasbombs/space. Requires lotsof gasbombs/space.Minimum withquick reuse ofequipmentUses glass jars,but as many aswith slowmethod.Adjustsamplingstrategy “onthe flyNot possible Not possible Yes YesEffect of slowleak in systemHigh High Slight SlightNo. testsrequired todefinereservoirMaximum Maximum Minimum MinimumThe main advantage for the slow desorption method (Q1+Q2 only) is that it can be used if the core is required intact for other analyses (eg washability testing), and there are no alternative sampling schemes. In the authors view, there is an unacceptable penalty on result accuracy.Stopping the test on Q1+Q2 without proceeding to Q3 can result in underestimation of the gas content from between 1 to 4 m3/t. The Q3 component is important in mining and gas extraction.The problem with measuring Q1+Q2 only, is that the test result is very much influenced by the equipment used, in particular, the void space in the gas bombs. Gas will stop desorbing in the canister when the partial pressure of the gas surrounding the core is inequilibrium with the sorbed gas concentration remaining in the core. Finishing a test on “Q2” alone, normally gives high scatter, potentially misleading results because of this effect. The time of terminating the test can also be some what arbitrary.In fast desorption testing, Q1+Q2+Q3 is determined in the one operation. It is useful to know the Q3 value, so with GeoGAS’s fast desorption method, a small scale “slow desorption” test has been added, to directly determine it. A sub sample (approx 600g) is taken for Q3 during the fast desorption test, and sealed it in a small “bomb” (glass j ar). It is left on line for a sufficiently long period to stop desorbing its gas. The “bomb” is packed full of coal, so that by the end of the test, the equilibrium end point for the desorption is one where the gas surrounding the coal pieces is near pure seam gas (unless the gas content is very low). This material is then crushed; the gas evolved being calculated as Q3.Gas composition is more accurately determined with the fast desorption method. Gas samples from exploration cores are routinely analyzed for CO2, CH4, N2and O2. Slow desorption techniques do not adequately address CO2(which is readily lost even in acid brine baths) and are ambiguous regarding the question of N2 being a real component of the seam gas. With the fast desorption method, there is little time available for solution of CO2 in water, or for O2 to react with the core to produce excess N2.Fast desorption testing allows quick turnaround (result in as little as 2 hours after the sample reaches the laboratory). This means that equipment needs are minimized. Fast turnaround of results frees core up for other tests, finalization of geological logs and application of the data. Importantly, gas content data can be evaluated as the drilling program progresses, so that decisions regarding sampling can be made in response to the evolving picture.Gas content is a static measure. In as far as gas desorption rate is affected by gas content, it implies a rate of gas desorption. But other factors significantly affect the rate of gas desorption, these being gas composition, inherent structural characteristics of the coal, and moisture.The rate of gas desorption is important to quantify. The following techniques are available: •The initial rate of gas desorption as part of the Q1 determination. This is common to fast and slow desorption testing.•The rate of gas desorption (desorption history curve) as part of the slow desorption test.•The rate of gas desorption during coal crushing, as part of the fast desorption test.Of the three options, the author has found the rate of gas desorption during coal crushing (GeoGAS DRI) to be highly sensitive, enabling differentiation of the effects on desorption rate from gas content, gas composition and inherent structural characteristics of the coal. From a database of over 3000 DRI determinations, characterization of the desorption rate of a particular coal is readily made, along with associated gas responses during mining, especially in relation to outburst phenomena.Sampling and Testing StrategyA generic aim for most gas testing programs is to define the stratigraphic and lateral distribution of gas content and gas composition. The extent of sampling required is ideally determined by statistical assessment of the data, with sufficient sampling being undertaken when the mean and probability distribution of the sample results are unaffected by further sampling (to say within 2%).In an assessment of the effect of gas on mining, all gassy material (any carbonaceous material) will need to be assigned values of gas content and composition, mostly indirectly. It is not practical to test every piece of coal or carbonaceous material. The key is to define relationships between gas content and other parameters that will enable indirect assignment of gas content to those lithologies not tested. The main relationships are gas content and depth, gas content and mineral matter and gas composition and depth.The lateral changes in these parameters need to be defined and controls also identified (eg. faulting can influence the distribution of carbon dioxide).The extent to which these relationships are defined determines the amount of sampling required.Regardless of how good or bad the relationship ends up being, for any particular value assigned to a gas bearing rock, a probability distribution should be associated with that value. GeoGAS modelling of gas emission uses a statistically modelling package called @RISK, where uncertain inputs are defined in terms of probability distributions. The model presents outputs as means and probability distributions, and a sensitivity ranking of the contribution of each input to the output distribution.The point is more about knowing how the spread of gas content data affect the final calculation (ie input into a mine feasibility or pre feasibility study), and how important gas is to the particular circumstance. If gas content value uncertainty is shown to be a major contributor to assessment uncertainty, then the next stage of drilling can be more focused to overcome these deficiencies.With slow desorption tests, assumptions need to be made about the gas content variability, and a rigid sampling program put in place. By the time the results are available, it would generally be too late to make adjustments in the sampling strategy - at least in the current drilling phase.Fast desorption testing opens the opportunity for rationalisation of the sampling program during the current drilling campaign. For example, boreholes for gas content testing could be drilled on a wide spacing (say 4 km) and depth/gas content gradients from each borehole compared. The results would influence the extent of fill in drilling for gas content testing.A more common approach is to limit the extent of sampling according to the budgetary con straints. With fast desorption testing and the “on the fly” sampling strategy, the opportunity is created to define the gas content and composition distribution with the least number of samples.Note that Q1+Q2 only slow desorption testing, is inappropriate due to result scatter and error. The author believes that compromising gas content testing by undertaking Q1+Q2 only testing because of the need to keep the core intact is not an acceptable outcome.All other forms of testing to define Q1+Q2+Q3 result in partial core destruction. Options to get around this limitation are:•Test the non economic coal horizons for gas content and composition and leave the economic horizons for quality testing. This option only applies if there are sufficient minor coal seams in the sequence.•Dedicate bore holes to gas content testing, or wedge off to obtain a coal quality core. The latter option is clearly preferred. While wedging off is more costly, in the end the better data should represent more value for money. If sample rationalisation strategies can be made to work, then the overall cost to define the gas content and composition distribution should be reasonable.Definition of the Gas Reservoir SizeFor longwall mining, quantification of gas sources in the region 200 m above the working seam to 60 m below the working seam is required. Any carbonaceous material can generate gas, so gas contents need to be assigned to all the potentially gas bearing materials present.In using gas content data for gas reservoir definition, the effect of mineral matter must be taken into account. Gas content test results are normally expressed in units of m3/t (m3 ofgas per tonne of substance). If the material is always pure coal, the gas content results can be used directly - but this almost never occurs.With variable amounts of mineral matter, expressing the results in m3/t becomes meaningless (m3of gas per tonne of what). It is important that each gas content determination have an associated density measurement. This facilitates conversion of the gas content data from m3/t to m3/m3 (m3 of gas / m3 of material). In this form it is useable.eg a shaly coal unit has a gas content of 5.0 m3/t and a relative density of 1.6 g/cc. The gas content in m3/m3 is 5 x 1.6 = 8.0 m3/m3.Most of the time, good quality coal is targeted for testing. This is fine, provided inferior coals make up only a small proportion of the total sequence. Where inferior coals are significant (eg Wongawilli seam) it is important to test a range of lithologies (carbonaceous shale, coaly shale, shaly coal, coal) and define a gas content/mineral matter relationship.This type of analysis is facilitated by “bombing” relatively uniform samples - eg all coaly shale or all carbonaceous shale. Mixtures are sometimes unavoidable, and can be accommodated, but require more extensive laboratory testing involving:•Defining and weighing each petrographic type.•Undertaking sub-sampling and crushing of samples of each type.•Calculating weighted average gas contents and densities for the combined material. It is also essential to exclude any material that does not contribute gas - eg clay bands.For situations where only coal has been gas content tested, gas contents can be calculated for associated carbonaceous shaly strata by measuring the density of the carbonaceous shale and calculating the gas content.eg A coal sample has a gas content of 5.0 m3/t and a density of 1.35 g/cc. An untested carbonaceous shale unit has a density of 1.9 g/cc. The density for zero gas content is (say) 2.4 m3/t (GeoGAS experience a range from 2.2 to 2.6 g/cc). The gas content of the carbonaceous shale can be calculated as a point on the straight line defined by the coal gas content and density (x1,y1) and the point at zero gas content and 2.4 g/cc density (x2,y2). The calculated carbonaceous shale gas content becomes 2.4m3/t.In proceeding to calculate the gas reservoir size, the depth/gas content gradient data and gas content mineral matter data combined with stratigraphic logs enable assignment of gas contents for all potentially gassy material, complete with probability distributions reflecting the level of uncertainty in the data.eg. Take the following sequenceLithology DirectlyMeasured Depthbase(m)Thickness(m)Q1 +Q2+ Q3(m3/t)Q1 + Q2+ Q3(m3/m3)Q1+Q2+Q3(m3/m2)ie/stratumCarb. Shale No 190.0 2.6 N/A 2.4 6.24 Coal Yes 192.6 0.5 5.0 6.75 3.38 Claystone No 192.7 0.1 N/A 0 0 Coal Yes 193.7 1.0 4.7 6.34 6.34 Sandstone No 205.0 11.3 N/A N/A (1)(1) Defined in m3/m2 units according to porosity and gas pressureA more detailed account of this approach is contained in Williams and Maddocks (1993). Application to MiningThe gas desorption rate has direct application in situations where the coal has become detached from the rock mass, as in instantaneous outbursts of coal and gas and in gas emission from coal blocks in the goaf.The GeoGAS DRI is a particularly important indicator of outburst proneness, enabling quite reasonable assessments to be carried out in the pre mining stage. For low permeability environments (<5 millidarcy), a GeoGAS DRI of >900 is deemed to be outburst prone. The reader is referred to Williams and Weissman (1995) for details on how desorption rate affects outburst proneness.To assess the rate of gas desorption from goaf coal blocks, GeoGAS has developed a crushing test that measures the rate of gas desorption of coal core under conditions of complete exposure to air, exposure to air and seam gas, saturated moist and dry conditions. These data are then used to model the effect on gas desorption of different block sizes (in collaboration with Dr. A. Saghafi, CSIRO Division of Coal and Energy Technology).With more emphasis being placed on spontaneous combustion control, the rate of gas desorption is becoming more important in gauging the time taken for a newly sealed off goaf to pass into and out of the explosive range. Too low a gas content could result in goaf gas mixture remaining in the explosive range for an unacceptably long period (pers comm. Andrew Self, Australian Coal Mining Consultants Pty. Ltd.).Longwall gas emission is a highly complex process. Models that describe the emission process rely heavily on empirical data. GeoGAS uses three approaches:•For Greenfield Sites/No Mine Access. The longwall specific emission is initially calculated. The model is an advance on traditional European methods in that the zone ofdegassing accounts for the gas desorption pressures, and varying longwall geometries. None-the-less, this static value 9has then to be related to production by coefficients derived from past longwalls that ideally have similar features to the one being evaluated. The approach and its limitations are described in Williams, Maddocks and Gale (1992). The accuracy is “rough”. Results are given in terms of probability distributions utilizing @RISK modelling.•For Mine Access/No Previous Longwalling. A longwall emission model is essentially custom built, taking into account the various gas sources that individually make up the total gas picture. At this level, more accurate definition is given on gas quantities and concentrations at different positions around the longwall. This includes differentiation of intake gas, gas generated from different sources within the goaf (ribs, coal blocks), gas during cutting of the face. The accuracy should be better, but has not been tested as yet (Dartbrook mine). Extensive use is made of probability distributions using @RISK modelling.•Previous Longwall Experience. Provided a high standard of gas emission monitoring has been undertaken, empirical relationships are readily established linking return gas concentration to the main variables of production rate, ventilating air and gas capture described in Williams, Maddocks and Gale, (1992).Provided there are no significant geological changes (and this frequently occurs),the results can be highly accurate (example Tahmoor Colliery, Williams,1991). Again, probability distributions using @RISK modelling are relevant here.Basic to all these models are detailed assessmer nts of the gas reservoir size along the longwall pillar. Quite marked changes can occur in stratigraphy, gas content and composition, resulting in conditions at the start of a longwall being very different to conditions at the end of the pillar (100% change).Gas reservoir simulators that model the fundamental characteristics of gas migration through coal are directly applicable to assessment of rib emission and design of gas drainage. Apart from gas content and composition data, basic model input includes permeability, relative gas/water permeability curves and gas sorption pressures (Meany et al., 1995). Permeability and relative permeability can be derived from surface bore hole well tests, with relative permeability determined from curve matching well test data using a gas reservoir simulator (eg SIMED II) or laboratory testing (Meany and Paterson, 1996).Water has an enormous effect on the rate of gas flow from a reservoir. The relativepermeability curves enable modelling of this effect. None-the-less, for a Greenfield site,a high level of uncertainty remains. Measurements from within operating coal mines frequently show a high variability in gas flow and residual gas contents, reflecting changes in permeability and relative permeability (apart from more direct causes such as partially collapsed boreholes).For gas drainage and ventilation design an approach used by GeoGAS involves: •Drilling wide (say 100 m) spaced test in-seam boreholes, and taking a profile of cores for gas content determination along their length. The rib should be old enough that the gas content profile reflects the state of rib degassing. The tests can be carried out in orthogonal boreholes to measure the effect of directional permeability due to cleating or stress effects.•The gas flow history from the test bore holes is measured.•The history of rib emission is defined (ideally measured prior to the test borehole drilling).•Model the measured gas content profile using curve matching in SIMED II.•Validate the model by using it to define the gas flow rates from the borehole and the rib emission rates. If differences occur between the measured and simulated results, changes to the permeability and relative permeability flows are required until all three independent sets of data can be modelled. Having developed the model, runs can then be made assessing the effect of different hole spacings and drainage times on the remaining gas content.For an operating mine requiring gas drainage, it is potentially an ongoing effort to balance bore hole spacings with the drainage time allowed by the mine plan, in an environment where the gas content and composition is changing laterally. Most mines are not set up to account for these changes and drill on a set spacing regardless of the drainage time available or changes in gas content.Primarily used as a planning aid for gas drainage, gas extraction plant design and gas utilization, GeoGAS use another program called GASTOT. It draws on a data base built mainly from SIMED II simulation data, of all the possible combinations of gas content, gas composition and hole spacing applying to the deposit. On entering the mining and drilling schedule on a panel by panel basis, the model is run, involving “drilling” every borehole in what could be the life of the mine and totaling the gas drained. Results are given in terms of gas quantity and quality to the gas extraction plant and remaining gas content in the coal.Areas where the remaining gas content is still too high can be flagged, and the mine plan adjusted accordingly.Gas content data used in SIMED II models use Total Desorbable Gas Content (Q1+Q2+Q3) recalculated to zero absolute pressure (ie Q1+Q2+Q3+”Q4”) with the aid of gas sorption isotherms, where Q4 is that component of gas content between 1 bar and 0 bar absolute. The importance of determining Total Desorbable Gas Content rather than just Desorbable Gas Content (Q1+Q2) is reinforced in this application.ConclusionsAssessment of gas reservoir size and distribution is another aspect of resource definition very much in the realm of the exploration or mine geologist to oversee. Geological training provides a sound basis for understanding the controls on the gas distribution and designing sampling and testing strategies to suit the particular situation.Bore core requirements create pressure on the geologist to cut the gas content testing short, either through shortened desorption or by not proceeding to test for residual gas content (Q3). The author makes the point that Desorbable Gas Content (Q1+Q2) only testing compromises later application of the data. With increasing importance of gas in mining,Q1+Q2 testing should rarely be acceptable. With appropriate sampling strategies, there should be sufficient material for bore core testing and determination of Total Desorbable Gas Content.Fast desorption methods are clearly preferred. Advantages over slow desorption methods are, greater accuracy in gas composition assessment, the potential to rationalise sampling, fast turnaround involving fewer resources, finalisation of geological logs and early application of the data. Q3 can still be differentiated. A more sensitive indicator of gas desorption rate is incorporated in GeoGAS’s fast desorption method (GeoGAS Desorption Rate Index).ReferencesWilliams R.J.,1991. Carbon dioxide and methane emission at Tahmoor Colliery. Symp. on gas in Australian coals, Bambe rry and Depers Ed. Geol. Soc. Aust. Symp. Proc. 2 Uni. of NSW FebruaryWilliams R. J. , Maddocks P. I. ,Gale W.J.,1992. Longwall gas emission modelling. Symp. on Coal Bed Methane Research and Development in Australia,Townsville.Williams R.J. and Maddocks P .I . ,1993. On gas content testing and data reduction. Newdevelopments in coal geology,Coal geology group symp. Geol. Soc. Aust. Brisbane . Meany K. , Paterson L.,Stevenson M.D. , Pinczewski W.V.,1995. Advance in coal seam reservoir simulation for mine gas drainage. Int. Symp. cum Workshop on Management and Control of High Gas Emissionsand Outbursts, Wollongong.Williams R. J. and Weissman J. J. ,1995. Gas emission and outburst assessment in mixed CO2 and CH4 environments. ACIRL Underground Mining Seminar Brisbane Sept. 95. Meany K. and Paterson L.,1996. Relative permeability in coal. 1996 SPE Asia Pacific Oil and Gas Conf. , Adelaide.在长壁采煤法的提出和发展中,瓦斯含量测量数据对瓦斯突出及其危害评估的应用。