Resolution of Near-Field Microwave Target Detection and Imaging by Using Flat LHM Lens
- 格式:pdf
- 大小:602.11 KB
- 文档页数:8

专利名称:Near-field scanning microwave microscopeusing dielectric resonator发明人:Kie Jin Lee,Joo Young Kim,Hyun JunYoo,Jong Il Yang,Song Hui Kim申请号:US11116010申请日:20050427公开号:US20050246129A1公开日:20051103专利内容由知识产权出版社提供专利附图:摘要:Provided is a near-field microscope using a dielectric resonator, which makes it possible to minimize influences by external environments, and to enhance its sensitivity,resolution and function by adjusting the distance between a sample and an apex of a probe. The near-field microscope includes a wave source, a dielectric resonator, a probe, a distance adjusting unit, and a detector. The wave source generates a wave, and a frequency of the wave is adjustable by the wave source. The dielectric resonator propagates the wave from the wave source, and a resonance frequency, impedance, a Q factor and an electromagnetic wave mode of the wave is freely adjustable. The probe scans the wave output from the dielectric resonator on a sample. The distance adjusting unit measures a distance between the probe and the sample and maintains the distance to a predetermined value. The detector detects a wave that propagates through the probe, interacts with the sample and then propagates through the probe and the dielectric resonator.申请人:Kie Jin Lee,Joo Young Kim,Hyun Jun Yoo,Jong Il Yang,Song Hui Kim地址:Seoul KR,Paju-city KR,Suwon-city KR,Seoul KR,Daejeon-city KR国籍:KR,KR,KR,KR,KR更多信息请下载全文后查看。
傅里叶变换红外光谱仪英文Fourier Transform Infrared SpectrometerIntroduction:The Fourier Transform Infrared (FTIR) spectrometer is an essential tool in the field of spectroscopy. It utilizes the mathematical technique known as Fourier transform to analyze infrared light, enabling scientists to study the molecular composition and structure of various substances. In this article, we will explore the principles behind the Fourier Transform Infrared Spectrometer and its applications in scientific research.Principles of Fourier Transform Infrared Spectroscopy:Fourier Transform Infrared Spectroscopy is based on the interaction between infrared light and matter. When a substance is exposed to infrared radiation, the energy absorbed by the molecules causes them to vibrate. These vibrations are specific to each molecule and are dependent on the molecular bonds present within the substance.The spectrometer operates by passing an infrared beam through the sample and measuring the amount of light absorbed at different wavelengths. This absorption spectrum is then transformed using Fourier analysis, producing a highly detailed and accurate representation of the substance's molecular structure.Advantages of Fourier Transform Infrared Spectroscopy:1. High Speed and Sensitivity: Fourier Transform Infrared Spectroscopy offers rapid analysis times due to its ability to gather a full range ofwavelengths simultaneously. This allows for efficient data collection, making it ideal for high-throughput applications. Additionally, the technique is highly sensitive, capable of detecting even small quantities of sample material.2. Broad Analytical Range: FTIR spectroscopy covers a wide range of wavelengths, from near-infrared (NIR) to mid-infrared (MIR). This versatility enables the analysis of various substances, including organic and inorganic compounds, polymers, pharmaceuticals, and biological samples.3. Non-destructive Analysis: One of the key advantages of FTIR spectroscopy is that it is a non-destructive technique. Samples do not require any special preparation and can be analyzed directly, allowing for subsequent analysis or retesting if required.Applications of Fourier Transform Infrared Spectrometers:1. Pharmaceutical Analysis: FTIR spectroscopy plays a vital role in drug discovery and development. It is used to identify and characterize the molecular composition of active pharmaceutical ingredients (APIs), excipients, and impurities. By comparing spectra, scientists can ensure the quality and purity of pharmaceutical products.2. Environmental Analysis: Fourier Transform Infrared Spectrometers are employed in environmental monitoring to analyze air, water, and soil samples. It aids in detecting pollutants, identifying unknown substances, and assessing the impact of human activities on the environment.3. Forensic Science: FTIR spectroscopy has proven to be a valuable tool in forensic science. It assists in the analysis of various evidence, such asfibers, paints, and drugs. FTIR spectra can provide crucial information in criminal investigations, helping to identify unknown substances and link them to potential sources.4. Food and Beverage Industry: The FTIR spectrometer allows for the analysis of food quality, safety, and authenticity. It can identify contaminants, detect adulteration, and verify product labeling claims. Both raw materials and finished products can be analyzed using this technique, ensuring compliance with industry regulations.Conclusion:The Fourier Transform Infrared Spectrometer has revolutionized the field of spectroscopy by providing accurate and detailed information about a substance's molecular structure. Its speed, sensitivity, and versatility make it a crucial analytical tool in various scientific disciplines. With ongoing advancements in technology, FTIR spectroscopy continues to contribute to new discoveries and advancements in research.。
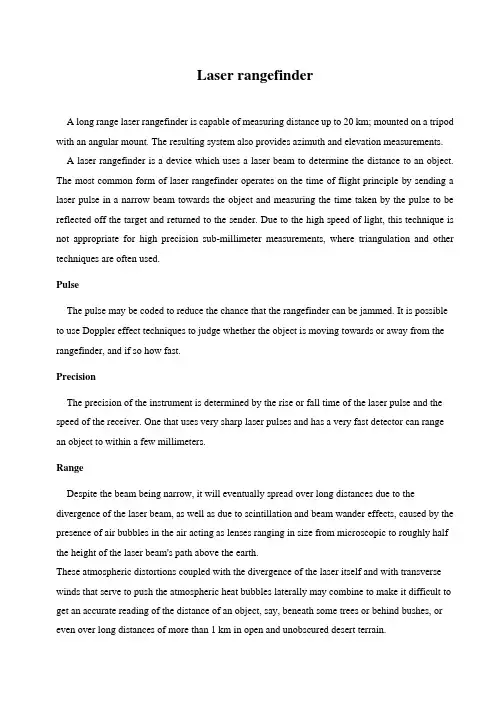
Laser rangefinderA long range laser rangefinder is capable of measuring distance up to 20 km; mounted on a tripod with an angular mount. The resulting system also provides azimuth and elevation measurements.A laser rangefinder is a device which uses a laser beam to determine the distance to an object. The most common form of laser rangefinder operates on the time of flight principle by sending a laser pulse in a narrow beam towards the object and measuring the time taken by the pulse to be reflected off the target and returned to the sender. Due to the high speed of light, this technique is not appropriate for high precision sub-millimeter measurements, where triangulation and other techniques are often used.PulseThe pulse may be coded to reduce the chance that the rangefinder can be jammed. It is possible to use Doppler effect techniques to judge whether the object is moving towards or away from the rangefinder, and if so how fast.PrecisionThe precision of the instrument is determined by the rise or fall time of the laser pulse and the speed of the receiver. One that uses very sharp laser pulses and has a very fast detector can range an object to within a few millimeters.RangeDespite the beam being narrow, it will eventually spread over long distances due to the divergence of the laser beam, as well as due to scintillation and beam wander effects, caused by the presence of air bubbles in the air acting as lenses ranging in size from microscopic to roughly half the height of the laser beam's path above the earth.These atmospheric distortions coupled with the divergence of the laser itself and with transverse winds that serve to push the atmospheric heat bubbles laterally may combine to make it difficult to get an accurate reading of the distance of an object, say, beneath some trees or behind bushes, or even over long distances of more than 1 km in open and unobscured desert terrain.Some of the laser light might reflect off leaves or branches which are closer than the object, giving an early return and a reading which is too low. Alternatively, over distances longer than 1200 ft (365 m), the target, if in proximity to the earth, may simply vanish into a mirage, caused by temperature gradients in the air in proximity to the heated surface bending the laser light. All these effects have to be taken into account.CalculationThe distance between point A and B is given byD=ct/2where c is the speed of light in the atmosphere and t is the amount of time for the round-trip between A and B.gwhere「is the delay which made by the light traveling and , is the angular frequency of optical modulation.Then substitute the values in the equation D=ct/2,D=1/2 ct=1/2 c4/m=c/(4nf) (Nn+A^)=c/4f(N+AN)=U(N+)in this equation, U stands for the unit length.A Q stands for the delay part which does not fulfill n.AN stands the decimal value.DiscriminationSome instruments are able to determine multiple returns, as above. These instruments use waveform-resolving detectors, which means they detect the amount of light returned over a certain time, usually very short. The waveform from a laser pulse that hits a tree and then the ground would have two peaks. The first peak would be the distance to the tree, and the second would be the distance to the ground.Using wavefront sensing, it is possible to determine both the closest and the farthest object at a given point. This makes it possible for aircraft-mounted instruments to see "through" dense canopies[c1arifica t ion needed Please explain how lasers see througl and10ft her semi-reflective surface such as the ocean, leading to many applications for airborne instruments such as:1.Creating "bare earth" topographic maps - removing all trees2.Creating vegetation thickness maps3.Bathymetry(measuring topography under the ocean)4.Forest firehazardTechnologiesTime of flight - this measures the time taken for a light pulse to travel to the target and back. With the speed of light known, and an accurate measurement of the time taken, the distance can be calculated. Many pulses are fired sequentially and the average response is most commonly used. This technique requires very accurate sub-nanosecond timing circuitry.Multiple frequency phase-shift - this measures the phase shift of multiple frequencies on reflection then solves some simultaneous equations to give a final measure.Interferometry - the most accurate and most useful technique for measuring changes in distance rather than absolute distances.ApplicationsMilitaryAn American soldier with a GVS-5 laser rangefinder.A Dutch ISAF sniper team displaying their Accuracy International AWSM .338 Lapua Magnum rifle and Leica/Vectronix VECTOR IV laser rangefinder binoculars.Rangefinders provide an exact distance to targets located beyond the distance of point-blank shooting to snipers and artillery. They can also be used for military reconciliation and engineering. Handheld military rangefinders operate at ranges of 2 km up to 25 km and are combined with binoculars or monoculars. When the rangefinder is equipped with a digital magnetic compass (DMC) and inclinometer it is capable of providing magnetic azimuth, inclination, and height (length) of targets. Some rangefinders can also measure a target's speed in relation to the observer. Some rangefinders have cable or wireless interfaces to enable them to transfer their measurement(s) data to other equipment like fire control computers. Some models also offer the possibility to use add-on night vision modules. Most handheld rangefinders use standard or rechargeable batteries.The more powerful models of rangefinders measure distance up to 25 km and are normally installed either on a tripod or directly on a vehicle or gun platform. In the latter case the rangefinder module is integrated with on-board thermal, night vision and daytime observation equipment. The most advanced military rangefinders can be integrated with computers.To make laser rangefinders and laser-guided weapons less useful against military targets, various military arms may have developed laser-absorbing paint for their vehicles. Regardless, some objects don't reflect laser light very well and using a laser rangefinder on them is difficult.3-D ModellingThis LIDAR scanner may be used to scan buildings, rock formations, etc., to produce a 3D model. The LIDAR can aim its laser beam in a wide range: its head rotates horizontally, a mirror flips vertically. The laser beam is used to measure the distance to the first object on its path.Laser rangefinders are used extensively in 3-D object recognition, 3-D object modelling, and a wide variety of computer vision-related fields. This technology constitutes the heart of the so-called time-of-fligh D scanners. In contrast to the military instruments described above, laser rangefinders offer high-precision scanning abilities, with either single-face or 360-degree scanning modes.A number of algorithms have been developed to merge the range data retrieved from multiple angles of a single object to produce complete 3-D models with as little error as possible. One of the advantages that laser rangefinders offer over other methods of computer vision is that the computer does not need to correlate features from two images to determine depth information as in stereoscopic methods.Laser rangefinders used in computer vision applications often have depth resolutions of tenths of millimeters or less. This can be achieved by using triangulation or refraction measurement techniques as opposed to the time of flight techniques used in LIDAR.ForestryLaser rangefinder TruPulse used for forest inventories (in combination with Field-Map technology)Special laser rangefinders are used in forestry. These devices have anti-leaf filters and work with reflectors. Laser beam reflects only from this reflector and so exact distance measurement isguaranteed. Laser rangefinders with anti-leaf filter are used for example for forest inventories.SportsLaser rangefinders may be effectively used in various sports that require precision distance measurement, such as golf, hunting, and archery. Some of the more popular manufacturers are: Opti-logic Corporation, Bushnell, LaserTechnology, Trimble, Leica, Newcon Optik, Nikon, and Swarovski Optik.Industry production processesAn important application is the use of laser Range finder technology during the automation of stock management systems and production processes in steel industry.SafetyLaser rangefinders for consumers are laser class 1 devices and therefore are considered eyesafe. Some laser rangefinders for military use exceed the laser class 1 energy levels.HistoryDevelopment of the methods used in modern printed circuit boards started early in the 20th century. In 1903, a German inventor, Albert Hanson, described flat foil conductors laminated to an insulating board, in multiple layers. Thomas Edison experimented with chemical methods of plating conductors onto linen paper in 1904. Arthur Berry in 1913 patented a print-and-etch method in Britain, and in the United States Max Schoop obtained a patent111 to flame-spray metal onto a board through a patterned mask. Charles Durcase in 1927 patented a method of electroplating circuit patterns.The Austrian Jewish engineer Paul Eisler invented the printed circuit while working in England around 1936 as part of a radio set. Around 1943 the USA began to use the technology on a large scale to make proximity fuses for use in World War II . After the war, in 1948, theUSA released the invention for commercial use. Printed circuits did not become commonplace in consumer electronics until the mid-1950s, after the Auto-Sembly process was developed by the United States Army.Before printed circuits (and for a while after their invention), point-to-point construction was used.For prototypes, or small production runs, wire wrap or turret board can be more efficient. Predating the printed circuit invention, and similar in spirit, was John Sargrove's 1936 -947 Electronic Circuit Making Equipment (ECME) which sprayed metal onto a Bakelite plastic board. The ECME could produce 3 radios per minute.During World War II, the development of the anti-aircraft proximity fuse required an electronic circuit that could withstand being fired from a gun, and could be produced in quantity. The Centralab Division of Globe Union submitted a proposal which met the requirements: a ceramic plate would be screenprinted with metallic paint for conductors and carbon material for resistors, with ceramic disc capacitors and subminiature vacuum tubes soldered in place.Originally, every electronic component had wire leads, and the PCB had holes drilled for each wire of each component. The components' leads were then passed through the holes and soldered to the PCB trace. This method of assembly is called through-hole construction. In 1949, Moe Abramson and Stanislaus F. Danko of the United States Army Signal Corps developed the Auto-Sembly process in which component leads were inserted into a copper foil interconnection pattern and dip soldered. The patent they obtained in 1956 was assigned to the U.S. Army. [4] With the development of board lamination and etching techniques, this concept evolved into the standard printed circuit board fabrication process in use today. Soldering could be done automatically by passing the board over a ripple, or wave, of molten solder in a wave-soldering machine. However, the wires and holes are wasteful since drilling holes is expensive and the protruding wires are merely cut off.In recent years, the use of surface mount parts has gained popularity as the demand for smaller electronics packaging and greater functionality has grown.References[1]M. Samules, S. Patterson, J. Eppstein, R. Fowler, Low cost handheld lidar system for automotive speed detection and law enforcement, Proc. SPIE 1633 (1992) 147-159.[2]Z.X. Jia, K. Gong, Y.J. Huo, Optoelectronic system for high-speed flier velocity measurement based on laser scattering, Opt. Eng. 48 (2009) 043601.[3]H. Surmann, A. Nuchter, J. Hertzberg, An autonomous mobile robot with a 3D laser range finder for 3D exploration and digitalization of indoor environments, Robot. Auton. Syst. 45(2003)181-198.[4]V. Sequeiraa, J. Goncalves, M. Ribeiro, 3D environment modelling using laser range sensing, Robot. Autom. 16 (1995) 81-91.[5]K. Mdtta, J. Kostamovaara, R. Myllyla, Profiling of hot surfaces by pulsed time -of- flight laser range finder techniques, Appl. Opt. 32 (1993) 5334-5347.[6]M.C. Amann, T. Bosch, M. Lescure, R. Myllyla, Laser ranging: a critical review of usual techniques for distance measurement, Opt. Eng. 40 (2001) 10-19.[7]T. Ruotsalainen, P. Palojarvi, J. Kostamovaara, A wide dynamic range receiver channel fora pulsed time-of-flight laser radar, IEEE J. Solid-State Circuits 36 (2001) 1228-1238.[8]S. Kurtti, J. Kostamovaara, An integrated optical receiver with wide-range timing discrimination characteristics, in: Proceedings 31st European Solid- State Circuits Conference, Grenoble, France, 2005, pp. 435-438.[9]J. Nissinen, I. Nissinen, J. Kostamovaara, Integrated receiver including both receiver channel and TDC for a pulsed time-of-flight laser rangefinder with cmlevel accuracy, IEEE J. Solid-State Circuits 44 (2009) 1486-1497.[10]W.M.C. Sansen, R.G. Meyer, An integrated wide-band variable-gain amplifier with maximum dynamic range, IEEE J. Solid-State Circuits 9 (1974) 159-166.[11]H. Ikeda, T. Ohshima, M. Tsunotani, T. Ichioka, T. KimuraA, An auto-gain control transimpedance amplifier with low noise and wide input dynamic range for 10-Gb/s optical communication systems, IEEE J. Solid-State Circuits 36 (2001) 1303-1308.[12]S. Yamashita, S. Ide, K. Mori, A. Hayakawa, N. Ueno, K. Tanaka, Novel cell-AGC technique for burst-mode CMOS preamplifier with wide dynamic range and high sensitivity for ATM-PON system, IEEE J. Solid-State Circuits 37 (2002) 881C886.[13]J. Nissinen, J. Kostamovaara, Laser pulser for a time-of-flight laser radar, Rev. Sci. Instrum. 68 (1997) 2253-2258.激光测距仪长距离激光测距仪测量距离可达20公里,安装在同一个角度或安装在三脚架上,所形成的系统也可测量方位角和仰角测量。

Microwave Sintering of MetalsTopics CoveredBackgroundOverviewMicrowave Heating of MetalsMicrowave vs.Conventional HeatingWhich Metals can be Microwave Sintered?Which Metals have been Microwave Sintered?Microwave Sintering DevicesPotential for Microwave Sintering of MetalsWhy does Microwave Sintering Produce better Properties compared to Conventional Processing?Microwave Sintering MechanismsBackgroundMicrowave energy has been in use for a variety of applications for over50years.Some of the early applications include communication,navigation and drying of food items.At present,industrial uses of microwaves include wood processing,vulcanisation of rubber,meat tempering,and medical therapy.In the past two decades,the remarkable success of domestic microwave ovens has revolutionised home cooking.OverviewThe use of microwaves in ceramic processing is a relatively recent development.They can be applied effectively and efficiently to heat and sinter ceramic objects.The most recent development in microwave applications is in sintering of metal powders,a surprising application,in view of the fact that bulk metals reflect microwaves. However,reflection by a metal occurs only if it is in a solid,nonporous form and is exposed to microwaves at room temperature.Metal in the form of powder will absorb microwaves at room temperature and will be heated very effectively and rapidly.This technology can be used to sinter various powder metal components,and has produced useful products ranging from small cylinders,rods,gears and automotive components in30-90min.Microwave Heating of MetalsMicrowave heating and sintering is fundamentally different from the conventional sintering,which involves radiant/resistance heating followed by transfer of thermal energy via conduction to the inside of the body being processed.Microwave heating is a volumetric heating involving conversion of electromagnetic energy into thermal energy,which is instantaneous,rapid and highly efficient.The microwave part of the electromagnetic spectrum corresponds to frequencies between300MHz and300GHz. However,most research and industrial activities involve microwaves only at2.45GHz and915MHz frequencies. Based on their microwave interaction,most materials can be classified into one of three categories-opaque, transparent and absorbers.Bulk metals are opaque to microwave and are good reflectors-this property is used in radar detection.However,powdered metals are very good absorbers of microwaves and heat up effectively, with heating rates as high as100°C min-1.Most other materials are either transparent or absorb microwaves to varying degrees at ambient temperature.The degree of microwave absorption,and consequently of heating, changes dramatically with temperature.Microwave vs.Conventional HeatingThe use of microwave energy for materials processing has major potential,and real advantages over conventional heating.These include:· Time and energy savings· Rapid heating rates· Considerably reduced processing time and temperature· Fine microstructures and hence improved mechanical properties and better product performance· Lower environmental impact.Which Metals can be Microwave Sintered?Until recently,microwave heating has been applied to sinter only oxide ceramics and semi-metals like carbides and nitrides.However,our research reveals that in powdered form,virtually all metals,alloys,and intermetallics will couple and heat efficiently and effectively in a microwave field,and their green parts will produce highly sintered bodies with improved mechanical properties.For example,in our exploratory experiments we tried two common commercial steel compositions,namely Fe-Ni-C(FN208)and Fe-Cu-C(FC208).These formed highly sintered bodies in a total cycle time of about90min at temperature range of1100-1300°C with a soaking time of 5-30min in forming gas(a mixture of N2and H2)atmosphere.Mechanical properties such as the modulus ofrupture(MOR)and hardness of microwave processed samples were significantly higher than the conventional samples-in the case of FN208,the MOR was60%higher.The densities of microwave processed samples were close to the theoretical densities,and the net shape of the green body was preserved without significant dimensional changes.Which Metals have been Microwave Sintered?Many commercial powder-metal components of various alloy compositions,including iron and steel,copper, aluminum,nickel,molybdenum,cobalt,tungsten,tungsten carbide,tin,and their alloys have been sintered using microwaves,producing essentially fully dense bodies.Figure1illustrates some of the metallurgical parts processed using microwave technology.The biggest commercial steel component that has been fully sintered in our system so far is an automotive gear of10cm in diameter and about2.5cm in height.Figure1.Metallic parts produced by microwave sintering such as gears cylinders,rods and discs. Microwave Sintering DevicesA typical microwave sintering apparatus operates at a2.45GHz frequency with power output in the range of1-6 kW.The sintering chamber consists of ceramic insulation housing(batch system)or an alumina tube insulated with ceramic insulation from outside,figure2.The primary function of the insulation is to preserve the heat generated in the workpiece.The temperatures are monitored by optical pyrometers,IR sensors and/or sheathed thermocouples placed close to the surface of the sample.The system is equipped with appropriate equipment to provide the desired sintering atmosphere,such as H2,N2,Ar,etc,and is capable of achieving temperatures up to1600°C.Figure2.Schematic of a microwave sintering furnace.The technology can be easily commercialised by scaling up the existing microwave system or designing a continuous system capable of sintering parts of various shapes and sizes.Potential for Microwave Sintering of MetalsThe implications of microwave sintering of metals are obvious in the field of powder metal technology.Metal powders are used in a diverse range of products and applications in various industries,including the automotive industry,aerospace,and heavy machinery.The challenging demands for new and improved processes and materials of high integrity for advanced engineering applications require innovation and new technologies.Finer microstructures and near-theoretical densities in special powder metal components are still elusive and widely desired.Increasing cost is also a concern of the industry.Microwave processing offers a new method to meet these demands of producing fine microstructures and better properties,and potentially at lower cost.Why does Microwave Sintering Produce better Properties compared to Conventional Processing?There are two main reasons why the microwave process yields better mechanical properties,especially in the case of powder metals-it produces a finer grain size,and the shape of the porosity,if any,is quite different than in a conventional part.In microwave-processed powder metal components,we have observed round-edged porosities producing higher ductility and toughness.Microwave Sintering MechanismsSo far,there has been little effort devoted to understanding the mechanisms and the science behind microwave sintering of metals.However,it is obvious that the microwave-metal interactions are more complex than those working actively in the field had expected.There are many factors that contribute significantly to the total microwave heating of powdered metals.The sample size and shape,the distribution of the microwave energy inside the cavity,and the magnetic field of the electromagnetic radiation are all important in the heating and sintering of powder metals.This research is just at the early stages,and it will be a long time before the exact mechanisms are elucidated.Primary author:Prof.Dinesh AgrawalSource:Materials World,Vol.7no.11pp.672-73November1999.For more information on Materials World please visit The Institute of Materials.Date Added:Oct9,2001Microwave Processing and Engineering CenterMicrowave Processing and Engineering Center106Materials Research Laboratory,The Pennsylvania State UniversityUniversity ParkPennsylvania,16802PH:1(814)865-4548Email:************Visit Microwave Processing and Engineering Center WebsitePrimary ActivityService ProviderCompany BackgroundThis center is the world’s leading institution in the study of the interaction of solid matter with microwave radiation.It has published some150+papers and patents covering a sequence of remarkable discoveries:Increasing the kinetics of all reactions involving the most important materials of modern materials science:BaTiO3;all ferrites,silicon,etc.The practice and principles of Anisothermal reactions in any multiphase systemThe physical separability of the E&H fields at microwave frequenciesThe remarkable differences between the E&H fields in interaction with matter,including...The ability to de-crystallize many of the most significant crystalline phases of material technology in a few seconds without meltingApplication of microwave energy to process metallic materialsMost of the Center support has come from two dozen companies and the Defense Dept,since its science is so “transformative”that the“peers”have yet to catch up with it!!Submission DateSeptember20,2001Sales ContactProf Dinesh AgrawalDirector。
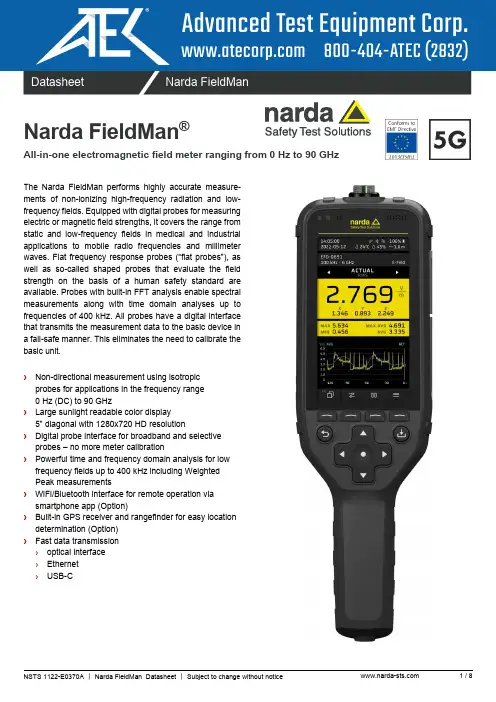
DatasheetNarda FieldManNarda FieldMan ®All-in-one electromagnetic field meter ranging from 0 Hz to 90 GHzThe Narda FieldMan performs highly accurate measure-ments of non-ionizing high-frequency radiation and low-frequency fields. Equipped with digital probes for measuring electric or magnetic field strengths, it covers the range from static and low-frequency fields in medical and industrial applications to mobile radio frequencies and millimeter waves. Flat frequency response probes (“flat probes”), as well as so-called shaped probes that evaluate the field strength on the basis of a human safety standard are available. Probes with built-in FFT analysis enable spectral measurements along with time domain analyses up to frequencies of 400 kHz. All probes have a digital interface that transmits the measurement data to the basic device in a fail-safe manner. This eliminates the need to calibrate the basic unit.›Non-directional measurement using isotropic probes for applications in the frequency range 0 Hz (DC) to 90 GHz›Large sunlight readable color display 5” diagonal with 1280x720 HD resolution›Digital probe interface for broadband and selective probes – no more meter calibration›Powerful time and frequency domain analysis for low frequency fields up to 400 kHz including Weighted Peak measurements›WiFi/Bluetooth interface for remote operation via smartphone app (Option)›Built-in GPS receiver and rangefinder for easy location determination (Option)›Fast data transmission ›optical interface ›Ethernet ›USB-CApplicationsThe Narda FieldMan is used to make precision measurements to establish human safety, particularly in workplace environments where high electric or magnetic field strengths are likely to occur. An essential task is to demonstrate compliance with generalsafety regulations, such as FCC, IEEE, ICNIRP or EMF Directive 2013/35/EU. Examples of measurement environments are:›Radiocommunication base stations (e.g. IEC / EN 62232)›Broadcasting systems (e.g. IEC 62577)›Radar and satellite communications systems ›Induction heating and melting (e.g. EN 50519)›Household appliances (e.g. IEC / EN 62233)›Electric welding equipment (e.g. IEC / EN 62822)›Railroad operations (e.g. EN 50500)›Automotive operations (e.g. IEC 62764)›Energy supply systems (e.g. IEC / EN 62110)›Electrical medical devices (e.g. IEC / EN 60601)›TEM cells and absorber chambers to demonstrate electromagnetic compatibility (EMC)Digital ProbesA large number of isotropic field probes are available for theFieldMan. All of them transmit their information and measurement data as a digital signal to the FieldMan, either via an electrical USB interface or via an optical COM interface. In this way,interference is significantly reduced compared to high-resistance analog interfaces. The specially developed screw connectors and electrical contacts are extremely robust and resilient.The probes are automatically recognized after connection to the FieldMan. Sensors inside the probe record the temperature of the measuring location and transmit it to the FieldMan display. In addition to the automatic offset correction, the temperature measurement is also used to compensate for the typicaltemperature dependency of the sensor diodes. The advantages are uninterrupted measurements without zero adjustment and higher measurement accuracy over wide temperature ranges. An automatic self-test function can even detect possible errors in the sensor system, which means that additional checking with a test generator is superfluous. Only the digital probes arecalibrated. You can continue to use your FieldMan during this time.There are probes for many different applications with theappropriate frequency and level ranges. The following table gives an overview of common areas of application.Frequency rangeDC up to1 kHzUp to400 kHzUp to400 kHz Up to 30 MHz Up to 1 GHz Up to 6 GHz Up to 40 GHz Up to 90 GHz Up to 50 GHz Field type, magnetic (H) or electric (E)H E+HHHHEEEE ShapedProbe modelsHP-01EHP-50F/G BFD-400-1 (100 cm 2) BFD-400-3 (3 cm 2) HFD-3061 HFD-0191 EFD-0391 EFD-0392 EFD-0691 EFD-0692 EFD-1891 EFD-4091 EFD-5091 EFD-6091EFD-9091EAD-5091EBD-5091ECD-5091EDD-50915G mobile radio / telecommunications Broadcast radio / TVSatellite communications RadarIndustry: Heating and temperingIndustry: Plastics weldingIndustry: Semiconductor productionMedicine: Diathermy, hyperthermyLeak locationHousehold appliances Electric welding equipmentRailroad operationsAutomotive operationsEnergy supply systems Electric medical devicesAccredited calibration includedProbe interfaceOptical connectionDigital probe interfaceFig. 1. Areas of application and suitable probe modelsUse and benefitDuring the development of the FieldMan, special attention was paid to achieving simple, well-structured and fluid operation. The arrangement of many display elements known from smartphones, the self-explanatory symbols and the FieldMan processes, which are perfectly tailored to the measurement tasks, offer maximum ease of use. The large, anti-glare HD color display shows the measured values numerically and graphically with all important additional information in a clear form and is easy to read even in bright sunlight. From simple broadband measurements to sophisticated time signal recording in real time or spectral frequency analysis of low-frequency fields, you have the right operating modes at your disposal.Measurement results can be commented on by text or voice and can be saved as a screen copy at the push of a button. Built-in sensors record the current environmental conditions as well as the position data and automatically add them to the measurement result. The built-in distance meter (option) shows you the measuring height above the ground, which makes the exact positioning of the measuring device much easier. For a better overview, the measurement results can be assigned to freely definable projects, which is particularly helpful when the measurement locations change frequently. If you want todocument your measurement results with photos and videos, the FieldMan smartphone app will help you. For example, the app wirelessly transfers media files created with the smartphone to the project directory on the FieldMan SD memory card. A newly developed, extremely powerful PC software "Narda-TSX" is available for documenting the measurement results, media and other information. It is Narda's new software platform for device configuration, measurement data evaluation and documentation, which in addition to the FieldMan will also support other Narda products in the future.Fig. 2. FieldMan display and controlsFig. 3. The FieldMan is supplied with a robust transport caseProbe connectionBrightness sensor LoudspeakerMicrophone, humidity sensor Status bar Probe information Measurement informationMeasurement isotropic Measurement single axes Statistical values Interface panelMeasurement graphic: Time curve, spectrum or bar graph Softkey symbolsSoftkeys Save key Back key Navigation keyStatus LEDDefinitions and ConditionsConditionsUnless otherwise noted, specifications apply after 30 minutes warm-up time within the specified environmental conditions. The product is within the recommended calibration cycle.Specifications with limitsThese describe product performance for the given parameter covered by warranty. Specifications with limits (shown as <, ≤, >, ≥, ±, max., min.) apply under the given conditions for the product and are tested during production, considering measurement uncertainty.Specifications without limitsThese describe product performance for the given parameter covered by warranty. Specifications without limits represent values with negligible deviations, which are ensured by design (e.g. dimensions or resolution of a setting parameter). Typical values (typ.)These characterize product performance for the given parameter that is not covered by warranty. When stated as a range or as a limit (shown as <, ≤, >, ≥, ±, max., min.), they represent the performance met by approximately 80% of the instruments. Otherwise, they represent the mean value. The measurement uncertainty is not taken into account. Nominal values (nom.)These characterize expected product performance for the given parameter that is not covered by warranty. Nominal values are verified during product development but are not tested during production. UncertaintiesThese characterize the dispersion of the values attributed to the measurands with an estimated confidence level of approximately 95%. Uncertainty is stated as the standard uncertainty multiplied by the coverage factor k=2 based on the normal distribution. The evaluation has been carried out in accordance with the rules of the “Guide to the Expression of Uncertainty in Measurement” (GUM).Specifications MetricsElectric and magnetic fieldsMeasurement control and result display for the following probes and analyzers.Frequency range and level range depending on the probe/ analyzer. Broadband probes 100 kHz to 90 GHz (see list of digital broadband probes)Selective probes 1 Hz to 400 kHz, B-field (see list of digital selective probes)Probe model EHP-50F/G 1 Hz to 400 kHz, E-field and B-field (FFT-Analyzer, see separate datasheet)Probe model HP-01 0 Hz to 1 kHz, B-field (Magnetometer/ FFT-Analyzer, see separate datasheet)Electric field units V/m, mW/cm2, W/m2, % of standard (depending on the connected probe)Magnetic field units A/m, Tesla, Gauss, mW/cm2, W/m2, % of standard (depending on the connected probe)Temperature 1Logging of the ambient temperature at the time of measurement (-40 °C to +85 °C) in °C or °F Humidity 1Logging of the ambient relative humidity at the time of measurement (0% to 100% RH)Air pressure Logging of the ambient air pressure at the time of measurement (300 to 1100 hPa)Distance (Option) An ultrasonic rangefinder on the bottom side measures the distance to ground or to an object (0.25 m to 4 m) in m, ft, in or yd. Coverage ratio ≈ Distance / 4.Geolocation (Option) Built-in GNSS receiver for determining latitude, longitude and altitude (MSL).72 channels with the support of GNSS systems (GPS / QZSS, Galileo, GLONASS, BeiDou) and the SBAS extension system (WAAS, EGNOS, MSAS, GAGAN).Position accuracy: Autonomous 2.5 m CEP.DisplayDisplay type Sunlight readable 5” color TFT-LCD anti-glare display (HD 1280 x 720 pixels) Brightness Manual control or automatic control via brightness sensorOperating languages Largely language-independent measurement control via symbols.Menu languages: English, German, more are planned.1 The permissible operating range of the device and probe must not be exceeded. The temperature sensor is located in the probe.Operating ModesMode description Field Strength Broadband field measurements. Numerical results with time curve or bar graph display.Spatial Average Procedure for spatial averaging of broadband measurements over several measurement positions. Timer Logging Time-controlled broadband measurement of the field strength in a definable period.Spectrum FFT analysis with spectrum display, marker evaluation and display of the broadband level. Shaped Time Domain Time domain assessment (WPM, WRM) with digital filtering related to a selected safety limit. Scope Triggered measurement of the field curve over time with pretrigger feature.Available modes Broadband ProbesDigital Interface100 kHz to 90 GHzSelective ProbesDigital Interface1 Hz to 400 kHzModel EHP-50F/GOptical Interface1 Hz to 400 kHzModel HP-01Optical InterfaceDC to 1 kHzField Strength ☑☑☑☑Spatial Average ☑☑☑☑Timer Logging ☑☑☑☑Spectrum ☑☑☑Shaped Time Domain ☑☑Scope ☑FeaturesProbe features Recognition Probes are automatically recognized after being plugged in.Operating principle Measurement signals are sampled and processed inside the probe and provided as digital values. Offset compensation Automatic offset compensation enables gapless RF measurements without zero adjustment.Self-test Functional test including the sensor function of each measuring axis for digital interface probes.Signal detection RMS detection, Peak detection for WPM measurementsand selectable detection RMS/Peak with BDF-400 probes.Numerical display Total field (isotropic) and field components X, Y, Z (for probes up to 18 GHz).Result types Field Strength Actual, Max, Min, Avg (average) and Max Avg Spectrum Actual or Max or AvgShaped Time Domain Actual, Max and MinScope Actual, Max and marker for dB/dtAverage mode Moving average over time of the square values of the field strength.Averaging time Field Strength,Timer Logging 1 s, 3 s, 10 s, 30 s, 1 min, 3 min, 6 min, 10 min, 30 min, 1 h, 6 h, or 24 h Spectrum 4, 8, 16, 32 or 64 number of averagesGraphical display with marker function Field Strength Actual and Avg trace vs. time, time span selectable from 48 s to 24 hours.Spatial Average Bar graph of results for each measurement position (≤100) and the spatial average line. Timer Logging Timeline during measurement, results as a graph vs. time after measurement.Spectrum Frequency spectrum and selectable limit line. All axes are measured, one can be displayed. Shaped Time Domain Exposure index (WPM or WRM) in % vs. time, time span selectable from 4 min to 24 h. Scope Sign-based recorded signal with 25 % pretrigger. Recording time selectable from 1 ms to 30 s.Screenshots Manually initiated screenshot or automatically when saving a measurement result.Comments Voice and/or text comments can be assigned to a measurement result.Alarm Alarm sound and alarm message when an adjustable field strength is exceeded.Audible field indicator Acoustic hotspot search with field strength-dependent audio frequency (available for RF-probes).Scheduled measurements Mode Timer Logging with automatic wake-up and shutdown after measurement. Start time pre-selection: up to 24 h or immediate startTimer duration: up to 100 hStorage interval: 1s to 6 min (in 11 steps, up to 32000 intervals)Correction factors Post-processing for broadband probes to increase the accuracy at a known field frequency(direct frequency entry, interpolation between calibration points)Probe interface Digital probe interface for direct connection or via the optional extension cable.Optical port Serial, full duplex, ≥ 1 Mbit/s, to connect the Field Analyzer EHP-50F/G, the Magnetometer HP-01or the Digital Probe Repeater. Recommended interface for PC controlled measurements.USB 2.0 USB-C connection for battery charging, remote control and data transfer.Ethernet Gigabit Ethernet LAN connectivity for remote control and data transfer.Bluetooth (Option) BT 4.0 for remote control via smartphone app (Android).WiFi (Option) WLAN connectivity for remote control and data transfer.AUX MMCX connector, reserved for future use.Result StorageStorage triggers Manual (by keypress) or scheduled (Timer Logging Mode).Storage medium Removable micro SD card for storing measurement data, setups and comments.Storage capacity Up to 128 GB.16 GB micro SD card included.Screenshots Screenshots can be saved for documentation as PNG files.Voice recorder Voice comments can be added to measurement results (recording and playback).Text editor Text comments can be added to measurement results (integrated virtual keyboard).Photos / videos (WiFi/BT Option) Photos and videos from a smartphone can be transferred to the device using the FieldMan app.Printouts (WiFi/BT Option) Saved measurement results can be printed locally by using the FieldMan Android app for on-sitedocumentation (requires a compatible wireless printer).General SpecificationsRecommended calibration interval Calibration of the basic unit is not required. Only the probes are calibrated.Power supply internal Li-Ion rechargeable battery pack, included and replaceable external USB-C PD (maximum 12 V / 3A, compatible with BC1.2 and QC 3.0)Operating time (nom.) 16 hours (with broadband probes and analyzers)Charging time (nom.) 4 hours (80% charged in 2½ h)RF Immunity 200 V/m (100 kHz to 60 GHz); can be below the permissible measuring range of a probe. Operation in static magnetic fields ≤ 30 mT (to avoid high force on the device)Dimensions (H x W x D) 51 mm x 93 mm x 312 mm without probeWeight 695 g (without probe)Country of origin GermanyEnvironmental ConditionsRange of application Suitable for outdoor use and an operating altitude of up to 5000 mOperating temperature -20 °C to +50 °C during normal operation with battery0 °C to 40 °C during the charging process with an external chargerHumidity < 29 g/m³ (< 93 % RH at +30 °C), non-condensingIngress protection IP54 (probe screwed on, protective flap closed, stand folded in)Climatic conditions Storage 1K4 (IEC 60721-3) extended to -30 °C to +70 °C (battery removed)1K3 (IEC 60721-3) extended to -20 °C to +50 °C (battery inserted) Transport 2K3 (IEC 60721-3) extended to -30 °C to +70° COperating 7K2 (IEC 60721-3) extended to -20 °C to +50 °CMechanical conditions Storage 1M3 (IEC 60721-3) Transport 2M3 (IEC 60721-3) Operating 7M3 (IEC 60721-3)EMC European Union Complies with Directive 2014/53/EU, EN 301489-1, EN 301489-17 and EN 61326 -1 Immunity IEC/EN: 61000-4-2, 61000-4-3, 61000-4-4, 61000-4-5, 61000-4-6, 61000-4-8, 61000-4-11 Emissions IEC/EN: 61000-3-2, 61000-3-3, IEC/EN 55011 (CISPR 11) Class BSafety Complies with European Low Voltage Directive 2014/35/EU and IEC/EN 61010-1 Material Complies with European RoHS Directive 2011/65/EU and (EU)2015/863ORDERING INFORMATIONInstrument SetsDescription Part number FieldMan Basic Set-Probes are not included –Includes:›FieldMan Basic Unit›Hard Case for FieldMan and up to 5 Probes ›Power Supply USB-C PD, AU/EU/UK/US Plugs ›Cable, 2x USB-C(M), 3 A, 2 m›Shoulder Strap, 1 m ›Marking Rings for FieldMan Probes›Quick Start Guide›Safety Instructions›USB Stick: Manuals and Documents›Software Narda-TSX (free download)2460/101Digital Broadband ProbesDescription Part number Probe HFD-3061, H-Field, 300 kHz–30 MHz 2462/05 Probe HFD-0191, H-Field, 27 MHz–1 GHz 2462/06 Probe EFD-0391, E-Field, 100 kHz–3 GHz 2462/01 Probe EFD-0392, E-Field, High Power, 100 kHz–3 GHz 2462/12 Probe EFD-0691, E-Field, 100 kHz–6 GHz 2462/14 Probe EFD-0692, E-Field, 600 MHz–6 GHz 2462/20 Probe EFD-1891, E-Field, up to 18 GHz2462/02 Probe EFD-4091, E-Field, up to 40 GHz 2462/19 Probe EFD-5091, E-Field, 300 MHz–50 GHz, Thermocouple2462/03 Probe EFD-6091, E-Field, 100 MHz–60 GHz2462/17 Probe EFD-9091, E-Field, 100 MHz–90 GHz2462/18 Probe EAD-5091, FCC 1997 Controlled, Shaped, 300 kHz–50 GHz, E-Field 2462/07 Probe EBD-5091, IEEE 2019 Restricted, Shaped, 3 MHz–50 GHz, E-Field 2462/21 Probe ECD-5091, SC 6 2015 Controlled, Shaped, 300 kHz–50 GHz, E-Field 2462/16 Probe EDD-5091, ICNIRP 2020 Occ, Shaped, 300 kHz–50 GHz, E-Field 2462/22 Note: Separate data sheets are available for the probesDigital Selective ProbesDescription Part number Probe BFD-400-1, B-Field, 100 cm2, 1 Hz–400 kHz, selective 2463/01 Probe BFD-400-3, B-Field, 3 cm2, 1 Hz–400 kHz, selective2463/02 Note: Separate data sheets are available for the probesField AnalyzersDescription Part number EHP-50F E&H Field Analyzer Set, 1 Hz–400 kHz (no Transport Case included) 2404/105 EHP-50F E&H Field Analyzer Set, 1 Hz–400 kHz, Stand-alone/PC use 2404/104 HP-01 Magnetometer Set DC–1 kHz 2405/101OptionsDescription Part number Option, Narda-TSX Live Measurements, for FieldMan Digital Probes (expected from Q3 2023) 2460/95.01 Option, GPS/ Range Finder for FieldMan 2460/95.11 Option, WiFi/ Bluetooth for FieldMan (expected from Q4 2023) 2460/95.12AccessoriesDescription Part number Digital Broadband Probe Repeater 2464/01 Test-Generator 27 MHz 2244/90.38 Tripod, Non-Conductive, 1.65 m, with Carrying Bag 2244/90.31 Tripod, Benchtop, 0.16 m, Non-Conductive 2244/90.32 Tripod Extension, 0.50 m, Non-Conductive (for 2244/90.31) 2244/90.45 Handle, Non-Conductive, 0.42 m 2250/92.02 Car Charger Adapter, USB-C PD 2259/92.28 Cable, Digital Probe Extension, 2 m 2460/90.02 Cable, Digital Probe to USB 2.0 (Type A), 3 m 2460/90.03 Cable, FO Duplex (1000 µm) RP-02, 2 m 2260/91.02 Cable, FO Duplex (1000 µm) RP-02, 5 m 2260/91.09 Cable, FO Duplex (1000 µm) RP-02, 10 m 2260/91.07 Cable, FO Duplex (1000 µm) RP-02, 20 m 2260/91.03 Cable, FO Duplex (1000 µm) RP-02, 50 m 2260/91.04 Cable, FO Duplex, F-SMA to RP-02, 0.3 m 2260/91.01 O/E Converter RS232, RP-02/DB9 2260/90.06 O/E Converter USB, RP-02/USB 2260/90.07 Cable, Adapter USB 2.0 - RS232, 0.8 m 2260/90.53Narda Safety Test Solutions GmbH Sandwiesenstrasse 772793 Pfullingen, GermanyPhone +49 7121 97 32 0****************** Narda Safety Test SolutionsNorth America Representative Office435 Moreland RoadHauppauge, NY11788, USAPhone +1 631 231 1700******************Narda Safety Test Solutions S.r.l.Via Benessea 29/B17035 Cisano sul Neva, ItalyPhone +39 0182 58641****************************Narda Safety Test Solutions GmbHBeijing Representative OfficeXiyuan Hotel, No. 1 Sanlihe Road, Haidian100044 Beijing, ChinaPhone +86 10 6830 5870********************® Names and Logo are registered trademarks of Narda Safety Test Solutions GmbH - Trade names are trademarks of the owners.。

感应近场测试英语
【原创实用版】
目录
1.感应近场测试的概述
2.感应近场测试的应用领域
3.感应近场测试的英语表达
4.感应近场测试的实例分析
正文
感应近场测试是一种用于测量电磁场中近场区域的技术,其英文表述为“near-field sensing”。
近场指的是距离电磁场源较近的区域,一般而言,距离源小于波长的区域可视为近场。
感应近场测试在众多领域中都有着广泛的应用,如通信、雷达、无线充电等。
在英语中,与感应近场测试相关的词汇还包括“near-field measurement”、“near-field scanning”和“near-field probing”等。
这些词汇描述了在近场区域进行测量、扫描和探查的方法和技术。
举个实例来说明感应近场测试的应用。
在无线通信领域,感应近场测试可用于评估手机等移动设备的天线性能。
通过测量近场区域的电磁场分布,可以得到设备的天线方向图和天线增益等信息。
这些信息对于优化无线通信系统的性能至关重要。
总之,感应近场测试作为一种测量电磁场中近场区域的技术,在多个领域中都有着广泛的应用。
第1页共1页。
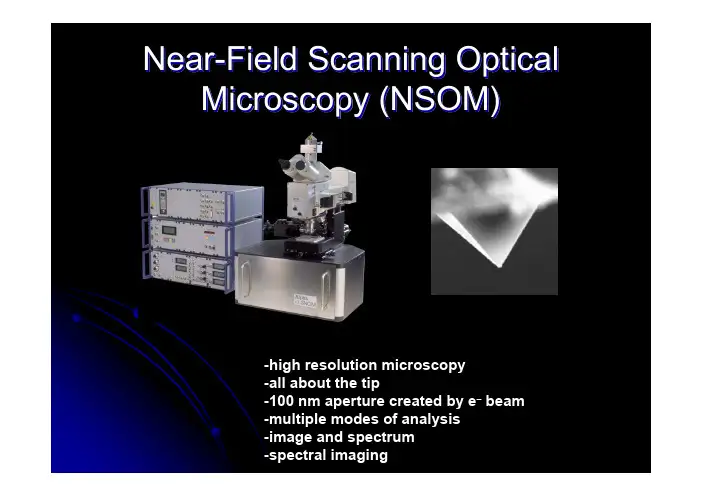
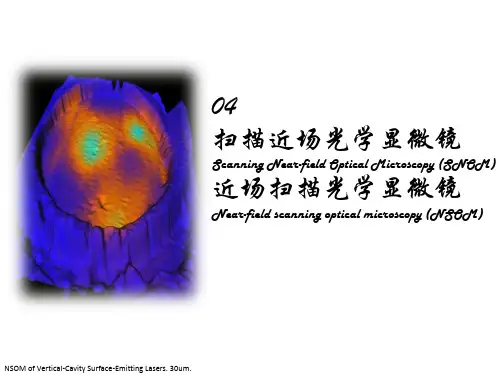
Near-Field Scanning Optical Near-Field Scanning Optical Microscopy (NSOM)-high resolution microscopy-all about the tip-100 nm aperture created by e–beam-multiple modes of analysis-image and spectrum-spectral imagingaperture < wavelength near-fieldtapered optical fibernear-fieldBasic Principle of NSOM ¾normally diffraction limited in far field imaging, i.e., cannot image smaller then wavelength of light used for imaging¾resolution limit between objects in a light microscope: d > λ/ (2sinθ), giving best case resolution of ½excitation wavelength¾with aperture of NSOM, image in near field can get resolution of < 50 nm¾Light through sub-wavelength diameteraperture and illuminates a sample that is placedwithin its near field¾distance to sample is much less than thewavelength of the light¾resolution achieved is far better than that whichconventional optical microscopes can attainBasic Principle of NSOM—cont’d Basic Principle of NSOM—cont’daperture Problems-not reproducible manufacturing process-low optical throughput-shear-force distance control-very fragileNSOM Tip Production —pulled fiber-hollow SiO2tip with aluminium coating-light is focussed from the backside into tip-beam deflection feedback—microfabricated cantilever-aperture diameter < 100 nmAdvantages-batch process-reproducible-different aperture sizes possible-very reliable-beam deflection feedback-easy to use (soft in z-direction)-high transmission coefficient—microfabricated cantileverNSOM Schematicend-capNSOM Cantilever Sensortop video view bottom video viewTransmission NSOMcolor labeled with toluidine blue 532 nm excitationSamples courtesy of Prof.Dr.Shohei Yamashina, Departement of Anatomy, Kitasato University, Japan 25 µmTopography Transmission NSOM Transmission NSOM-Zoom25 µm N = Nucleus Nc = Nucleolus Ec =Euchromatin Hc = Heterochromatin Mn =Nuclear membraneWITec Wissenschaftliche Instrumente und Technologie GmbH, D-89081 Ulm, Germany, Hörvelsinger Weg 6,fon 0700 94832 366,www.WITec.de, info@WITec.de. All rights reserved.Biosensing with NSOMHistological microtome cuts of rat liverN = NucleusEr = ErythrocyteC = CapillaryBA = Blood-Air-BarriereLa = Lung alveole5 µm1 µm5 µm ErErBAAmN LaCA = Axoplasma with Neurotubuli andNeurofilamentsM = Myelinated axonMl = Less-myelinated axonEn = Endoneurium (loosen connective2 µm Zy Nc NZy I I1 µm 1 µm 5 µmMMMlMl En En S AThe chromosomes exist of twochromatides (1+2), tied together at thecineotocher (C).Helical DNA is visible in the darkareas (H).1 µm CH121 µm2 µm2 µm2 µm25 µm x 25 µmSamples courtesy of Prof. Dr. Shohei Yamashina, DepartementHistological microtome cut of rat liver imaged in liquidcolor labeled with toluidine blue 532 nm excitation 2 µmHNSINcHB BSamples courtesy of H. Schmid, University of Ulm, GermanyOther Applications of NSOM200 nm200 nm2-phase polymer mixture for LED applications Fluorescence NSOM Topography5µm1 µmexcitation: λ=457nmdetection λ>490nmSample: U Cambridge, UK, excitation 488 nm.TopographyFluorescence10 microns scan rangeSpectral NSOMPolymer Mixture for Display Technology2 µmH.Aoki and S.Ito, Departement of Polymer Chemistry, Kyoto University, JapanB BCC12 x 12 µmBCCH.Aoki and S.Ito, Departement of Polymer Chemistry,Kyoto University, Japan1 x 1 µm500 x 500 nm21 nm FWHM100 nmF. Vargas,G. Tarrach, Universidad de Chile, and G. de Schaetzen, University of Leuven1 micron 1 micronAl test sample, 450 nm latex spheres2 µm20 micronsDNA dropletexcitation: 488 nm,detection:fluorescenceλ> 590 nm,Reflection NSOM5 micron 1 micron 1 micronReflection NSOMCompact Disk Topography Reflection NSOM1 µm1 µmVertical cavity surface emitting lasers -VCSELNSOM830,25nm21000Background829,53nm60000 145000 280000 210000 140000 800000 130000 610000 180000 80000 1200015 microns scan rangeA view from Nanoworld。
微波反射技术的英文表达Title: Microwave Reflection Technology: Bridging the Gap Between Theory and ApplicationMicrowave reflection technology, a cornerstone in the field of electromagnetic engineering, plays a pivotal role in modern communication systems and radar technology. This essay delves into the core principles of microwave reflection, its diverse applications, and the challenges it presents to researchers and engineers.At the heart of microwave reflection technology lies the concept of electromagnetic wave reflection. When microwaves encounter a surface, a portion of the energy is reflected back, while the rest is absorbed or transmitted. The behavior of these reflected waves is governed by the laws of physics, particularly the Fresnel equations, which describe the reflection and transmission coefficients at the interface between two media.The reflection coefficient, denoted by Γ, is a complex number that quantifies how much of the incident wave is reflected. It depends on the properties of the media, such as the dielectric constant and conductivity, as well as the angle ofincidence and the polarization of the wave. Understanding and manipulating these variables is crucial for optimizing the performance of microwave systems.The applications of microwave reflection technology span various domains, each leveraging its unique properties to solve complex problems.Radar Technology: Radar systems, which rely on microwave reflection for object detection, have been revolutionized by the ability to analyze reflected signals. By measuring the phase and amplitude of the reflected signals, radar can accurately determine the position, velocity, and even the shape of distant objects, making it indispensable in military, meteorological, and civilian navigation applications Microwave Imaging: In medical diagnostics, microwave reflection is used in imaging technologies such as microwave tomography and radar imaging. These systems can detect anomalies in the human body by analyzing the reflected microwave signals, offering a non-invasive alternative toX-rays.Quality Control in Manufacturing: In industries that require non-destructive testing, microwave reflection is used to inspect materials for defects and ensure quality. Thetechnology can detect changes in the material's properties, such as moisture content and density, without causing damage.Despite its widespread applications, microwave reflection technology faces significant challenges that hinder its full potential. These include the complexity of designing systems that can efficiently manipulate microwave signals, the need for accurate models to predict wave behavior in complex environments, and the integration of microwave technology into emerging fields such as 5G communications and quantum computing.Future advancements in microwave reflection technology will likely focus on miniaturization, integration with other technologies, and the development of intelligent systems capable of dynamic adaptation to changing conditions. Research into new materials and manufacturing techniques will also play a critical role in overcoming current limitations and expanding the capabilities of microwave systems.In conclusion, microwave reflection technology, with its foundational principles and broad applications, is a vital area of research and development. As we continue to push the boundaries of what is possible, the future of microwavereflection technology promises to be as exciting as it is transformative.。
汉英词汇索引B白光散斑照相测量术white light speckle photography白光信息处理Write light information processing曝光exposure曝光时间exposure time本征函数characteristic function边端性质terminal property变形反射镜器件Deformable Mirror Devices(DMD)边缘全息edge-lit holograms表面形变空间光调制器Deformable Surface Spatial Light Modulator 标量衍射scalar diffraction波长复用wavelength multiplexing波长选择性wavelength selectivity波前记录Wavefront recording波前再现Wavefront reconstruction布喇格角Bragg angle布喇格失配参量Bragg-mismatch parameter布喇格条件Bragg conditionC参考光束Reference beam参物比light intensity ratio of reference to objective持续光谱烧孔persistent spectral hole-burning抽样定理sampling theorem抽样函数sampled function传递函数transfer function相干传递函数coherent transfer function,非相干传递函数incoherent transfer function串扰噪音cross-talk noise磁光空间光调制器Magnetic-Optical Spatial Light Modulator存储容量storage capacityD等效波长equivalent wavelength电编址Electrically Addressed电光效应electro-optic effect电荷耦合器件Charge-Coupled-Device(CCD)点扩散函数point spread function电子散斑干涉electronic speckle interferometry叠加积分superposition integral定影fix动态范围参量dynamic-range parameter对比度contrast读出光Read out Light多量子阱Multiple Quantum Well(MQW)E二次曝光全息干涉术duoble exposure holographic interferometry 二次散斑场secondary speckle fieldF法拉第效应Faraday Effect放大率magnification范西特-泽尼克定理Van Cittert-zernike theorem菲涅耳近似Fresnel approximation菲涅耳衍射公式Fresnel diffraction formula飞行时间法time of flight分辨率resolution分块全息存储block-oriented holographic storage分数傅里叶变换fractional Fourier transform分数傅里叶变换阶order of fractional Fourier transform分数傅里叶谱fractional Fourier spectrum傅里叶变换Fourier transform傅里叶变换轮廓术Fourier Transform Profilometry(FTP) 复合光栅Multi-grating夫琅和费近似Fraunhofer approximation夫琅和费衍射公式Fraunhofer diffraction formula复振幅complex amplitudeG( 值 film gamma各态历经性ergodicity,共轭像Conjugate image共同体积复用common-volume multiplexing光编址Optically Addressed光波耦合wave coupling光刀light knife光导热塑Photothemoplastic光分束器Beam splitter光功率谱密度power spectral density of the light beam 光计算Optical Computing光漫射器Optical diffuser光密度photographic density光栅矢量grating vector光栅相移grating phase shift光瞳pupil出瞳exit pupil入瞳entrance pupil光瞳函数pupil function广义光瞳函数generalized pupil function光学传递函数optical transfer function(OTF)调制传递函数modulation transfer function(MTF)相位传递函数phase transfer function(PTF)部分相干传递函数partial-coherent transfer function光学粗糙表面optical rough surface光学互连Optical Interconnection光学矩阵运算Optical Matrix光学神经网络Optical Neural Network光学图像识别Optical pattern recognition光学微分Optical differentiation光学信息处理Optical information processing相干光学信息处理Coherence Optical information processing非相干光学信息处理incoherence Optical information processing 光折变晶体Photorefractive crystal光折变效应photorefractive effect光致聚合物Photopolymer光致抗蚀剂Photoresist关联存储器associative memoryHH-D曲线 Hurter-Driffield curve灰雾 gross fog混合场效应hybrid field effect互谱密度函数cross-spectral density functionJ剪切散斑干涉术shearing speckle interferometry假彩色编码Pseudocolor coding夹层全息术sandwich holography角度复用angle multiplexing角度选择性angular selectivity角谱angular spectrum结构照明structured illumination基尔霍夫公式Kirchhoff formula解析信号 analytic signal截止频率cutoff frequency激光片光 laser sheet激光散斑laser speckle激光三角法Laser triangulation机器视觉machine vision,级联系统cascade system,基元函数elementary function,基元全息图 elementary hologramK克尔效应Kerr Effect亥姆霍兹方程Helmholtz equation空间不变线性系统 space-invariant linear system空间带宽积space-bandwidth product空间复用spatial multiplexing空间光调制器Spatial Light Modulator(SLM)空间滤波器Spatial filter空间频率spatial frequency空间频谱spatial frequency spectrum归一化频谱normalized frequency spectrum像强度频谱frequency spectrum of image intensity空间位相检测spatial phase detection空域函数spatial function,L量子限制斯塔克效应Quantum Restricted Stark Effect(QRSE) 灵敏度矢量sensitivity vecto卤化银乳胶Silver halide emulsion滤波函数filtering functionM脉冲响应impulse response莫尔轮廓术moiré topographyN奈奎斯特抽样间隔Nyquist sampling spacing内容寻址的存储器content-addressable memory逆滤波器Inverse filter铌酸锂lithium niobateP平稳性stationary频谱混叠 spectral overlapping匹配滤波器Matched filter普克尔斯读出光调制器---Pockels Readout Optical Modulator (PROM) 普克尔斯效应---Pockels EffectQ强度脉冲响应intensity impulse response强度自相关函数intensity autocorrelation finction全场滤波whole field filtering全息存储holographic storage全息电影holographic movie全息光学元件Holographic Optical Element全息记录介质Holographic recording media全息术Holography计算全息术Computer Generated Holography视频全息video holography合成全息术synthetic holography全息图Hologram彩虹全息图rainbow hologram彩色全息图color hologram反射全息图Reflection Hologram菲涅耳全息图Fresnel hologram夫琅和费全息图Fraunhofer hologram傅里叶变换全息图Fourier transform hologram离轴全息图Off-axis hologram模压全息图embossing hologram平面全息图Plane Hologram体积全息图Volume Hologram体视全息图holographic stereograms透射全息图Transmission Hologram位相全息图Phase hologram无透镜傅里叶变换全息图Lensless Fourier transform hologram 像(面)全息图Image plane hologram振幅全息图Amplitude hologram全息--散斑干涉术holo-speckle interferometry全息象差holographic abberrations全息注塑holograms formed by injectingR瑞利分辨判据Rayleigh criterion of resolution,S散斑场speckle field客观散斑场objective speckle field主观散斑场subjective speckle field散斑干涉术speckle interferometry散斑照相测量术speckle photography散射基元scattering element三维传感three-dimensional sensing被动三维传感passive three-dimensional sensing主动三维传感 active three-dimensional sensing三维面形测量 three-dimensional shape measurement三维显示three-dimensional display色模糊color blur色散dispersion时间平均time average时间平均全息干涉术time-average holographic interferometry实像real image实物仿形 solid modeling双光子吸收bi-photon absorption双目视觉 binocular vision数据传输速率data transfer rate顺序曝光sequential exposure数字散斑干涉术digital speckle interferometry数字散斑照相术digital speckle photography数字微反射镜器件Digital Micromirror Device(DMD)数字象素全息 digital pixel holograms调制Theta modulation倏逝波evanescent wave,T同步扫描 synchronized scanning调制度测量轮廓术modulation measurement profilometry (MMP)铁电液晶ferroelectric liquid crystal体光栅volume grating透镜的位相变换phase transformation of lens,透射率Transmittance图象传感器image sensor图像消模糊Image deblurringW外差全息干涉术heterodyne holographic interferometry完善洗牌Perfect Shuffle微分滤波器Differential filter微通道板Microchannel Plate (MCP)微通道板空间光调制器Microchannel Spatial Light Modulator(MSLM) 位相编码复用phase-encoding multiplexing位相测量剖面术Phase Measuring Profilometry(PMP)位相共轭phase conjugation位相展开phase unwrapping物光束Object beamX限带函数bandlimited function限幅散斑技术clipped speckle technique像素pixel信息流量throughput线模糊blur caused by extended light sources线全息图slit holograms线性性质linear property相干性coherence复相干度complex degree of mutual coherence复相干因子complex coherence factor of the light复自相干度complex degree of self coherence互强度mutual intensity互相干函数mutual coherence function空间相干性spatial coherence时间相干性temporal coherence相干长度coherence length相干面积coherence area相干时间coherence time自相干函数self coherence function相关分析方法correlation analysis相移phase-shifting步进相移stepping phase shifting连续相移continue phase shifting相移全息干涉术phase shifting holographic interferometry 显影development写入光Write Light信噪比signal-noise ratio系综平均statistical average,虚像virtual imageY赝像Pseudoscopic image衍射diffraction,近场衍射near-field diffraction,远场衍射far-field diffraction,衍射孔径diffraction aperture,衍射受限diffraction-limited,衍射效率Diffraction Efficiency液晶光阀Liquid Crystal Light Valve原始像Original image圆型复高斯随机变量circular complex Gaussian random variable Z增量曝光incremental exposure子波干涉wavelet interference自泵浦相位共轭镜self-pumped phase-conjugate mirror针孔滤波器Pinhole filter正弦光栅 sinusoidal grating折射率调制度refractive index modulation指向矢orientation vector重铬酸明胶Dichromated gelatin逐点滤波pointwise filtering准单色条件quasimonochromatic conditions准外差全息干涉术quasi- heterodyne holographic interferometry 着陆台landing pads自电光效应器件Self-Electro-optical Effect Devices(SEED)综合孔径雷达Synthetic Aperture Radar组页器page composer。
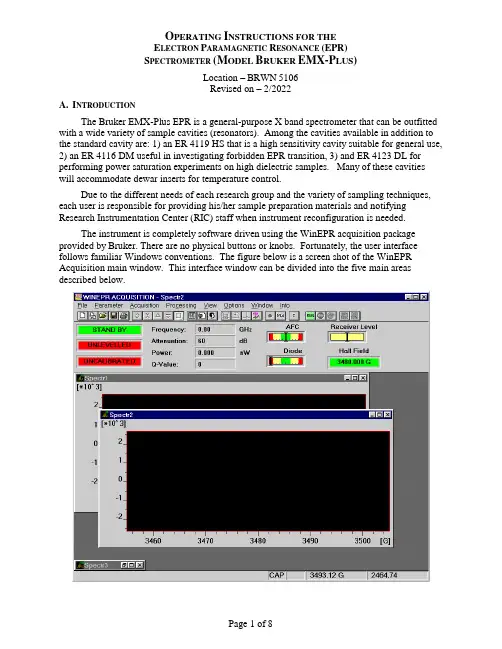
O PERATING I NSTRUCTIONS FOR THEE LECTRON P ARAMAGNETIC R ESONANCE (EPR)S PECTROMETER(M ODEL B RUKER EMX-P LUS)Location –BRWN5106Revised on – 2/2022A.I NTRODUCTIONThe Bruker EMX-Plus EPR is a general-purpose X band spectrometer that can be outfitted with a wide variety of sample cavities (resonators). Among the cavities available in addition to the standard cavity are: 1) an ER 4119 HS that is a high sensitivity cavity suitable for general use, 2) an ER 4116 DM useful in investigating forbidden EPR transition, 3) and ER 4123 DL for performing power saturation experiments on high dielectric samples. Many of these cavities will accommodate dewar inserts for temperature control.Due to the different needs of each research group and the variety of sampling techniques, each user is responsible for providing his/her sample preparation materials and notifying Research Instrumentation Center (RIC) staff when instrument reconfiguration is needed.The instrument is completely software driven using the WinEPR acquisition package provided by Bruker. There are no physical buttons or knobs. Fortunately, the user interface follows familiar Windows conventions. The figure below is a screen shot of the WinEPR Acquisition main window. This interface window can be divided into the five main areas described below.Menu Bar – Like all Windows programs, there is a Menu Bar at the top of the window used to access all other program features. All of the features listed in the other areas of the interface are directly accessible via the menu bar.Button Bar – This bar is located just below the Menu and can be toggled visible/invisible using the View option in the Menu bar. It is highly recommended to leave it visible since all spectrometer functions needed for data acquisitions are most easily accessed from the tool pallet. The table below shows each icon and lists its “tip strip”. The specif ic functions of many are discussed in the relevant sections below.New Spectrum Duplicate Spectrum Open Spectrum Save Spectrum Print Spectrum ExperimentalParametersExperimental OptionsComment ParametersRun / Stop ScriptRun AcquisitionStop AcquisitionStop Acquisition atEnd ScanTimes 2 Divide by 2 Expand Contract Change Center Fieldand Sweep WidthChange Center FieldChange Static FieldInteractive ReceiverLevelSend Spectrum toWinEPRSend Spectrum toSimfoniaReset Display Rectangular Zooming Cursor Moving Microwave Fine Tune Microwave Bridge ControlInteractive Spectrometer ControlInstrument Monitor – This area is located just below the Button Bar and shows the status of the microwave bridge and signal channel. The displays can be toggled visible/invisible by using the View option in the Menu bar.Data Area – This area fills the center of the screen and is populated by various windows. The windows can be any combination of spectra, parameters, and instrument control windows. Status Line – This is located at the bottom of the window and displays current instrument status and messages.B.O PERATION:S TARTUPFollow the procedure below to insure proper instrument operation. Although spectra can be obtained immediately after startup, waiting at least an hour for the magnet and electronic components to thermally stabilize before taking spectra is recommended.EMX S TARTUP1.Nitrogen Purge – Open the gas supply valve on the liquid nitrogen dewar. This will purgethe EPR cavity, waveguide, and microwave bridge of water vapor which absorbsmicrowave energy and oxygen which gives a signal since it is paramagnetic2.Cooling water – Open the two chilled water valves on the wall to the right of the computerdesk.3.Heat Exchanger –Use the rotary switch labeled “Heat Exchanger” located on the controlbox above the water filter. Be careful to not mistakenly push the Main power button.4.Magnet power supply – The magnet power supply not only controls current in the electromagnet but powers the console and microwave bridge as well. It is powered on in atwo-step process as detailed below.a.Press the ELECT. ON (Electronics) button in far left, upper corner. Wait for the fivered LED-warning lights on far right to extinguish before continuing. If the LEDs donot extinguish, confirm that the cooling water is on and repeat this step.b.Press POWER ON, which is located to the immediate right of the ELECT. ON switch.5.Console Power – Press the round button located in the lower, center of the cabinet. Thisalso provides power for the Microwave Bridge located on the top, left corner of the shelf above the electro magnet. The console houses: 1) Signal Channel – A phase sensitivedetector measuring the EPR signal by comparison with a signal of known frequency.2) Magnetic Field Controller – Controls both the magnitude and sweep rate of themagnetic field during a scan. 3) Modulation Amplifier – This unit provides the modulated reference signal for detection in the signal channel.NOTE –The console houses ~$150,000 of electronics.DO NOT set samples or your coffee on itC OMPUTER L OGONThe computer is usually left on and can be awakened by pressing any key on the keyboard. If the screen does not respond within 30 seconds of pressing a key, press the power button on the front of the case. At the Logon prompt e nter your “User Name” and “Password”. The “Domain” entry should be set to BoilerAD.Once logged on, WinEPR shortcuts are visible in the upper right-hand corner of the desktop. “WinEPR Acquisition” is the application used to run the spectrometer and obtain data. “WinEPR Processing” and “WinEPR SimFonia” are for analysis and simulation, respectively. This training document focuses only on the acquisition software and basic instrument operation.Launch the WinEPR Acquisition by double clicking its icon. It takes about 90 seconds for the software to fully launch. Once the window opens, click the Interactive Spectrometer Control button and click the “Calibrated” check box in the upper right of the window that opens.C. O PERATION:L OADING S AMPLESInserting / Changing Samples(Room Temperature)1.If the Microwave Bridge Controller window is not open, click on the Microwave Bridgebutton on the tool bar.2.Select the STANDBY or TUNE mode. See the image below.3.To avoid contaminating the cavity, clean the outside of the sample tube with a ChemWipe.4.Center the sample tube in the collet (loosen the collet ring if necessary) and gently slide itdown until either the sample is centered in the cavity or the tube is resting on the pedestal.Tighten the collet ring just enough to prevent the sample tube from moving.(Helium Variable temperature)1.If the Microwave Bridge Controller window is not open, click on the Microwave Bridgebutton on the tool bar.2.Select the STANDBY or TUNE mode. See the image below.3.Position the sample tube in the top-hat using the cavity gauge drawing to center the samplein the cavity. Tighten the top-hat ring so that the sample tube is snug.Notes – Do not over loosen or remove the upper portion of the top-hat.– The sample should be located in the center of the cavity for the best response.– Samples must be frozen prior to inserting them in the cavity!4.To avoid contaminating the cavity, clean the outside of the sample tube with a ChemWipe. Be sure to remove any frost.5.In as smooth and rapid a motion as possible remove the top-hat currently on the VT cavityand replace it with the new sample by carefully sliding the sample tube straight down into the cavity. Once the top-hat contacts the vent tube, apply gentle but firm pressure until the top-hat snaps into place.6.Tune the cavity and set parameters to the instrument as usual.7.Wait for the sample to thermally equilibrate (~10 minutes).Tuning the Microwave Cavity and Bridge1.If the Microwave Bridge Controller window is not open, click on the Microwave Bridgebutton on the tool bar.2.Select the TUNE mode. See the image below.e the pairs of up/down arrow keys set the attenuation to 25dB. The leftmost pairchanges in units of 10dB and the rightmost pair changes in 1dB units.e the right/left arrow buttons of the Frequency slider to center the tuning dip as shownabove. The system takes long fractions of a second to respond so do not click too fast.Use the right/left arrow buttons on the Signal Phase slider to adjust phase until the tuning dip is symmetrical as shown above. The system takes long fractions of a second torespond so do not click too fast.5.Either click the Up or Down arrow to start the cavity auto-tune process. The autotuneroutine will then adjust the frequency, phase, bias, and iris coupling for optimalperformance. Wait for this process to complete as indicated by the three green indicators in the left of the Instrument Monitor window.Note – If auto-tune fails, follow the procedure in Appendix C.6.Click the Microwave Bridge button to close the window.D. O PERATION:T AKING S PECTRASetting ParametersInstrument parameters may be loaded from disk by opening an existing spectrum, or set manually as described below. Whichever method is chosen it is important to verify that the cavity calibration file is loaded and is being used.1.Setting parameters manuallya.Click the New Spectrum button to ensure that a previously open spectrum is notaccidentally overwritten.b.Click the Experimental Parameters button and enter the desired parameters.Notesa)If looking for radicals centered around g = 2, check the box just above the “CenterField” numeric to automatically set the “Center Field” parameter.b)Microwave power – The range is 1 to 200 mW. Usual values are 1 to 20 mW.c)Modulation Amplitude – The range is 0.1 to ~20 (dependent on cavity) gauss. 5 to10 gauss is typical. The amplitude should be no higher than the width of thenarrowest line (in gauss) in the spectrum. See page 2-19 in the Bruker WinEPRacquisition manual for a discussion of over modulation.d)Receiver Gain – Typical range 100 to 5000.e)Conversion Time – This is the time allotted for the A/D process and directlyinfluences resolution in the Y-axis. This value multiplied by Resolution in X (# ofpoints collected across spectrum) yields the sweep time for the spectrum.f)Time constant – This value should be less than one tenth the time needed to scanthe narrowest line in the spectrum. See page 2-20 in the Bruker WinEPRacquisition manual for a discussion of using an excessively long time constant.g)If a single scan does not yield spectra with reasonable signal-to-noise, either of thetwo options below can help.a.Repetitive scanb.Increased time constant with either increased conversion time and/or Xresolution to slow the scan through the signal2.Loading/Verified cavity calibrationa.Click the Interactive Spectrometer Control button.b.Verify that the “Calibrated” check box in the upper right is checked.c.Click the “SCT Options” button at the lower right to open the Signal Channel Optio nsdialog shown below.d.Verify that the loaded calibration file in use matches the name of the cavity currentlyinstalled. See the table below for the calibration file names. If necessary, click the“Change File” button and select the proper file.Resonator Name Calibration FileER 4102 ST ST 0203.calER 4103 TM TM 9304.calER 4119 HS HS 0716.calER 4116 DM DM 0708.calER 4123 D D 0247.calAcquiring DataAfter setting the scan parameters, click the Run button to initiate data collection. Acquisition can be terminated immediately using the Stop Acquisition button or at the end of the current scan via the button. This latter operation is useful during averaging operations if the desired spectral quality has been achieved.E. I NSTRUMENT O PERATION:S HUTDOWN1.Set Microwave Bridge controller to STANDBYa.If the Microwave Bridge Controller window is not open, click on the MicrowaveBridge button on the tool bar.b.Select the STANDBY mode.2.Exit the WinEPR software.3.“Sign Out …” - Right click on your name at the top of the Windows “Start” menu.4.Remove the sample from the cavity and replace the cap.5.Power down in this order.a.Turn off the console by pressing the lit button in the center of the unit.b.Turn off the magnet power supply (PWR first and then ELECT).6.Turn off the Heat Exchanger – Be careful not to mistakenly push the Main power button.7.Close the chilled water valves.8.Close the nitrogen gas valve.9.Sign the logbook.F.C ONTACTSAdvance Methods Consultation Training and ServiceDr. Michael Everly Dr. Hartmut HedderichAmy Faculty, Director Snr. Instrumentation SpecialistDepartment of Chemistry Department of ChemistryOffice: BRWN 4151 Office: BRWN 4151Phone: 49-45232 Phone: 49-46543E-mail : ******************E-mail : *******************Appendix A – V ARIABLE T EMPERATURE O PERATION (C OLD E DGE) Using high purity helium as a coolant, sample temperature can be varied from 150 K to~5 K. This is done by flowing helium gas at the desired temperature through a dewar assembly installed within the cavity that surrounds the sample. The cold gas is generated by passing99.999% helium at room temperature through a heat exchanger connected to a Sumitomo closed-loop compressor system. This eliminates the need for using liquid helium and reduces the cost of operation by a factor of 10.Due to the extreme low temperatures, great care must be taken when inserting samples not to thermally stress the sample/cavity, contaminate the cavity with room temperature air, or crush the heater and thermocouple that sit just below the sample. To reduce the thermal shock, which usually results in broken sample tubes, all samples MUST be frozen in liquid nitrogen before placing them in the cavity. Prefreezing samples also greatly reduces the time needed for temperature equilibration. Sample tubes MUST be rigorously cleaned to avoid cavity contamination. Wash your sample tubes between uses with an appropriate solvent and wipe them off with a ChemWipe before inserting them in the cavity. System maintenance due to contamination by a carless user may be billed to the PI at a cost of $60/hr with a 4-hour minimum!P ROCEDURES–The procedures below are intended to be used as needed and are not listed sequentially.S TARTUP,C OOL-D OWN,S HUTDOWNDue to the complexity of the ColdEdge VT system, center staff will perform these operations. Users will need to coordinate startup and shutdown times with center staff.S ETTING T EMPERATUREThe Oxford Instruments Cryostat and LakeShore controller combination uses a heater to warm the flowing cold helium gas to the desired temperature. To set the temperature press the “Setpoint” button and enter the desired temperature and hit “Enter”. If you find that you have entered an incorrect value or menu that you didn’t want, simpl y press the cancel button.C HANGING/I NSERTING S AMPLES1.Place the Microwave Bridge Controller in STANDBY mode.2.With one hand, remove the sample/cap from the cavity. With the other hand, insert thenew sample.Notes – This must be done as quickly as possible to prevent room temperature air from entering the cavity.– Samples must be frozen prior to inserting them in the cavity!3.Tune the cavity and set parameters to the instrument as usual.4.Wait for the sample to thermally equilibrate (~10 minutes) and fine-tune the cavity.Appendix B – M ANUAL T UNING THE M ICROWAVE C AVITY In case the automatic tuning operation (in Part V. of the training outline) fails to properly tune the cavity and bridge, a message indicating this failure will be shown in the mode indicator in the center of the microwave bridge controller display.Some samples may be somewhat "lossy," i.e., the sample or solvent changes the conditions in the cavity to decrease the cavity absorption dip. If this effect is only minimal, it may still be possible to manually tune the cavity and bridge by the following procedure.If the sample is very "lossy," it may be impossible to observe a sufficient cavity dip for lock-on by the control system. If the control system cannot be stabilized as indicated by inability to center the LOCK OFFSET meter or the DIODE CURRENT meter, then a different (aqueous) cavity will need to be installed. Contact RIC staff to make this change.Manually Tuning Procedure (Summarized from section 5.1of the WinEPR acquisition manual)1.If the Microwave Bridge Controller window is not open, click on the Microwave Bridgebutton on the tool bar.2.Select the TUNE mode. See the image below.e the pairs of up/down arrow keys set the attenuation to 25dB. The leftmost pairchanges in units of 10dB and the rightmost pair changes in 1dB units.e the right/left arrow buttons of the Frequency slider to center the tuning dip as shownabove. The system takes long fractions of a second to respond so do not click too fast.5.The dip should cover come about 2/3 of the way to the baseline. If the dip is too small orlarge, decrease or increase, respectively the attenuation in 1dB steps.e the right/left arrow buttons of the Signal Phase slider to adjust phase until the tuningdip is symmetrical as shown above and is as deep as possible. If the dip points up, the phase is 180 degrees off. If it has positive and negative lobes, it is ~90 degrees off. The system takes long fractions of a second to respond so do not click too fast.7.Select the Operate mode and then fine-tune the Frequency to center the AFC indicator inthe Instrument Monitor window. Readjust as needed if the AFC drifts during subsequent steps.8.Set attenuation to 50dB and use the right/left arrow buttons of the Bias slider to center theDiode Current meter (200 µA) in the Instrument Monitor Window9.The steps below adjusting the iris (critical coupling) are iterative in nature.a.Lower the attestation by 10dB.e the Up/Down keys of the Iris, bring the diode current back to center.c.Repeat the steps above until reaching 10dB.Note – If the AFC lock drifts, center it by adjusting the frequency.10.While at 10dB of attenuation, adjust phase to achieve maximum Diode current.11.Cycle through 10, 20, 30, 40, 50 dB to verify that the Diode current remains constant. Ifnot, repeat the tuning process.12.Click the Microwave Bridge button to close the window.Page B2。
与激光有关的英文文献Revised at 16:25 am on June 10, 2019L a s e r t e c h n o l o g y R. E. Slusher Bell Laboratories, Lucent Technologies, Murray Hill, New Jersey 07974 Laser technology during the 20th century is reviewed emphasizing the laser’s evolution from science to technology and subsequent contributions of laser technology to science. As the century draws to a close, lasers are making strong contributions to communications, materials processing, data storage, image recording, medicine, and defense. Examples from these areas demonstrate the stunning impact of laser light on our society. Laser advances are helping to generate new science as illustrated by several examples in physics and biology. Free-electron lasers used for materials processing and laser accelerators are described as developing laser technologies for the next century.S0034-68619902802-01. INTRODUCTIONLight has always played a central role in the study of physics, chemistry, and biology. Light is key to both the evolution of the universe and to the evolution of life on earth. This century a new form of light, laser light, has been discovered on our small planet and is already facilitating a global information transformation as well as providing important contributions to medicine, industrial material processing, data storage, printing, and defense. This review will trace the developments in science and technology that led to the invention of the laser and give a few examples of how lasers are contributing to both technological applications and progress in basic science. There are many other excellent sources that cover various aspects of the lasers and laser technology including articles from the 25th anniversary of the laser Ausubell and Langford, 1987 and textbooks ., Siegman, 1986; Agrawal and Dutta, 1993; and Ready, 1997.Light amplification by stimulated emission of radiation LASER is achieved by exciting the electronic, vibrational, rotational, or cooperative modes of a material into a nonequilibrium state so that photons propagating through the system are amplified coherently by stimulated emission. Excitation of this optical gain medium can be accomplished by using optical radiation, electrical current and discharges, or chemical reactions. The amplifying medium is placed in an optical resonator structure, for example between two high reflectivity mirrors in a Fabry-Perot interferometer configuration. When the gain in photon number for an optical mode of the cavity resonator exceeds the cavity loss, as well as loss from nonradiative and absorption processes, the coherent state amplitude of the mode increases to a levelwhere the mean photon number in the mode is larger than one. At pump levels above this threshold condition,the system is lasing and stimulated emission dominates spontaneous emission. A laser beam is typically coupled out of the resonator by a partially transmitting mirror. The wonderfully useful properties of laser radiation include spatial coherence, narrow spectral emission, high power, and well-defined spatial modes so that the beam can be focused to a diffraction-limited spot size in order to achieve very high intensity. The high efficiency of laser light generation is important in many applications that require low power input and a minimum of heat generation.When a coherent state laser beam is detected using photon-counting techniques, the photon count distribution in time is Poissonian. For example, an audio output from a high efficiency photomultiplier detecting a laser field sounds like rain in a steady downpour. This laser noise can be modified in special cases, ., by constant current pumping of a diode laser toobtain a squeezed number state where the detected photons sound more like a machine gun than rain. An optical amplifier is achieved if the gain medium is not in a resonant cavity. Optical amplifiers can achievevery high gain and low noise. In fact they presently have noise figures within a few dB of the 3 dB quantum noise limit for a phase-insensitive linear amplifier, ., they add little more than a factor of two to the noise power of an input signal. Optical parametric amplifiers OPAs, where signal gain is achieved by nonlinear coupling of a pump field with signal modes, can be configured to add less than 3 dB of noise to an input signal. In an OPA the noise added to the input signal can be dominated by pump noise and the noise contributed by a laser pump beam can be negligibly small compared to the large amplitude of the pump field.2. HISTORYEinstein 1917 provided the first essential idea for the laser, stimulated emission. Why wasn’t the laser invented earlier in the century Much of the early work on stimulated emission concentrates on systems near equilibrium, and the laser is a highly nonequilibrium system. In retrospect the laser could easily have been conceived and demonstrated using a gas discharge during the period of intense spectroscopic studies from 1925 to 1940. However, it took the microwave technology developed during World War II to create the atmosphere for thelaser concept. Charles Townes and his group at Columbia conceived the maser microwave amplification by stimulated emission of radiation idea, based on their background in microwave technology and their interest in high-resolution microwave spectroscopy. Similar maser ideas evolved in Moscow Basov and Prokhorov, 1954 and at the University of Maryland Weber, 1953. The first experimentally demonstrated maser at Columbia University Gordon et al., 1954, 1955 was based on an ammonia molecular beam. Bloembergen’s ideas for gain in three level systems resulted in the first practical maser amplifiers in the ruby system. These devices have noise figures very close to the quantum limit and were used by Penzias and Wilson in the discovery of the cosmic background radiation.Townes was confident that the maser concept could be extended to the optical region Townes, 1995. The laser idea was born Schawlow and Townes, 1958 when he discussed the idea with Arthur Schawlow, who understood that the resonator modes of a Fabry-Perot interferometer could reduce the number of modes interacting with the gain material in order to achieve high gain for an individual mode. The first laser was demonstrated in a flash lamp pumped ruby crystal by Ted Maiman at Hughes Research Laboratories Maiman, 1960. Shortly after the demonstration of pulsed crystal lasers, a continuouswave CW He:Ne gas discharge laser was demonstrated at Bell Laboratories Javan et al., 1961, first at mm and later at the red nm wavelength lasing transition. An excellent article on the birth of the laser is published in a special issue of Physics Today Bromberg, 1988.The maser and laser initiated the field of quantum electronics that spans the disciplines of physics and electrical engineering. For physicists who thought primarilyin terms of photons, some laser concepts were difficult to understand without the coherent wave concepts familiar in the electrical engineering community. For example, the laser linewidth can be much narrower than the limit that one might think to be imposed by the laser transition spontaneous lifetime. Charles Townes won a bottle of scotch over this point from a colleague at Columbia. The laser and maser also beautifully demonstrate the interchange of ideas and impetus between industry, government, and university research.Initially, during the period from 1961 to 1975 there were few applications for the laser. It was a solution looking for a problem. Since the mid-1970s there has been an explosive growth of laser technology for industrial applications. As a result of this technology growth, a new generation of lasers including semiconductor diode lasers, dye lasers, ultrafast mode-locked Ti:sapphire lasers, optical parameter oscillators, and parametric amplifiers is presently facilitating new research breakthroughs in physics, chemistry, and biology.3. LASERS AT THE TURN OF THE CENTURYSchawlow’s ‘‘law’’ states that everything lases if pumped hard enough. Indeed thousands of materials have been demonstrated as lasers and optical amplifiers resulting in a large range of laser sizes, wavelengths, pulse lengths, and powers. Laser wavelengths range from the far infrared to the x-ray region. Laser light pulses as short as a few femtoseconds are available for research on materials dynamics. Peak powers in the petawatt range are now being achieved by amplification of femtosecond pulses. When these power levels are focused into a diffraction-limited spot, the intensities approach 1023 W/cm2. Electrons in these intense fields are accelerated into the relativistic range during a single optical cycle, and interesting quantum electrodynamic effects can be studied. The physics of ultrashort laser pulses is reviewed is this centennial series Bloembergen, 1999.A recent example of a large, powerful laser is the chemical laser based on an iodine transition at a wavelength of mm that is envisioned as a defensive weapon Forden, 1997. It could be mounted in a Boeing 747 aircraft and would produce average powers of 3 megawatts, equivalent to 30 acetylene torches. New advances in high quality dielectric mirrors and deformable mirrors allow this intense beam to be focused reliably on a small missile carrying biological or chemical agents and destroy it from distances of up to 100 km. This ‘‘star wars’’ attack can be accomplished during the launch phase of the target missile so that portions of the destroyed missile would fall back on its launcher, quite a good deterrent for these evil weapons. Captain Kirk and the starship Enterprise may be using this one on the Klingons At the opposite end of the laser size range are microlasers so small that only a few optical modes are contained in a resonator with a volume in the femtoliter range. These resonators can take the form of rings or disks only a few microns in diameter that use total internal reflection instead of conventional dielectric stack mirrors in order to obtain high reflectivity. Fabry-Perot cavities only a fraction of a micron in length are used for VCSELs vertical cavity surface emitting lasers that generate high quality optical beams that can be efficiently coupled to optical fibers Choquette and Hou, 1997. VCSELs may find widespread application in optical data links.4. MATERIALS PROCESSING AND LITHOGRAPHYHigh power CO2 and Nd:YAG lasers are used for a wide variety of engraving, cutting, welding, soldering, and 3D prototyping applications. rf-excited, sealed off CO2 lasers are commercially available that have output powers in the 10 to 600 W range and have lifetimes of over 10 000 hours. Laser cutting applications include sailclothes, parachutes, textiles, airbags, and lace. The cutting is very quick, accurate, there is no edge discoloration, and a clean fused edge is obtained that eliminatesfraying of the material. Complex designs are engraved in wood, glass, acrylic, rubber stamps, printing plates, plexiglass, signs, gaskets, and paper. Threedimensional models are quickly made from plastic or wood using a CAD computer-aided design computer file.Fiber lasers Rossi, 1997 are a recent addition to the materials processing field. The first fiber lasers were demonstrated at Bell Laboratories using crystal fibers in an effort to develop lasers for undersea lightwave communications. Doped fused silica fiber lasers were soon developed. During the late 1980s researchers at Polaroid Corp. and at the University of Southampton invented cladding-pumped fiber lasers. The glass surrounding the guiding core in these lasers serves both to guide the light in the single mode core and as a multimode conduit for pump light whose propagation is confined to the inner cladding by a low-refractive index outer polymer cladding. Typical operation schemes at present use a multimode 20 W diode laser bar that couples efficiently into the large diameter inner cladding region and is absorbed by the doped core region over its entire length typically 50 m. The dopants in the core of the fiber that provide the gain can be erbium for the mm wavelength region or ytterbium for the mm region. High quality cavity mirrors are deposited directly on the ends of the fiber. These fiber lasers are extremely efficient, with overall efficiencies as high as 60%. The beam quality and delivery efficiency is excellent since the output is formed as the single mode output of the fiber. These lasers now have output powers in the 10 to 40 W range and lifetimes of nearly 5000 hours. Current applications of these lasers include annealing micromechanical components, cutting of 25 to 50 mm thick stainless steel parts, selective soldering and welding of intricate mechanical parts, marking plastic and metal components, and printing applications.Excimer lasers are beginning to play a key role in photolithography used to fabricate VLSI very large scale integrated circuit chips. As the IC integrated circuit design rules decrease from mm 1995 to mm 2002, the wavelength of the light source used for photolithographic patterning must correspondingly decrease from 400 nm to below 200 nm. During the early 1990s mercury arc radiation produced enough power at sufficiently short wavelengths of 436 nm and 365 nm for high production rates of IC devices patterned to mm and mm design rules respectively. As the century closes excimer laser sources with average output powers in the 200 W range are replacing the mercury arcs. The excimer laser linewidths are broad enough to prevent speckle pattern formation, yet narrow enough, less than 2 nm wavelength width, to avoid major problems with dispersion in optical imaging. The krypton fluoride KF excimer laser radiation at 248 nm wavelength supports mm design rules and the ArF laser transition at 193nm will probably be used beginning with mm design rules. At even smaller design rules, down to mm by 2008, the F2 excimer laser wavelength at 157 nm is a possible candidate, although there are no photoresists developed for this wavelength at present. Higher harmonics of solid-state lasers are also possibilities as high power UV sources. At even shorter wavelengths it is very difficult for optical elements and photoresists to meet the requirementsin the lithographic systems. Electron beams, x-rays and synchrotron radiation are still being considered for the 70 nm design rules anticipated for 2010 and beyond.5. LASERS IN PHYSICSLaser technology has stimulated a renaissance in spectroscopies throughout the electromagnetic spectrum. The narrow laser linewidth, large powers, short pulses, and broad range of wavelengths has allowed new dynamic and spectral studies of gases, plasmas, glasses, crystals, and liquids. For example, Raman scattering studies of phonons, magnons, plasmons, rotons, and excitations in 2D electron gases have flourished since the invention of the laser. Nonlinear laser spectroscopies have resulted in great increases in precision measurement as described in an article in this volume Ha¨nsch and Walther 1999.Frequency-stabilized dye lasers and diode lasers precisely tuned to atomic transitions have resulted in ultracold atoms and Bose-Einstein condensates, also described in this volume Wieman et al., 1999. Atomicstate control and measurements of atomic parity nonconservation have reached a precision that allows tests of the standard model in particle physics as well as crucial searches for new physics beyond the standard model. In recent parity nonconservation experiments Wood et al., 1997 Ce atoms are prepared in specific electronic states as they pass through two red diode laser beams. These prepared atoms then enter an optical cavity resonator where the atoms are excited to a higher energy level by high-intensity green light injected into the cavity from a frequency-stabilized dye laser. Applied electric and magnetic fields in this excitation region can be reversed to create a mirrored environment for the atoms. After the atom exits the excitation region, the atom excitation rate is measured by a third red diode laser. Very small changes in this excitation rate with a mirroring of the applied electric and magnetic fields indicate parity nonconservation. The accuracy of the parity nonconservation measurement has evolved over several decades to a level of %. This measurement accuracy corresponds to the first definitive isolation of nuclear-spin-dependent atomic parity violation.。
近红外光谱英语作文Title:Near - Infrared SpectroscopyNear - infrared spectroscopy (NIRS) is a powerful analytical technique that has found wide - ranging applications in various fields.NIRS is based on the interaction of near - infrared light with matter. Near - infrared light typically ranges from about 780 nm to 2500 nm. When this light interacts with a sample, it can be absorbed, scattered, or transmitted. Molecules in the sample have specific vibrational and rotational energy levels. The near - infrared light causes transitions between these levels, and the resulting absorption spectra can provide valuable information about the chemical composition of the sample. For example, different functional groups such as - OH (hydroxyl), - CH (methylene and methyl), and - NH (amine) have characteristic absorption bands in the near - infrared region.NIRS instruments usually use tungsten - halogen lamps or light - emitting diodes (LEDs) as light sources. Tungsten - halogen lamps provide a broad - spectrum of near - infraredlight, while LEDs can be more energy - efficient and have longer lifetimes in some cases.Commonly used detectors in NIRS include silicon - based detectors for the shorter - wavelength part of the near - infrared region and InGaAs (indium - gallium - arsenide) detectors for the longer - wavelength part. These detectors convert the light signal into an electrical signal that can be further processed.There are various optical components such as lenses, mirrors, and fiber - optics in NIRS instruments. Fiber - optics are particularly useful for in - situ or remote sensing applications as they can transmit the near - infrared light over long distances with relatively low loss.In agriculture, NIRS can be used to analyze the quality of crops. For example, it can determine the moisture content, protein content, and starch content of grains. This helps in the grading and sorting of agricultural products, ensuring that only high - quality products reach the market.In the pharmaceutical industry, NIRS is used for quality control during the manufacturing process. It can quickly analyze the composition of tablets or capsules, ensuring that the active ingredients are present in the correct amounts andthat there are no impurities. It can also be used for the identification of raw materials and the monitoring of drug stability.For the food industry, NIRS is a valuable tool for analyzing the nutritional content of food products. It can measure the fat, sugar, and fiber content in foods, which is important for food labeling and quality control. Additionally, it can be used to detect contaminants or adulterants in food.In the medical field, NIRS has potential applications in non - invasive diagnosis. For example, it can be used to measure the oxygen saturation in tissues by detecting the absorption of near - infrared light by hemoglobin. This can provide real - time information about tissue perfusion and oxygenation, which is useful in critical care and surgical settings.In conclusion, near - infrared spectroscopy is a versatile and non - destructive analytical technique with numerous applications. Its ability to provide rapid and accurate analysis of samples makes it an invaluable tool in many industries and research areas. As technology continues to advance, we can expect NIRS to play an even more important role in the future.。
Automotive Radar – Status and TrendsMartin SchneiderRobert Bosch GmbH, Corporate Research, PO box 77 77 77, D-31132 Hildesheim, Germany, +49 5121 49 2543,Schneider.Martin@Abstract — The paper gives a brief overview of automo-tive radar. The status of the frequency regulation for short and long range radar is summarized because of its impor-tance for car manufacturers and their sensor suppliers. Front end concepts and antenna techniques of 24 GHz and 77 GHz sensors are briefly described. Their impact on the sensor’s field of v iew and on the angular measurement capability is discussed. Esp. digital beamforming concepts are considered and promising results are presented.I. I NTRODUCTIONFirst experiments in the field of automotive radar took place already in the late 50’s. I n the 70’s, more or less intensive radar developments started at microwave fre-quencies. The activities of the last decades were concen-trated mainly on developments at 17 GHz, 24 GHz, 35 GHz, 49 GHz, 60 GHz, and 77 GHz. Even from the early beginning in automotive radar the key driver of all these investigations has been the idea of collision avoidance; this idea has spent enormous motivation for many engi-neers all over the world to develop smart vehicular radar units. During this quite long period a lot of know-how has been gained in the field of microwaves and in radar signal processing. Accompanied by the remarkable pro-gress in semiconductor microwave sources (esp. Gunn sources and GaAs MMI Cs) and in available computing power of microcontrollers and digital signal processing units, the commercialization of automotive radar became feasible in the 90’s.Competing and complementing technologies in vehicu-lar surround sensing and surveillance are Lidar, ultrason-ics, and video cameras (based on CCD or CMOS chips including near-infrared sensitivity). Car manufacturers and suppliers are developing optimized sensor configura-tions for comfort and safety functions wrt. functionality, robustness, reliability, dependence on adverse weather conditions etc. Last but not least the total system costs have to meet the marketing targets to be attractive for the end customers. First applications with surround sensing technologies were parking aid (based on ultrasonics), collision warning, and Adaptive Cruise Control (ACC). For instance, collision warning systems were successfully introduced in the US in the 90’s. Greyhound installed more than 1600 radar systems (24 GHz) in their bus lines yielding a reduction of accidents of 21 percent in 1993 compared to the year before.ACC was commercialized for the first time in Japan in 1995. Whereas Lidar-ACC has been favored esp. in Ja-pan, European and US companies have been focused mainly on radar based ACC. I n 1999, Mercedes intro-duced the 77 GHz “Distronic” into the S class, followed by other premium models equipped optionally with an ACC, such as BMW 7 series, Jaguar (XKR, XK6), Cadil-lac (STS, XLR), Audi A8, and VW Phaeton. ACC is also available in Mercedes E, CL, CLK, SL class, BMW 5 and 6 series, Audi A6, Nissan (Cima, Primera), Toyota (Harrier, Celsior), Lexus (LS, GS), and Honda (Accord, nspire, Odyssey). Furthermore, ACC will become an option in the new BMW 3 series and in the new VW Passat, both with start of production in 2005.Whereas European car manufacturers offer 77 GHz systems only for ACC systems so far, their Japanese competitors Honda and Toyota already introduced an active brake assist for collision mitigation (additionally to ACC) in 2003 based on 77 GHz long range radar (LRR) technology. I n contrast to the only smooth deceleration capability of an ACC system (because ACC is only mar-keted as a comfort feature), the active brake assist pro-vides much higher braking forces for deceleration, when a threatening situation is identified and the driver starts braking, but maybe not as strong as it would be necessary to avoid a crash.This shows the trend from “comfort only” functions to active safety systems with radar sensing technologies that serve both the comfort and the safety domain. Within the next few years these active safety systems will be intro-duced in Europe. Mercedes started with the first genera-tion of their Presafe system in the S class in 2003, which isn’t based on surround sensing techniques yet but (only) on the data of the electronic stability program (ESP) and the antilock braking system (ABS). If these control units identify an imminent accident due to the car’s dynamics, electronic seat belt tensioners will be activated, seat ori-entations will be adapted, and the sunroof will be closed. The next step in this evolutionary process will be to gain some more milliseconds in advance for reaction and for automatic activation of suitable protection measures. Bosch names this system “Predictive Safety System (PSS)”, which will have mainly three stages. The first one (PSS1, to be introduced in 2005) is a preset of the brake system. As soon as a threat will be identified by the 77 GHz LRR, the brake system will be pre-filled, but this won’t be noticed by the driver. But when the driver pushes the brake pedal in such a situation, maximum braking forces will be available without any latency. I n the second stage (PSS2, 2006) the driver will be notified in a hazardous situation with an automatic, very short but intensive brake activation, accompanied by optical or acoustic signals. I n the third stage (PSS3) an automatic emergency brake will be initiated if otherwise a crash couldn’t be avoided. Bosch was recently awarded for its PSS with the “Gelber Engel (Yellow Angel)” from theGerman auto club ADAC (similar to AAA in the US) in the category “Innovation”.Short range radar (SRR) sensors for passenger cars will be mounted first in premium class models for pre-crash sensing, ACC support, parking assistance, and blind spot surveillance. Preferred microwave technology is 24 GHz in ultra wideband (UWB) operation with high range resolution in the range of cm.II. F REQUENCY R EGULATIONA lot of progress has been made during the last years in the frequency regulation for automotive radar. The 76 – 77 GHz band was regulated already in the 90’s fol-lowed by a standardization in Europe (ETSI EN 301 091). Now, this band is allocated for Intelligent Transport Services (ITS) in Europe, North America, and Japan.For short range applications UWB sensors are widely preferred because of their low cost perspectives and their high resolution in the range cm. The Federal Communi-cations Commission (FCC) regulated UWB for the North American market (NAFTA) already in 2002. For auto-motive UWB short range radar systems the FCC allo-cated the band 22 – 29 GHz with a maximum mean power density of -41.3 dBm/MHz.In 2002, more than 30 mainly European car manufac-turers and suppliers founded the Short range Automotive Radar frequency Allocation consortium (SARA). SARA’s main objective is to support UWB regulation for automotive radar in the 24 GHz range in Europe. Be-cause of strong objections of the telecom industry and earth observation institutions, a lot of effort was dedi-cated to find a compromise and to enable automotive UWB radar systems. On 17 January 2005 the commis-sion of the European Community finally decided to allo-cate the range of 21.65 – 26.65 GHz for UWB short range radar. The marketing of these systems is allowed from 07/2005 till 06/2013. The penetration rate is re-stricted to 7 percent of all cars in each country of the European Community. It is expected that this time frame of eight years will be sufficient to develop inexpensive short range radar sensors operating at a new frequency without impairing other commercial, scientific or military systems and services. Hence, in March 2004 the Euro-pean commission allocated the frequency range 77 – 81 GHz for UWB SRR with permitted usage from 2005 onwards. Anticipating the allocation of this band also in Japan and North America, the SRR suppliers will proba-bly shift their UWB developments from 24 GHz to 79 GHz in the medium term.III. F RONT E ND T ECHNIQUES AND A NTENNA C ONCEPTS Functional requirements, limited space for the sensors’ mounting, regulatory issues, components’ and fabrication costs, and marketing schedules mainly determine the choice of sensor concepts. One main requirement for long range radar is a range capability up to 150 .. 200m. With regard to the radar equation of a monostatic radarwe have in mind that the maximum range R max is propor-tional to the square root of the effective antenna aperture size A and to the square root of the frequency. V denotes the reflectivity of the target, P Tx the transmitted power and P min the minimum power necessary for detection. Therefore, highest frequencies should be preferred to get small box volumes. But this demand is contrary to the availability of cost saving microwave technologies. The antenna size of 77 GHz LRR sensors may decrease to approx. 50 x 50 mm 2. But even when the sensitivity would be sufficient, high antenna directivity and low sidelobes would still be necessary to cope with the effects of guard rails and irrelevant surroundings besides the road lanes.A. 24 GHz SensorsSRR sensors do not require long range capability. Hence, lower frequencies are preferred, enabling the use of available microwave components also used in the telecom industry. The 24 GHz technology seems to be the best compromise between today’s component costs and sensor size. Typically, SRR sensors do not measure the angle of detected objects and they have a very broad lateral coverage. Therefore, single antenna elements are sufficient. Only vertically the beams are directed to in-crease antenna gain and to minimize clutter effects from the road surface [1]. SRR sensors are typically operated in pulsed mode (pulse, pulse Doppler) or in continuous wave mode (CW, FMCW, FSK, FMCW & FSK). Also coded radar with spread spectrum techniques (pulsed, CW, pseudo-noise) is a common technique. For instance, Delphi’s 17 GHz radar is a phase coded CW radar with a pseudo-noise (PN) BPSK modulation. The M/A-Com sensor is a pulsed radar. Hella is developing a 24 GHz UWB radar for short range applications and a narrow-band FMCW radar operating in the license free 24 GHz ISM band with a maximum range of 70m [2].To measure not only targets’ distances but also their angular positions, several adjacent sensors can be used. Their measurements of the targets’ distances are fused in a trilateration algorithm yielding also the angular posi-tions. Valeo-Raytheon is developing a multibeam phased array SRR that provides angular information itself. B. 77 GHz SensorsMain manufacturers of 77 GHz LRR sensors are ADC (subsidiary of Continental Temic in cooperation with M/A-Com), Bosch, Delphi, Denso, TRW (Autocruise), Fujitsu Ten, and Hitachi. Fig. 1 shows Bosch’s LRR in its 2nd generation, production has been started in 2004. The system has a box size of only 74 x 70 x 58 mm 3 (H x W x D) and contains all sensing and ACC functionality. The 77 GHz circuitry contains 4 feeding elements (poly-rods) directly attached to 4 patch elements on the RF board, illuminating a dielectric lens. The monostatic analog beamforming approach results in a broad illumi-nating transmit beam and four single receiving beams which partially overlap in azimuth yielding a total azi-muthal coverage of ±8 degrees, see Fig. 2. The modula-tion is FMCW with a triangular shape [3].,442min 2maxO S VP A P R Tx (1)Fig. 1. Bosch ACC, 2nd generationFig 2. Receive beam pattern of Bosch ACC, 2nd generationTRW also uses the dielectric lens concept whereasADC (resp. M/A-Com) takes advantage of a folded struc-ture with a very low profile resulting in a sensor depth of5cm. Other companies (Delphi, Fujitsu Ten, Mitsubishielectric, Celsius Tech) use mechanical mechanisms tosteer the beam in azimuth. Although mechanical radarscanners yield quite good detection performance, theymight be sensitive in their mechanical reliability overlifetime. Moreover, they are limited concerning furtherminiaturization. Delphi’s and Fujitsu Ten’s mechanicalradar are in series production.IV. D IGITAL B EAMFORMIMG C ONCEPTS77 GHz radar sensors with digital beamforming (DBF)front ends were introduced into the market by Japanesecompanies in 2003. Denso built a bistatic LRR with pla-nar patch antennas with a range capability up to 150mand a field of view of approx. ±10 degrees [4]. The ninereceiving antennas are multiplexed with four 77 GHzSP3T switches to only one base band channel, see Fig. 3.Fig. 3. Denso’s 77 GHz DBF sensor [4]The Toyota CRDL 77GHz LRR radar (Fig. 4, [5])switches 3 equal transmitting antennas and 3 receivingantennas resulting also in one base band channel, and,after demultiplexing in the digital domain, nine digitalreceiver channels for DBF.Fig. 4. Toyota CRDL Radar with DBF, 77 GHz, [5]A. Direction of Arrival EstimationAll conventional direction of arrival (DOA) estimationmethods as monopulse techniques (comparison of thereceived signals in partially overlapping beams) or spatialpower spectrum measurement techniques (mechanicalscanning, phased array) do have an angular resolution inthe range of the half-power beamwidth. Hence, the angu-lar resolution directly depends on the aperture size, be-cause the 3 dB beamwidth of an antenna with diameter Dand constant illumination is approx.Therefore, the angular resolution of long range 77 GHzsensors is typically in the range of 2 .. 5 degrees. Toovercome this limitation, parameter estimation methodsbased on subspace techniques can be applied. Thesemethods rely on a subspace decomposition of the noisyreceived signals of an array of multiple antenna elements.With an eigenvalue decomposition of the autocorrelationmatrix of the received signals of a uniform linear array(ULA) the noise and the signal subspace can be deter-mined. Knowing these subspaces, the DOA’s of the tar-gets can be estimated. Well known in array signal proc-essing theory are the Music and Esprit algorithms [6, 7].We applied these techniques to a 24 GHz SRR with digi-tal beamforming and published very promising results in2002 [8].In our further work we started to transfer this approachto the 77 GHz domain. The main objectives of our cur-rent research activities are to gain know-how about 77GHz DBF concepts and their benefits in combinationwith parameter estimation techniques and to investigatetheir impact on development efforts. Fig. 5 shows one ofour 77 GHz DBF front ends with a ULA consisting ofeight parallel receiving columns. The transmit antennaconsists out of 4 columns with a tapered power distribu-tion yielding a low sidelobe level of approx. -27 dB. The3 dB beamwidth of the transmit antenna is approx. 26degrees and the antenna gain is 20.5 dB..593DdBOT q|(2)Another front end with extended arrays for long range operation was put into a water-resistant housing and was mounted on our test vehicle, see Fig 6. First results of our implementation of parameter estimation techniques on a 77 GHz DBF demonstrator are shown in Fig. 7. Themarkings no. 1 and 2 indicate the estimation of the Esprit algorithm. Although the half power beamwidth of the virtual beams of the DBF sensor is approx. 8.5 degrees, both cars with their angular separation of less than 4 degrees are detected and no ghost target between both objects does appear.Fig. 6. Test vehicle with 77 GHz DBF demonstrator (also insert in right bottom corner)Fig. 7. Angular measurement of two cars at the same dis-tance (60 m radial distance and 4 m lateral separation)V.C ONCLUSIONShort range radar in ultra wideband operation at 24 GHz and at 79 GHz from 2013 at the latest will be used first in premium and later on in upper class models. Main applications will be ACC support, pre-crash detection, parking assistance, and blind spot surveillance. Market introduction of 24 GHz SRR will start in 2005. SRR sensors won’t have angular measurement capabilities in the first generation (except the Valeo-Raytheon sensor), but future generations will also be able to provide angu-lar information. Although these sensors will be more expensive, they will contribute to the minimization of the total number of sensors and therefore they will reduce overall system costs.77 GHz ACC systems will be extended to be opera-tional at low speeds including full stop capability. This will provide increased customer benefits and it will con-tribute significantly to the market success of ACC sys-tems. In the same manner the 77 GHz sensor will be used not only for comfortable driving (ACC stop & go) but also for predictive and active safety systems. Active safety systems up to an automatic emergency braking in unavoidable crash situations will be the key for a consid-erable reduction of the total number of crashes and fatali-ties.The detection performance of 77 GHz sensors will be further improved, for instance wrt. false alarm rate and reaction time. Also sensor costs will be lowered. Planar antennas in combination with digital beamforming pro-vide interesting front end concepts for 77 GHz radar. These techniques might become feasible for high volume production as far as costs of 77 GHz components and powerful digital signal processing units will further de-crease.R EFERENCES[1] I. Gresham, A. Jenkins, “Ultra-wideband radar: Regula-tions, Applications, and Challenges,” Int. Microwave Sym-posium 2003, Philadelphia, Penn., June 2003[2] Th. Wixforth, W. Ritschel, “Multimode-Radar-Technolo-gie für 24 GHz,“ auto & elektronik , vol. 3/2004, pp. 56-58[3] G. Kühnle, H. Mayer, H. Olbrich et al, “Low-Cost Long-Range Radar for Future Driver Assistance Systems,” Auto Technology , vol. 4/2003, pp. 2-5, 2003[4] A. Kawakubo, S. Tokoro et al., “Electronically-ScanningMillimeter-Wave RADAR for Forward Objects detection,” SAE Congress 2004, pp. 127-134, Detroit, 2004[5] Y. Asano, S. Ohshima et al, “Proposal of Millimeter-WaveHolographic Radar with Antenna Switching,” Int. Micro-wave Symposium 2001, Phoenix, Az, May 2001[6] R. O. Schmidt, “Multiple emitter location and signal para-meter estimation,”, Proc. RADC Spectrum Estimation Workshop , RADC-TR-79-63, Rome Air Development Center, Rome, NY, Oct. 1979, p. 243 (reprinted in I EEE Trans. Antennas Propag., vol. AP-34, pp. 276-280, 1986) [7] R. Roy and T. Kailath, “ESPRI T – Estimation of signalparameters via rotation invariance techniques,“ IEEE Trans. Acoust., Speech , Signal Processing , vol. 37, pp. 984-995, July 1989[8] M. Schneider, V. Groß et al, “ Automotive 24 GHz ShortRange Radar Sensors with Smart Antennas,” German Ra-dar Symposium 2002, Bonn, September 200277 GHz DBF radar12Fig. 5. Bistatic 77 GHz DBF front end with 8 patch antenna columns for receive and 4 columns (fed by a power splitter) for transmitRxTx。
微波近场扫描显微镜无损介质层透视探测成像马慧瑾;白明;邵一鹏;苗俊刚【摘要】在分析新型微波近场扫描显微镜同轴谐振腔工作模式的基础上,采用了S 参量测量谐振腔多谐振频点S21幅值和相位的工作方式.为满足探测非透明物体内部隐藏结构的需求,利用谐振腔微扰理论和隐失场探测原理,实验测得介质层下金属隐藏结构的扫描微波图像,实现约0.01λ超分辨率的清晰图像.讨论了采用微波近场扫描显微镜方法进行的非透明物体内部无损探测技术,为进一步应用于物体内部无损探测和检验提供了重要的研究基础.%Based on analyzing the coaxial resonator mode of new scanning evanescent microwave microscope (SEMM), a woking mode that the S21 amplitude and phase under multi-resonant frequencies is measured with S parameter is adopted. To meet the demand of detecting internal hidden structure of opaque objects, the cavity perturbation theory and evanescent field detection principle is employed. The scanning microwave images of internal hidden metal structure beneath a dielectric layer were obtained in the experiments, and clear images of 0. 01A super resolution were attained. This paper discussed the non-destructive internal detection technology of scanning evanescent microwave microscope, and provided an important research foundation for internal non-destructive examination and quality control of objects.【期刊名称】《现代电子技术》【年(卷),期】2012(035)010【总页数】5页(P68-72)【关键词】无损透视探测;微波近场扫描显微镜;隐失场;电容加载同轴谐振腔;探针【作者】马慧瑾;白明;邵一鹏;苗俊刚【作者单位】北京航空航天大学,北京 100191;北京航空航天大学,北京 100191;北京航空航天大学,北京 100191;北京航空航天大学,北京 100191【正文语种】中文【中图分类】TN015-;TN040 引言随着工业技术高速发展,无损检测在提高产品质量、降低生产成本、和延长产品使用寿命等方面起到越来越重要的作用。
傅里叶变换红外光谱仪英语Fourier Transform Infrared SpectroscopyFourier Transform Infrared Spectroscopy (FTIR) is a powerful analytical technique used to identify and characterize a wide range of materials, including organic and inorganic compounds. This technique is based on the principle of the Fourier transform, which is a mathematical algorithm that converts a time-domain signal into a frequency-domain representation. In the case of FTIR, the time-domain signal is the interference pattern generated by the interaction of infrared radiation with a sample, and the frequency-domain representation is the infrared spectrum of the sample.The basic components of an FTIR spectrometer include a source of infrared radiation, an interferometer, a sample compartment, and a detector. The interferometer is the key component of the FTIR system, as it generates the interference pattern that is used to obtain the infrared spectrum. The interferometer typically consists of a beamsplitter, a fixed mirror, and a moving mirror. The infrared radiation from the source is split into two beams by the beamsplitter, one of which reflects off the fixed mirror and the other off the moving mirror. The two beams are then recombined and directedtowards the sample, where they interact with the sample's molecules.The interaction of the infrared radiation with the sample's molecules results in the absorption of specific wavelengths of the radiation, depending on the molecular structure and composition of the sample. The absorbed wavelengths are characteristic of the functional groups and chemical bonds present in the sample, and the intensity of the absorption is proportional to the concentration of the absorbing species. The interferogram, which is the time-domain signal generated by the interference of the two beams, is then converted into a frequency-domain spectrum using a mathematical algorithm called the Fourier transform.One of the key advantages of FTIR spectroscopy is its speed and sensitivity. Unlike dispersive infrared spectrometers, which use a monochromator to scan the infrared spectrum one wavelength at a time, FTIR spectrometers can collect the entire infrared spectrum simultaneously, resulting in faster data acquisition and higher signal-to-noise ratios. Additionally, FTIR spectrometers are generally more compact and less expensive than dispersive infrared spectrometers, making them more accessible to a wider range of users.FTIR spectroscopy has a wide range of applications in various fields, including materials science, environmental analysis, forensics, and biomedical research. In materials science, FTIR is used to characterizethe chemical composition and structure of polymers, ceramics, and other materials. In environmental analysis, FTIR is used to detect and quantify pollutants, such as volatile organic compounds (VOCs) and greenhouse gases, in air, water, and soil samples. In forensics, FTIR is used to analyze trace evidence, such as fibers, paints, and explosives, and to identify unknown substances. In biomedical research, FTIR is used to study the structure and function of proteins, lipids, and other biomolecules, as well as to diagnose and monitor various diseases.One of the key advantages of FTIR spectroscopy is its ability to provide detailed information about the chemical composition and structure of a sample. The infrared spectrum of a sample can be used to identify the presence of specific functional groups, such as carbonyl, hydroxyl, and amino groups, as well as to determine the relative abundance of these groups. Additionally, the shape and position of the absorption bands in the infrared spectrum can provide information about the molecular structure and conformation of the sample.Another advantage of FTIR spectroscopy is its versatility in sample preparation. FTIR can be used to analyze a wide range of sample types, including solids, liquids, and gases, with minimal sample preparation. Solid samples can be analyzed using techniques such as attenuated total reflectance (ATR) or diffuse reflectance, while liquid and gas samples can be analyzed using transmission or gas-phasetechniques.Despite its many advantages, FTIR spectroscopy also has some limitations. One of the main limitations is the limited penetration depth of the infrared radiation, which can make it difficult to analyze thick or opaque samples. Additionally, FTIR spectroscopy can be sensitive to environmental factors, such as temperature and humidity, which can affect the quality of the data.In conclusion, Fourier Transform Infrared Spectroscopy is a powerful analytical technique that has a wide range of applications in various fields. Its speed, sensitivity, and versatility make it an invaluable tool for researchers and analysts who need to characterize the chemical composition and structure of a wide range of materials. As the field of FTIR spectroscopy continues to evolve, it is likely that we will see even more innovative applications of this technology in the years to come.。
2.3 Spatial Resolution, Pixel Size, and ScaleFor some remote sensing instruments, the distance between the target being imaged and the platform, plays a large role in determining the detail of information obtained and the total area imaged by the sensor. Sensors onboard platforms far away from their targets, typically view a larger area, but cannot provide great detail. Compare what an astronaut onboard the space shuttle sees of the Earth to what you can see from an airplane. The astronaut might see your whole province or country in one glance, but couldn't distinguish individual houses. Flying over a city or town, you would be able to see individual buildings and cars, but you would be viewing a much smaller area than the astronaut. There is a similar difference between satellite images and airphotos.The detail discernible in an image is dependent on thespatial resolution of the sensor and refers to the size ofthe smallest possible feature that can be detected.Spatial resolution of passive sensors (we will look at thespecial case of active microwave sensors later) dependsprimarily on their Instantaneous Field of View (IFOV).The IFOV is the angular cone of visibility of the sensor (A)and determines the area on the Earth's surface which is"seen" from a given altitude at one particular moment intime (B). The size of the area viewed is determined bymultiplying the IFOV by the distance from the ground tothe sensor (C). This area on the ground is called theresolution cell and determines a sensor's maximumspatial resolution. For a homogeneous feature to be detected, its size generally has to be equal to or larger than the resolution cell. If the feature is smaller than this, it may not be detectable as the average brightness of all features in that resolution cell will be recorded. However, smaller features may sometimes be detectable if their reflectance dominates within a articular resolution cell allowing sub-pixel or resolution cell detection.As we mentioned in Chapter 1, most remote sensing images are composed of a matrix of picture elements, or pixels, which are the smallest units of an image. Image pixels are normally square and represent a certain area on an image. It is important to distinguish between pixel size and spatial resolution - they are not interchangeable. If a sensor has a spatial resolution of 20 metres and an image from that sensor is displayed at full resolution, each pixel represents an area of 20m x 20m on the ground. In this case the pixel size and resolution are the same. However, it is possible to display an image with a pixel size different than the resolution. Many posters of satellite images of the Earth have their pixels averaged to represent larger areas, although the original spatial resolution of the sensor that collected the imagery remains the same.Page 39 Section 2.3 Spatial Resolution, Pixel Size, and ScaleCanada Centre for Remote SensingImages where only large features are visible are said to have coarse or low resolution. In fine or high resolution images, small objects can be detected. Military sensors for example, are designed to view as much detail as possible, and therefore have very fine resolution. Commercial satellites provide imagery with resolutions varying from a few metres to several kilometres. Generally speaking, the finer the resolution, the less total ground area can be seen.The ratio of distance on an image or map, to actual ground distance is referred to as scale. If you had a map with a scale of 1:100,000, an object of 1cm length on the map would actually be an object 100,000cm (1km) long on the ground. Maps or images with small "map-to-ground ratios" are referred to as small scale (e.g. 1:100,000), and those with larger ratios (e.g. 1:5,000) are called large scale.Page 40Section 2.3 Spatial Resolution, Pixel Size, and Scale Canada Centre for Remote Sensing2.4 Spectral ResolutionIn Chapter 1, we learned aboutspectral response and spectral emissivity curves which characterize the reflectance and/or emittance of a feature or target over a variety ofwavelengths. Different classes of features and details in an image can often be distinguished by comparing their responses over distinct wavelength ranges. Broad classes, such as water and vegetation, can usually be separated using very broad wavelength ranges - the visible and near infrared - as we learned in section 1.5. Other more specific classes, such as different rock types , may not be easily distinguishable using either of these broad wavelength ranges and would require comparison at much finer wavelength ranges to separate them. Thus, we would require a sensor with higher spectral resolution . Spectral resolution describes the ability of a sensor to define fine wavelength intervals. The finer the spectral resolution, the narrower the wavelength range for a particular channel or band.Black and white film records wavelengths extending over much, or all of the visible portion of the electromagnetic spectrum. Its spectral resolution is fairly coarse, as the various wavelengths of the visible spectrum are not individually distinguished and the overall Page 41Section 2.4 Spectral Resolution Canada Centre for Remote Sensingreflectance in the entire visible portion is recorded. Colour film is also sensitive to the reflected energy over the visible portion of the spectrum, but has higher spectral resolution, as it is individually sensitive to the reflected energy at the blue, green, and red wavelengths of the spectrum. Thus, it can represent features of various colours based on their reflectance in each of these distinct wavelength ranges.Many remote sensing systems record energy over several separate wavelength ranges at various spectral resolutions. These are referred to as multi-spectral sensors and will be described in some detail in following sections. Advanced multi-spectral sensors called hyperspectral sensors, detect hundreds of very narrow spectral bands throughout the visible, near-infrared, and mid-infrared portions of the electromagnetic spectrum. Their very high spectral resolution facilitates fine discrimination between different targets based on their spectral response in each of the narrow bands.Page 42Section 2.4 Spectral Resolution Canada Centre for Remote Sensing2.5 Radiometric ResolutionWhile the arrangement of pixels describes the spatial structure of an image, the radiometric characteristics describe the actual information content in an image. Every time an image is acquired on film or by a sensor, its sensitivity to the magnitude of the electromagnetic energy determines the radiometric resolution . The radiometric resolution of an imaging system describes its ability to discriminate very slight differences in energy The finer the radiometric resolution of a sensor, the more sensitive it is to detecting small differences in reflected or emitted energy.Imagery data are represented by positive digital numbers which vary from 0 to (one less than) a selected power of 2. This range corresponds to the number of bits used for coding numbers in binary format. Each bit records an exponent of power 2 (e.g. 1 bit=2 1=2). The maximum number of brightness levels available depends on the number of bits used in representing the energy recorded. Thus, if a sensor used 8 bits to record the data, there would be 28=256 digital values available, ranging from 0 to 255. However, if only 4 bits were used, then only 24=16 values ranging from 0 to 15 would be available. Thus, the radiometric resolution would be much less. Image data are generally displayed in a range of grey tones, with blackrepresenting a digital number of 0 and white representing the maximum value (for example, 255 in 8-bit data). By comparing a 2-bit image with an 8-bit image , we can see that there is a large difference in the level of detail discernible depending on their radiometric resolutions. Page 43Section 2.5 Radiometric Resolution Canada Centre for Remote Sensing2.6 Temporal ResolutionIn addition to spatial, spectral, and radiometric resolution, the concept of temporal resolution is also important to consider in a remote sensing system. We alluded to this idea in section2.2 when we discussed the concept of revisit period, which refers to the length of time it takes for a satellite to complete one entire orbit cycle. The revisit period of a satellite sensor is usually several days. Therefore the absolute temporal resolution of a remote sensing system to image the exact same area at the same viewing angle a second time is equal to this period. However, because of some degree of overlap in the imaging swaths of adjacent orbits for most satellites and the increase in this overlap with increasing latitude, some areas of the Earth tend to be re-imaged more frequently. Also, some satellite systems are able to point their sensors to image the same area between different satellite passes separated by periods from one to five days. Thus, the actual temporal resolution of a sensor depends on a variety of factors, including the satellite/sensor capabilities, the swath overlap, and latitude.The ability to collect imagery of the same area of the Earth's surface at different periods of time is one of the most important elements for applying remote sensing data. Spectral characteristics of features may change over time and these changes can be detected by collecting and comparing multi-temporal imagery. For example, during the growing season, most species of vegetation are in a continual state of change and our ability to monitor those subtle changes using remote sensing is dependent on when and how frequently we collect imagery. By imaging on a continuing basis at different times we are able to monitor thechanges that take place on the Earth's surface, whether they are naturally occurring (such as changes in natural vegetation cover or flooding) or induced by humans (such as urban development or deforestation). The time factor in imaging is important when:persistent clouds offer limited clear views of the Earth's surface (often in the tropics)short-lived phenomena (floods, oil slicks, etc.) need to be imagedmulti-temporal comparisons are required (e.g. the spread of a forest disease from one year to the next) the changing appearance of a feature over time can be used to distinguish it from near-similar features (wheat / maize)Page 44Section 2.6 Temporal Resolution Canada Centre for Remote Sensing。
Resolution of Near-Field Microwave Target Detection and Imaging by Using Flat LHM LensGang Wang,Member,IEEE,Jieran Fang,and Xiaoting Dong,Member,IEEEAbstract—It is demonstrated in this paper that higher focusing resolution will be provided byflat left-handed metamaterial (LHM)lens if compared to convex dielectric lens and elliptical reflector focusing system.High-resolution near-field microwave target detection and imaging withflat LHM lens can be imple-mented by scanning the focal point of theflat LHM lens in the region under detection and screening directly thefield intensity distribution of backscattered microwave refocused by theflat LHM lens.Numerical simulations demonstrate that sub-wave-length imaging resolution can be obtained by the proposed approach due to the sub-wavelength focusing resolution offlat LHM lens.Moreover,almost unique imaging resolution for the detection and imaging of target at different depths is also demon-strated.For practical LHM lenses,it is shown that the losses of LHM up to the order as reported in some LHM experiments will limit the sub-wavelength resolution of the proposed approach to an acceptable level.Index Terms—Near-field,left-handed metamaterial(LHM), lens,imaging,resolution.I.I NTRODUCTIONF OLLOWING Veselago’s prediction of left-handed meta-materials(LHM)[1],more and more experiments have been reported to demonstrate the unique electromagnetic prop-erties of LHM at microwave frequencies[2]–[8].Nowadays,the design and fabrication of isotropic three-dimensional LHM have also been under consideration[9],[10].Different from the con-ventional right-handed material(RHM)having positive permit-tivity and permeability,the LHM have negative permittivity and permeability.As a result,the electricfield vector,the magnetic field vector,and the wave vector of electromagnetic wave form a left-handed triplet in LHM.When microwave propagates across the planar interface between RHM and LHM,all-angle negative refraction will occur.Hence,flat slab of LHM can be used as lens to focus microwave,i.e.,microwave emitted from a point source on one side offlat LHM slab can be focused on the other side of the slab.Pendry[11]first considered the use of LHM slab lens to focus microwave emitted from a point source.He reached a remark-Manuscript received February14,2007;revised July5,2007.This work was supported in part by the Department of Personnel and Department of Education of Jiangsu Province of China under Grant05KJB510012,and in part by the Nature Science Foundation of China under Grant60771041.G.Wang and J.Fang are with the Department of Telecommunication En-gineering,Jiangsu University,Zhenjiang,212013,China(e-mail:gwang@ujs. ).X.Dong is with Computational Electromagnetics Laboratory,Darmstadt Uni-versity of Technology,D-64289Darmstadt,Germany(e-mail:dong@temf.tu-darmstadt.de).Digital Object Identifier10.1109/TAP.2007.910365able conclusion that the perfect LHM lens(where the LHM was supposed to be lossless)may achieve a focusing resolu-tion better than the diffraction limit.More results with clear evidence of sub-wavelength resolution from different groups have been reported based on theoretical analysis and numerical simulations[12]–[16].Intrigued by the prospect of beating the diffraction limit,several microwave experiments have also been reported[17]–[20].Different from the perfect LHM,practical LHM used in experiments generally have losses.Although the material losses in practical LHM limit the focusing resolution to less than that of the perfect lens,sub-wavelength focusing res-olution offlat LHM lens was still measured.For example,the half-power beamwidth measured by Grbic and Eleftheriades’experiment[19]for thin LHM lens(thickness is approximately 0.27wavelength)is0.21effective wavelength,the full width at half-maximum widths(FWHM)of the focused beams mea-sured by Aydin and Bulu’s experiment[20]with two-dimen-sional LHM slab(thickness is approximately1.2wavelengths) for two different point source distances of0.5and1.0wave-length are0.36and0.4wavelength,respectively.It is now be-coming clear that the idea of aflat LHM lens is physically sound and experimentally feasible.The unique focusing properties offlat LHM lens may lead to entirely new perspectives on microwave target detection and imaging[21],[22].Based on the facts that the position of the focal point offlat LHM slab lens can be easily adjusted by moving the point source,novel target detection and imaging scheme withflat LHM lens,as shown in Fig.1,has been pro-posed by scanning the focal point,measuring the backscattered field and screening the distribution of the backscatteredfield level[23].In the proposed focus-scanning scheme,the scanning aperture is defined by the range of the T-R pair moving along direction parallel to theflat LHM lens surface,and the scanning depth can be controlled simply by moving the T-R pair towards and away from the LHM lens.The maximum detectable target depth(in Fig.1)of the proposed scheme is restrictedwithin Due to the losses in practical LHM,the thickness of LHMlens (and thus the detection depth)is generally limited,so that the LHM lens is restricted to near-field target detection.Our numerical simulations by using two-dimensional(2-D)finite-difference in time-domain(FDTD)have demonstrated significant improvement of the focusing resolution offlat LHM lens and enhancement of the microwave backscattered from the target by the proposed focus-scanning scheme[23],[24].For flat LHM lens of thicknessof(is the wavelength used for0018-926X/$25.00©2007IEEEFig.1.Focus-scanning scheme for target detection and imaging by usingflat LHM lens.detection),the proposed focus-scanning scheme may yield afocusing resolution ofapproximately for the detectionof a perfect electric conductor(PEC)cylinder of diameterof,while the focusing resolution of theflat LHM lens isapproximately[23].Moreover,the use offlat LHMlens will introduce approximately24dB enhancement of thebackscattered microwavefield level even for the detection ofthinner PEC cylinder(e.g.,diameterof)[24],if comparedto the directly backscattered microwave without using theLHM lens.Thus,the focus-scanning scheme withflat LHMlens shows great potentials for near-field small target detectionand imaging.Other microwave and millimeter wave focusing systemshave also been considered for target detection and imagingto generate the high-resolution images of targets[25]–[27].Microwave microscopy provides sub-wavelength spatial res-olution[25],while scanning a relatively thick sample with amillimeter wave lens antenna provides the adjustment of focalpoint(plane)by moving of the reflectometer with lens antenna[26].For early breast cancer detection,a PEC elliptical reflectormade of half ellipsoid was suggested[27]with a monopoleantenna probe at one focal point in the half ellipsoid and theother focal point in the breast,where the focal point is scannedby moving the probe together with the reflector.In contrast tosuch focus-fixed systems,aflat LHM lens system hasflexiblefocal point so that the focal point can be scanned in both thelateral and the depth directions by moving the point source,without moving the lens.Therefore,the proposed focus-scanning scheme takes theadvantages of sub-wavelength focusing resolution,significantenhancement of the backscatteredfield and ease in focal pointscanning.A comparison between theflat LHM lens and convexfocusing lens or reflector focusing system will be more helpfulto evaluateflat LHM lens focusing.Moreover,the focusingresolution of the scheme we previously demonstrated is not theimaging resolution for target detection,and the effects of somefactors such as the target depth and LHM losses on the imagingresolutions are unknown.In this paper,we study further the res-olution of the proposed scheme by using two-dimensional(2-D)finite-difference time-domain(FDTD)simulation.In Section II,a comparison of three typical focus-scanning schemes withconvex RHM lens,PEC elliptical reflector,andflat LHM lensis presented.In Section III,both the lateral and longitudinalimaging resolutions of the proposed scheme are investigated.In Section IV,the imaging resolution for detection of target atdifferent depth is verified.In Section V,the effects of LHMlosses on the scanning and imaging resolutions are studied.II.T ARGET D ETECTION AND I MAGING BY F OCUS-S CANNINGFocus-scanning scheme has been proved to be effective fordetection and imaging of targets[25],[26].The performance offocus-scanning scheme is closely related to the foot-print or fo-cusing resolution of the focused beam,which can be defined bythe half-power beamwidth[19]or the full width at half-max-imum width(FWHW)[20]of the focused beams.Fig.2illustrates three typical schemes for focus-scanning de-tection and imaging.Fig.2(a)shows the convex RHM lens fo-cusing used to focus the antenna beam as in[26],and Fig.2(b)shows the PEC reflector focusing used as in[27].The convexRHM lens or reflector must be carefully designed to arrange thesource(or the phase center of transmitting antenna)at one focalpoint.The other focalpoint can be scanned by movingthe source and lens/reflector together.The scanning depth isthus restricted by the focal length.Forflat LHM lens shown inFig.2(c),the focal point can be easily adjusted by moving thesource(or the probing antenna)in both the lateral and longitu-dinal direction,thus it has the advantage of simple structure andflexible scanning.The three schemes will provide different foot-prints or fo-cusing resolutions.For comparison,we study the situation thatthe three focusing schemes have the same scanning depth,i.e.,the distances from the focalpoint to the near surface of theRHM/LHM lens or to the open section of the PEC reflector areall the same,and are set tobe.Two-dimensional FDTD codes have been developed to sim-ulate the focusing of the three typical schemes shown in Fig.2.In the simulation,a line source of microwavefrequencyGHz(andwavelength cm)with unit amplitudeis set at the source point in Fig.2.The computational space is800*800cellswith mm,whichis.For LHM lens simulation,ten-cell extended uniaxial anisotropicperfectly matched layer[28]is considered,and transition layerbetween the LHM and its surrounding medium is introduced toavoid sharp interface as stated in[29].The artificial LHM is sup-posed to be isotropic and characterized bypermittivity andpermeability of theform(1)(2)By choosing different values offrequencies and lossfactor(which is related to the collision frequency),we havedifferentpermittivity andpermeability.Here the2-DflatLHM lens is chosen tohave bysetting andFig.2.Three typical schemes for focus-scanningimaging.in(1)and(2),where the losses is introduced for thestability of FDTD simulation.For the scanning depthof,theflat LHM lens is typicallychosen to have thicknessof,the PEC elliptical reflectoror the convex RHMlens may take different geometries.For example,the elliptical reflector of half ellipsoid may havedifferent short axis even if the focal length is set tobe.El-liptical reflectors with different geometries will lead to differentfocusing performances.In the comparison,geometries with bestfoot-print or lateral focusing resolution is considered for theconvex RHM lens and the PEC elliptical reflector,which aredetermined by studying the foot-prints of various convex RHMlenses and elliptical reflectors with the same focallength.teral focusing resolutions for the three schemes.Fig.3shows a comparison of lateral focusing resolutions(orthe profile of foot-print)of the three typical schemes by pre-senting microwavefield level distributed along x-direction at thefocal position.From Fig.3,we read that the focusing resolutionofflat LHM lens isapproximately,while the focusingresolutions of convex RHM lens and PEC elliptical reflector areapproximatelyand,respectively.Therefore,flatLHM lens provides the highest focusing resolution(smallestfoot-print)among the three schemes.Among the three focusing schemes,the convex RHM lens andtheflat LHM lens have comparable lateral focusing resolutions.Further analysis of the focused beam intensities indicate that,for microwave source of unit amplitude(0dB level),thefieldintensity at the focal point of convex RHM lens isapproximatelydB,while for theflat LHM lens itis dB[24].Hence,thefield level incident on target for the scanning schemewithflat LHM lens is approximately3.4dB higher than thatwith the convex RHM lens.The backscattered microwave in thevicinity of the source can thus be enhanced by approximately7dB.Generally,higher focusing resolution(smaller foot-print)will lead to higher imaging resolution in target detection andimaging by focus scanning.Thus we may expect the best per-formance withflat LHM lens among the three focus-scanningschemes.Fig.4shows the reconstruction image of a PECcylinder of diameterof and center at the focalpoint.The imaging is obtained by scanning the focalpoint at a scanning stepof mm,calculatingthe backscatteredfield and directly screening thefield leveldistribution of the backscattered microwave.The reconstructionimage is presented in full dynamic range.It should be remarked here that the offset of the T-R pairwe previously used in our simulation in[23]is,mono-static target detection and imaging as in[26]with single an-tenna for transmitted and received signals is simulated here forFig.4.Moreover,for the LHM lens consider in our simula-tion,the refocused microwavefield recorded at each receivingpoint is actually the compound of three parts,i.e.,the waveemitted from the source,the wave reflected from the entranceFig.4.Reconstruction image of PEC cylinder target by the proposed focus-scanning scheme with flat LHM lens.and exit surfaces of LHM lens (due to the minor mismatch be-tween the LHMofand the free space),and the refocused wave backscattered from the target.To obtain the backscattered microwave,we substract the fields recorded undersituation without targetatfrom the fields recorded under sit-uation with targetat .Detailed analysis of the backscattered signals was presented in [30].III.I MAGING R ESOLUTIONS OF F OCUS -S CANNING S CHEMEW ITH F LAT LHM L ENS To evaluate the performance of the proposed focus-scanning scheme for target detection and imaging with flat LHM lens,lateral(-directional)beam pro file of the reconstructed image of a PEC cylinder target as shown in Fig.4has been studied [23].It was demonstrated that for the detection of a PEC cylindertarget of diameterof,the half-power beamwidth of the lateral beam pro file of the image of target reconstructed bythe proposed focus-scanning scheme isapproximately,which is much better than the focusing/refocusingresolutionof the flat LHM lens [23].Although narrow beamwidth of the lateral beam pro file of target reconstruction image (viz.small size of image)generally implies high detection and imaging resolution,there is still a lack of the study of the detection and imaging resolution for the proposed focus-scanning scheme.In general,imaging resolution is de fined by the minimal dis-tance between two targets at which the two targets can still be distinguished in the reconstruction image.Typically,it can becharacterized byadB trough of the power level in the re-constructed image.In this section,we study both the lateral and longitudinal imaging resolutions of the proposed scheme in il-lustration of the detection and imaging of cylinder pair of twoPEC cylinders of diameterofteral beam pro files (normalized)extracted for cylinder pair with dif-ferent center offsets along x-axis.A.The Lateral Imaging ResolutionTo be representative,we consider the above de fined flat LHMlens ofthicknessand at frequency of 10GHz.To investigate the lateral imaging resolution,thetwo cylinders under detection are centered onlinewith different offsets.The focus-scanning detection is performed by scanning the focal point with a scanning stepofmm.By calculating and screening the backscattered field level at each scanning point,the reconstruction image of the two cylinders can be obtained.The lateral imaging resolution is determined by analyzing the lateral beam pro file on scanning line passing the two points with maximum backscattered field level in the reconstruction image.For cylinder pair set online,the pro file can be extracted onlinefrom the reconstruction image.Fig.5shows the lateral beam pro files extracted from the reconstructed im-ages of cylinder pair with different center offsets (viz.,distance between the two centers).From Fig.5,we have the observation that cylinder pair withcenteroffsetcan be distinguished clearly by a below -3dB trough between the two corresponding cylinder positions in the lateral beam pro file,while cylinder pair with centeroffset cannot be distinguished clearly because no -3dB trough can be observed in the lateral beam pro file.As shown in Fig.5,for thetwo PEC cylinder targets with offset ofapproximately,an exact -3dB trough can be measured between the two corre-sponding cylinder positions in the lateral beam pro file.There-fore,we conclude that the lateral imaging resolution of the pro-posed focus-scanning scheme with flat LHM lens ofthicknessis .B.The Longitudinal Imaging ResolutionIn our previous works [23],[24],the longitudinal focusing (or refocusing)resolution of flat LHM lens has not been well addressed.In closest analogue to the study of the lateral fo-cusing resolution in [23],the longitudinal focusing resolution can be de fined by constructing the beam pro file of microwave field intensity distributionalong -direction,and measuring the half-power beamwidth of the beam.Fig.6.Longitudinal beam profiles(normalized)for refocusing of the backscat-tered microwave and the scanning of PEC cylinder.Fig.6shows the longitudinal beam profiles for the refocusing offlat LHM lens(the same for focusing)and for the focus-scan-ning scheme when the PEC cylinderof is centeredat.The longitudinal beam profile for refocusingis constructed by depicting the backscatteredfield intensity at240receiving points ofinterval mm onthe axiswhen the line source is setat.The longitu-dinal beam profile for the focus-scanning scheme is constructedby extracting the backscatteredfield intensity on scanninglinein Fig.4,and depicting thefield level at216scanningpositions ofinterval mm onthe axis.From the longitudinal beam profile for refocusing in Fig.6wefind that the maximum intensity of the backscatteredfieldappearsaround as predicted in theory.Bymeasuring the half-power beamwidth of the beam profiles inFig.6,we read that the longitudinal half-power beamwidth ofthe longitudinal beam profile for focus-scanning scheme is ap-proximately,while for the refocused beam it is approxi-mately.It can be concluded that although the focus-scan-ning scheme improves the longitudinal resolution as well,thelongitudinal resolution is much worse than the lateral resolu-tion.Following the above method we study the lateral imaging res-olution,we may investigate the longitudinal imaging resolutionby study the beam profile extracted along z-axis from the re-construction image of cylinder pair with different center offsetsset along z-axis.Fig.7shows the longitudinal beam profile ex-tracted form the reconstructed images of the cylinder pair withdifferent center offsets.From Fig.7,we have the observation that cylinder pair withcenteroffsetand along z-axis can be distinguishedclearly,while cylinder pair with centeroffset cannot bedistinguished clearly becauseno dB trough can be observedin the corresponding longitudinal beam profile.Exact dBtrough in the longitudinal beam profile can be measured forcylinder pair of centeroffset.Therefore,the longitudinalimaging resolution of the proposed focus-scanning scheme withflat LHM lens ofthicknessis,which is much worsethan the lateral imagingresolution.Fig.7.Longitudinal beam profiles extracted for cylinder pair with differentcenter offsets along z-axis.It seems a common occurrence for the focus-scanningscheme that the longitudinal imaging resolution is worse thanthe lateral imaging resolution.This is due to the worse lon-gitudinal focusing resolution.Numerical simulations indicatethat the lateral focusing resolutions of the convex RHM lens,PEC elliptical reflector andflat LHM lens areapproximately,and60771041,respectively,while thecorresponding longitudinal focusing resolutions are approx-imately,and,respectively.With suchlongitudinal focusing resolutions,one can not desire satisfac-tory longitudinal imaging resolution for the focus-scanningscheme.In practice,to acquire satisfactory imaging resolutions inboth the lateral and longitudinal directions for the detection andimaging of target by usingflat LHM lens,anotherflat LHMlens orthogonally-set or another scanning in the orthogonalside of the region under detection would be helpful.Therefore,we may lay stress merely on lateral imaging resolution in thefollowing.IV.I MAGING R ESOLUTION FOR T ARGET AT D IFFERENT D EPTHSOne of the distinct merits to useflat LHM lens for target de-tection is that depth scanning can be implemented simply bymoving the probe or T-R pair towards or away from the surfaceof lens.For focus-scanning with convex RHM lens or PEC ellip-tical reflector,the imaging resolution for the detection of targetin uniform surrounding medium is always the same owing totheirfixed focal length.For focus-scanning withflat LHM lensofflexible focal length,identical imaging resolution for the de-tection of target at different depths is also desired for objectiveand consistent interpretation.Hence,the effects of target depthon the scanning resolution deserve detailed investigation.By setting and scanning one PEC cylinder ofdiameterat three target depthsofand,we can obtain the lateral beam profiles on scan-ninglineand,respec-tively.It turned out[23]that the half-power beamwidth of thelateral beam profile extracted from the reconstructed image hasan increase of6%,and0.1%,respectively,if compared to theteral beam profile(normalized)of image reconstruction of(a)one cylinder target,(b)two cylinder targets at different depths.half-power beamwidth for target atdepth,as shownin Fig.8(a).Therefore,almost identical imaging resolution can be desired for the detection of target at different depths due to the minor change of the scanning resolution.To demonstrate the effects of target depth on the imaging res-olution,we consider the detection of PEC cylinder pair(bothhave diameterof)of different offsets in x-directionat different depths.For illustration,three cylinder pair depths,viz.,,and,are consid-ered.For each target depth,different offsets are simulated tofind out the minimal distinguishable offset.It turned out that forcylinder pair at the three target depths,the minimal distinguish-able offsets are allapproximately.Fig.8(b)shows thelateral beam profiles extracted from the reconstruction imagesof cylinder pair at different depths with center offsetof.We observed an exact-3dB trough in all the three normalizedlateral beam profiles.Therefore,the proposed focus-scanning scheme withflatLHM lens will provide almost identical imaging resolution forthe detection and imaging of target at different depths.V.E FFECTS OF L OSSES OF LHM ON I MAGING R ESOLUTIONFor practical LHM lens,there are generally losses in theLHM,which have been proven to limit the focusing resolutionto worse than that of the perfect lens.For the proposed targetdetection scheme by focus-scanning,effects of LHM losseson the imaging resolution could be crucial because both thefocusing and the refocusing will suffer losses dissipation.With no loss of generality,we study the lateral beam pro-files of the proposed focus-scanning detection scheme when theflat LHM lens ofthickness is made of LHM of dif-ferent losses.The LHM losses can be characterized by nonzerolossfactor in(1)and(2).By setting different valuesof in(1)and(2),we will have differentcomplexand,whichimply different losses in LHM.To be representative,we con-sider another two typical LHM losses.At10GHz,for,bysetting,wehave,i.e.,;bysetting wehave,i.e.,.LHMwith representsheavier losses than previous LHMwith,whileLHMwith represents lighter -plexindexesand describethe losses to the same order as in previous simulation[14]andreported experiments[19],[31].For the detection of a PEC cylinder ofdiametercenteredat by the proposed focus-scanningscheme,Fig.9shows the un-normalized(a)and normalized(b)lateral beam profiles whenflat LHM lensofand are used,respectively.For comparison,the lateral beam profile forflat LHM lens oflossesas previously defined in Section II is also depicted.From Fig.9(a),we have the observation that the losses ofLHM may attenuate significantly the magnitude of the measuredbackscattered waves.The losses in LHM lensofattenuate the intensity of refocused microwave to approximatelyonefifth of that refocused by theflat LHM lensof.Further simulation demonstrates that the backscatteredfiled intensity refocused by LHM lensof with heavierlosses is still approximately3.6times strongerthan the backscatteredfiled intensity without using LHM lens.By measuring the half-power beamwidth of the lateral beamprofiles given in Fig.9(b),wefind that there are approximately-15%and33%expansion of the beamwidthforand,respectively,if compared to thehalf-power beamwidth of the lateral beam profile for theflatLHM lensof.All the three lateral beamwidthsare under half-wavelength.Therefore,the losses have only lim-ited impacts on the imaging resolution for the proposed scheme.Forflat LHM lensof,the reconstructedimages of cylinder pair with different center offsets demonstratethat the lateral imaging resolution isapproximately,asillustrated in Fig.10(a).Therefore,the use of LHM lensofwill introduce approximately13.2%improvementto the imaging resolution,if compared to the resolution for LHMlensof as in Section III.Forflat LHM lensof,the33%expansionof the beamwidth could have some impacts on the imaging res-olution.The effects can be investigated by exploring the min-imal distinguishable center offset of the cylinder pair.Fig.10(b)shows the lateral beam profiles extracted from the reconstructedimage of cylinder pair of several offsets.By measuring the loopsteral beam profiles for LHM lens of different material losses.(a) un-normalized,(b)normalized.in the beam profiles,it is found that the lateral imaging resolu-tion of the proposed focus-scanning scheme withflat LHM lensofthicknessand isapproximately,which indicates31.6%degradation of the imaging resolution.VI.C ONCLUSIONBy focusing microwave into narrow beam of small foot-print and scanning the foot-print,near-field target detection and imaging can be performed to provide the desired high imaging resolution and quick pared to the schemes using convex RHM lens and PEC elliptical reflector,the scheme withflat LHM lens has the potential to acquire higher imaging resolution and easy in-depth scanning,which will simplify the detection system design.In this paper,feasibility of the proposed scheme was demon-strated by considering the detection of target free space.The scheme can be easily applied to the detection of near-field small target such as breast tumor at early stage if the dielectric pa-rameters and refraction indexes of the LHM lens match its sur-rounding medium.Future work can be extended to3-D FDTD simulation with specific LHM and probingteral beam profiles(normalized)of image reconstruction of cylinder pair of different offsets when(a)n=0100:0006i,(b)n=0100:06i.A CKNOWLEDGMENTThe authors would like to thank the reviewers for their helpful comments and suggestions.R EFERENCES[1]V.G.Veselago,“The electrodynamics of substances with simultane-ously negative values of"and ,”p.,vol.10,no.4,pp.509–514,Jan.–Feb.1968.[2]R.A.Shelby,D.R.Smith,and S.Schultz,“Experimental verificationof a negative index of refraction,”Science,vol.292,pp.77–79,Apr.2001.[3]G.V.Eleftheriades,A.K.Iyer,and P.C.Kremer,“Planar negativerefractive index media using periodically L0C loaded transmis-sion lines,”IEEE Trans.Microw.Theory Tech.,vol.50,no.12,pp.2702–2712,Dec.2002.[4]A.A.Houck,J.B.Brock,and I.L.Chuang,“Experimental observa-tions of a left-handed material that obeys Snell’s law,”Phys.Rev.Lett.,vol.90,pp.1374011–4,Apr.2003.[5]A.F.Starr,P.M.Rye,D.R.Smith,and S.Nemat-Nasser,“Fabricationand characterization of a negative-refractive-index composite metama-terial,”Phys.Rev.B,vol.70,pp.1131021–4,Sept.2004.[6]S.A.Cummer and B.Popa,“Wavefields measured inside a negative re-fractive index metamaterial,”Appl.Phys.Lett.,vol.85,pp.4564–4566,Nov.2004.[7]K.Aydin,K.Guven,M.Kafesaki,L.Zhang,C.M.Soukoulis,andE.Ozbay,“Experimental observation of true left-handed transmissionpeaks in metamaterials,”Opt.Lett.,vol.29,pp.2623–2625,Nov.2004.。