a r X i v :0707.1573v 1 [a s t r o -p h ] 11 J u l 2007
Astronomy &Astrophysics manuscript no.kapferer˙metals c
ESO 2008February 1,2008
X-ray measured metallicities of the intra-cluster medium:a good
measure for the metal mass?
W.Kapferer 1,T.Kronberger 1,J.Weratschnig 1,and S.Schindler 1
Institut f¨u r Astro-und Teilchenphysik,Universit¨a t Innsbruck,Technikerstrasse 25,A-6020Innsbruck
ABSTRACT
Aims.We investigate whether X-ray observations map heavy elements in the Intra-Cluster Medium (ICM)well and whether the X-ray observations yield good estimates for the metal mass,with respect to predictions on transport mech-anisms of heavy elements from galaxies into the ICM.We further test the accuracy of simulated metallicity maps.Methods.We extract synthetic X-ray spectra from N-body/hydrodynamic simulations including metal enrichment pro-cesses,which we then analyse with the same methods as are applied to observations.By changing the metal distribution in the simulated galaxy clusters,we investigate the dependence of the overall metallicity as a function of the metal distribution.In addition we investigate the di?erence of X-ray weighted metal maps produced by simulations and metal maps extracted from arti?cial X-ray spectra,which we calculate with SPEX2.0and analyse with XSPEC12.0.
Results.The overall metallicity depends strongly on the distribution of metals within the galaxy cluster.The more inhomogeneously the metals are distributed within the cluster,the less accurate is the metallicity as a measure for the true metal mass.The true metal mass is generally underestimated by X-ray observations.The di?erence between the X-ray weighted metal maps and the metal maps from synthetic X-ray spectra is on average less than 7%in the temperature regime above T >3×10⁷K,i.e.X-ray weighted metal maps can be well used for comparison with observed metal maps.Extracting the metal mass in the central parts (r <500kpc)of galaxy clusters with X-ray observations results in metal mass underestimates up to a factor of three.
Key words.Hydrodynamics –Methods:numerical –intergalactic medium
1.Introduction
Since the ?rst observations of the 7keV iron line feature in the 1970’s by Mitchell et al.(1976)it has been evident that the intra-cluster medium (ICM)does contain gas al-ready processed by stars.X-ray spectra are the only mea-sure for the metallicity of the ICM.With X-ray observato-ries like XMM-Newton or Chandra it is nowadays possible to extract metallicities in certain regions of a galaxy clus-ter and construct metallicity pro?les and X-ray weighted metallicity maps (Pratt et al.2006,Durrett et al.2005).In addition to observations galaxy cluster simulations includ-ing gas and dark matter (DM)physics are an ideal tool to investigate the evolution of these systems.By includ-ing di?erent enrichment processes it is possible to trace the metals in the ICM.Recent work in this ?eld (Cora 2006,Kapferer et al.2006,Kapferer et al.2007,Domainko et al.2006,Moll et al.2007,Springel &Hernquist 2003)are able to reproduce the inhomogeneous distribution of met-als within the ICM as observed (Durret et al.2005).Given the large mass fraction of the ICM in a cluster (15-20%)compared to the mass fraction of the galaxies (3-5%)a lot of metals must have been produced within the galaxies and then been transported together with part of the interstellar medium (ISM)into the ICM.X-ray observations can also distinguish the lines of di?erent elements,e.g.elements like Si,S,O from core collapse supernovae or the elements Fe and Ni from supernovae Ia (Baumgartner et al.2005,Ettori
2W.Kapferer et al.:X-ray measured metallicities of the intra-cluster medium Domainko et al.2006and Schindler et al.2005for more de-
tails)to obtain a reasonable ICM gas distribution.The?rst
model cluster is a merging galaxy cluster,hereafter Model
Cluster A,whereas the second system is a more massive
galaxy cluster,hereafter Model Cluster B.The properties
of the model galaxy clusters are as follows:
–Model Cluster A:The cluster forms at z~1.5and has two major merger events at z=0.8and z=0.5.The?nal total mass is1.5×1014M⊙within a sphere of radius1 Mpc.
–Model Cluster B:The formation redshift for this clus-ter is z~1.7.It shows four minor merger events a z=1.4, z=1.1,z=0.5and z=0.3.The cluster has a?nal mass of
3.4×10¹⁴M⊙within a sphere of radius1Mpc.
The galaxy cluster simulations have two enrichment processes included,namely galactic winds and ram-pressure stripping.The enrichment process description reproduces the metallicity pro?le of non-cooling?ow and massive galaxy clusters(see Kapferer et al.(2007)for more details about the enrichment history and a detailed analysis on the metal distribution).With these two realistic models for ICM distribution we performed all analysis on the di?er-ence of the true metal mass,which we know exactly from the simulation,and the metal mass we would obtain from X-ray observations of our model clusters.
3.How to construct X-ray weighted metallicity
maps
So far X-ray weighted metal maps where used to obtain metal maps from simulations.We want to test here how accurate these maps are compared to maps,that are ob-tained by using spectra.The total emissivity by thermal Bremsstrahlung for the ICM above T>3×10⁷K is ap-proximately given by
?ff~1.4×10?27T1/2n e n i Z2g B[ergs cm?3s?1],(1) where T is the ICM gas temperature,n e,n i are the number densities of electrons and ions,Z is the number of protons of the bending charge and g B the frequency averaged Gaunt factor.The emissivity is mainly dominated by the density of the ICM.Besides the continuum emission several emission lines in the ICM can be observed.The most prominent lines in the ICM are typically in the7keV iron line complex. These lines origin from many stages of ionisation of iron. The power emitted by the most prominent emission lines in the ICM,the iron K line complex,which is a resonance line,is given by
P jk=8.63×10⁶(n e n h A el X i(t)E jk)×
exp(?E gj/kT)
?ff
≈?
exp(A/T)
los n2los R(T)los,(4)
where n los,M los and R(T)los are the density,metallicity and temperature-dependent weighting factor in each cell along the line of sight.By summing also perpendicular to the line of sight,we can obtain the mean metallicity over the whole cluster.
4.Spectroscopic metal maps and the comparison
with X-ray weighted metal maps.
In order to simulate the X-ray emissivity of our model clus-ter we use SPEX2.0to construct
thermal bremsstrahlung spectra including line emission.In Fig.3a spectrum for the
W.Kapferer et al.:X-ray measured metallicities of the intra-cluster medium
3
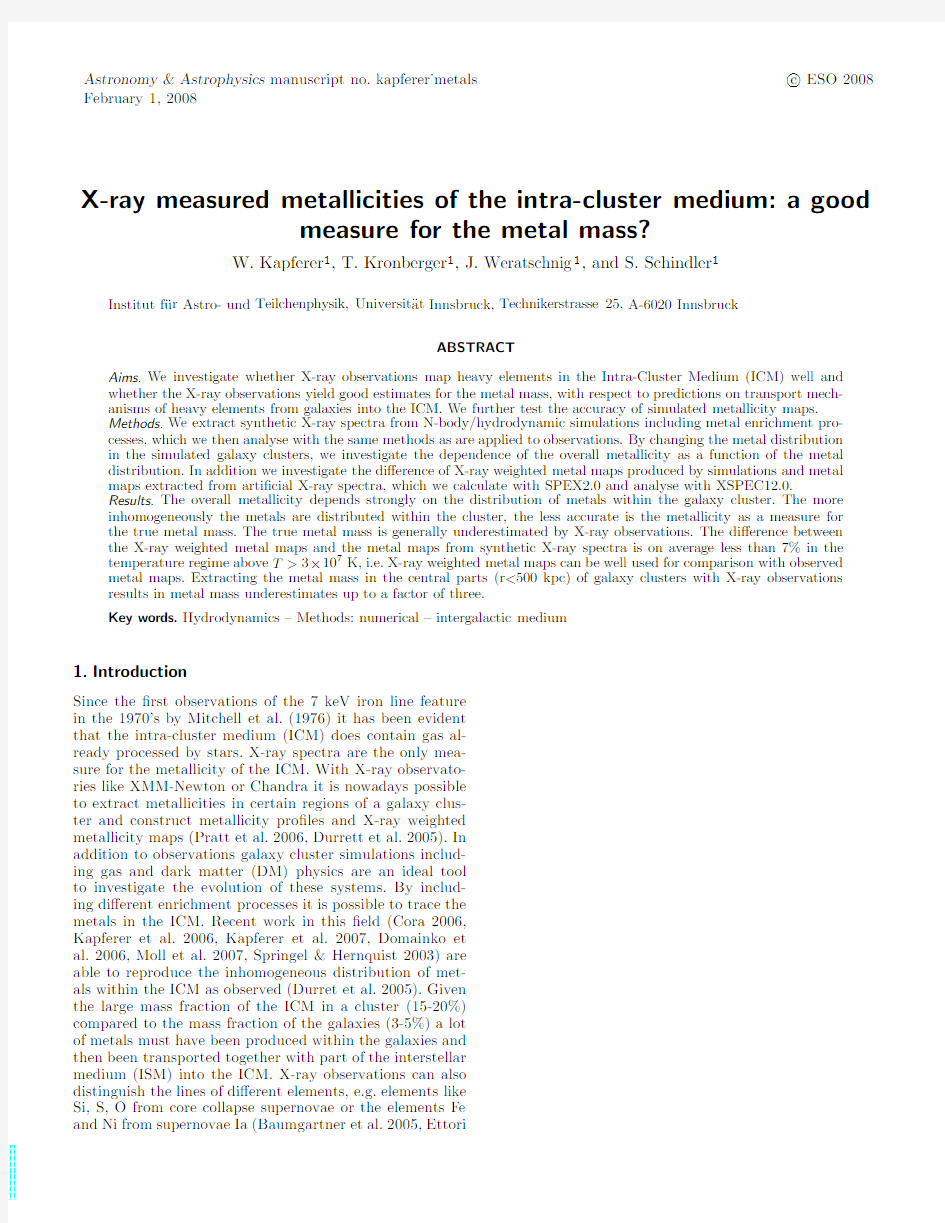
Fig.2.Left:X-ray weighted metal map of the model galaxy cluster at z=0,the metallicity in each cell is weighted by the X-ray emission.Right:Synthetic metal map,using a spectrum for each cell.The image has1.5Mpc h?1on the side.
whole model cluster is given.For each cell of our simula-tion,which has a resolution of1283,we calculate a model spectrum which we than integrate along the line of sight. By using XSPEC we?t a spectrum to each
pixel and hence construct a metallicity map,as shown in Fig.2.
Fig.3.Model spectrum of our model cluster,obtained with SPEX2.0.The count rate of the whole cluster is shown.
The model we used in XSPEC12.0is exactly the same which we used for constructing the synthetic spectra.In order to investigate the quality of our X-ray weighted metal maps we divided the two metal maps,the metal map obtained with XSPEC12.0by?tting for each pixel the synthetic spectra with a MEKAL-model(thermal bremsstrahlung with line radiation for an optically thin plasma)(Mewe,Gronenschild&van den Oord,1985)and the X-ray weighted metal map.The result is shown in Fig.4,beside the division image a histogram of the ra-tios is given.The di?erence of the two maps is on average 7%,leading to the conclusion,that X-ray weighted metal maps are a good approximation for spectroscopic metallic-ity maps,despite all the approximation made.In the out-skirts where the density and temperature of the plasma is lower,the deviation is larger,due to lower metallicities in the X-ray weighted metal.This can be understood in terms of the validity of the thermal bremsstrahlung approxima-tion(Eq.1),which is only valid for a plasma with tem-Fig.4.Ratio of X-ray weighted metal map to synthetic spectroscopic metal map.The image has1.5Mpc h?1on the side.Histogram of the left image.The X-ray weighted metal map di?ers on average by7%from the spectroscopic metal map.
peratures above3×107K.In the outskirts of our model cluster r>600kpc the temperature can drop below3×107 K,resulting in a too low metallicity.In this case the syn-thetic spectra give better results,because the Mekal model is valid for plasma temperatures above3×104K(Mewe, Gronenschild&van den Oord,1985).In regions1Mpc around massive cluster centres the temperature does typi-cally not drop below3×107K,therefore the X-ray weighted metal maps used so far to obtain metal maps from simu-lated clusters are a good approximation.
5.Results
5.1.The mean metallicity as a function of the metal
distribution
As metallicities in the ICM are always obtained by aver-aging over areas or annuli in the?eld of view,the ques-tion arises,how the real distribution of metals in?uences the mean metallicity of an observed cluster.Simulations are the only way to address this question,because the3D metal distribution is exactly known.In order to investi-gate how sensitive the mean metallicity of the ICM acts on the distribution of heavy elements we investigate an ex-tremely inhomogeneous metal distribution in the ICM.We add metals in a region with~120kpc on a side containing 1.17x10⁸M⊙heavy elements,which we place at di?erent positions along a line perpendicular to the line of sight, which passes through the cluster centre,i.e.we always add the same amount of metals to the ICM and see how the mean metallicity of the galaxy cluster in an1Mpc radius area depends on the position of the metals.Note that the ICM density distribution corresponds to model cluster A, with zero metallicity,except for the metal box mentioned above.In Fig.6the projected mean metallicity of the ICM in an area with1Mpc radius around the cluster centre is shown as a function of the position of the cube with respect to the cluster centre.The ratio between the metal mass ob-tained from the mean metallicity and the true metal mass is presented as well.The geometry of the observation and the metal cube position is shown in Fig.5.The metallicity measurements always refer to observations along the line of sight.
It is evident that(see Fig.6)the position of the cube in?uences the result dramatically.This can be understood
4W.Kapferer et al.:X-ray measured metallicities of the intra-cluster
medium
Fig.5.The geometry of the observation and the metal blob positions.The metal blob is placed at di?erent positions along the plotted line,which is perpendicular to the line of sight.
Fig.6.Overall metallicity of the ICM in a circle with1Mpc radius around the cluster centre as a function of the position of a region containing heavy elements.A metal blob with 117kpc on a side containing1.17x108M⊙heavy elements moves through the cluster centre,as highlighted in Fig.5. On the right side the ratio of the metal mass obtained from the mean metallicity and the true3D metal mass is given. The true metal mass is always higher then the metal mass obtained from X-ray observations.Note that the cluster has zero metallicity,expect for the metal box.
by the density distribution within the ICM.The line?ux of a given element can be written as
F line~ f(T)n e n i dldA~ f(T)n e dM i,(5)
where n e,n i are the number densities of electrons and the given element ions,f(T)is a temperature dependent emissivity and dM i is the di?erential mass of the given el-ement.In the centre the high density of the ICM results in the highest mean metallicity,which contributes most to the X-ray emission.When the metal blob is placed at a ra-dius of1Mpc the mean metallicity drops nearly one order of magnitude,because the outskirts do contribute less to the whole cluster emission.From this case of a metal blob placed in primordial ICM we can conclude,that the mean distribution depends strongly on the position of the metal blob within the ICM.
Recalculating the mass of metals residing in the ICM from the mean metallicity,shows the same dependence,see Fig.
6.The mean metallicity always underestimated the metal mass present in the model cluster.The discrepancy is a fac-tor of10in the centre and increases to a factor of100in the outskirts.The reason therefore is again the fact that emis-sivity by thermal bremsstrahlung is mainly driven by the density of the ICM,which decreases from the cluster centre to the outskirts by several magnitudes and the inhomoge-neous metal distribution.The integration of all quantities along the line of sight and the investigated area leads to the discrepancy between the true3D metal mass and the metal mass obtained by the mean metallicity of the ICM. This is of course an extreme example,but it demonstrates how strong the mean metallicity of a whole cluster depends on the actual metal distribution.In the case of a constant metallicity over the whole ICM,the metal mass obtained by the mean metallicity in a circle of1Mpc radius around the cluster centre is of course exactly the same as the true 3D metal mass.
5.2.The mean metallicity as a measure for the true metal
mass
In order to test,whether the mean metallicity in a de?ned region around the cluster centre represents a good mea-sure for the true metal mass within this area or not,we performed several tests with the model clusters.The metal content in the model galaxy clusters were calculated from an enrichment process investigation,where galactic winds and ram-pressure stripping acts simultaneously to enrich the ICM.The simulation starts at a redshift of~20and results in a metal distribution within the ICM as shown in Fig.7.For more details on the enrichment processes and the metal distribution see Kapferer et al.(2007).At red-shift z=0we extract the mean metallicity within circles of di?erent radii around the cluster centre(100,200,500 and800kpc)and extract from the3D simulation the mean ICM density within the corresponding spheres.As we know exactly the amount and distribution of heavy elements,we can compare these two quantities,i.e.the true heavy ele-ment mass and the X-ray measured heavy element mass.In Fig.8the spatial distribution of the density,temperature and metallicity of model cluster A is presented.Whereas the density does not show signi?cant substructures,the metal-licity is inhomogeneous.
In Table1the mean metallicity,true metal and X-ray measured metal mass for di?erent circles around the clus-ter centre for model cluster A and B are given.We?nd, that the X-ray measured metal mass always results in lower heavy element masses compared to the true metal mass in the same region of interest.If the radius is smaller,the dis-crepancy can be up to three times more metals in the ICM, than measured by X-ray spectra.By increasing the radius, i.e.averaging over much larger volumes,the discrepancy becomes smaller.At a radius at800kpc the X-ray mea-sured heavy element mass gives20%to50%lower masses than the true metal mass.In Fig.9two metal-mass pro?les for model cluster A are shown.The metal mass increases in general with increasing radius,because the volume of the radial shell increases with the square of the distance to the cluster centre.Although the metallicity decreases
W.Kapferer et al.:X-ray measured metallicities of the intra-cluster medium5
Fig.7.Metallicity pro?les for model clusters A and B.
at larger radii,the larger volume results in a higher metal mass.The metal mass X-ray pro?le(dashed line)is consid-erably lower then the true metal mass pro?le.The discrep-ancy arises by averaging of the metallicity in annuli at all radii,which wipes out
very prominent metallicity peaks all over the cluster.In Fig.8the distribution of the density, temperature and metallicity of the ICM in model cluster A at redshift0is shown.The high metallicity regions in the outskirts are clearly visible in the3D metal distribution. The inhomogeneous metal distribution in galaxy clusters leads to a systematic underestimate of the metal mass by X-ray observations.For example the ratio of the integrated true metal-mass pro?le to the integrated X-ray metallicity obtained metal-mass pro?le in an200kpc radius is2.70. Investigations of the amount of metals residing in galaxies in galaxy clusters and in the ICM(e.g.Renzini et al.1993) do always underestimate the true metal mass within the ICM.These works concluded,that on average the amount of heavy elements within galaxies and the ICM is compa-rable,would get a shift towards the conclusion,that even more metal mass resides within the ICM as in the galaxies.
6.Discussion and Conclusions
We investigate the quality of the metallicities obtained by X-ray observation of the ICM as a measure for the true metal mass of the ICM.In addition we test if X-ray weighted metal maps of galaxy cluster simulations are com-parable to synthetic X-ray spectra composed of thermal bremsstrahlung and line radiation.The results of our work are as follows:
–If the ICM temperature is above T>3×10⁷K X-ray weighted metal maps results nearly in the same metallic-ities as obtained from synthetic X-ray spectra.The dif-ference is on average less than7%in areas with r<750 kpc around the centre of galaxy clusters.
–We test how much the distribution of metals within a sphere of r=1Mpc around the cluster centre changes the X-ray measured mean metallicity of this area.We found that the X-ray obtained mean metallicity can change by a factor of10in the extreme case of a dis-tinct metal blob residing in primordial ICM,depending on the distance from the cluster centre.Fig.9.Metal mass pro?le per radial bin for model cluster A.Solid line:true metal mass within a three dimensional radial bin.Dashed line:metal mass obtained by multiplying the metallicity pro?le taken from the X-ray weighted metal map(eqn.4)with the three dimensional gas mass within the same bin(bin size80kpc).
–By using realistic metal distributions in simulated galaxy clusters we test the quality of the X-ray obtained overall metallicity as a measure for the metal mass.We found that depending on the size of the investigated area around the cluster centre the true metal mass can be three times higher than the metal mass obtained by X-ray observations.If the radius increases the discrep-ancy gets smaller,but in all cases the true metal mass is higher than the metal mass obtained by X-ray obser-vations.
The discrepancies of the true metal mass and the X-ray obtained metal mass within the ICM in galaxy clusters can be understood in terms of averaging.The observer mea-sures integrated quantities along the line of sight,includ-ing dense regions in the centre and less dense regions in the outskirts.In order to be able to get reasonable X-ray spectra of the ICM,observers must always collect X-ray photons over an area.As the metallicity is not constant throughout the galaxy cluster,i.e.the ratio of primordial ICM to heavy elements is not constant,the integration of thermal bremsstrahlung and line radiation results in dif-ferent ratios,leading to too low metal masses.Applying multi-temperature instead of single-temperature models for the ICM would alleviate the problem partially as shown by Buote&Canizares(1994).
Taking the results of this work into account,it is obvious that estimates from X-ray observations on the heavy ele-ments(e.g.iron)content in the ICM lead to masses,which are too low.
Acknowledgements
The authors thank the anonymous referee for fruitful comments,which helped to improve the paper.The au-thors would like to thank Etienne Pointecouteau for the useful help with XSPEC12.0and Jelle Kaastra for
6W.Kapferer et al.:X-ray measured metallicities of the intra-cluster medium
Table1.True metal mass versus X-ray obtained metal mass in di?erent spheres around the cluster centre for a less massive model galaxy cluster A and a massive model galaxy cluster B.
Mean metallicity Ratio Model cluster Radius[kpc]True metal mass[M⊙]X-ray measured metal mass[M⊙]Solar abundance C.3to C.4 B8001.02×10116.70×10100.94 1.52
B5004.70×10102.75×10100.95 2.80
B2007.50×1093.45×1090.96 2.17
B1001.25×1095.40×1080.97 2.31
the help regarding SPEX2.0.The authors acknowledge
the Austrian Science Foundation(FWF)through grants
P18523-N16and P19300-N16.Thomas Kronberger is a
recipient of a DOC-fellowship of the Austrian Academy
of Sciences.In addition,the authors acknowledge the
ESO Mobilit¨a tsstipendien des BMWF(Austria),the
Tiroler Wissenschaftsfonds(Gef¨o rdert aus Mitteln des vom
Land Tirol eingerichteten Wissenschaftsfonds)and the
UniInfrastrukturprogramm2005/06from the BMWF.
References
Anders,E.,&Grevesse,N.1989,Geochim.Cosmochim.Acta,53,
197
Baumgartner W.H.,Loewenstein M.,Horner D.J.,Mushotzky R.F.
2005,ApJ620,680
Buote,D.A.,&Canizares,C.R.1994,ApJ,427,86
Cora,S.A.2006,MNRAS,368,1540
Domainko,W.,Mair,M.,Kapferer,W.,et al.2006,A&A,452,795
Dorman,B.,Arnaud,K.A.,&Gordon,C.A.2003,Bulletin of the
American Astronomical Society,35,641
Durret,F.,Lima Neto,G.B.,&Forman,W.2005,A&A,432,809
Ettori S.,Fabian A.C.,Allen S.W.,Johnstone R.2002,MNRAS,331,
635
Finoguenov A.,Matsushita K.,B¨o hringer H.,Ikebe Y.,Arnaud M.
2002,A&A,381,21
Kaastra,J.S.,Mewe,R.,&Nieuwenhuijzen,H.1996,UV and
X-ray Spectroscopy of Astrophysical and Laboratory Plasmas
:Proceedings of the Eleventh Colloquium on UV and X-ray
...held on May29-June2,1995,Nagoya,Japan.Edited by
K.Yamashita and T.Watanabe.Tokyo:Universal Academy
Press,1996.(Frontiers science series;no.15).,p.411,411
Kapferer,W.,Ferrari,C.,Domainko,W.,et al.2006,A&A,447,827
Kapferer,W.,Kronberger,T.,Weratschnig,J.,et al.2007,A&A,466,
813
Mewe,R.,Gronenschild,E.H.B.M.,&van den Oord,G.H.J.1985,
A&AS,62,197
Mitchell,R.J.,Culhane,J.L.,Davison,P.J.N.,&Ives,J.C.1976,
MNRAS,175,29P
Moll,R.,Schindler,S.,Domainko,W.,et al.2007,A&A,463,513
Mushotzky,R.,The High-redshift Universe:Galaxy Formation and
Evolution at High Redshift,Proceedings of a conference held in
Berkeley,CA,21-24June,1999.ASP Conference Proceedings,
Vol.193,Edited by Andrew J.Bunker and Wil J.M.van Breugel.
ISBN:1-58381-019-6(1999),p.651
Pratt,G.W.,Boehringer,H.,Croston,J.H.,et al.2006,A&A,461,
71
Renzini,A.,Ciotti,L.,D’Ercole,A.,&Pellegrini,S.1993,ApJ,419,
52
Sanders J.S.,Fabian A.C.,Allen S.W.,Schmidt R.W.2004,MNRAS,
349,952
Schindler,S.,Kapferer,W.,Domainko,W.,et al.2005,A&A,435,
L25
Springel,V.,&Hernquist,L.2003,MNRAS,339,289
W.Kapferer et al.:X-ray measured metallicities of the intra-cluster medium7
Fig.8.Three dimensional distribution of the density,temperature and the metallicity of the ICM of model cluster A.
第18章X射线光电子能谱分析 18.1 引言 固体表面分析业已发展为一种常用的仪器分析方法,特别是对于固体材料的分析和元素化学价态分析。目前常用的表面成分分析方法有:X射线光电子能谱(XPS), 俄歇电子能谱(AES),静态二次离子质谱(SIMS)和离子散射谱(ISS)。AES 分析主要应用于物理方面的固体材料科学的研究,而XPS的应用面则广泛得多,更适合于化学领域的研究。SIMS和ISS由于定量效果较差,在常规表面分析中的应用相对较少。但近年随着飞行时间质谱(TOF-SIMS)的发展,使得质谱在表面分析上的应用也逐渐增加。本章主要介绍X射线光电子能谱的实验方法。 X射线光电子能谱(XPS)也被称作化学分析用电子能谱(ESCA)。该方法是在六十年代由瑞典科学家Kai Siegbahn教授发展起来的。由于在光电子能谱的理论和技术上的重大贡献,1981年,Kai Siegbahn获得了诺贝尔物理奖。三十多年的来,X射线光电子能谱无论在理论上和实验技术上都已获得了长足的发展。XPS已从刚开始主要用来对化学元素的定性分析,业已发展为表面元素定性、半定量分析及元素化学价态分析的重要手段。XPS的研究领域也不再局限于传统的化学分析,而扩展到现代迅猛发展的材料学科。目前该分析方法在日常表面分析工作中的份额约50%,是一种最主要的表面分析工具。 在XPS谱仪技术发展方面也取得了巨大的进展。在X射线源上,已从原来的激发能固定的射线源发展到利用同步辐射获得X射线能量单色化并连续可调的激发源;传统的固定式X射线源也发展到电子束扫描金属靶所产生的可扫描式X射线源;X射线的束斑直径也实现了微型化,最小的束斑直径已能达到6μm大小, 使得XPS在微区分析上的应用得到了大幅度的加强。图像XPS技术的发展,大大促进了XPS在新材料研究上的应用。在谱仪的能量分析检测器方面,也从传统的单通道电子倍增器检测器发展到位置灵敏检测器和多通道检测器,使得检测灵敏度获得了大幅度的提高。计算机系统的广泛采用,使得采样速度和谱图的解析能力也有了很大的提高。 由于XPS具有很高的表面灵敏度,适合于有关涉及到表面元素定性和定量分析方面的应用,同样也可以应用于元素化学价态的研究。此外,配合离子束剥离技术和变角XPS技术,还可以进行薄膜材料的深度分析和界面分析。因此,XPS 方法可广泛应用于化学化工,材料,机械,电子材料等领域。 18.2 方法原理 X射线光电子能谱基于光电离作用,当一束光子辐照到样品表面时,光子可以被样品中某一元素的原子轨道上的电子所吸收,使得该电子脱离原子核的束缚,以一定的动能从原子内部发射出来,变成自由的光电子,而原子本身则变成一个激发态的离子。在光电离过程中,固体物质的结合能可以用下面的方程表示: E k = hν- E b - φs (18.1)
第十四章 X射线衍射分析法 14.1概述 X射线衍射法是一种研究晶体结构的分析方法,而不是直接研究试样内含有元素的种类及含量的方法。当X射线照射晶态结构时,将受到晶体点阵排列的不同原子或分子所衍射。X射线照射两个晶面距为d的晶面时,受到晶面的反射,两束反射X光程差2dsinθ是入射波长的整数倍时,即 2dsinθ=nλ (n为整数) 两束光的相位一致,发生相长干涉,这种干涉现象称为衍射,晶体对X 射线的这种折射规则称为布拉格规则。θ称为衍射角(入射或衍射X射线与晶面间夹角)。n相当于相干波之间的位相差,n=1,2…时各称0级、1级、2级……衍射线。反射级次不清楚时,均以n=1求d。晶面间距一般为物质的特有参数,对一个物质若能测定数个d及与其相对应的衍射线的相对强度,则能对物质进行鉴定。 X射线衍射分析方法在材料分析与研究工作中具有广泛的用途。在此主要介绍其在物相分析等方面的应用。 14.1.1 物相定性分析 1.基本原理 组成物质的各种相都具有各自特定的晶体结构(点阵类型、晶胞形状与大小及各自的结构基元等),因而具有各自的X射线衍射花样特征(衍射线位置与强度)。对于多相物质,其衍射花样则由其各组成相的衍射花样简单叠加而成。由此可知,物质的X射线衍射花样特征就是分析物质相组成的“指纹脚印”。制备各种标准单相物质的衍射花样并使之规范化(1969年成立了国际性组织“粉末衍射标准联合会(JCPDS)”,由它负责编辑出版“粉末衍射卡片”,称PDF卡片),将待分析物质(样品)的衍射花样与之对照,从而确定物质的组成相,这就是物相定性分析的基本原理与方法。 2.物相定性分析的基本步骤 (1) 制备待分析物质样品,用衍射仪获得样品衍射花样。 (2) 确定各衍射线条d值及相对强度I/I1值(Il为最强线强度)。 (3) 检索PDF卡片。 PDF卡片检索有三种方式: 1)检索纸纸卡片 物相均为未知时,使用数值索引。将各线条d值按强度递减顺序排列;按三强线条d1、d2、d3的d—I/I1数据查数值索引;查到吻合的条目后,核对八强线的d—I/I1值;当八强线基本符合时,则按卡片编号取出PDF卡片。若按d1、d2、d3顺序查找不到相应条目,则可将d1、d2、d3按不同顺序排列查找。查找索引时,d值可有一定误差范围:一般允许
X射线光电子能谱分析 1 引言 固体表面分析业已发展为一种常用的仪器分析方法,特别是对于固体材料的分析和元素化学价态分析。目前常用的表面成分分析方法有:X射线光电子能谱(XPS), 俄歇电子能谱(AES),静态二次离子质谱(SIMS)和离子散射谱(ISS)。AES分析主要应用于物理方面的固体材料科学的研究,而XPS的应用面则广泛得多,更适合于化学领域的研究。SIMS和ISS由于定量效果较差,在常规表面分析中的应用相对较少。但近年随着飞行时间质谱(TOF-SIMS)的发展,使得质谱在表面分析上的应用也逐渐增加。本章主要介绍X射线光电子能谱的实验方法。 X射线光电子能谱(XPS)也被称作化学分析用电子能谱(ESCA)。该方法是在六十年代由瑞典科学家Kai Siegbahn教授发展起来的。由于在光电子能谱的理论和技术上的重大贡献,1981年,Kai Siegbahn获得了诺贝尔物理奖。三十多年的来,X射线光电子能谱无论在理论上和实验技术上都已获得了长足的发展。XPS已从刚开始主要用来对化学元素的定性分析,业已发展为表面元素定性、半定量分析及元素化学价态分析的重要手段。XPS的研究领域也不再局限于传统的化学分析,而扩展到现代迅猛发展的材料学科。目前该分析方法在日常表面分析工作中的份额约50%,是一种最主要的表面分析工具。 在XPS谱仪技术发展方面也取得了巨大的进展。在X射线源上,已从原来的激发能固定的射线源发展到利用同步辐射获得X射线能量单色化并连续可调的激发源;传统的固定式X射线源也发展到电子束扫描金属靶所产生的可扫描式X射线源;X射线的束斑直径也实现了微型化,最小的束斑直径已能达到6 m 大小, 使得XPS在微区分析上的应用得到了大幅度的加强。图像XPS技术的发展,大大促进了XPS在新材料研究上的应用。在谱仪的能量分析检测器方面,也从传统的单通道电子倍增器检测器发展到位置灵敏检测器和多通道检测器,使得检测灵敏度获得了大幅度的提高。计算机系统的广泛采用,使得采样速度和谱图的解析能力也有了很大的提高。 由于XPS具有很高的表面灵敏度,适合于有关涉及到表面元素定性和定量分析方面的应用,同样也可以应用于元素化学价态的研究。此外,配合离子束剥离技术和变角XPS技术,还可以进行薄膜材料的深度分析和界面分析。因此,XPS方法可广泛应用于化学化工,材料,机械,电子材料等领域。 2 方法原理 X射线光电子能谱基于光电离作用,当一束光子辐照到样品表面时,光子可以被样品中某一元素的原子轨道上的电子所吸收,使得该电子脱离原子核的束缚,以一定的动能从原子内部发射出来,变成自由的光电子,而原子本身则变成
第十四章 X-射线光电子能谱法 14.1 引言 X-射线光电子谱仪(X-ray Photoelectron Spectroscopy,简称为XPS),经常又被称为化学分析用电子谱(Electron Spectroscopy for Chemical Analysis,简称为ESCA),是一种最主要的表面分析工具。自19世纪60年代第一台商品化的仪器开始,已经成为许多材料实验室的必不可少的成熟的表征工具。XPS发展到今天,除了常规XPS外,还出现了包含有Mono XPS (Monochromated XPS, 单色化XPS,X射线源已从原来的激发能固定的射线源发展到利用同步辐射获得X射线能量单色化并连续可调的激发源), SAXPS ( Small Area XPS or Selected Area XPS, 小面积或选区XPS,X射线的束斑直径微型化到6μm) 和iXPS(imaging XPS, 成像XPS)的现代XPS。目前,世界首台能量分辨率优于1毫电子伏特的超高分辨光电子能谱仪(通常能量分辨率低于1毫电子伏特)在中日科学家的共同努力下已经研制成功,可以观察到化合物的超导电子态。现代XPS拓展了XPS的内容和应用。 XPS是当代谱学领域中最活跃的分支之一,它除了可以根据测得的电子结合能确定样品的化学成份外,XPS最重要的应用在于确定元素的化合状态。XPS可以分析导体、半导体甚至绝缘体表面的价态,这也是XPS的一大特色,是区别于其它表面分析方法的主要特点。此外,配合离子束剥离技术和变角XPS技术,还可以进行薄膜材料的深度分析和界面分析。XPS表面分析的优点和特点可以总结如下: ⑴固体样品用量小,不需要进行样品前处理,从而避免引入或丢失元素所造成的错误分析 ⑵表面灵敏度高,一般信息采样深度小于10nm ⑶分析速度快,可多元素同时测定 ⑷可以给出原子序数3-92的元素信息,以获得元素成分分析 ⑸可以给出元素化学态信息,进而可以分析出元素的化学态或官能团 ⑹样品不受导体、半导体、绝缘体的限制等 ⑺是非破坏性分析方法。结合离子溅射,可作深度剖析 目前,XPS主要用于金属、无机材料、催化剂、聚合物、涂层材料、纳米材料、矿石等各种材料的研究,以及腐蚀、摩擦、润滑、粘接、催化、包覆、氧化等过程的研究,也可以用于机械零件及电子元器件的失效分析,材料表面污染物分析等。 14.2 基本原理 XPS方法的理论基础是爱因斯坦光电定律。用一束具有一定能量的X射线照射固体样品,入射光子与样品相互作用,光子被吸收而将其能量转移给原子的某一壳层上被束缚的电子,此时电子把所得能量的一部分用来克服结合能和功函数,余下的能量作为它的动能而发射出来,成为光电子,这个过程就是光电效应。 该过程可用下式表示: hγ=E k+E b+E r(14.1) 式中: hγ:X光子的能量(h为普朗克常数,γ为光的频率);
(一) γ射线能谱的测量 摘要: 本实验将了解闪烁探测器谱仪的工作原理及其使用;学习分析实验测量的137Cs 和60Co γ谱之谱形和γ射线能谱的刻度测定谱仪的能量分辨率,本实验的目的是了解NaI(Tl)闪烁谱仪的原理、特性与结构,掌握NaI(Tl)闪烁谱仪的使用方法和γ射线能谱的刻度。 关键词:γ 射线 Na(Tl)闪烁探测器 能谱图 单道脉冲幅度分析器 引言: 闪烁探测器是利用某些物质在射线作用下会发光的特性来探测射线的仪器。它的主要优点是:既能探测各种带电粒子,又能探测中性粒子;既能测量粒子强度,又能测量粒子能量;且探测效率高,分辨时间短。它在核物理研究和放射性同位素测量中得到广泛的应用。核物理的发展,不断地为核能装置的设计提供日益精确的数据,新的核技术,如核磁共振、穆斯堡尔谱学、晶体的沟道效应和阻塞效应,以及扰动角关联技术等都迅速得到应用。核技术的广泛应用已成为现代化科学技术的标志之 正 文: 实验原理 1.闪烁谱仪结构与工作原理 NaI(Tl)闪烁谱仪结构如图。整个仪器由探头(包括闪烁体、光电倍增管、射极跟随器),高压电源,线性放大器、多道脉冲幅度分析器几部分组成。射线通过闪烁体时,闪烁体的发光强度与射线在闪烁体内损失的能量成正比。带电粒子(如α、β粒子)通过闪烁体时,将引起大量的分子或原子的激发和电离,这些受激的分子或原子由激发态回到基态时就放出光子;不带电的γ射线先在闪烁体内产生光电子、康普顿电子及正、负电子对(当Eγ>1.02MeV时),然后这些电子使闪烁体内的分子或原子激发和电离而发光。闪烁体发出的光子被闪烁体外的光反射层反射,会聚到光电倍增管的光电阴极上,打出光电子。光阴极上打出的光电子在光电倍增管中倍增出大量电子,最后为阳极吸收形成电压脉冲。每产生一个电压脉冲就表示有一个粒子进入探测器。由于电压脉冲幅度与粒子在闪烁体内消耗的能量(产生的光强)成正比,所以根据脉冲幅度的大小可以确定入射粒子的能量。利用脉冲幅度分析器可以测定入射射线的能谱。 由原子物理学中可知γ射线与物质的相互作用主要是光电效应、康普顿效应和正、负电子对产生这三种过程分别如下: (1)光电效应。入射γ粒子把能量全部转移给原子中的束缚电子,而把束缚电子打出来形成光电子。由于束缚电子的电离能E1一般远小于入射γ射线能量Eγ,所以光电子的动能近似等于入射γ射线的能量E光电=Eγ-E1≈Eγ (2)康普顿效应。核外电子与入射γ射线发生康普顿散射,设入射γ光子能量为h,散射
地理时间计算部分专题练习 1、9月10日在全球所占的围共跨经度90°,则时间为:( ) A. 10日2时 B. 11日2时 C. 10日12时 D. 11日12时 3、时间为2008年3月1日的2点,此时与处于同一日期的地区围约占全球的:( ) A. 一半 B. 三分之一 C. 四分之一 D. 五分之一 4、图中两条虚线,一条是晨昏线,另一条两侧大部分地区日期不同,此时地球公转速度较慢。若图中的时间为7日和8日,甲地为( ) A.7日4时 B.8日8时 C.7月8时 D.8月4时 2004年3月22日到4月3日期间,可以看到多年一遇的“五星连珠”天象奇观。其中水星是最难一见的行星,观察者每天只有在日落之后的1 小时才能看到它。图中阴影部分表示黑夜,中心点为极地。回答5—7题 5.图4中①②③④四地,可能看到“五星连珠”现象的是( ) A .① B .② C .③ D .④ 6.在新疆的吐鲁番(约890 E )观看五星连珠现象,应该选择的时间段(时间)是( ) A .18时10分至19时 B .16时10分至17时 C .20时10分至21时 D.21时10分至22时 7.五星连珠中,除了水星外,另外四颗星是( ) A .金星、木星、土星、天狼星 B .金星、火星、木星、海王星 C .火星、木星、土星、天王星 D .金星、火星、土星、木星 (2002年)下表所列的是12月22日甲、乙、丙、丁四地的白昼时间,根据表中数据回答下8-10题。 甲地 乙地 丙地 丁地 白昼长 5∶30 9∶09 11∶25 13∶56 8、四地中属于南半球的是( ) A.甲地 B.乙地 C.丙地 D.丁地 9、四地所处纬度从高到低顺序排列的是( ) A.甲乙丙丁 B.甲乙丁丙 C.丙丁乙甲 D.丁丙乙甲 10、造成四起白昼时间差异的主要因素是( ) ①地球的公转 ②地球自转 ③黄赤交角的存在 ④地方时的不同 A.①② B.②③ C.③④ D.①③ 2002年1月1日,作为欧洲联盟统一货币的欧元正式流通,这将对世界金融的整体格局产生重要影响。回 答4-5题: 11、假定世界各金融市场均在当地时间上午9时开市,下午5时闭市。如果某投资者上午9时在法兰克福(东经8.50 )市场买进欧元,12小时后欧元上涨,投资者想尽快卖出欧元,选择的金融市场应位于:( ) A.东京(东经139.50 ) B.(东经1140 ) C.伦敦 D.纽约(西经740 ) ① ④ ② ③
第二十三章 X射线光电子能谱 1954年以瑞典Siegbahn教授为首的研究小组观测光峰现象,不久又发现了原子内层电子能级的化学位移效应,于是提出了ESCA(化学分析电子光谱学)这一概念。由于这种方法使用了铝、镁靶材发射的软X射线,故也称为X-光电子能谱(X-ray Photoelectron Spectroscopy)。X光电子能谱分析技术已成为表面分析中的常规分析技术,目前在催化化学、新材料研制、微电子、陶瓷材料等方面得到了广泛的应用。 23.1 基本原理 固体表面分析,特别是对固体材料的分析和元素化学价态分析,已发展为一种常用的仪器分析方法。目前常用的表面成分分析方法有:X射线光电子能谱(XPS), 俄歇电子能谱(AES),静态二次离子质谱(SIMS)和离子散射谱(ISS)。AES分析主要应用于物理方面的固体材料(导电材料)的研究,而XPS的应用面则广泛得多,更适合于化学领域的研究。SIMS 和ISS由于定量效果较差,在常规表面分析中的应用相对较少。但近年随着飞行时间二次离子质谱(TOF-SIMS)的发展,使得质谱在表面分析上的应用也逐渐增加。 X射线光电子能谱最初是由瑞典科学家K.Siegbahn等经过约20年的努力而建立起来的,因在化学领域的广泛应用,被称为化学分析用电子能谱(ESCA)。由于最初的光源采用了铝、镁等的特性软X射线,该技术又称为X射线光电子能谱(XPS)。1962年,英国科学家D.W.Turner等建造出以真空紫外光作为光源的光电子能谱仪,在分析分子内价电子的状态方面获得了巨大成功,同时又用于固体价带的研究,与X射线光电子能谱相对照,该方法称为紫外光电子能谱(UPS) XPS的原理是基于光的电离作用。当一束光子辐射到样品表面时,样品中某一元素的原子轨道上的电子吸收了光子的能量,使得该电子脱离原子的束缚,以一定的动能从原子内部发射出来,成为自由电子,而原子本身则变成处于激发态的离子,如图23-1所示。在光电离过程中,固体物质的结合能可用下面的方程式表示: E b=hγ- E k -φs(23-1) 式中: E k为射出的光子的动能;hγ为X射线源的能量;E b为特定原子轨道上电子的电离能或结合能(电子的结合能是指原子中某个轨道上的电子跃迁到表面Fermi能级(费米能级)所需要的能量);φs为谱仪的功函数。 由于φs是由谱仪的材料和状态决定,对同一台谱仪来说是一个常数,与样品无关,其平均值为3 eV ~4eV。因此,(1)式可简化为: E b =hγ- E k’ (23-2) 由于E k’可以用能谱仪的能量分析器检出,根据式(23-2)就可以知道E b。在XPS分析中,由于X射线源的能量较高,不仅能激发出原子轨道中的价电子,还可以激发出内层轨道电子,所射出光子的能量仅与入射光子的能量及原子轨道有关。因此,对于特定的单色激发光源及特定的原子轨道,其光电子的能量是特征性的。当固定激发光源能量时,其光子的能量仅与元素的种类和所电离激发的原子轨道有关,对于同一种元素的原子,不同轨道上的电子的结合能不同。所以可用光电子的结合能来确定元素种类。图23-1表示固体材料表面受X射线激发后的光电离过程[1]。
一、X光电子能谱分析的基本原理 X光电子能谱分析的基本原理:一定能量的X光照射到样品表面,和待测物质 发生作用,可以使待测物质原子中的电子脱离原子成为自由电子。该过程可用 下式表示: hn=Ek+Eb+Er (1) 其中:hn:X光子的能量;Ek:光电子的能量;Eb:电子的结合能;Er:原子的 反冲能量。其中Er很小,可以忽略。 对于固体样品,计算结合能的参考点不是选真空中的静止电子,而是选用费米 能级,由内层电子跃迁到费米能级消耗的能量为结合能Eb,由费米能级进入真 空成为自由电子所需的能量为功函数Φ,剩余的能量成为自由电子的动能Ek,式(1)又可表示为: hn=Ek+Eb+Φ(2) Eb=hn-Ek-Φ(3)仪器材料的功函数Φ是一个定值,约为 4 eV,入射X光子能量已知,这样, 如果测出电子的动能Ek,便可得到固体样品电子的结合能。各种原子,分子的 轨道电子结合能是一定的。因此,通过对样品产生的光子能量的测定,就可以 了解样品中元素的组成。元素所处的化学环境不同,其结合能会有微小的差别,这种由化学环境不同引起的结合能的微小差别叫化学位移,由化学位移的大小 可以确定元素所处的状态。例如某元素失去电子成为离子后,其结合能会增加,如果得到电子成为负离子,则结合能会降低。因此,利用化学位移值可以分析 元素的化合价和存在形式。 二、电子能谱法的特点 (1)可以分析除H和He以外的所有元素;可以直接测定来自样品单个能级光电 发射电子的能量分布,且直接得到电子能级结构的信息。(2)从能量范围看,如果把红外光谱提供的信息称之为“分子指纹”,那么电子能谱提供的信息可称 作“原子指纹”。它提供有关化学键方面的信息,即直接测量价层电子及内层 电子轨道能级。而相邻元素的同种能级的谱线相隔较远,相互干扰少,元素定 性的标识性强。 (3)是一种无损分析。 (4)是一种高灵敏超微量表面分析技术,分析所需试样约10-8g即可,绝对灵敏
【干货】玩转XPS丨案例解析X射线光电子能谱(XPS)八大应用! 表面分析技术 (Surface Analysis)是对材料外层(the Outer-Most Layers of Materials (<100nm))的研究的技术。 X射线光电子能谱简单介绍 XPS是由瑞典Uppsala大学的K. Siegbahn及其同事历经近20年的潜心研究于60年代中期研制开发出的一种新型表面分析仪器和方法。鉴于K. Siegbahn教授对发展XPS领域做出的重大贡献,他被授予1981年诺贝尔物理学奖。 X射线激发光电子的原理 XPS现象基于爱因斯坦于1905年揭示的光电效应,爱因斯坦由于这方面的工作被授予1921年诺贝尔物理学奖; X射线是由德国物理学家伦琴(Wilhelm Conrad R?ntgen,l845-1923)于1895年发现的,他由此获得了1901年首届诺贝尔物理学奖。
X射线光电子能谱(XPS ,全称为X-ray Photoelectron Spectroscopy)是一种基于光电效应的电子能谱,它是利用X射线光子激发出物质表面原子的内层电子,通过对这些电子进行能量分析而获得的一种能谱。 这种能谱最初是被用来进行化学分析,因此它还有一个名称,即化学分析电子能谱(ESCA,全称为Electron Spectroscopy for Chemical Analysis)。XPS谱图分析中原子能级表示方法 XPS谱图分析中原子能级的表示用两个数字和一个小字母表示。例如:3d5/2(1)第一个数字3代表主量子数(n); (2)小写字母代表角量子数; (3)右下角的分数代表内量子数j
X射线能谱分析简介 导言: 早在二十世纪年代中期就开始了X射线能谱分析课题的研究。例如,Parrish和Kohler(1956)曾指出用分解正比计数器脉冲高度谱的方法进行X射线能量分析的可能性。后来Dolby(1959、1960)发展了这种方法并且获得了Be、C、O等超轻元素的扫描X射线图像。同年,Duncumb提出一种用纯元素的标准谱拟合实际谱进行分析的方法。而Birks等人用正比计数器和一台400道多道分析器配合,在电子探针中首次进行了能谱分析。到了1968年,Fitzgerald、Keil和Heinrich等人开始把锂漂移硅探测器用到了电子探针中。 由于锂漂移硅探测器有一些独到的优点,得到了有关专家的广泛重视。在1963年和1970年,美国材料试验学会先后两次就能谱分析技术进行了专门的讨论,促进了能谱技术的发展。例如,在1966年,锂漂移硅探测器的能量分辨率还只能达到约800eV,但是到了1970年,就迅速提高到约150eV。探测器分辨率的提高,反过来促进了能谱分析方法及其相关技术的迅速发展。 目前,能谱分析系统已成为电子探针和扫描电镜/透射电镜微区分析的一项标准设备,同时与其相关的波谱分析、电子被散射衍射等有机结合,愈来愈成为微区分析中不可或缺的分析手段。 锂漂移硅探测器简述: 能谱分析系统的心脏是一只硅晶体二极管,它是由一块p型硅晶片经锂(向硅中)扩散和飘移后制成的,因此称为锂漂移硅探测器
(Lithium Drifted Silicon Detector),通常缩写为Si(Li)探测器。 我们知道硅是一种典型的半导体材料。硅晶体的结晶结构与金刚石结构相同,即为面心立方体结构,每个晶胞含有两个硅原子,每个硅原子有四个价电子(两个3s电子,两个3p电子)。在晶体中,每个原子与相邻四个原子构成四条共价键。根据能带理论,四个价电子形成四个能带,由于每个格点上有8个价电子,因此,如果格点数为N,则四个能带上将填满8N个电子,这种能带称为满带。满带的上方有一个能隙,称为禁带,禁带中不可能有任何电子,或者说,不可能存在其能量相当于禁带能量的电子。在禁带上面有很多可能的能带-----导带。在纯净而完整的晶体中,导带中没有电子,因此呈绝缘体特性。但是,即使纯度非常高的硅单晶,仍有极少量的杂质存在,而且难免有些晶格缺陷,加上硅的禁带宽度较小(~1.1eV),在热骚动下可能有极少量的电子进入导带,因此硅晶体有一定程度的导电性。温度愈高,由于热骚动而进入导带的电子愈多,晶体的导电性就愈强,因而使硅晶体成为一种典型的半导体。 半导体的导电率取决于杂质的类型和含量。杂质的作用是这样的:假如有一种五价杂质(P,As等)参入硅中,它将取代硅原子的位置,用四个价电子与相邻的四个硅原子结合而维持原来的四条共价键,并把多余的一个电子释放出去,被释放的电子很可能进入导带,使晶体呈电子性导电,这种晶体就称为n型半导体。如果掺入的杂质是三价原子,那么这些杂质将会俘获满带中的电子而使满带中出现空穴,从而使晶体成为p型半导体。在硅中常见的一种杂质是硼(B),它的
小学三年级数学《简单的时间计算》教案范文三篇时间计算是继二十四时计时法的学习之后安排的一个内容。下面就是小编给大家带来的小学三年级数学《简单的时间计算》教案范文,欢迎大家阅读! 教学目标: 1、利用已学的24时记时法和生活中对经过时间的感受,探索简单的时间计算方法。 2、在运用不同方法计算时间的过程中,体会简单的时间计算在生活中的应用,建立时间观念,养成珍惜时间的好习惯。 3、进一步培养课外阅读的兴趣和多渠收集信息的能力。 教学重点: 计算经过时间的思路与方法。 教学难点: 计算从几时几十分到几时几十分经过了多少分钟的问题。 教学过程: 一、创设情景,激趣导入 1、谈话:小朋友你们喜欢过星期天吗?老师相信我们的星期天都过得很快乐!明明也有一个愉快的星期天,让我们一起来看看明明的一天,好吗? 2、小黑板出示明明星期天的时间安排。 7:10-7:30 起床、刷牙、洗脸; 7:40-8:20 早锻炼; 8:30-9:00 吃早饭; 9:00-11:00 看书、做作业 …… 3、看了刚才明明星期天的时间安排,你知道了什么?你是怎么知道的?你还想知道什么?
二、自主探究,寻找方法 1、谈话:小明在星期天做了不少的事,那你知道小明做每件事情用了多少时间吗?每 个小组从中选出2件事情计算一下各用了多少时间。 (1)分组学习。 (2) 集体交流。 2、根据学生的提问顺序学习时间的计算。从整时到整时经过时间的计算。 (1)学生尝试练习9:00-11:00明明看书、做作业所用的时间。 (2)交流计算方法:11时-9时=2小时。 3、经过时间是几十分钟的时间计算。 (1)明明从7:40到8:20进行早锻炼用了多少时间呢? 出示线段图。 师:7:00-8:00、8:00-9:00中间各分6格,每格表示10分钟,两个线段下边 的箭头分别指早锻炼开始的时间和结束的时间,线段图涂色部分表示早锻炼的时间。谈话:从图上看一看,从7时40分到8时经过了多少分钟?(20分)从8时到8时20分又经过 了多少时间?所以一共经过了多少分钟。(20+20=40分)小朋友们,如果你每天都坚持锻炼 几十分钟,那你的身体一定会棒棒的。 (2)你还能用别的方法计算出明明早锻炼的时间吗?(7:40-8:40用了一个小时,去掉 多算的20分,就是40分。或者7:20-8:20用了1个小时,去掉多算的20分,就是 40分。) (3)练习:找出明明的一天中做哪些事情也用了几十分钟? 你能用自己喜欢的方法计算出明明做这几件事情用了几十分钟吗?你是怎么算的? 三、综合练习,巩固深化 1、想想做做1:图书室的借书时间。你知道图书室每天的借书时间有多长吗? 学生计算。 (1)学生尝试练习,交流计算方法。 (2)教师板书。 2、想想做做2。 (1)学生独立完成。 (2)全班交流。
X射线衍射分析 摘要: X射线衍射分析是一种重要的晶体结构和物相分析技术,广泛应用于冶金、石油、化工、科研、航空航天、教学、材料生产等领域。本文简要介绍X射线衍射原理,X射线衍射仪器的结构、原理,及其在地质学、医学等自然科学领域中的应用。 前言: 1895年伦琴发现X射线,又称伦琴射线。德国科学家劳厄于1912年发现
了X射线衍射现象,并推导出劳厄晶体衍射公式。随后,英国布拉格父子又将此衍射关系用简单的布拉格方程表示出来。到上世纪四、五十年代,X射线衍射的原理、方法及在其他各方面的应用逐渐建立。在各种测量方法中,X射线衍射方法具有不损伤样品、无污染、快捷、测量精度高、能得到有关晶体完整性的大量信息等优点。X射线衍射技术可以探究晶体存在的普遍性和特殊性能,使得其在冶金、石油、岩石矿物、科研、航空航天、材料生产等领域的被广泛应用。 关键词:方法,衍射,原理,应用 X射线衍射仪的原理 1.X射线衍射原理 当X射线沿某方向入射某一晶体的时候,晶体中每个原子的核外电子产生的相干波彼此发生干涉。当每两个相邻波源在某一方向的光程差等于波长λ的整数倍时,它们的波峰与波峰将互相叠加而得到最大限度的加强,这种波的加强叫做衍射,相应的方向叫做衍射方向,在衍射方向前进的波叫做衍射波。光程差为0的衍射叫零级衍射,光程差为λ的衍射叫一级衍射,光程差为nλ的衍射叫n级衍射。n不同,衍射方向的也不同。 由于常用的X射线波长约在2.5A~0.5A之间,与晶体中的原子间距(1A)数量级相同,因此可以用晶体作为X射线的衍射光栅,这就使得用X射线衍射进行晶体结构分析成为可能。 在晶体的点阵结构中,具有周期性排列的原子或电子散射的次生X射线间相互干涉的结果,决定了X射线在晶体中衍射的方向,所以通过对衍射方向的测定,可以得到晶体的点阵结构、晶胞大小和形状等信息。 晶体结构=点阵+结构基元,点阵又包括直线点阵,平面点阵和空间点阵。在x 射线作用下晶体的散射线来自若干层原子面,除同一层原子面的散射线互相干涉外,各原子面的散射线之间还要互相干涉。 光栅衍射 当光程差(BD+BF)=2dsinθ等于波长的整数倍nλ时,相邻原子面散射波干涉加强,即干涉加强条件为: 2dsinθ=nλ 一、X射线衍射法
三.X 射线衍射的基本原理 3.1 Bragg 公式 晶体的空间点阵可划分为一族平行而等间距的平面点阵,两相邻点阵平面的间距为d hkl 。晶体的外形中每个晶面都和一族平面点阵平行。 当X 射线照射到晶体上时,每个平面点阵都对X 射线射产生散射。取晶体中任一相邻晶面P 1和P 2,如图3.1所示。两晶面的间距为d ,当入射X 射线照射到此晶面上时,入射角为θ,散射X 射线的散射角也同样是θ。这两个晶面产生的光程差是: θsin 2d OB AO =+=? 3.1 当光程差为波长λ 的整数倍时,散射的X 射线将相互加强,即衍射: λθn d hkl =sin 2 3.2 上式就是著名的Bragg 公式。也就是说,X 射线照射到晶体上,当满足Bragg 公式就产生衍射。式中:n 为任意正整数,称为衍射级数。入射X 射线的延长线与衍射X 射线的夹角为2θ(衍射角)。为此,在X 射线衍射的谱图上,横坐标都用2θ 表示。 图3.1 晶体对X 射线的衍射 由Bragg 公式表明:d hkl 与θ 成反比关系,晶面间距越大,衍射角越小。晶面间距的变化直接反映了晶胞的尺寸和形状。每一种结晶物质,都有其特定的结构参数,包括点阵类型、晶胞大小等。晶体的衍射峰的数目、位置和强度,如同人的指纹一样,是每种物质的特征。尽管物质的种类有成千上万,但几乎没有两种衍射谱图完全相同的物质,由此可以对物质进行物相的定性分析。
3.2 物相分析 物相的定义是物质存在的状态,如同素异构体SiO2、TiO2分别有22种和5种晶体结构。除了单质元素构成的物质如铜、银等以外,X射线衍射分析的是物相(或化合物),而不是元素成分。 对于未知试样,为了了解和确定哪些物相时,需要定性的物相分析。 正如前述,晶体粉末衍射谱图,如人的指纹一样,有它本身晶体结构特征所决定。因而,国际上有一个组织——粉末衍射标准联合会(JCPDS)后改名为JCPDS-衍射数据国际中心专门负责收集、校订、编辑和发行粉末衍射卡片(PDF)的工作。自1941年以来,共发行衍射卡片近20万个。为了使大量的卡片方便进行人工物相鉴定,还出版了对这些卡片进行检索的索引。PDF卡片的标准形式如图3.2所示,对应此图编号的内容说明如表3.1所示。 图 图3.2 PDF卡片的标准形式 每一张卡片上不一定包括表3.1所述的所有内容,但有效数据都将一一列出。 物相分析的方法就是将未知试样与标准卡片上数据进行对比,由此来确定物相。先测试未知试样,然后按图3.3所示的步骤从PDF索引中查找。找出该物相的卡片号后,按卡片号查该物相的卡片,仔细核对后再判定该物相。
X射线衍射分析 1 实验目的 1、了解X衍射的基本原理以及粉末X衍射测试的基本目的; 2、掌握晶体和非晶体、单晶和多晶的区别; 3、了解使用相关软件处理XRD测试结果的基本方法。 2 实验原理 1、晶体化学基本概念 晶体的基本特点与概念:①质点(结构单元)沿三维空间周期性排列(晶体定义),并有对称性。②空间点阵:实际晶体中的几何点,其所处几何环境和物质环境均同,这些“点集”称空间点阵。 ③晶体结构=空间点阵+结构单元。非晶部分主要为无定形态区域,其内部原子不形成排列整齐有规律的晶格。 对于大多数晶体化合物来说,其晶体在冷却结晶过程中受环境应力或晶核数目、成核方式等条件的影响,晶格易发生畸变。分子链段的排列与缠绕受结晶条件的影响易发生改变。晶体的形成过程可分为以下几步:初级成核、分子链段的 图1 14种Bravais 点阵 表面延伸、链 松弛、链的重吸收 页脚内容1
结晶、表面成核、分子间成核、晶体生长、晶体生长完善。Bravais提出了点阵空间这一概念,将其解释为点阵中选取能反映空间点阵周期性与对称性的单胞,并要求单胞相等棱与角数最多。满足上述条件棱间直角最多,同时体积最小。1848年Bravais证明只有14种点阵。 晶体内分子的排列方式使晶体具有不同的晶型。通常在结晶完成后的晶体中,不止含有一种晶型的晶体,因此为多晶化合物。反之,若严格控制结晶条件可得单一晶型的晶体,则为单晶。 2、X衍射的测试基本目的与原理 X射线是电磁波,入射晶体时基于晶体结构的周期性,晶体中各个电子的散射波可相互干涉。散射波周相一致相互加强的方向称衍射方向。衍射方向取决于晶体的周期或晶胞的大小,衍射强度是由晶胞中各个原子及其位置决定的。由倒易点阵概念导入X射线衍射理论, 倒易点落在Ewald 球上是产生衍射必要条件。 1912年劳埃等人根据理论预见,并用实验证实了X射线与晶体相遇时能发生衍射现象,证明了X射线具有电磁波的性质,成为X射线衍射学的第一个里程碑。当一束单色X射线入射到晶体时,由于晶体是由原子规则排列成的晶胞组成,这些规则排列的原子间距离与入射X射线波长有相同数量级,故由不同原子散射的X射线相互干涉,在某些特殊方向上产生强X射线衍射,衍射线在空间分布的方位和强度,与晶体结构密切相关。这就是X射线衍射的基本原理。衍射线空间方位与晶体结构的关系可用布拉格方程表示: θn λ d= 2 sin 式中d为晶面间距;n为反射级数;θ为掠射角;λ为X射线的波长。布拉格方程是X射线衍射分析的根本依据。 X 射线衍射(XRD)是所有物质,包括从流体、粉末到完整晶体,重要的无损分析工具。对材料学、物理学、化学、地质、环境、纳米材料、生物等领域来说,X射线衍射仪都是物质结构表征,以性能为导向研制与开发新材料,宏观表象转移至微观认识,建立新理论和质量控制不可缺少的方法。其主要分 页脚内容2
一X射线衍射仪工作原理 X射线是利用衍射原理,精确测定物质的晶体结构,织构及应力。对物质进行物相分析、定性分析、定量分析。广泛应用于冶金、石油、化工、科研、航空航天、教学、材料生产等领域。 特征X射线是一种波长很短(约为20~0.06nm)的电磁波,能穿透一定厚度的物质,并能使荧光物质发光、照相乳胶感光、气体电离。在用电子束轰击金属“靶”产生的X射线中,包含与靶中各种元素对应的具有特定波长的X射线,称为特征(或标识)X射线。考虑到X 射线的波长和晶体内部原子间的距离相近,1912年德国物理学家劳厄(M.von Laue)提出一个重要的科学预见:晶体可以作为X射线的空间衍射光,即当一束X射线通过晶体时将发生衍射,衍射波叠加的结果使射线的强度在某些方向上加强,在其他方向上减弱。分析在照相底片上得到的衍射花样,便可确定晶体结构。这一预见随即为实验所验证。1913年英国物理学家布拉格父子(W. H. Bragg, W. .L Bragg)在劳厄发现的基础上,不仅成功地测定了NaCl、KCl等的晶体结构,并提出了作为晶体衍射基础的著名公式──布拉格定律: θn λ 2, sin d= 式中λ为X射线的波长,n为任何正整数。当X射线以掠角θ(入射角的余角,又称为布拉格角)入射到某一点阵晶格间距为d的晶面面上时,在符合上式的条件下,将在反射方向上得到因叠加而加强的衍射线。 二,X射线衍射的应用 1、当X射线波长λ已知时(选用固定波长的特征X射线),采用细粉末或细粒多晶体的线状样品,可从一堆任意取向的晶体中,从每一θ角符合布拉格条件的反射面得到反射。测出θ后,利用布拉格公式即可确定点阵平面间距d、晶胞大小和晶胞类型; 2、利用X射线结构分析中的粉末法或德拜-谢乐(Debye—Scherrer)法的理论基础,测定衍射线的强度,就可进一步确定晶胞内原子的排布。 3、而在测定单晶取向的劳厄法中所用单晶样品保持固定不变动(即θ不变),以辐射线束的波长λ作为变量来保证晶体中一切晶面都满足布拉格条件,故选用连续X射线束。再把结构已知晶体(称为分析晶体)用来作测定,则在获得其衍射线方向θ后,便可计算X射线的波长λ,从而判定产生特征X射线的元素。这便是X射线谱术,可用于分析金属和合金的成分 4、X射线衍射在金属学中的应用: X射线衍射现象发现后,很快被用于研究金属和合金的晶体结构,已经成为研究晶体物质和某些非晶态物质微观结构的有效方法。 (1)物相分析是X射线衍射在金属中用得最多的方面,又分为定性分析和定量分析。定性分析是把对待测材料测得的点阵平面间距及衍射强度与标准物相的衍射数据进行比较,以确定材料中存在的物相;定量分析则根据衍射花样的强度,确定待测材料中各相的比例含量。(2)精密测定点阵参数常用于相图的固态溶解度曲线的绘制。溶解度的变化往往引起点阵常数的变化;当达到溶解限后,溶质的继续增加引起新相的析出,不再引起点阵常数的变化。这个转折点即为溶解限。另外点阵常数的精密测定可获得单位晶胞原子数,从而可确定固溶体类型;还可以计算出密度、膨胀系数等有用的物理常数。 (3)取向分析包括测定单晶取向和多晶的结构(如择优取向)。测定硅钢片的取向就是一例。另外,为研究金属的范性形变过程,如孪生、滑移、滑移面的转动等,也与取向的测定有关。
中国古代时间的计算方法(1) 现时每昼夜为二十四小时,在古时则为十二个时辰。当年西方机械钟表传入中国,人们将中西时点,分别称为“大时”和“小时”。随着钟表的普及,人们将“大时”忘淡,而“小时”沿用至今。 古时的时(大时)不以一二三四来算,而用子丑寅卯作标,又分别用鼠牛虎兔等动物作代,以为易记。具体划分如下:子(鼠)时是十一到一点,以十二点为正点;丑(牛)时是一点到三点,以两点为正点;寅(虎)时是三点到五点,以四点为正点;卯(兔)时是五点到七点,以六点为正点;辰(龙)时是七点到九点,以八点为正点;巳(蛇)时是九点到十一点,以十点为正点;午(马)时是十一点到一点,以十二点为正点;未(羊)时是一点到三点,以两点为正点;申(猴)时是三点到五点,以四点为正点;酉(鸡)时是五点到七点,以六点为正点;戌(狗)时是七点到九点,以八点为正点;亥(猪)时是九点到十一点,以十点为正点。 古人说时间,白天与黑夜各不相同,白天说“钟”,黑夜说“更”或“鼓”。又有“晨钟暮鼓”之说,古时城镇多设钟鼓楼,晨起(辰时,今之七点)撞钟报时,所以白天说“几点钟”;暮起(酉时,今之十九点)鼓报时,故夜晚又说是几鼓天。夜晚说时间又有用“更”的,这是由于巡夜人,边巡行边打击梆子,以点数报时。全夜分五个更,第三更是子时,所以又有“三更半夜”之说。 时以下的计量单位为“刻”,一个时辰分作八刻,每刻等于现时的十五分钟。旧小说有“午时三刻开斩”之说,意即,在午时三刻钟(差十五分钟到正午)时开刀问斩,此时阳气最盛,阴气即时消散,此罪大恶极之犯,应该“连鬼都不得做”,以示严惩。阴阳家说的阳气最盛,与现代天文学的说法不同,并非是正午最盛,而是在午时三刻。古代行斩刑是分时辰开斩的,亦即是斩刑有轻重。一般斩刑是正午
竭诚为您提供优质文档/双击可除 excel表格日期计算 篇一:excel中几个时间计算公式 假设b2为生日 =datedif(b2,today(),"y") datediF函数,除excel2000中在帮助文档有描述外,其他版本的excel在帮助文档中都没有说明,并且在所有版本的函数向导中也都找不到此函数。但该函数在电子表格中确实存在,并且用来计算两个日期之间的天数、月数或年数很方便。微软称,提供此函数是为了与lotus1-2-3兼容。 该函数的用法为 “datediF(start_date,end_date,unit)”,其中start_date 为一个日期,它代表时间段内的第一个日期或起始日期。end_date为一个日期,它代表时间段内的最后一个日期或结束日期。unit为所需信息的返回类型。 “y”为时间段中的整年数,“m”为时间段中的整月数,“d”时间段中的天数。“md”为start_date与end_date日期中天数的差,可忽略日期中的月和年。“ym”为start_date 与end_date日期中月数的差,可忽略日期中的日和年。“yd”
为start_date与end_date日期中天数的差,可忽略日期中的年。比如,b2单元格中存放的是出生日期(输入年月日时,用斜线或短横线隔开),在c2单元格中输入 “=datedif(b2,today(),"y")”(c2单元格的格式为常规),按回车键后,c2单元格中的数值就是计算后的年龄。此函数在计算时,只有在两日期相差满12个月,才算为一年,假如生日是20xx年2月27日,今天是20xx年2月28日,用此函数计算的年龄则为0岁,这样算出的年龄其实是最公平的。 身份证号提取年龄 =datediF(--text((len(a1)=15)*19”即可获得当时的日期时间; 2、使用公式:用=now()而非=date(),=date()只有日期,然后进行菜单“工具->选项”,选择“重新计算”页,选中“人工重算”,勾不勾选“保存前自动重算”看自己的需要和想法了,如果勾选了,那日期时间那总是最后一次保存的日期时间,不勾选的话,如果你的表格中有公式记得准备存前按F9 篇二:excel中如何计算两个日期之间的月数 excel中如何计算两个日期之间的月数