190Tiihonen-PRN2008
- 格式:pdf
- 大小:738.50 KB
- 文档页数:12


派克汉尼汾公司版权所有未经许可不能摘录,翻印。
保留修改权利2021年6月警告销售条件本样本中产品和/或系统或相关产品出现故障,选型不当或使用不当,均可能导致人身伤亡和财产损失。
本文档以及由派克·汉尼汾公司及其子公司和授权经销商提供的其他资料,为具有技术知识的用户提供进一步研究所需的产品和/或系统选项。
重要的是,用户必须对您的应用进行全面的分析,并对当前产品样本中与产品或系统相关的资料进行评估。
由于工作条件以及产品或系统的多样性,用户必须自行分析和测试,并独自承担一切后果,包括:产品和系统的最终选型以及确保满足应用的所有性能、安全和警告等方面的要求。
派克·汉尼汾及其子公司可能会随时对本样本中的产品,包括但不限于:产品的特性、产品的规格、产品的结构、产品的有效性以及产品的价格作出变更而不另行通知.本样本中的所有产品均由派克·汉尼汾公司及其子公司和援权经销商销售。
与派克签订的任何销售合同均按照派克标准条件和销售条件中规定的条款执行(提供复印件备索)。
本公司的密封件,只能在本公司的文件资料述及的应用参数范围与接触介质、压力、温度和存放时间相一致的情况下才能使用。
在规定的应用参数范围外使用以及错误选用不同的材料都可能导致密封件寿命的缩短以及设备的损坏,甚至更严重的后果(如生命安全,环境污染等)。
样本中所列出的工作压力、温度范围、运动速度是极限值,它们之间相互关联、相互影响;在极端的工况下,建议不要同时把各个参数都同时用到极限值。
对于特殊的要求(压力、温度、速度、介质等),请联系派克汉尼汾公司以咨询合适的密封结构、材料、配置、安装建议等。
由于诸多工作参数会影响到流体传动系统及密封元件,这些设备的制造商必须在实际工作条件下测试、验证并批准密封系统的功能与可靠性。
此外,对于不断出现的新的介质(液压油、润滑脂、清洗剂等),用户特别注意它们与目前所用的密封件弹性体材料的兼容性。
我们建议用户在大批量应用之前,在厂内或现场先做密封材料的兼容性能测试,作为密封产品与系统供应商,我们建议用户遵循我们的这些建议。
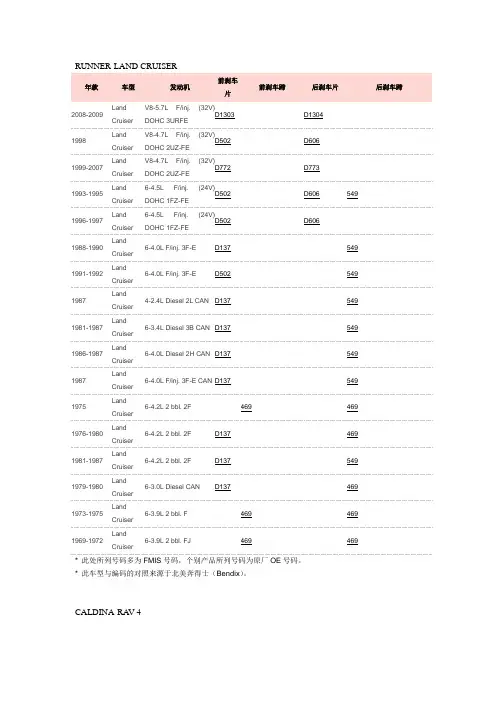
* 此处所列号码多为FMIS号码,个别产品所列号码为原厂OE号码。
* 此车型与编码的对照来源于北美奔得士(Bendix)。
CALDINA-RA V-4* 此处所列号码多为阿基波罗(Akebono)号码,个别产品所列号码为原厂OE号码。
* 此车型与编码的对照来源于日本知名品牌阿基波罗(Akebono)。
* 此处所列号码多为阿基波罗(Akebono)号码,个别产品所列号码为原厂OE号码。
* 此车型与编码的对照来源于日本知名品牌阿基波罗(Akebono)。
NOHA* 此处所列号码多为阿基波罗(Akebono)号码,个别产品所列号码为原厂OE号码。
* 此车型与编码的对照来源于日本知名品牌阿基波罗(Akebono)。
CORROLLA* 此处所列号码多为阿基波罗(Akebono)号码,个别产品所列号码为原厂OE号码。
* 此车型与编码的对照来源于日本知名品牌阿基波罗(Akebono)。
* 此处所列号码多为FMIS号码,个别产品所列号码为原厂OE号码。
* 此车型与编码的对照来源于北美奔得士(Bendix)。
* 此处所列号码多为FMIS号码,个别产品所列号码为原厂OE号码。
* 此车型与编码的对照来源于北美奔得士(Bendix)。
* 此处所列号码多为FMIS号码,个别产品所列号码为原厂OE号码。
* 此车型与编码的对照来源于北美奔得士(Bendix)。
TACOMA* 此处所列号码多为FMIS号码,个别产品所列号码为原厂OE号码。
* 此车型与编码的对照来源于北美奔得士(Bendix)。
HILUXSUZUKI* 此处所列号码多为FMIS号码,个别产品所列号码为原厂OE号码。
* 此车型与编码的对照来源于北美奔得士(Bendix)。
* 此处所列号码多为FMIS号码,个别产品所列号码为原厂OE号码。
* 此车型与编码的对照来源于北美奔得士(Bendix)。
BALENO百乐四门轿车(EG)图片/参考号码产品描述适用车型55800-60G00刹车片Brake Pad SetFront AxleBrake System: SUMWidth: 111.3 mmHeight: 48.6 mmThickness: 15 mm铃木百乐四门轿车(EG)适用于品牌:铃木55810-64G00刹车片Brake Pad SetFront AxleBrake System: SUMWidth: 108.45 mmHeight: 47.75 mmThickness: 15 mm铃木百乐四门轿车(EG)适用于品牌:铃木04492-87101刹车片Brake Pad SetRear AxleBrake System:AKBWidth: 102 mmHeight: 39 mmThickness: 12.5 mm铃木百乐四门轿车(EG)适用于品牌:大发、马自达、铃木53210-50E10刹车蹄片Brake Shoe SetRear Axle铃木百乐四门轿车(EG)适用于品牌:大发、马自达、斯巴鲁、铃木Brake System :SUMITOMODiameter : 200 mmWidth : 32 mm百乐掀背/两厢车(EG)图片/参考号码产品描述适用车型55800-60G00刹车片Brake Pad SetFront AxleBrake System: SUMWidth: 111.3 mmHeight: 48.6 mmThickness: 15 mm铃木百乐掀背/两厢车(EG)适用于品牌:铃木55810-64G00刹车片Brake Pad SetFront AxleBrake System: SUMWidth: 108.45 mmHeight: 47.75 mmThickness: 15 mm铃木百乐掀背/两厢车(EG)适用于品牌:铃木04492-87101刹车片Brake Pad SetRear AxleBrake System:AKBWidth: 102 mmHeight: 39 mmThickness: 12.5 mm铃木百乐掀背/两厢车(EG)适用于品牌:大发、马自达、铃木53210-50E10刹车蹄片Brake Shoe SetRear AxleBrake System :SUMITOMODiameter : 200 mmWidth : 32 mm铃木百乐掀背/两厢车(EG)适用于品牌:大发、马自达、斯巴鲁、铃木百乐旅行车(EG)图片/参考号码产品描述适用车型55800-60G00刹车片Brake Pad SetFront AxleBrake System: SUMWidth: 111.3 mmHeight: 48.6 mmThickness: 15 mm铃木百乐旅行车(EG)适用于品牌:铃木55810-64G00刹车片Brake Pad SetFront AxleBrake System: SUMWidth: 108.45 mmHeight: 47.75 mmThickness: 15 mm铃木百乐旅行车(EG)适用于品牌:铃木04492-87101刹车片Brake Pad Set铃木百乐旅行车(EG)适用于品牌:大发、马自达、铃木Rear AxleBrake System:AKB Width: 102 mm Height: 39 mm Thickness: 12.5 mm53210-50E10刹车蹄片Brake Shoe SetRear Axle Brake System:SUMITOMO Diameter : 200 mm Width : 32 mm铃木 百乐旅行车(EG) 适用于品牌:大发、马自达、斯巴鲁、铃木AERIO 年款车型排量备注前刹车片/刹车蹄片后刹车片/刹车蹄片 驻车制动器01/ 1 - RA21S 1500 4 AN-679WK NN5523 01/ 1 - RB21S 1500 5 AN-679WK NN5523 03/ 1 - RB51S 1800 AN-679WK NN5523 03/ 1 - RC51S 1800AN-679WKNN5523年款 车型 发动机前刹车片前刹车蹄后刹车片后刹车蹄2001-2004 XL7V6-2.7L F/inj. (24V)DOHCD6802005-2006 XL7 V6-2.7L F/inj. (24V)DOHCD11052007-2008XL7 V6-3.6L F/inj. (24V)DOHCD1264D1275* 此处所列号码多为FMIS 号码,个别产品所列号码为原厂OE 号码。
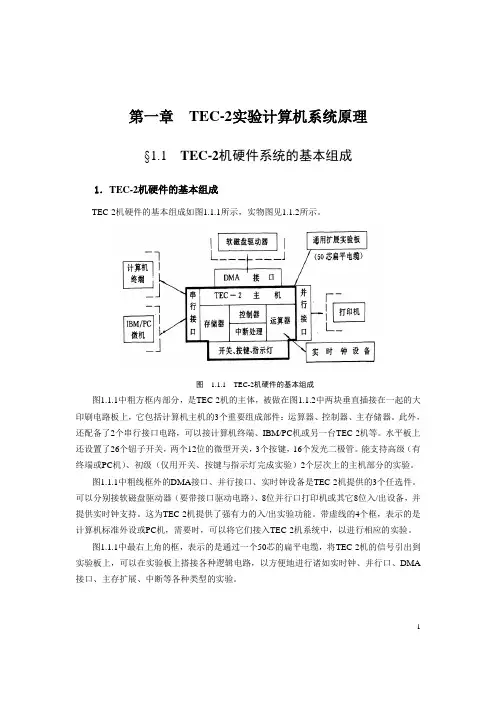
第一章TEC-2实验计算机系统原理§1.1 TEC-2机硬件系统的基本组成1.TEC-2机硬件的基本组成TEC-2机硬件的基本组成如图1.1.1所示,实物图见1.1.2所示。
图 1.1.1 TEC-2机硬件的基本组成图1.1.1中粗方框内部分,是TEC-2机的主体,被做在图1.1.2中两块垂直插接在一起的大印刷电路板上,它包括计算机主机的3个重要组成部件:运算器、控制器、主存储器。
此外,还配备了2个串行接口电路,可以接计算机终端、IBM/PC机或另一台TEC-2机等。
水平板上还设置了26个钮子开关,两个12位的微型开关,3个按键,16个发光二极管。
能支持高级(有终端或PC机)、初级(仅用开关、按键与指示灯完成实验)2个层次上的主机部分的实验。
图1.1.1中粗线框外的DMA接口、并行接口、实时钟设备是TEC-2机提供的3个任选件。
可以分别接软磁盘驱动器(要带接口驱动电路)、8位并行口打印机或其它8位入/出设备,并提供实时钟支持。
这为TEC-2机提供了强有力的入/出实验功能。
带虚线的4个框,表示的是计算机标准外设或PC机,需要时,可以将它们接入TEC-2机系统中,以进行相应的实验。
图1.1.1中最右上角的框,表示的是通过一个50芯的扁平电缆,将TEC-2机的信号引出到实验板上,可以在实验板上搭接各种逻辑电路,以方便地进行诸如实时钟、并行口、DMA 接口、主存扩展、中断等各种类型的实验。
12图 1.1.2 TEC-2机实物图2.TEC-2机的简化逻辑框图在详细讲解TEC-2机各部件的具体组成与运行原理之前,先看懂TEC-2机的简化逻辑框图是很重要的,这对理解TEC-2计算机的整机结构、各功能部件之间的连接关系很有益处。
TEC-2机的简化逻辑框图如图1.1.3所示。
TEC-2机主要由以下几部分组成:(1)TEC-2机的运算器部件,主要由4片AM2901芯片组成,还包括由一片Gal20v8组成的状态寄存器,以及其它一些辅助电路。
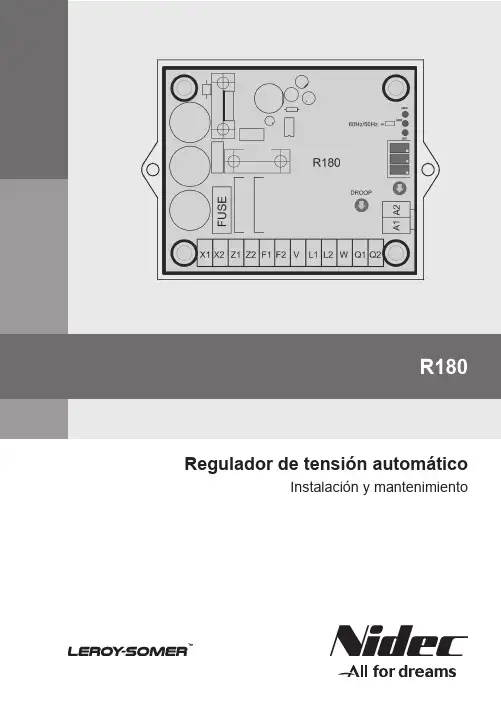
R180 Regulador de tensión automáticoInstalación y mantenimientoElectric Power Generation2022.07 / gInstalación y mantenimientoR180Regulador de tensión automático5599 es -MEDIDAS DE SEGURIDADAntes de poner en marcha su máquina, debe leer este manual de instalación y mantenimiento en su totalidad.Todas las operaciones e intervenciones que se deben llevar a cabo para utilizar esta máquina deberán ser efectuadas por personal cualificado.Nuestro servicio de asistencia técnica está a su disposición para facilitarle toda la información que necesite.Las diferentes intervenciones descritas en este manual están acompañadas de recomendaciones o de símbolos para sensi b ilizar al usuario sobre los riesgos de accidentes. Se debe obligatoriamente comprender y respetar las diferentesconsignas de seguridad adjuntas.una intervención que pueda dañar o destruir la máquina o el material del entorno.Recomendación de seguridad contra los riesgos genéricos que afecten alpersonal.Recomendación de seguridad contra unriesgo eléctrico que afecte al personal.Todas las operaciones de conservación o reparación realizadas en el regulador deben ser llevadas a cabo por personal cualificado para la puesta en servicio, la conservación y el mantenimiento de los elementos eléctricos y mecánicos.Cuando el alternador es accionado a una frecuencia inferior a 28 Hz durante más de 30 s con un regulador analógico, se debe cortar la alimentación AC.AVISOEste regulador puede incorporarse en máquina identificada CE.Estas instrucciones deben transmitirse al usuario final.© 2022 Moteurs Leroy-Somer SASShare Capital: 38,679,664 €, RCS Angoulême 338 567 258.Nos reservamos el derecho de modificar las características de sus productos en todo momento para aportarles los últimos desarrollos tecnológicos. La información que contiene este documento puede ser modificada sin previo aviso.Queda prohibido cualquier tipo de reproducción sin la debida autorización previa.Marca, modelos y patentes registrados.Este manual se aplica al regulador de alternador que usted ha adquirido. Deseamos destacar la importancia de estas instrucciones de mantenimiento.2Instalación y mantenimientoElectric Power Generation2022.07 / g5599 es -R180Regulador de tensión automáticoÍNDICE1 - DESCRIPCIÓN GENERAL (4)2 - AJUSTES DEL REGULADOR (5)3 - ESPECIFICACIÓN TÉCNICA (6)4 - FUNCIÓN PRINCIPAL DEL REGULADOR (7)4.1 - Esquema de conexión para el rango de tensión de 180V a 310V (7)4.2 - Esquema de conexión para el rango de tensión de 300V a 530Vcon estatismo alimentado por AREP+ (8)4.3 - Esquema de conexión para el rango de tensión de 300V a 530Vcon estatismo alimentado por PMG (9)5 - AJUSTES DEL REGULADOR (10)6 - TABLA PARA LA RESOLUCIÓN DE PROBLEMAS (11)7 - PRUEBA CON EL MULTÍMETRO (12)8 - PROCEDIMIENTO DE LA PRUEBA ESTÁTICA (13)8.1 - Equipo de pruebas (13)8.2 - Conexión (13)8.3 - Procedimiento de la prueba (14)9 - DIMENSIONES (15)10 - PIEZAS DE RECAMBIO (16)10.1 - Denominación de componentes (16)10.2 - Servicio de asistencia técnica (16)Instrucciones de desecho y reciclaje3Electric Power Generation2022.07 / gInstalación y mantenimientoR180Regulador de tensión automático5599 es -1 - DESCRIPCIÓN GENERALEl R180 es un regulador automático de tensión de estado sólido completamente que se utiliza (es apto) para la excitación de un alternador sin escobillas alimentado por una excitatriz piloto de imanes permanentes (PMG) o dos bobinados auxiliares.La tensión del alternador entre las fases V-W es muestreada, procesada y convertida a un valor de corriente directa. Esta señal se compara con el valor de referencia, que se genera internamente en función del parámetro de tensión. La comparación la realiza un controlador PID, que controla la excitación del alternador. El circuito de potencia emplea un IGBT modulado por anchura de pulso (PWM) para regular la intensidad de campo, lo que ofrece una buena respuesta dinámica/transitoria.Toma una señal de 1 y 5A de un transfor-mador de corriente de estatismo en fase U para obtener un estatismo de tensión que permita al alternador funcionar en paralelo.El R180 dispone de una entrada accesoria, puede utilizarse como terminal de potenciómetro remoto cuando se conecta a un potenciómetro de 1 KΩ o toma ± 4.5V CC y cambia la tensión terminal para usarla con un controlador externo.Dispone de una función de caída de tensión de subfrecuencia para evitar que el alternador tenga un flujo excesivo en caso de que funcione por debajo de su velocidad. El regulador incorpora un potenciómetro para el ajuste del punto de inflexión para la caída de frecuencia y un enlace de selección de 50Hz/60Hz. Este enlace facilita la selección de la frecuencia del regulador para el alternador de 50Hz/ salida del regulador está limitada a 6 amperios. Este limitador es de tipo retardado para que no interfiera en el forzado de campo. En caso de pérdida de entrada de detección, el regulador suministra una intensidad de excitación CC de 9 amperios durante 5 segundos y apaga el alternador.El R180 se activa desde la tensión residual del alternador.4Electric Power Generation2022.07 / gInstalación y mantenimientoR180Regulador de tensión automático5599 es -2 - AJUSTES DEL REGULADOR Enlace de selección UFROAbierto: modo de funcionamiento de 60Hz. Cerrado: modo de funcionamiento de 50Hz. Pot. UFROEntre 45Hz y 55Hz en modo de 50Hz.Entre 55Hz y 65Hz en modo de 60Hz.TensiónLa tensión de funcionamiento se establece con el potenciómetro marcado como «V». EstatismoEl estatismo se establece con el potenciómetro marcado como «Droop». Rango de la entrada auxiliar y del potenciómetro externoEl rango de la entrada auxiliar se establece con el potenciómetro marcado como «Acc». Este potenciómetro fija el rango de tensión máxima del potenciómetro externo o el rango de la entrada auxiliar.EstabilidadEstabiliza la tensión del alternador si se gira en sentido horario. El ajuste se alcanza cuando la posición del potenciómetro de estabilidad (en el sentido de las agujas del reloj) permite estar al comienzo de una inestabilidad de voltaje, luego ajuste el potenciómetro 1 vuelta abajo (en sentido antihorario).Indicaciones- Límite de sobreexcitación- Pérdida de tensión de detección- UFROPOT.EXTERNO1KSOBREEXC.UFROSLUFROESTABILIDADACCV ADJ+/-4.5V CC0V5Instalación y mantenimientoElectric Power Generation2022.07 / g5599 es -R180Regulador de tensión automático3 - ESPECIFICACIÓN TÉCNICA1Entrada de detección 3 fases/2 fases - 220/230/240/380/400/415 voltiospara 50 Hz3 fases/2 fases - 208/240/277/380/416/440/480 voltiospara 60 Hz2Rango de tensión alto De 300V a 530V3Rango de tensión bajo De 180V a 310V4Estatismo 1 y 5A CA en fase U5Rango de estatismo8% de estatismo a 0.8 pf6Alimentación CA Tensión 277 V CA r m s ±10 %Frecuencia 50/60 Hz - PMG 240 Hz7Corriente de excitación 6 amp CC9 amp durante 5 s (funcionamiento en cortocircuito)8Regulación±0.5% en los terminales de detección del regulador6 amp CC (ajuste de fábrica)9Límite máximode excitación10Retardo de límite máximo30 s (ajuste de fábrica)de excitación11Protección de48.5 Hz/58.5 Hz para funcionamiento a 50 Hz/60 Hzsubfrecuencia12Pendiente 1.2 X (120 %) V/Hz13Potenciómetro remoto 1 K ohmios para ajuste de ±10%14Entrada accesoria±4.5V CC para ±15%15Pérdida de detección Se apaga a los 5 s cuando la detección se abre16Peso500 g aproximadamente17Dimensiones140 mm x 115 mm x 70 mm18Rango de temperaturas De -25 °C a +70 °CDe -40 °C a +80 °C19Intervalo de temperaturasde almacenamiento20Deriva térmica0.5% para cambio de 20 °C21Fusible FST 10A 250V67Electric Power Generation 2022.07 / gInstalación y mantenimientoR180Regulador de tensión automático5599 es -4 - FUNCIÓN PRINCIPAL DEL REGULADOR4.1 - Esquema de conexión para el rango de tensión de 180V a 310VP O T .E X T E R N O 1 KB O B I N A D O P R O P O RC I O N A LDE I N T E N S I D A DSOBREEXC.UFRO SL UFRO ESTABILIDAD ACC V ADJ+/-4.5V CC 0V8Electric Power Generation 2022.07 / gInstalación y mantenimientoR180Regulador de tensión automático5599 es -4.2 - Esquema de conexión para el rango de tensión de 300V a 530V con estatismo alimentado por AREP+P O T . E X T E R N E 1 k O 1 KB O B I N A D O P R O P O RC I O N A LDE I N T E N S I D A DSOBREEXC.UFROUFRO ESTABILIDAD ACC V ADJ+/-4.5V CC 0V9Electric Power Generation 2022.07 / gQ1Q2UInstalación y mantenimientoR180Regulador de tensión automático5599 es -4.3 - Esquema de conexión para el rango de tensión de 300V a 530V con estatismo alimentado por PMG0V P O T . E X T E R N E 1 k P O T .E X T E R N O KSOBREEXC.UFRO SL UFRO ESTABILIDAD ACC V ADJ+/-4.5V CC0VElectric Power Generation2022.07 / gInstalación y mantenimientoR180Regulador de tensión automático5599 es -5 - AJUSTES DEL REGULADOR¡ATENCIÓN! NO TOQUE PIEZAS CON TENSIÓN PARA EVITAR DESCARGASELÉCTRICAS Y LESIONES FÍSICAS.¡PRECAUCIÓN! LOS AJUSTES DEBEN REALIZARSE CON CUIDADO Y DE FORMA GRADUAL MIENTRAS ESTÉ EN MARCHA EL ALTERNADOR, DE LO CONTRARIO EL SISTEMA PODRÍA PRESENTAR FLUCTUACIONES.- VOLT: sentido antihorario completo- STAB: centro del recorrido- UFRO: seleccione el modo de 50Hz o 60HzPuesta en marcha- Compruebe que todos los parámetros sean los indicados en el apartado «Configuración inicial».- Ponga en marcha el accionamiento primario y lleve el alternador a su velocidad nominal (rpm).- La tensión terminal indicará el cebado de tensión.- Regule la tensión terminal con el poten-ciómetro de ajuste de tensión.- Si se observan oscilaciones en el voltí-metro (CA) que indica la tensión terminal del alternador, gire gradualmente el regulador «STABILITY» del R180 en sentido horario y pare en el punto en que desaparezcan las oscilaciones. - Si no se observan oscilaciones durante el cebado, gire el regulador «STABILITY» en sentido antihorario hasta que aparezcan oscilaciones y, a continuación, gírelo en sentido horario para eliminarlas. De este modo podrá afinar las constantes de tiempo del controlador y alternador.- Fije el punto de inflexión Ufro a 47.5Hz para 50Hz o a 57Hz para 60Hz.- Si necesita el potenciómetro externo de ajuste de tensión, detenga el alternador y conecte un potenciómetro de 1 K ohmios en lugar del enlace en los terminales A1 y A2. - Si se precisa estatismo, conecta el trans-formador de corriente de estatismo a Q1 y Q2.10Instalación y mantenimientoElectric Power Generation2022.07 / g5599 es -R180Regulador de tensión automático6 - TABLA PARA LA RESOLUCIÓN DE PROBLEMAS11Electric Power Generation2022.07 / gInstalación y mantenimientoR180Regulador de tensión automático5599 es -7 - PRUEBA CON EL MULTÍMETROPuede utilizar el modo de comprobación de diodos de un multímetro digital para comprobar el diodo volante.Conecte la pinza roja del medidor a F2 y la pinza negra a F1. El multímetro indicará entre 0.4V y 0.6V en el modo de prueba de diodos si el diodo volante está en buenas condiciones. Si el multímetro indicase 0V u OL, el diodo volante estaría averiado.IGBT Tab está conectado al bus +CC y A1 está conectado al bus -CC del regulador. Estas dos conexiones pueden utilizarse para comprobar el IGBT el puente de entrada conectado a X1, X2, Z1 y Z2. Conecte el cable negro del medidor a IGBT Tab.Conecte el cable rojo a X1: el medidor indicará entre 0.4V y 0.6V.Conecte el cable rojo a X2: el medidor indicará entre 0.4V y 0.6V.Conecte el cable rojo a Z1: el medidor indicará entre 0.4V y 0.6V.Conecte el cable rojo a Z2: el medidor indicará entre 0.4V y 0.6V.Conecte el cable rojo a A1 y conecte el cable negro a X1: el medidor indicará entre 0.4V y 0.6V.Conecte el cable negro a X2: el medidor indicará entre 0.4V y 0.6V.Conecte el cable negro a Z1: el medidor indicará entre 0.4V y 0.6V.Conecte el cable negro a Z2: el medidor indicará entre 0.4V y 0.6V.Si el medidor indica 0V u OL en la prueba de diodos, los diodos rectificadores del puente están defectuosos.Si los fusibles están abiertos, X1 y Z2 indicarán OL en la prueba de diodos.Si IGBT Tab y F1 indican 0 ohmios, el IGBT está defectuoso.Prueba de detección de la resistencia de entradaResistencia entre V y A1: 1.3 MΩ aprox. Resistencia entre L1 y A1: 1 MΩ aprox. Resistencia entre L2 y A1: 1 MΩ aprox. Resistencia entre W y A1: 1.3 MΩ aprox.1213Electric Power Generation 2022.07 / gInstalación y mantenimientoR180Regulador de tensión automático5599 es -8 - PROCEDIMIENTO DE LA PRUEBA ESTÁTICA 8.1 - Equipo de pruebas- «Variac» trifásico - Voltímetro de CA/CC - Lámpara de100 W - Potenciómetro de 1 K - Transformador de 250V/110V8.2 - Conexión- Conecte la lámpara de 100 W entre los terminales F1 y F2 del regulador - Conecte la salida de 110V deltransformador a X1 y X2 del regulador - Conecte el lado de 250V deltransformador a U y N del «variac»- Salida V del «variac» al terminal V del regulador- Salida W del «variac» al terminal W del regulador- Conecte el potenciómetro de 1 KΩ a A1 y A2SOBREEXCESTABILIDAD110V / 250V TransformadorTrifásico «Variac»LámparaTrifásico 415 VAlimentaciónElectric Power Generation2022.07 / gInstalación y mantenimientoR180Regulador de tensión automático5599 es -8.3 - Procedimiento de la prueba: Prueba de cebadoPara comprobar el cebado, ponga en marcha el «variac» a partir de 0 voltios y fije la tensión de salida en torno a 5V CA entre X1 y X2. Si el regulador funciona correctamente, a esta tensión corriente directa el voltímetro indicará un valor finito entre los terminales F1 y F2 del regulador, que aumentará con el incremento de la entrada de potencia.Prueba de control de la tensiónEl punto de consigna de tensión por defecto del regulador es alrededor de 415V CA. La lámpara debe mantenerse encendida con un nivel de tensión de alimentación por debajo del punto de consigna, es decir, en torno a 415V CA y debe apagarse cuando la tensión de entrada sobrepase el punto de consiga por el «variac». La transición de la lámpara será gradual debido a la estabilidad del regulador.Prueba del potenciómetro externo Conecte un potenciómetro de 1 K entre los terminales A1 y A1. El potenciómetro externo permitirá que el punto de consigna descienda desde los 415V hasta los 330V (posición máxima y mínima). Es posible verificar esto mediante la prueba de control de tensión descrita anteriormente.Prueba UFROFije la tensión de salida del «variac» en 400V CA. La lámpara se encenderá debido a que el punto de consigna está en 415V. Ahora encienda el interruptor que hay conectado a la entrada de 50Hz/60Hz; la lámpara se apagará gradualmente debido al cambio en el punto de consigna UFRO. Al apagar el interruptor, la lámpara volverá a encenderse. En el modo de 60Hz, se encenderá el LED UFRO.Prueba de pérdida de detecciónAbra la conexión W en el terminal del regulador y ponga en marcha el regulador a 400V. El LED de pérdida de detección se iluminará y la lámpara se encenderá durante 5 segundos y, luego, se apagará.Prueba de estabilidadLa velocidad de atenuación de la lámpara durante la prueba de control de tensión depende del ajuste de estabilidad del regulador. Con una estabilidad mínima, la lámpara se encenderá y apagará en torno al punto de consigna. Con un valor de estabilidad mayor, se reducirá la velocidad de atenuación e iluminación.Rango de tensiónEl rango de tensión del regulador se puede comprobar realizando la prueba de control de tensión de V mín. y V máx. del potenciómetro. Con esta prueba se obtiene el valor aproximado del rango de tensión. Prueba UFROEl punto de consigna de fábrica de UFRO es de 47.5Hz aproximadamente.Fije a salida del varia en 410V CA; gire el potenciómetro UFRO en sentido horario hasta que se encienda el indicador UFRO. Una vuelta más en sentido horario del potenciómetro UFRO hará que se apague la lámpara gradualmente.1415Electric Power Generation2022.07 / g14711590117159142Instalación y mantenimientoR180Regulador de tensión automático5599 es -9 - DIMENSIONESInstalación y mantenimientoElectric Power Generation2022.07 / g5599 es -R180Regulador de tensión automático10 - PIEZAS DE RECAMBIO10.1 - DENOMINACIÓN DECOMPONENTES10.2 Servicio de asistencia técnicaNuestro servicio de asistencia técnica estáa su disposición para ofrecerle toda lainformación que necesite.Para pedir piezas de recambio o solicitarsoporte técnico envíe un mensaje a*******************************contacto más cercano, que podrá encontraren www.lrsm.co/support, indicando el tipoy el código del regulador.Para asegurar el buen funcionamiento y laseguridad de nuestras máquinas, reco-mendamos utilizar piezas de repuestooriginales del fabricante.En caso contrario el fabricante no seráresponsable si hubiera daños.16Electric Power Generation2022.07 / gInstalación y mantenimientoR180Regulador de tensión automático5599 es -Instrucciones de desecho yreciclajeEstamos comprometidos a limitar el impacto medioambiental de nuestra actividad. Continuamente analizamos nuestros procesos de producción, abastecimiento de materiales y el diseño de productos para mejorar el reciclado y reducir nuestra huella de carbono.Estas instrucciones tienen carácter meramente informativo. Es la responsabi-lidad del usuario cumplir con la legislación local con respecto al desecho y reciclaje de productos.Desechos y materiales peligrososLos siguientes componentes y materiales necesitan un tratamiento especial y tienen que ser retirados del alternador antes del proceso de reciclaje:- los materiales electrónicos que se encuentran en la caja de conexiones, incluyendo el regulador automático de voltaje (198), los transformadores de corriente (176), el módulo de supresión de interferencia y otros semiconductores.- el puente de diodos (343) y el supresor de sobretensiones (347) que se encuentran enel rotor del alternador.- los componentes importantes de plástico, tales como la estructura de la caja de conexiones en algunos productos. Estos componentes están normalmente marca-dos con información del tipo de plástico.Todos los materiales enumerados ante-riormente necesitan tratamiento especial para separar el desecho del material recuperable y deben ser manipulados por empresas especializadas en eliminación.17Instalación y mantenimientoElectric Power Generation2022.07 / g5599 es -R180Regulador de tensión automático18Escanee el código o visite: ***************************www.lrsm.co/support/company/leroy-somer/Leroy_Somer_en/LeroySomer.Nidec.en/LeroySomerOfficiel5599 es- 2022.07 / g。
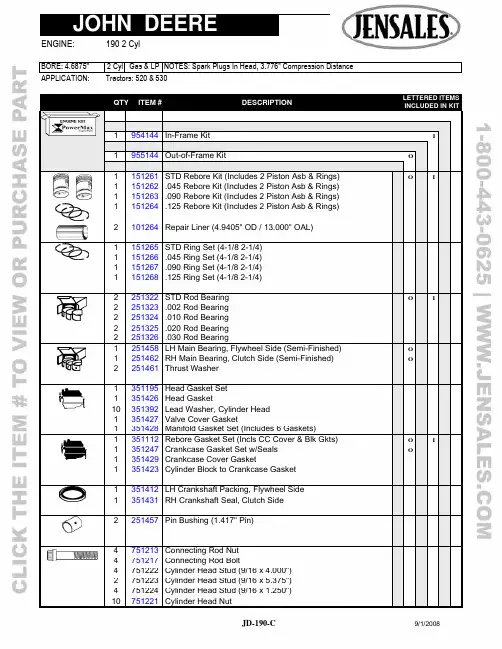
APPLICATION: Tractors: 520 & 530QTY ITEM # DESCRIPTION LETTERED ITEMSINCLUDED IN KIT1 954144 In-Frame Kit I1 955144 Out-of-Frame Kit O1 151261 STD Rebore Kit (Includes2 Piston Asb & Rings) O I 1 151262 .045 Rebore Kit (Includes 2 Piston Asb & Rings)1 151263 .090 Rebore Kit (Includes2 Piston Asb & Rings) 1 151264 .125 Rebore Kit (Includes 2 Piston Asb & Rings) 2 101264 Repair Liner (4.9405" OD / 13.000" OAL)1 151265 STD Ring Set (4-1/8 2-1/4) 1 151266 .045 Ring Set (4-1/8 2-1/4)1 151267 .090 Ring Set (4-1/8 2-1/4)1 151268 .125 Ring Set (4-1/8 2-1/4)2 251322 STD Rod Bearing O I2 251323 .002 Rod Bearing2 251324 .010 Rod Bearing2 251325 .020 Rod Bearing2 251326 .030 Rod Bearing1 12 251458 251462 251461 LH Main Bearing, Flywheel Side (Semi-Finished) RH Main Bearing, Clutch Side (Semi-Finished) Thrust WasherO O1 351195 Head Gasket Set1 351426 Head Gasket10 351392 Lead Washer, Cylinder Head1 351427 Valve Cover Gasket1 351428 Manifold Gasket Set (Includes 6 Gaskets)1 1 1 1 351112 351247 351429 351423 Rebore Gasket Set (Incls CC Cover & Blk Gkts) Crankcase Gasket Set w/Seals Crankcase Cover GasketCylinder Block to Crankcase GasketO OI1 351412 LH Crankshaft Packing, Flywheel Side 1 351431 RH Crankshaft Seal, Clutch Side2 251457 Pin Bushing (1.417" Pin) 4 751213 Connecting Rod Nut4 751217 Connecting Rod Bolt4 751222 Cylinder Head Stud (9/16 x 4.000")2 751223 Cylinder Head Stud (9/16 x 5.375")4 751224 Cylinder Head Stud (9/16 x 1.250")10 751221 Cylinder Head NutAPPLICATION: Tractors: 520 & 530QTY ITEM # DESCRIPTION LETTERED ITEMSINCLUDED IN KIT1 551229 Camshaft 4 551231 Tappet, Thru 52080994 551232 Tappet, After 52080992 451313 Exhaust Valve 2 451314 Intake Valve4 451315 Valve Guide 4 451316 Valve Spring2 451317 Exhaust Rotator8 451188 Valve Keeper (Half)2 451318 Exhaust Valve Seat (1.281 x 1.516" x .250") 2 401176 Intake Valve Seat (1.500 x 1.875" x .250")4 451319 Rocker Arm1 451321 Rocker Arm Shaft1 551225 Cam Gear 1 551226 Crank Gear4 551233 Push Rod1 651168 Oil Pump Gear Set 1 651178 Oil Pump Drive Shaft 1 651171 Oil Pump Screen1 851211 Thermostat (180 Degree)1 851229 Water Pump (3/8" Belt Pulley)1 851231 Water Pump Kit1 851181 Coolant Heater (400 Watt)。
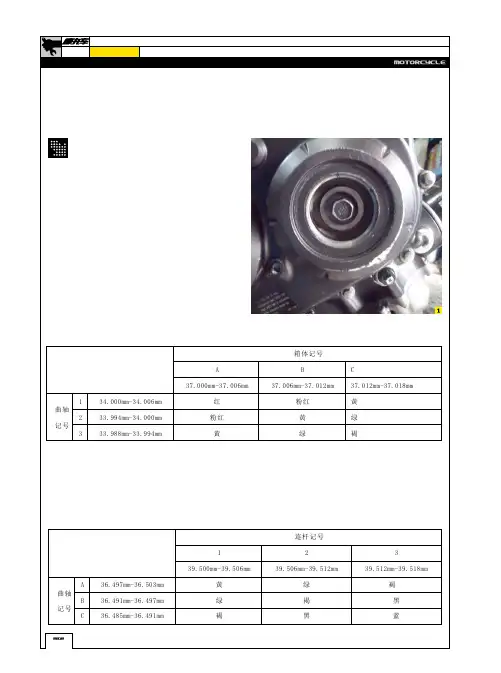
就可以知道如果磨损加大后应该更换多大内径的瓦片。
瓦片是以注意在变速齿轮杆上的轴承上有注油管,很小很小。
这管子用高压空气吹下。
主要是保护滚珠轴承用的。
通过箱体上的油道打机油到轴承内。
图10红圈部分就是这个油管。
拆变速轴的时候要注意,这车是有平衡轴的,如果怕搞混平衡轴与曲轴位置,自己可以用油漆笔做记号,如图11所示。
箱体拆下后要仔细检查曲轴轴瓦座等关键点的磨损情况,这台发动机轴瓦座没有伤,比较万幸。
因为即使你用塑料间隙规测量间隙,也无法测量出局部的拉伤,所以维修人员的目测检查是不可少的,如图7所示。
变速箱也要打开检查,变速箱的齿轮表面也需要检查是否有缺损现象,如图8所示。
这种夹具可以避免在安装过程中损伤活塞环。
活塞涂好润滑油后直接推入汽缸内。
如果缺少这夹具,建议从缸体下面装入汽缸。
这样装比较方便。
当然装活塞时注意活塞环必须要开口互相错开120°。
油环的上下两道小环必须错开20mm以上。
活塞底部上有“IN m”字样的地方必须面对进气门一侧。
活塞和连杆一起被推入汽缸后,就可以把缸体反过来安装曲轴了。
注意每根连杆上的取下后用汽油洗干净,如果上面有积碳等脏东西,可以用脱漆喷剂来清洁。
使用起来很简单,喷好后放个10几分钟,等表面起泡泡了就可以用竹片把赃物刮掉。
清洁一定要干净,避免将来因为缸垫不干净导致窜水或者漏气。
清洁到如图14所示的程度后,用自喷漆在表面喷上层,注意别把缸垫上有些油道孔堵了。
上漆的目的是替代专用密封胶。
使老缸垫密封更好。
这是很多师傅用的土办法。
检查摩擦片厚度,摩擦片厚度为靠离合边盖一侧那片的厚度,为3.6mm,其余的为3.1mm。
钢片使用塞尺检查。
放在玻璃上取120°的3个点,随机塞入塞尺。
低于0.3mm都为正常,高于0.3mm必须更换。
然后把离合摩擦片与钢片按照顺序套入小鼓上。
为了方便安装可以用长螺丝拧在小鼓上,如图28所示。
252627用手抓住螺丝把小鼓和离合片套入大鼓中。

2008赛季F1新车浅谈作者:sky来源:《汽车与运动》2008年第04期3月14日至16日,F1大奖赛的战火在澳大利亚重燃,去除了循迹防滑控制系统(Traction Control System,简称TC)的新赛车也都接受了实战的第一次洗礼。
对于车手们来说,新赛车会对他们的技术能力提出更为苛刻的考验:而对于观众来说,新赛车有了什么样的改变,才是他们最想知道的。
在冬季测试中,各支车队都对于自己赛车的改变绝口不谈,而在空气动力学套件部分,更是虚虚实实,大打太极拳。
如今在赛道之上,终于都显露了“庐山真面目”,也让我们终于有内容可以为读者解惑了。
法拉利F2008重点一:轴距缩短,前轴后移2007年法拉利在摩纳哥惨败后,前技术总监罗斯-布朗就分析F2007的轴距太长了。
如今,法拉利终于承认F2008的轴距缩短了,但是幅度很小。
关于轴距,目前我们可以知道的最确切的消息是:比起F2007,F2008车身的总体布局并没有变,只是为了满足轴距的变化,法拉利将前轴的位置后移了。
重点二:长寿变速器2008年赛季对于变速器的要求更加苛刻:变速器寿命延长至4站,中途更换会遭到退后5位发车的惩罚。
法拉利表示,为了适应这项改革,车队对变速器内部的尺寸进行重新定义,目的是为了加固部件。
在此需要提到的是,虽然法拉利在官方声明中指出新车的变速器采用的碳变速器,但实质上仍为碳钛复合结构。
这一字之差,在强度方面的差别可不小。
重点三:外观新变化新车的鼻椎从椎头至前悬架,下方两侧的菱角被削掉,整体被塑造为流线型,目的是为了更好地疏导下方的气流,包括给予前翼更大的工作空间。
同时为了这一目的,工程师还将单体壳的位置整体升高,这使得我们从外观上可以看到F2008驾驶舱两侧突出了两个肿块,这是为了给车手的臀部塑造足够的空间做出的妥协。
据莱科宁反映,该项改进使得他大腿区域的活动空间比起以前缩小了。
F2008的发动机进气道取消了原来一分为二的设计。
关于CNAS-CC1902015《能源管理体系认证机构要求》转换关于CNAS-CC190:20XX《能源管理体系认证机构要求》转换实施的认可说明(征求意见稿20XX-1-9)0 背景0.1 《能源管理体系认证规则》发布20XX年5⽉31⽇,国家认监委和国家发改委联合发布了《能源管理体系认证规则》。
同期,国家认监委发布了《关于开展能源管理体系认证机构审批有关事项的通知》,明确了现有EnMS认证机构试点审批资格终⽌及开展正式机构审批的安排,并对CNAS的EnMS认可制度提出了调整要求。
0.2 GB/T27309-20XX《合格评定能源管理体系认证机构要求》发布20XX年12⽉1⽇起CNAS依据CNAS-CC19:20XX《能源管理体系认证机构要求》开展EnMS 认证机构认可活动,当时⽆相应的国家标准或国际标准。
20XX年9⽉3⽇,GB/T27309-20XX《合格评定能源管理体系认证机构要求》发布。
该国家标准于20XX年10⽉1⽇起实施,其中明确了对EnMS特定要素的审核要求和能源管理体系认证技术领域的划分,与《能源管理体系认证规则》中相应的内容要求⼀致。
0.3 ISO50003:20XX《能源管理体系能源管理体系审核和认证机构要求》发布20XX年10⽉15⽇,国际标准化组织⾸次发布了ISO50003:20XX《能源管理体系能源管理体系审核和认证机构要求》,该标准作为ISO / IEC 17021:20XX(CNAS已等同转换为CNAS-CC01:20XX)的补充要求,对EnMS领域提出了特定要求。
20XX年10⽉IAF第28届成员⼤会通过了IAF20XX-13号决议:决定ISO 50003:20XX的实施过渡期为标准发布后的3年,即认证机构应于20XX年10⽉14⽇前符合该标准要求。
0.4 CNAS能源管理体系认可规范⽂件调整及认可转换为确保我国能源管理体系认证认可⼯作与国际接轨,中国合格评定国家认可委员会(CNAS)将国际标准ISO50003:20XX转换为CNAS认可规范(CNAS-CC190:20XX《能源管理体系认证机构要求》),代替原有的CNAS-CC19:20XX,作为对能源管理体系认证机构的专⽤认可准则。
FEATURESCONTENTSDESCRIPTIONAPPLICATIONSV UDG-07110TPS40210,TPS40211SLUS772–MARCH 20084.5-V TO 52-V INPUT CURRENT MODE BOOST CONTROLLER•Suitable for Boost,Flyback,SEPIC,and LED Device Ratings2Driver Topologies•Wide Input Operating Voltage:4.5V to 52V Electrical Characteristics 3•Adjustable Oscillator FrequencyTypical Characteristics 5•Fixed Frequency Current Mode Control Terminal Information 10•Internal Slope Compensation Application Information 12•Integrated Low-Side DriverAdditional References 24•Programmable Closed Loop Soft Start Design Examples25•Overcurrent Protection•700-mV Reference (TPS40210)•263-mV Reference (TPS40211)The TPS40210and TPS40211are wide-input voltage •Low Current Disable Function(4.5V to 52V),non-synchronous boost controllers.They are suitable for topologies which require a grounded source N-channel FET including boost,•LED Lightingflyback,SEPIC and various LED Driver applications.•Industrial Control Systems The device features include programmable soft start,overcurrent protection with automatic retry and •Battery Powered Systemsprogrammable oscillator frequency.Current mode control provides improved transient response and simplified loop compensation.The main difference between the two parts is the reference voltage to which the error amplifier regulates the FB pin.Please be aware that an important notice concerning availability,standard warranty,and use in critical applications of Texas Instruments semiconductor products and disclaimers thereto appears at the end of this data sheet.PRODUCTION DATA information is current as of publication date.Copyright ©2008,Texas Instruments IncorporatedProducts conform to specifications per the terms of the Texas Instruments standard warranty.Production processing does not necessarily include testing of all parameters.DEVICE RATINGSABSOLUTE MAXIMUM RATINGSRECOMMENDED OPERATING CONDITIONSPACKAGE DISSIPATION RATINGSELECTROSTATIC DISCHARGE (ESD)PROTECTIONTPS40210,TPS40211SLUS772–MARCH 2008These devices have limited built-in ESD protection.The leads should be shorted together or the device placed in conductive foam during storage or handling to prevent electrostatic damage to the MOS gates.ORDERING INFORMATIONPACKAGE TAPE AND REEL T JPACKAGEPACKAGE LEADPART NUMBER AVAILABILITY QUANTITY2500TPS40210DGQR 10-Pin MSOP PowerPADDGQAvailable80TPS40210DGQ -40°C to 125°C3000TPS40210DRCR 10-Pin SON DRC Preview 250TPS40210DRCT 2500TPS40211DGQR 10-Pin MSOP PowerPADDGQAvailable80TPS40211DGQ -40°C to 125°C3000TPS40211DRCR 10-Pin SONDRCPreview250TPS40211DRCTover operating free-air temperature range unless otherwise noted (1)TPS40210UNITTPS40211VDD–0.3to 52Input voltage range RC,SS,FB,DIS/EN –0.3to 10V ISNS–0.3to 8Output voltage rangeCOMP,BP,GDRV–0.3to 9T J Operating junction temperature range–40to 150°C T stg Storage temperature–55to 150(1)Stresses beyond those listed under "absolute maximum ratings"may cause permanent damage to the device.These are stress ratings only,and functional operation of the device at these or any other conditions beyond those indicated under "recommended operating conditions"is not implied.Exposure to absolute-maximum-rated conditions for extended periods may affect device reliability.MINNOMMAX UNIT V VDD Input voltage4.552V T JOperating Junction temperature-40125°CR θJA High-K Board (1)Power Rating (W)Power Rating (W)PACKAGEAIRFLOW (LFM)(°C/W)T A =25°CT A =85°C10-Pin MSOP PowerPAD0(Natural Convection)57.7 1.730.693(DGQ)10-Pin SON (DRC)0(Natural Convection)47.92.080.835(1)Ratings based on JEDEC High Thermal Conductivity (High K)Board.For more information on the test method,see TI Technical Brief SZZA017.MINTYP MAXUNIT Human Body Model (HBM)1500VCharged Device Model (CDM)15002Submit Documentation FeedbackCopyright ©2008,Texas Instruments IncorporatedProduct Folder Link(s):TPS40210TPS40211ELECTRICAL CHARACTERISTICS TPS40210,TPS40211SLUS772–MARCH2008T J=–40°C to125°C,V VDD=12V dc,all parameters at zero power dissipation(unless otherwise noted)PARAMETER TEST CONDITIONS MIN TYP MAX UNITVOLTAGE REFERENCETPS40210COMP=FB,4.5≤V VDD≤52V,T J=25°C693700707 Feedback voltage rangeTPS40211COMP=FB,4.5≤V VDD≤52V,T J=25°C254260266COMP=FB,4.5≤V VDD≤52V,-40°C≤T J≤V FB mVTPS40210686700714125°CCOMP=FB,4.5≤V VDD≤52V,-40°C≤T J≤TPS40211250260270125°CINPUT SUPPLYV VDD Input voltage range 4.552V4.5≤V VDD≤52V,no switching,V DIS<0.8 1.5 2.5mAI VDD Operating current 2.5≤V DIS≤7V1020µAV VDD<V UVLO(on),V DIS<0.8530µAUNDERVOLTAGE LOCKOUTV UVLO(on)Turn on threshold voltage 4.00 4.25 4.50VV UVLO(hyst)UVLO hysteresis140195240mVOSCILLATOROscillator frequency range(1)351000f OSC kHzOscillator frequency R RC=182kΩ,C RC=330pF260300340Frequency line regulation 4.5≤V DD≤52V-20%7%V SLP Slope compensation ramp520620720mVPWMV VDD=12V(1)275400t ON(min)Minimum pulse widthV VDD=30V90200nst OFF(min)Minimum off time170200V VLY Valley voltage 1.2VSOFT-STARTOffset voltage from SS pin to errorV SS(ofst)700mV amplifier inputR SS(chg)Soft-start charge resistance320430600kΩR SS(dchg)Soft-start discharge resistance84012001600ERROR AMPLIFIERGBWP Unity gain bandwidth product(1) 1.5 3.0MHzA OL Open loop gain(1)6080dBInput bias current(current out of FBI IB(FB)100300nApin)I COMP(src)Output source current V FB=0.6V,V COMP=1V100250µAI COMP(snk)Output sink current V FB=1.2V,V COMP=1V 1.2 2.5mAOVERCURRENT PROTECTIONOvercurrent detection threshold(atV ISNS(oc) 4.5≤V DD<52V,-40°C≤T J≤125°C120150180mV ISNS pin)D OC Overcurrent duty cycle(1)2%Overcurrent reset threshold voltage(atV SS(rst)100150350mV SS pin)T BLNK Leading edge blanking(1)75ns (1)Ensured by design.Not production tested.Copyright©2008,Texas Instruments Incorporated Submit Documentation Feedback3Product Folder Link(s):TPS40210TPS40211TPS40210,TPS40211SLUS772–MARCH 2008ELECTRICAL CHARACTERISTICS (continued)T J =–40°C to 125°C,V VDD =12V dc ,all parameters at zero power dissipation (unless otherwise noted)PARAMETERTEST CONDITIONSMINTYPMAXUNITCURRENT SENSE AMPLIFIER A CS Current sense amplifier gain 4..25.67.2V/V I B(ISNS)Input bias current13µADRIVER I GDRV(src)Gate driver source current V GDRV =4V,T J =25°C 375400mAI GDRV(snk)Gate driver sink current V GDRV =4V,T J =25°C 330400LINEAR REGULATORV BP Bypass voltage output 0mA <I BP <15mA789V DISABLE/ENABLEV DIS(en)Turn on voltage 0.7 1.3V V DIS(hys)Hysteresis voltage25130220mV R DISDIS pin pulldown resistance0.71.1 1.5M Ω4Submit Documentation FeedbackCopyright ©2008,Texas Instruments IncorporatedProduct Folder Link(s):TPS40210TPS40211TYPICAL CHARACTERISTICS04008001200100200600100f S W -F r e q u e n c y -k H zR T -Timing Resistance -k W30020040060050080010009007000400800120002006001000f S W -F r e q u e n c y -k H zD -Duty Cycle 0.20.40.8 1.20.6 1.000.41.4-400.21.2I V D D –Q u i e s c e n t C u r r e n t –m AT J –Juncton Temperature –°C-10-2555020801259565351100.80.61.06-4015I V D D –S h u t d o w n C u r r e n t –m AT J –Juncton Temperature –°C-10-255502080125956535110324TPS40210,TPS40211SLUS772–MARCH 2008FREQUENCYSWITCHING FREQUENCYvsvsTIMING RESISTANCEDUTY CYCLEFigure 1.Figure 2.QUIESCENT CURRENTSHUTDOWN CURRENTvsvsJUNCTION TEMPERATUREJUNCTION TEMPERATUREFigure 3.Figure 4.Copyright ©2008,Texas Instruments Incorporated Submit Documentation Feedback5Product Folder Link(s):TPS40210TPS40211-0.8-0.40.4-40-0.60.2V F B –R e f e r e n c e V o l t a g e C h a n g e –%T J –Juncton Temperature –°C-10-2555020801259565351100.0-0.2-0.5-0.30.50-0.40.4V F B –R e f e r e n c e V o l t a g e C h a n g e –%V VDD –Input Voltage –V1030206050400.10.00.2-0.1-0.20.34.004.30-404.054.25V U V L O –U n d e r v o l t a g e L o c k o u t T h r e s h o l d –VT J –Juncton Temperature –°C-10-2555020801259565351104.154.104.20147150155-40148154V I S N S (O C )–O v e r c u r r e n t T h r e s h o l d –m VT J –Juncton Temperature –°C-10-255502080125956535110152151153149TPS40210,TPS40211SLUS772–MARCH 2008TYPICAL CHARACTERISTICS (continued)REFERENCE VOLTAGE CHANGEREFERENCE VOLTAGE CHANGEvsvsJUNCTION TEMPERATUREINPUT VOLTAGEFigure 5.Figure 6.UNDERVOLTAGE LOCKOUT THRESHOLDOVERCURRENT THRESHOLDvsvsJUNCTION TEMPERATUREJUNCTION TEMPERATUREFigure 7.Figure 8.6Submit Documentation FeedbackCopyright ©2008,Texas Instruments IncorporatedProduct Folder Link(s):TPS40210TPS40211V I S N S (O C )–O v e r c u r r e n t T h r e s h o l d –m VV VDD –Input Voltage –V51510452520145148155146153151149152154150147353040-5-25-40-43f O S C –S w i t c h i n g F r e q u e n c y C h a n g e –%T J –Junction Temperature –°C-10-2555020801259565351101-1240-31529-401727S l o p e C o m p e n s a t i o n R a t i o (V V D D /V S L P )T J –Junction Temperature –°C-10-255502080125956535110231925214001400-402001200R S S –S o f t S t a r t C h a r g e /D i s c h a r g e R e s i s t an c e -k WT J –Junction Temperature –°C-10-2555020801259565351101000800600TPS40210,TPS40211SLUS772–MARCH 2008TYPICAL CHARACTERISTICS (continued)OVERCURRENT THRESHOLDSWITCHING FREQUENCY CHANGEvsvsINPUT VOLTAGEJUNCTION TEMPERATUREFigure 9.Figure 10.OSCILLATOR AMPLITUDESOFT-START CHARGE/DISCHARGE RESISTANCEvsvsJUNCTION TEMPERATUREJUNCTION TEMPERATUREFigure 11.Figure 12.Copyright ©2008,Texas Instruments Incorporated Submit Documentation Feedback7Product Folder Link(s):TPS40210TPS4021140180-4020160I I B (F B )–F e e d b a c k B i a s C u r r e n t –n AT J –Junction Temperature –°C-10-25550208012595653511010080120601400100300-4050250I C O M P (S R C )–C o m p e n s a t i o n S o u r c e C u r r e n t –m AT J –Junction Temperature –°C-10-255502080125956535110200150-40I C O M P (S N K )–C o m p e n s a t i o n S i n k C u r r e n t –m AT J –Juncton Temperature –°C -10-255502080125956535110010030050250200150-40V V L Y –V a l l e y V o l t a g e C h a n g e –%T J –Juncton Temperature –°C-10-255502080125956535110-5-25-431-1240-3TPS40210,TPS40211SLUS772–MARCH 2008TYPICAL CHARACTERISTICS (continued)FB BIAS CURRENTCOMPENSATION SOURCE CURRENTvsvsJUNCTION TEMPERATUREJUNCTION TEMPERATUREFigure 13.Figure 14.COMPENSATION SINK CURRENTVALLEY VOLTAGE CHANGEvsvsJUNCTION TEMPERATUREJUNCTION TEMPERATUREFigure 15.Figure 16.8Submit Documentation FeedbackCopyright ©2008,Texas Instruments IncorporatedProduct Folder Link(s):TPS40210TPS402117.47.88.8-407.68.6V B P –R e g u l a t o r V o l t a g e –VT J –Juncton Temperature –°C-10-2555020801259565351108.48.28.01.001.021.10-401.011.09V D I S(E N )–D I S /E N T u r n -O n T h r e s h o l d –m VT J –Juncton Temperature –°C-10-2555020801259565351101.061.051.071.031.081.06AC S –C u r r e n t S e n s e A m p l i f i e r G a i n –V /V2743561-40T J –Juncton Temperature –°C-10-255502080125956535110TPS40210,TPS40211SLUS772–MARCH 2008TYPICAL CHARACTERISTICS (continued)REGULATOR VOLTAGEDIS/EN TURN-ON THRESHOLDvsvsJUNCTION TEMPERATUREJUNCTION TEMPERATUREFigure 17.Figure 18.CURRENT SENSE AMPLIFIER GAINvsJUNCTION TEMPERATUREFigure 19.Copyright ©2008,Texas Instruments Incorporated Submit Documentation Feedback9Product Folder Link(s):TPS40210TPS40211DEVICE INFORMATION16510237489FBRC COMPDIS/EN SS GNDVDD ISNS GDRV BP DGQ PowerPAD PACKAGE(Top View)FBRC COMPDIS/EN SS 543211678910GNDVDD ISNS GDRV BP DRC SURFACE MOUNT PACKAGE(Top View)TPS40210,TPS40211SLUS772–MARCH 2008TERMINAL FUNCTIONSTERMINAL I/O DESCRIPTIONNAME P 4O Error amplifier output.Connect control loop compensation network between COMP pin and FB pin.Disable pin.Pulling this pin high,places the part into a shutdown mode.Shutdown mode is characterized by a very low quiescent current.While in shutdown mode,the functionality of all blocks is disabled and the BP DIS/EN3Iregulator is shut down.This pin has an internal 1-M Ωpull-down resistor to GND.Leaving this pin unconnected enables the device.Error amplifier inverting input.Connect a voltage divider from the output to this pin to set output voltage.FB 5I Compensation network is connected between this pin and COMP.GDRV 8O Connect the gate of the power N channel MOSFET to this pin.GND 6-Device ground.Current sense pin.Connect an external current sensing resistor between this pin and GND.The voltage on this pin is used to provide current feedback in the control loop and detect an overcurrent condition.AnISNS7Iovercurrent condition is declared when ISNS pin voltage exceeds the overcurrent threshold voltage,150mV typical.Switching frequency setting pin.Connect capacitor from RC pin to GND.Connect a resistor from RC pin RC 1I toVDD of the IC power supply and a capacitor from RC to GND.Soft-start time programming pin.Connect capacitor from SS pin to GND to program converter soft-start time.SS 2I This pin also functions as a timeout timer when the power supply is in an overcurrent condition.BP 9O Regulator output pin.Connect a 1.0-µF bypass capacitor from this pin to GND.System input voltage.Connect a local bypass capacitor from this pin to GND.Depending on the amount of VDD10Irequired slope compensation,this pin can be connected to the converter output.See Application Information section for additional details.DGQ PowerPAD PACKAGEDRC PACKAGE (TOP VIEW)(TOP VIEW)10Submit Documentation FeedbackCopyright ©2008,Texas Instruments IncorporatedProduct Folder Link(s):TPS40210TPS40211FBCOMPDIS/EN SSRC BPVDDGDRV GND ISNSUDG-07107FUNCTIONAL BLOCK DIAGRAMAPPLICATION INFORMATIONMinimum On-Time and Off Time ConsiderationsOUT D IN V V 1V 1D+=-(1)IN OUT D V D 1V V æöæö=-ç÷ç÷ç÷+èøèø(2)()()f OUT D OUT SW2IN 2V V I L D V ´+´´´=(3)()()()f 2OUT D IN IN OUT(crit)2OUT D SW V V V V I 2V V L+-´=´+´´(4)The TPS40210has a minimum off time of approximately 200ns and a minimum on time of 300ns.These two constraints place limitations on the operating frequency that can be used for a given input to output conversion ratio.See Figure 2for the maximum frequency that can be used for a given duty cycle.The duty cycle at which the converter operates is dependent on the mode in which the converter is running.If the converter is running in discontinuous conduction mode,the duty cycle varies with changes to the load much more than it does when running in continuous conduction mode.In continuous conduction mode,the duty cycle is related primarily to the input and output voltages.In discontinuous mode the duty cycle is a function of the load,input and output voltages,inductance and switching frequency.All converters using a diode as the freewheeling or catch component have a load current level at which they transition from discontinuous conduction to continuous conduction.This is the point where the inductor current just falls to zero.At higher load currents,the inductor current does not fall to zero but remains flowing in a positive direction and assumes a trapezoidal wave shape as opposed to a triangular wave shape.This load boundary between discontinuous conduction and continuous conduction can be found for a set of converter parameters as follows.For loads higher than the result of Equation 4,the duty cycle is given by Equation 2and for loads less that the results of Equation 4,the duty cycle is given Equation 3.For Equations 1the variable definitions are as •V OUT is the output voltage of the converter in V•V D is the forward conduction voltage drop across the rectifier or catch diode in V •V IN is the input voltage to the converter in V •I OUT is the output current of the converter in A •L is the inductor value in H•f SW is the switching frequency in HzSetting the Oscillator FrequencyT 810274692SW T SW SW T T 1R 5.810f C 810f 1.410f 1.510 1.710C 410C ------=´´´+´´+´´-´+´´-´´(5)Current Sense and OvercurrentUDG-07119UDG-07120ISNS L V R =(6)The oscillator frequency is determined by a resistor and capacitor connected to the RC pin of the TPS40210.The capacitor is charged to a level of approximately V VDD /20by current flowing through the resistor and is then discharged by a transistor internal to the TPS40210.The required resistor for a given oscillator frequency is found from either Figure 1or Equation 5.where•R T is the timing resistance in k Ω•f SW is the switching frequency in kHz •C T is the timing capacitance in pFFor most applications a capacitor in the range of 68pF to 120pF gives the best results.Resistor values should be limited to between 100k Ωand 1M Ωas well.If the resistor value falls below 100k Ω,decrease the capacitor size and recalculate the resistor value for the desired frequency.As the capacitor size decreases below 47pF,the accuracy of Equation 5degrades and empirical means may be needed to fine tune the timing component values to switching frequency.The tps40210and TPS40211are current mode controllers and use a resistor in series with the source terminal power FET to sense current for both the current mode control and overcurrent protection.The device enters a current limit state if the voltage on the ISNS pin exceeds the current limit threshold voltage V ISNS(oc)from the electrical specifications table.When this happens the controller discharges the SS capacitor through a relatively high impedance and then attempt to restart.The amount of output current that causes this to happen is dependent on several variables in the converter.Figure 20.Oscillator Components Figure 21.Current Sense ComponentsThe load current overcurrent threshold is set by proper choice of R ISNS .If the converter is operating in discontinuous mode the current sense resistor is found in Equation 6.If the converter is operating in continuous conduction mode R ISNS can be found in Equation 7.()f ISNS ISNSISNS OUT RIPPLE OUT IN SW V V R I I I D V 1D 21D 2L ==æöæöæöæö´++ç÷ç÷ç÷ç÷ç÷-èø-´´èøèøèø(7)Current Sense and Sub-Harmonic Instabilityf VDD e SW V s 20æö=´ç÷èø(8)()CS ISNS OUT D IN A R V V V m2L´´+-=(9)where•R ISNS is the value of the current sense resistor in Ω.•V ISNS(oc)is the overcurrent threshold voltage at the ISNS pin (from electrical specifications)•D is the duty cycle (from Equation 2)•f SW is the switching frequency in Hz•V IN is the input voltage to the power stage in V (see text)•L is the value of the inductor in H•I OUT (oc)is the desired overcurrent trip point in A •V D is the drop across the diode in Figure 21The TPS40210/11has a fixed undervoltage lockout (UVLO)that allows the controller to start at a typical input voltage of 4.25V.If the input voltage is slowly rising,the converter might have less than its designed nominal input voltage available when it has reached regulation.As a result,this may decreases the apparent current limit load current value and must be taken into consideration when selecting R ISNS .The value of V IN used to calculate R ISNS must be the value at which the converter finishes startup.The total converter output current at startup is the sum of the external load current and the current required to charge the output capacitor(s).See the Soft Start section of this datasheet for information on calculating the required output capacitor charging current.The topology of the standard boost converter has no method to limit current from the input to the output in the event of a short circuit fault on the output of the converter.If protection from this type of event is desired,it is necessary to use some secondary protection scheme such a fuse or rely on the current limit of the upstream power source.A characteristic of peak current mode control results in a condition where the current control loop can exhibit instability.This results in alternating long and short pulses from the pulse width modulator.The voltage loop maintains regulation and dioes not oscillate,but the output ripple voltage increases.The condition occurs only when the converter is operating in continuous conduction mode and the duty cycle is 50%or greater.The cause of this condition is described in Texas Instruments literature number SLUA101,available at .The remedy for this condition is to apply a compensating ramp from the oscillator to the signal going to the pulse width modulator.In the TPS40210/11the oscillator ramp is applied in a fixed amount to the pulse width modulator.The slope of the ramp is given in Equation 8.To ensure that the converter does not enter into sub-harmonic instability,the slope of the compensating ramp signal must be at least half of the down slope of the current ramp signal.Since the compensating ramp is fixed in the TPS40210/11,this places a constraint on the selection of the current sense resistor.The down slope of the current sense wave form at the pulse width modulator is described in Equation 9.Since the slope compensation ramp must be at least half,and preferably equal to the down slope of the current sense waveform seen at the pulse width modulator,a maximum value is placed on the current sense resistor when operating in continuous mode at 50%duty cycle or greater.For design purposes,some margin should be applied to the actual value of the current sense resistor.As a starting point,the actual resistor chosen should be 80%or less that the value calculated in Equation 10.This equation calculates the resistor value that makes the slope compensation ramp equal to one ramp downslope.Values no more than 80%of this result would be acceptable.()f VDD SWISNS(max)OUT D IN V L R 60V V V ´´=´+-(10)Current Sense Filteringf ON SWD t =(11)IFLT IFLT ONR C 0.1t ´=´(12)Soft Startwhere•S e is the slope of the voltage compensating ramp applied to the pulse width modulator in V/s •f SW is the switching frequency in Hz •V VDD is the voltage at the VDD pin in V•m2is the down slope of the current sense waveform seen at the pulse width modulator in V/s •R ISNS is the value of the current sense resistor in Ω•V OUT is the converter output voltage V IN is the converter power stage input voltage •V D is the drop across the diode in Figure 21It is possible to increase the voltage compensation ramp slope by connecting the VDD pin to the output voltage of the converter instead of the input voltage as shown in Figure 21.This can help in situations where the converter design calls for a large ripple current value in output current limit setting.NOTE:Connecting the VDD pin to the output voltage of the converter affects the startup voltage of the converter since the controller undervoltage lockout (UVLO)circuit monitors the VDD pin and senses the input voltage less the diode drop before startup.The effect is to increase the startup voltage by the value of the diode voltage drop.If an acceptable R ISNS value is not available,the next higher value can be used and the signal from the resistor divided down to an acceptable level by placing another resistor in parallel with C ISNS .In most cases,a small filter placed on the ISNS pin improves performance of the converter.These are the components R IFLT and C IFLT in Figure 21.The time constant of this filter should be approximately 10%of the nominal pulse width of the width can be found using Equation 11.The suggested time constant is thenThe range of R IFLT should be from about 1k Ωto 5k Ωfor best results.Higher values can be used but this raises the impedance of the ISNS pin connection more than necessary and can lead to noise pickup issues in some layouts.C ISNS should be located as close as possible to the ISNS pin as well to provide noise immunity.The soft-start feature of the TPS40200is a closed loop soft start,meaning that the output voltage follows a linear ramp that is proportional to the ramp generated at the SS pin.This ramp is generated by an internal resistor connected from the BP pin to the SS pin and an external capacitor connected from the SS pin to GND.The SS pin voltage (V SS )is level shifted down by approximately V SS(ofst)(approximately 700mV)and sent to one of the “+”(the “+”input with the lowest voltage dominates)inputs of the error amplifier.When this level shifted voltage (V SSE )starts to rise at time t 1(see Figure 22),the output voltage the controller expects,rises as well.Since V SSE starts at near 0V,the controller regulate the output voltage from a starting point of zero volts.It cannot do this due to the converter architecture.The output voltage starts from the input voltage less the drop across the diode (V IN -V D )and rise from there.The point at which the output voltage starts to rise (t 2)is the point where the V SSE ramp passes the point where it is commanding more output voltage than (V IN -V D ).This voltage level is labeled V SSE(1).The time required for the output voltage to ramp from a theoretical zero to the final regulated value (from t 1to t 3)is determined by the time it takes for the capacitor connected to the SS pin (C SS )to rise through a 700mV range,beginning at V SS(ofst)above GND.UDG-07121()SSSS BP SS(ofst)SS BPSS(ofst)FB t C V V R ln V VV =æö-ç÷´ç÷-+èø(13)Figure 22.SS Pin Voltage adn Output Voltage Figure 23.SS Pin Functional CircuitThe required capacitance for a given soft start time t 3–t 1in Figure 22is calculated in Equation 13.where•t SS is the soft-start time•R SS(chg)is the SS charging resistance in Ω,typically 500k Ω•C SS is the value of the capacitor on the SS pin,in F •V BP is the value of the voltage on the BP pin in V•V SS(ofst)is the approximate level shift from the SS pin to the error amplifier (~700mV)•V FB is the error amplifier reference voltage,700m V typicalNote that t SS is the time it takes for the output voltage to rise from 0V to the final output voltage.Also note the tolerance on R SS(chg)given in the electrical specifications table.This contributes to some variability in the output voltage rise time and margin must be applied to account for it in design.Also take note of V BP .Its value varies depending on input conditions.For example,a converter operating from a slowly rising input initializes V BP at a fairly low value and increases during the entire startup sequence.If the controller has a voltage above 8V at the input and the DIS pin is used to stop and then restart the converter,V BP is approximately 8V for the entire startup sequence.The higher the voltage on BP,the shorter the startup time is and conversely,the lower the voltage on BP,the longer the startup time is.。
Brain anatomy of persistent violent offenders:More rather than lessJari Tiihonen a,b,⁎,Roberta Rossi c ,Mikko akso d,e ,Sheilagh Hodgins f ,Cristina Testa g ,Jorge Perez h ,Eila Repo-Tiihonen a ,Olli Vaurio a ,Hilkka Soininen d ,Hannu J.Aronen i,j,k ,Mervi Könönen e,l ,Paul M.Thompson m ,Giovanni B.Frisoni naDepartment of Forensic Psychiatry,Niuvanniemi Hospital,University of Kuopio,Kuopio,FinlandbDepartment of Clinical Physiology,Kuopio University Hospital,Kuopio,FinlandcLaboratory of Epidemiology Neuroimaging,and Telemedicine and Biological Psychiatric Unit,IRCCS San Giovanni di Dio-FBF ,Brescia,ItalydDepartment of Neurology,Kuopio University Hospital,Kuopio,Finland eDepartment of Clinical Radiology,Kuopio University Hospital,Kuopio,FinlandfInstitute of Psychiatry,King's College,University of London,UKgLaboratory of Epidemiology Neuroimaging,and Telemedicine,IRCCS San Giovanni di Dio-FBF ,Brescia,Italy;Machine Vision Laboratory,Department of Mathematics and Computer Science,University of Udine,Udine,ItalyhBiological Psychiatry Unit and Double Diagnosis Ward,IRCCS San Giovanni di Dio-FBF ,Brescia,ItalyiFunctional Brain Imaging Unit,Helsinki University Central Hospital,Helsinki Brain Research Center,Helsinki,FinlandjCentre for Military Medicine,Finnish Defence Forces,Helsinki,Finland kDepartment of Diagnostic Radiology,University of Turku,Turku,Finland lDepartment of Clinical Neurophysiology,Kuopio University Hospital,Kuopio,FinlandmLaboratory of Neuroimaging and Brain Mapping Division,Department of Neurology,University of California,Los Angeles,USA nPsychogeriatrics Ward and Laboratory of Epidemiology Neuroimaging and Telemedicine,IRCCS San Giovanni di Dio FBF ,Brescia,Italy;AFaR —Associazione Fatebenefratelli per la Ricerca,Rome,ItalyReceived 20February 2007;received in revised form 30May 2007;accepted 26August 2007AbstractMost violent crimes in Western societies are committed by a small group of men who display antisocial behavior from an early age that remains stable across the life-span.It is not known if these men display abnormal brain structure.We compared regional brain volumes of 26persistently violent offenders with antisocial personality disorder and substance dependence and 25healthy men using magnetic resonance imaging volumetry and voxel-based morphometry (VBM).The violent offenders,as compared with the healthy men,had markedly larger white matter volumes,bilaterally,in the occipital and parietal lobes,and in the left cerebellum,and larger grey matter volume in right cerebellum (effect sizes up to 1.24,P b 0.001).Among the offenders,volumes of these areas were not associated with psychopathy scores,substance abuse,psychotropic medication,or global IQ scores.By contrast,VBM analyses of grey matter revealed focal,symmetrical,bilateral areas of atrophy in the postcentral gyri,frontopolar cortex,and orbitofrontal cortex among the offenders as compared with the healthy men (z -scores as high as 5.06).Offenders withAvailable online at Psychiatry Research:Neuroimaging 163(2008)201–212/locate/psychresnsCorresponding author.Department of Forensic Psychiatry,University of Kuopio,Niuvanniemi Hospital,FI-70240Kuopio,Finland.Tel:+35817203111;fax:+35817203494.E-mail address:jari.tiihonen@niuva.fi (J.Tiihonen).0925-4927/$-see front matter ©2007Elsevier Ireland Ltd.All rights reserved.doi:10.1016/j.pscychresns.2007.08.012psychopathy showed the smallest volumes in these areas.The larger volumes in posterior brain areas may reflect atypical neurodevelopmental processes that underlie early-onset persistent antisocial and aggressive behavior.©2007Elsevier Ireland Ltd.All rights reserved.Keywords:Antisocial;Psychopathy;MRI;V olumetry;Aggression;Violence1.IntroductionApproximately5%of males are characterized by a pattern of antisocial behavior that onsets in early childhood and remains stable across the life-span.These men are responsible for50%to70%of all violent crimes (Moffitt,1993;Hodgins,1994).They fulfill diagnostic criteria for conduct disorder(CD)in childhood and antisocial personality disorder(ASPD)in adulthood.In Finland,for example,men with ASPD are responsible for approximately60to80%of the most serious violent offenses(Tiihonen and Hakola,1994;Eronen et al., 1996a).A recent survey indicated that about half of all prisoners in Western countries fulfill diagnostic criteria for ASPD that require by definition a diagnosis of CD prior to age15(Fazel and Danesh,2002).Substance misuse is almost always co-morbid with CD and ASPD.Within this population of males characterized by an early onset and a stable pattern of antisocial behavior that persists across the life-span,a subgroup presents the personality traits of psychopathy.As adults,this subgroup commits even more violent offences than the others(Hare and McPherson,1984).Reliable and valid diagnoses can be made using the Psychopathy Checklist Revised(PCL-R; Schroeder et al.,1985;Hare,1991;Fulero,1995). Psychopathy is not included as a diagnosis in the ICD-10 or DSM-IV,even though it fits the definition of a personality disorder.It is more severe in its manifestation than ASPD in that it requires the presence of the two traits, Arrogant and Deceitful Interpersonal Behavior and Deficient Affective Experience,in addition to a history of antisocial behavior.A great deal of research has been conducted using the PCL-R as a dimension,and the total score has been consistently found to be the best known predictor of violent behavior(Hemphill et al.,1998).Men with ASPD have been reported to show reductions in frontal grey matter volumes as compared with healthy men,and similar volumes of frontal white matter(Raine et al.,2000).However,one third of the individuals with ASPD in this study had also a schizophrenia spectrum disorder.Men with psychopathy have been described as having an abnormally structured corpus callosum(Raine et al.,2003).A recent review,however,has highlighted that few structural differences have been identified in this population and that none have been replicated(Pridmore et al.,2005).In these studies,samples have been heterogeneous,inadequately characterized,poorly de-scribed,and not comparable.A recent study compared brain volumes,assessed with magnetic resonance imaging (MRI),of incarcerated offenders with personality disorders (75%of them diagnosed as psychopaths)and healthy men. No differences in frontal or temporal lobe volumes were observed.This study did not measure the grey or white matter separately(Dolan et al.,2002).We have previously compared offenders with ASPD and alcoholism and healthy men,and we observed no significant differences in prefrontal grey and white matter volumes(Laakso et al., 2002).To our knowledge,no other quantitative data have been reported on the neuroanatomy of persistent violent offenders with a history of antisocial behavior going back to at least mid-adolescence.It is not known if such men present abnormalities in brain structure.Given the paucity of replicated findings,we did not make hypotheses nor select specific regions for study.Rather,we used lobar analyses and voxel-based mophometry to compare the brain structures of persistent violent offenders who fulfill criteria for ASPD and healthy men in all brain regions.The sample of offenders was relatively homogeneous with respect to age of onset and history of antisocial behavior, persistence and severity of violent criminality,and absence of any history of severe mental illness.2.Method2.1.ParticipantsHealthy participants gave informed consent,and all data from offenders(MRI scans and case record files)were obtained retrospectively from hospital files.The procedure was approved by the ethical committee of Kuopio University Hospital.All participants were of Finnish ori-gin.The healthy comparison group included25men–students,hospital staff and skilled workers–who were considered to be free of current or past substance misuse and other mental disorders on the basis of unstructured interview.Intelligence quotient(IQ)scores were not avail-able from the comparison subjects.The offender group included26men with no history or current diagnosis of psychosis or schizotypal personality disorder who were consecutively admitted to a university forensic psychiatric202J.Tiihonen et al./Psychiatry Research:Neuroimaging163(2008)201–212hospital for a pre-trial assessment.All were charged with violent offences(2murder,10manslaughter,4attempted murder or manslaughter,1assisting manslaughter,6as-saults,3armed robberies).All had a history of recurrent violent acts,and all but two had previous convictions for violence.Data on handedness were not available.The characteristics of the participants are presented in Table1. One of the offenders had a history of head injury leading to transient unconsciousness.None of the offenders had a diagnosis of mental disorder or behavioral disorder caused by previous brain damage.Diagnoses were made by consensus using multiple sources of information including reports from multidis-ciplinary treatment teams,family members,colleagues from work,and medical and criminal files.All offenders fulfilled criteria for both DSM-IV ASPD and ICD-10 dissocial personality,and none fulfilled criteria for schizotypal personality disorder or any current or past psychotic disorder.All met the criterion for a maladap-tive pattern of substance abuse related to alcohol abuse (DSM-IV,APA1994)with early onset corresponding type2as described by Cloninger(Cloninger,1987),and all fulfilled the DSM-IV and ICD10criteria for substance dependence with20fulfilling criteria for drug polysubstance dependence and6for alcohol dependence.Fifteen offenders had used amphetamine at least once(9from the high psychopathy group and6 from the low psychopathy group).Participants had no access to alcohol for3to6months prior to the brain scan and no access to illicit drugs for1to7weeks prior to the brain scan.(The different abstinence periods are explained by the fact that while storage and use of intoxicating amounts of alcohol by prisoners are difficult and rare in Finnish prisons,the delivery and use of illicit drugs is much easier and rather common.)Eleven of the offenders were free of psychotropic medication,and15 were taking either benzodiazepine,antidepressant or antipsychotic medication(small doses used as anxiolytic or hypnotic).2.2.Psychopathy ratingsThe PCL-R was used to assess psychopathy(Hare, 1991).For detailed information,see http://www.niuva.fi/ tuttex.html.2.3.Magnetic resonance imagingComparisons between study groups were done by using voxel-based morphometry(VBM)and lobar volumetry.Lobar analyses provide quantitative informa-tion on brain volume alterations in large regions of interest. VBM addressed the significance of volume alterations in much more restricted areas that can be as small as a single voxel.The participants were scanned with a1.0T Impact (Siemens;Erlangen,Germany)using a standard head coil and a tilted T1-weighted coronal3D gradient echo sequence(magnetization prepared rapid acquisition gra-dient echo:TR10ms,TE4ms,TI250ms,flip angle12°, FOV250mm,matrix256×192,1acquisition).The3-D spatial resolution was2.0mm×1.3mm×0.97mm.MR images were processed with SPM2(http://www.fil. /spm/software/spm2)following an optimized protocol including:(a)generation of a whole brain customised template,(b)generation of customised prior probability maps,and(c)main VVBM steps to applied on original images.For detailed information,see Supple-mentary Material,doi:10.1016/j.pscychresns.2007.08.012.2.4.Statistical analysesIn the analyses,the healthy men were compared with the26violent offenders with ASPD and to the subgroup of 12offenders who fulfilled criteria for a diagnosis of psychopathy.Student's t-test,chi-square test and Fisher exact test were used to compare participants'sociodemo-graphic and clinical characteristics.Analysis of covariance (ANCOVA)was used to evaluate the age-adjusted differences between the violent offenders and healthy men in the lobar volumetry analysis.Effect size(Cohen's d)was used to describe the robustness of the findings(Cohen, 1988).Within the offender group,univariate analysis of variance(full factorial model)was used to assess the contribution of variables such as PCL-R scores,IQ scores, duration of alcohol abuse,polysubstance abuse and use of current psychotropic medication to regional brain volumes. The association between PCL-R factor scores and regional brain volumes was assessed using Pearson's correlation analysis.In VBM,grey matter and white matter imagesTable1Comparison of sociodemographic and clinical characteristics(mean±S.D.)of the healthy men and the violent offendersHealthy men (N=25)Violentoffenders(N=26)Statistic P-valueAge,years34.6±10.832.5±8.4t=0.7830.438Ethnicity,% white 100%100%Fisherexact test1.000Alcohol dependence,%0100%Fisherexact testb0.001Polysubstance abuse,%076.9%Fisherexact testb0.001Total intracranial volume 1707±1171654±108t=1.6640.102203 J.Tiihonen et al./Psychiatry Research:Neuroimaging163(2008)201–212were analyzed with an ANCOV A model(see Supplemen-tary Material,MRI method paragraph for details, doi:10.1016/j.pscychresns.2007.08.012).3.ResultsComparisons of the sociodemographic and clinical characteristics of the violent offenders and healthy men are shown in Table1.As can be seen,no differences were observed between the violent offenders and healthy men as to age,ethnicity and intracranial volume.More of the violent offenders than the healthy men had a history of alcohol and polysubstance abuse.As presented in Table2, the subgroup of offenders with psychopathy was similar to the other offenders with only ASPD as to age,duration of alcohol abuse,global IQ score,and the proportion taking medication.All of the offenders with psychopathy had a history of polysubstance misuse as compared with57%of the other offenders.By definition,the offenders with psychopathy obtained higher total PCL-R scores,and also higher scores for the two factors assessing the personality traits of psychopathy,Arrogant and Deceitful Interpersonal Behavior and Deficient Affective Experience.3.1.Regional brain volumesThe adjusted lobar regional brain volumes of offenders as compared with the healthy men are shown in Table3. Regional volumes correlated strongly with each other (Pearson r up to0.99),and85%(161of190)of the correlations were statistically significant(P b0.05).Offen-ders displayed greater volumes in most areas than the healthy men,and the age-adjusted differences were statistically significant without Bonferroni corrections in the right cerebellar grey matter,left cerebellar white matter, and parietal and occipital white matter bilaterally.The violent offenders had much more occipital white matter than the healthy men,with effect sizes reaching1.15on the right and1.24on the left.These comparisons remained statistically significant after applying Bonferroni correc-tions for multiple comparisons.When the subgroup of violent offenders diagnosed as psychopaths were com-pared with the healthy men,the effect sizes were slightly larger than those observed in comparisons between all the offenders and the healthy men(0.69for right cerebellar grey matter,P=0.064;0.63for left cerebellar white matter, P=0.075;0.77for right parietal white matter,P=0.04;0.84for left parietal white matter,P=0.026;1.30for right occipital white matter,P=0.001;and1.51for left occipital white matter,P b0.001).Since amphetamine use per se has been suspected to affect regional brain volumes (Thompson et al.,2004;Jernigan et al.,2005),we made separate analyses among amphetamine-naïve subjects. Those offenders who had never used amphetamine(n=11, 3belonging to high psychopathy group and8to the low psychopathy group)displayed greater volumes in all6 areas than the healthy men,and this difference was statistically significant in right occipital white matter (effect size0.78,P=0.033)and left occipital white matter (effect size1.03,P=0.009).We further examined the six brain regions(right cerebellar grey matter,left cerebellar white matter,and parietal and occipital white matter bilaterally)where the offenders displayed greater volumes than the healthy men. Among the26violent offenders,associations between the adjusted volumes in these regions and total PCL-R total scores,global IQ scores,duration of alcohol abuse, presence of polysubstance abuse,and use of current psychotropic medication were not statistically significant. The only significant correlation between the adjusted brain volumes in these regions and PCL-R factor scores was observed between the score for Impulsive Irrespon-sible Lifestyle and left cerebellar white matter(r=−0.52, P=0.006;Bonferroni corrected significance level P=0.05/6=0.008).Correlations between regional brain volumes and scores for Arrogant and Deceitful BehaviorTable2Comparisons of sociodemographic and clinical characteristics(mean±S.D.)of the offenders with psychopathy and those with only ASPDOffenders with psychopathy (N=12)Offenderswith onlyASPD(N=14)Statistic P-valueMean age(in years)33.0±8.632.1±8.5t=0.2560.800Duration of alcoholabuse(in years)19.6±10.018.3±8.9t=0.3560.725Polysubstance abuse100%57%χ2=6.690.010Mean global IQscore94.7±8.688.7±8.8t=1.7400.095Currentpsychotropicmedication67%50%χ2=0.740.391Mean score PCL-Rtotal34.6±3.125.9±2.8t=7.566b0.001Mean score forArrogant anddeceitfulinterpersonal style6.03±1.74 1.90±1.12t=7.287b0.001Mean score forDeficientaffectiveexperience7.83±0.58 6.14±1.10t=4.782b0.001Mean score forImpulsive,irresponsiblebehavioral style9.67±1.159.71±0.47t=−0.1420.889The IQ of the offenders was assessed using the Wechsler AdultIntelligence Scale—revised(Wechsler,1981).204J.Tiihonen et al./Psychiatry Research:Neuroimaging163(2008)201–212were modest and positive (ranging from 0.12to 0.25),and those between brain volumes and Deficient Affective Experience were modest and negative (ranging from −0.07to −0.31).No statistically significant correlations were observed in the regional volumes vs.PCL-R scores in the other 14brain regions.V olumes of cerebrospinal fluid (CSF)were similar among offenders and healthy men,except in the left frontal region where offenders displayed larger volumes (F =5.68,P =0.021,age-adjusted ANCOVA).3.2.Voxel-Based MorphomethyThe results of comparisons of the 26violent offenders and 25healthy men on voxel-based morphometry of the grey matter are presented in Table 4.The violent offenders were characterized by focal,and strikingly symmetrical areas of atrophy in the postcentral gyri,frontopolar cortex (superior and medial frontal gyrus),and orbitofrontal cortex as shown in Fig.1.In addition,substantially smaller volumes were observed in the left posterior cingulate cortex and the right insula.In comparisons of the 12offenders with psychopathy and the healthy men,the differences in these same areas remained significant (P b 0.05corrected),and the z -scores were slightly larger than those obtained for the comparisons between all offenders and the healthy men.A z -score of 5.59was obtained for the difference between the offenders with psychopathy and the healthy men for left inferior parietal lobule, 4.34for right parietal lobule, 4.25for left frontopolar cortex,and 4.19for right frontopolar cortex (P b 0.05corrected for false discovery rate).In the comparison between the offenders with psychopathy and the healthy men,markedly smaller densities were also observed in the left middle temporal gyrus (cluster size 1336mm 3,x =−38,y =−78,z =20,z -score 4.06),and left parahippocampal gyrus (cluster size 3640mm 3,x =−30,y =−58,z =−8,z -score 3.99).In comparisons of the 14offenders with ASPD only compared with the healthy men or compared with offenders with psychopathy,no significant volume reductions were observed.Areas of smaller grey matter volume in offenders who never used amphetamine (N =11)compared with controls (N =25)measured with voxel-based morphom-etry (P b 0.001uncorrected)were observed in the left orbital prefrontal cortex (cluster size 792mm 3,x =−20,y =42,z =−22,z -score =4.27),in the left occipital gyrus (cluster size 1200mm 3,x =−18,y =−58,z =10,Table 3Adjusted (native brain volume/total intracranial volume×1000)brain volumes (mean±S.D.)in healthy men and violent offendersHealthy men (N =25)Violent offenders (N =26)Effect size aAge-adjusted ANCOV A F 1,48P bGrey matter Frontal Right 146.1±14.1148.1±20.20.110.0010.971Left 148.3±15.0149.0±20.00.040.1500.700Temporal Right 46.7±3.744.8±5.00.240.3590.552Left 46.4±3.947.7±5.20.280.5550.460Parietal Right 74.7±6.674.7±9.20.010.1730.679Left 76.4±6.775.9±9.2−0.050.4500.505Occipital Right 58.2±5.057.6±7.7−0.080.3530.555Left 55.8±5.055.8±6.10.010.0850.771CerebellarRight 63.7±4.767.2±5.90.67 4.9930.030Left64.2±4.067.0±5.70.57 3.5480.066White matter Frontal Right 159.1±13.3163.9±12.80.37 1.6930.199Left 163.3±11.6167.5±13.10.35 1.5850.214Temporal Right 17.1±2.516.89±3.2−0.080.0150.903Left 20.2±2.520.3±3.40.020.0720.789Parietal Right 74.4±5.978.9±5.90.76 6.9360.011Left 74.4±5.478.6±5.50.76 6.9050.012Occipital Right 46.2±4.051.2±4.7 1.1515.779b 0.001Left 42.8±3.447.7±4.4 1.2418.727b 0.001CerebellarRight 16.5±1.617.1±1.60.04 2.0700.157Left 16.6±2.217.8±1.70.63 4.9840.030a Effect size is Cohen's d (Cohen,1988).bWhen Bonferroni correction for multiple comparisons is applied,the level of significance is P =0.0025.205J.Tiihonen et al./Psychiatry Research:Neuroimaging 163(2008)201–212z-score=3.80),in the right postcentral gyrus(clustersize920mm3,x=46,y=−30,z=46,z-score=3.75),inthe left postcentral gyrus(cluster size312mm3,x=−52,y=−36,z=36,z-score=3.65),in the right superior frontal gyrus(cluster size392mm3,x=28,y=54,z=16,z-score=3.59),and in the right inferior temporalcortex(cluster size416mm3,x=58,y=−22,z=−30,z-score=3.46).However,due to the low number ofsubjects in these subgroups,none of these comparisonssurvived FDR-correction.No areas of decreased greymatter were observed in the opposite comparison.Table5and Fig.2present the results of voxel-based morphometry of white matter.Violent offenders were characterized by areas of increased white matter density in widespread regions,whereas decreased density of white matter was observed only in one location in right medial frontal gyrus when compared with healthy men.Areas of larger white matter volume in subjects with high psychopathy(N=12)compared with subjects with low psychopathy(N=14)measured with voxel-based morphometry(P b0.001uncorrect-ed)were observed in the right angular gyrus(cluster size752mm3,x=48,y=−30,z=46,z-score=3.99), in the right inferior temporal gyrus(cluster size 416mm3,x=48,y=−22,z=−24,z-score=3.70)and in the left cerebellum(cluster size632mm3,x=−14, y=−56,z=−44,z-score=3.69).However,due to the low number of subjects in these subgroups,none of these comparisons survived FDR-correction.No areas of decreased white matter were observed in the oppo-site comparison.4.DiscussionTo our knowledge,this study reports the first evidence that persistent violent offenders who fulfill the diagnostic criteria for ASPD are characterized by abnormal brain anatomy when compared with healthy men.Despite the fact that all26violent offenders had a history of substance dependence,lobar volumetry indicated that they had markedly larger grey matter volume in the right cerebellum and larger white matter volume in the right and left parietal lobes,right and left occipital lobes,and left cerebellum.The differences in these regions were even greater in comparisons of the offenders with psychopathy and healthy men.V oxel-based morphometry revealed that the violent offenders displayed symmetrical,bilateral areas of grey matter atrophy in the postcentral gyri,frontopolar cortex and orbitofrontal cortex and unilateral volume loss in the left posterior cingulate cortex and right insula as compared with the healthy men.These reductions in volume were even greater among the subgroup of offenders with a diagnosis of psychopathy.The results of the present study concur with findings from two structural MRI investigations of adolescent boys with CD.In the present study,the violent offenders displayed distinct areas of reduced temporal gray matter compared with the healthy men consistent with the findings of Kruesi et al.(2004)of bilateral reductions in temporal grey matter among boys with CD.Consistent with Sterzer et al.(2005a),a significant reduction in volume of the insula was evident amongTable4Areas of smaller grey matter volume in violent offenders(N=26) compared with healthy men(N=25)measured with voxel-based morphometry(corrected for false discovery rate at P b0.05)Cluster size mm3Regions Stereotacticcoordinates(mm)Zscorex y z13032L Inferior Parietal Lobule−52−3436 5.06L Inferior Parietal Lobule−40−4246 4.50L Postcentral Gyrus−44−2248 4.136576R Inferior Parietal Lobule44−3248 4.80R Postcentral Gyrus30−4458 3.5321384L Posterior Cingulate−18−6012 4.74L Precuneus−14−6418 4.45L Precuneus−10−6824 4.405960L Superior Frontal Gyrus−2042−22 4.73L Superior Frontal Gyrus−226012 3.94L Superior Frontal Gyrus−146420 2.976360L Paracentral Lobule−8−2846 3.98L Precuneus−6−5240 3.47L Medial Frontal Gyrus−2−852 3.32352R Superior Frontal Gyrus2042−20 3.972816L Inferior Frontal Gyrus−36224 3.864488R Medial Frontal Gyrus12646 3.86R Middle Frontal Gyrus24606 3.85R Superior Frontal Gyrus285614 3.681416Fusiform Gyrus56−24−30 3.733088R Insula32228 3.59R Caudate1214−4 3.25848L Superior Temporal Gyrus−48−6028 3.50416L Middle Temporal Gyrus−52−560 3.431504Lentiform Nucleus−18180 3.39736L Middle Temporal Gyrus−38−7820 3.34648L Middle Frontal Gyrus−30−862 3.28L Middle Frontal Gyrus−40060 2.93808L Fusiform Gyrus−48−32−18 3.26L Fusiform Gyrus,Grey−58−24−26 3.09L Fusiform Gyrus−50−26−24 3.06Only those clusters larger than250mm3are shown.L=left,R=right.Reading example:the most significant voxel of the cluster hasstereotactic coordinates of−52,−34,36and is located in the region ofleft Inferior Parietal Lobule.Within the same cluster there are twomore peak of significance distant more than8mm from the former andlocated at−40,−42,46and at−44,−22,48.206J.Tiihonen et al./Psychiatry Research:Neuroimaging163(2008)201–212the persistent violent offenders as compared with the healthy men in the present study.In contrast to Sterzer et al.(2005b)and to much theorizing about the primary role that the amygdala may play in the development of psychopathy (Blair,2005),no differences were detected in the volumes of the amygdala between the violent offenders and healthy men.We have previously observed negative correlations between the volumes of the hippocampus (Laakso et al.,2001)and the amygdala (Tiihonen et al.,2000)and total PCL-R scores among different sample of offenders.The offenders in the present study did,however,show reduced volume of the parahippocampal gyrus as compared with the healthy men.Our findings are in line with results of a recent functional MRI study,which observed less activation in the limbic circuit (parahippocampal gyrus,orbitofrontal cortex,insula,and anterior and posterior cirgulate)during acquisition of fear among men with psychopathy as compared with healthy men (Birbaumer et al.,2005).Frontal cortex and,especially,orbitofrontal cortex are key areas in the regulation of violent and aggressive behavior (Grafman et al.,1996;Birbaumer et al.,2005).The finding of reduced grey matter volumes in these areas adds further support to hypotheses that the orbitofrontal cortex is malfunctioning among persistently violent offenders with a history of early-onset stable antisocial behavior (Anderson et al.,1999).Further,the findings concur with evidence showing that offenders with psychopathy present difficulties in neuropsychological tasks thought to be dependent on the integrity of the orbitofrontal cortex (Lapierre et al.,1995;Blair,2004).The increased white matter observed among the persistent violent offenders,as compared with the healthy men,was not due to the size of the corpus callosum (as can be seen in Fig.2).This result does not concur withaFig.1.Gray matter volume loss in subjects with antisocial personality disorder (N =26)compared with comparison subjects (N =25)(corrected for false discovery rate at P b 0.05).Note the striking symmetry of smaller gray matter volumes in postcentral gyri,frontopolar cortex,and orbitofrontal cortex.207J.Tiihonen et al./Psychiatry Research:Neuroimaging 163(2008)201–212。