200701 Actions on Structures Regulations and Standards
- 格式:pdf
- 大小:543.01 KB
- 文档页数:5
Seismic Collapse Safety of Reinforced ConcreteBuildings.II:Comparative Assessment of Nonductile and Ductile Moment FramesAbbie B.Liel,M.ASCE 1;Curt B.Haselton,M.ASCE 2;and Gregory G.Deierlein,F.ASCE 3Abstract:This study is the second of two companion papers to examine the seismic collapse safety of reinforced concrete frame buildings,and examines nonductile moment frames that are representative of those built before the mid-1970s in California.The probabilistic assessment relies on nonlinear dynamic simulation of structural response to calculate the collapse risk,accounting for uncertainties in ground-motion characteristics and structural modeling.The evaluation considers a set of archetypical nonductile RC frame structures of varying height that are designed according to the seismic provisions of the 1967Uniform Building Code.The results indicate that nonductile RC frame structures have a mean annual frequency of collapse ranging from 5to 14×10À3at a typical high-seismic California site,which is approximately 40times higher than corresponding results for modern code-conforming special RC moment frames.These metrics demonstrate the effectiveness of ductile detailing and capacity design requirements,which have been introduced over the past 30years to improve the safety of RC buildings.Data on comparative safety between nonductile and ductile frames may also inform the development of policies for appraising and mitigating seismic collapse risk of existing RC frame buildings.DOI:10.1061/(ASCE)ST.1943-541X .0000275.©2011American Society of Civil Engineers.CE Database subject headings:Structural failures;Earthquake engineering;Structural reliability;Reinforced concrete;Concrete structures;Seismic effects;Frames.Author keywords:Collapse;Earthquake engineering;Structural reliability;Reinforced concrete structures;Buildings;Commercial;Seismic effects.IntroductionReinforced concrete (RC)frame structures constructed in Califor-nia before the mid-1970s lack important features of good seismic design,such as strong columns and ductile detailing of reinforce-ment,making them potentially vulnerable to earthquake-induced collapse.These nonductile RC frame structures have incurred significant earthquake damage in the 1971San Fernando,1979Imperial Valley,1987Whittier Narrows,and 1994Northridge earthquakes in California,and many other earthquakes worldwide.These factors raise concerns that some of California ’s approxi-mately 40,000nonductile RC structures may present a significant hazard to life and safety in future earthquakes.However,data are lacking to gauge the significance of this risk,in relation to either the building population at large or to specific buildings.The collapse risk of an individual building depends not only on the building code provisions employed in its original design,but also structuralconfiguration,construction quality,building location,and site-spe-cific seismic hazard information.Apart from the challenges of ac-curately evaluating the collapse risk is the question of risk tolerance and the minimum level of safety that is appropriate for buildings.In this regard,comparative assessment of buildings designed accord-ing to old versus modern building codes provides a means of evalu-ating the level of acceptable risk implied by current design practice.Building code requirements for seismic design and detailing of reinforced concrete have changed significantly since the mid-1970s,in response to observed earthquake damage and an in-creased understanding of the importance of ductile detailing of reinforcement.In contrast to older nonductile RC frames,modern code-conforming special moment frames for high-seismic regions employ a variety of capacity design provisions that prevent or delay unfavorable failure modes such as column shear failure,beam-column joint failure,and soft-story mechanisms.Although there is general agreement that these changes to building code require-ments are appropriate,there is little data to quantify the associated improvements in seismic safety.Performance-based earthquake engineering methods are applied in this study to assess the likelihood of earthquake-induced collapse in archetypical nonductile RC frame structures.Performance-based earthquake engineering provides a probabilistic framework for re-lating ground-motion intensity to structural response and building performance through nonlinear time-history simulation (Deierlein 2004).The evaluation of nonductile RC frame structures is based on a set of archetypical structures designed according to the pro-visions of the 1967Uniform Building Code (UBC)(ICBO 1967).These archetype structures are representative of regular well-designed RC frame structures constructed in California between approximately 1950and 1975.Collapse is predicted through1Assistant Professor,Dept.of Civil,Environmental and Architectural Engineering,Univ.of Colorado,Boulder,CO 80309.E-mail:abbie .liel@ 2Assistant Professor,Dept.of Civil Engineering,California State Univ.,Chico,CA 95929(corresponding author).E-mail:chaselton@csuchico .edu 3Professor,Dept.of Civil and Environmental Engineering,Stanford Univ.,Stanford,CA 94305.Note.This manuscript was submitted on July 14,2009;approved on June 30,2010;published online on July 15,2010.Discussion period open until September 1,2011;separate discussions must be submitted for individual papers.This paper is part of the Journal of Structural Engineer-ing ,V ol.137,No.4,April 1,2011.©ASCE,ISSN 0733-9445/2011/4-492–502/$25.00.492/JOURNAL OF STRUCTURAL ENGINEERING ©ASCE /APRIL 2011D o w n l o a d e d f r o m a s c e l i b r a r y .o r g b y S u l t a n Q a b o o s U n i v e r s i t y o n 06/21/14. C o p y r i g h t A S CE .F o r p e r s o n a l u s e o n l y ; a l l r i g h t s r e s e r v e d .nonlinear dynamic analysis of the archetype nonductile RC frames,using simulation models capable of capturing the critical aspects of strength and stiffness deterioration as the structure collapses.The outcome of the collapse performance assessment is a set of measures of building safety and relating seismic collapse resistance to seismic hazard.These results are compared with the metrics for ductile RC frames reported in a companion paper (Haselton et al.2011b ).Archetypical Reinforced Concrete Frame StructuresThe archetype nonductile RC frame structures represent the expected range in design and performance in California ’s older RC frame buildings,considering variations in structural height,configuration and design details.The archetype configurations explore key design parameters for RC components and frames,which were identified through previous analytical and experimental studies reviewed by Haselton et al.(2008).The complete set of archetype nonductile RC frame buildings developed for this study includes 26designs (Liel and Deierlein 2008).This paper focuses primarily on 12of these designs,varying in height from two to 12stories,and including both perimeter (P )and space (S )frame lateral resisting systems with alternative design details.All archetype buildings are designed for office occupancies with an 8-in.(20-cm)flat-slab floor system and 25-ft (7.6-m)column spacing.The 2-and 4-story buildings have a footprint of 125ft by 175ft (38.1m by 53.3m),and the 8-and 12-story buildings measure 125ft (38.1m)square in plan.Story heights are 15ft (4.6m)in the first story and 13ft (4.0m)in all other stories.Origi-nal structural drawings for RC frame buildings constructed in California in the 1960s were used to establish typical structural configurations and geometry for archetype structures (Liel and Deierlein 2008).The archetypes are limited to RC moment frames without infill walls,and are regular in elevation and plan,without major strength or stiffness irregularities.The nonductile RC archetype structures are designed for the highest seismic zone in the 1967UBC,Zone 3,which at that time included most of California.Structural designs of two-dimensional frames are governed by the required strength and stiffness to satisfy gravity and seismic loading combinations.The designs also satisfy all relevant building code requirements,including maximum and minimum reinforcement ratios and maximum stirrup spacing.The 1967UBC permitted an optional reduction in the design base shear if ductile detailing requirements were employed,however,this reduction is not applied and only standard levels of detailing are considered in this study.Design details for each structure areTable 1.Design Characteristics of Archetype Nonductile and Ductile RC Frames Stucture Design base shear coefficient a,bColumn size c (in :×in.)Column reinforcementratio,ρColumn hoop spacing d,e (in.)Beam size f (in :×in.)Beam reinforcementratios ρ(ρ0)Beam hoop spacing (in.)Nonductile2S 0.08624×240.0101224×240.006(0.011)112P 0.08630×300.0151530×300.003(0.011)114S 0.06820×200.0281020×260.007(0.014)124P 0.06824×280.0331424×320.007(0.009)158S 0.05428×280.0141424×260.006(0.013)118P 0.05430×360.0331526×360.008(0.010)1712S 0.04732×320.025926×300.006(0.011)1712P 0.04732×400.032930×380.006(0.013)184S g 0.06820×200.028 6.720×260.007(0.014)84S h 0.06820×200.0281020×260.007(0.014)1212S g 0.04732×320.025626×300.006(0.011)1112S h 0.04732×320.025926×300.006(0.011)17Ductile2S 0.12522×220.017518×220.006(0.012) 3.52P 0.12528×300.018528×280.007(0.008)54S 0.09222×220.016522×240.004(0.008)54P 0.09232×380.016 3.524×320.011(0.012)58S 0.05022×220.011422×220.006(0.011) 4.58P 0.05026×340.018 3.526×300.007(0.008)512S 0.04422×220.016522×280.005(0.008)512P0.04428×320.0223.528×380.006(0.007)6aThe design base shear coefficient in the 1967UBC is given by C ¼0:05=T ð1=3Þ≤0:10.For moment resisting frames,T ¼0:1N ,where N is the number of stories (ICBO 1967).bThe design base shear coefficient for modern buildings depends on the response spectrum at the site of interest.The Los Angeles site has a design spectrumdefined by S DS ¼1:0g and S D1¼0:60g.The period used in calculation of the design base shear is derived from the code equation T ¼0:016h 0:9n ,where h n isthe height of the structure in feet,and uses the coefficient for upper limit of calculated period (C u ¼1:4)(ASCE 2002).cColumn properties vary over the height of the structure and are reported here for an interior first-story column.dConfiguration of transverse reinforcement in each member depends on the required shear strength.There are at least two No.3bars at every location.eConfiguration of transverse reinforcement in ductile RC frames depends on the required shear strength.All hooks have seismic detailing and use No.4bars (ACI 2005).fBeam properties vary over the height of the structure and are reported here are for a second-floor beam.gThese design variants have better-than-average beam and column detailing.hThese design variants have better-than-average joint detailing.JOURNAL OF STRUCTURAL ENGINEERING ©ASCE /APRIL 2011/493D o w n l o a d e d f r o m a s c e l i b r a r y .o r g b y S u l t a n Q a b o o s U n i v e r s i t y o n 06/21/14. C o p y r i g h t A S CE .F o r p e r s o n a l u s e o n l y ; a l l r i g h t s r e s e r v e d .summarized in Table 1,and complete documentation of the non-ductile RC archetypes is available in Liel and Deierlein (2008).Four of the 4-and 12-story designs have enhanced detailing,as described subsequently.The collapse performance of archetypical nonductile RC frame structures is compared to the set of ductile RC frame archetypes presented in the companion paper (Haselton et al.2011b ).As sum-marized in Table 2,these ductile frames are designed according to the provisions of the International Building Code (ICC 2003),ASCE 7(ASCE 2002),and ACI 318(ACI 2005);and meet all gov-erning code requirements for strength,stiffness,capacity design,and detailing for special moment frames.The structures benefit from the provisions that have been incorporated into seismic design codes for reinforced concrete since the 1970s,including an assort-ment of capacity design provisions [e.g.,strong column-weak beam (SCWB)ratios,beam-column and joint shear capacity design]and detailing improvements (e.g.,transverse confinement in beam-column hinge regions,increased lap splice requirements,closed hooks).The ductile RC frames are designed for a typical high-seismic Los Angeles site with soil class S d that is located in the transition region of the 2003IBC design maps (Haselton and Deierlein 2007).A comparison of the structures described in Table 1reflects four decades of changes to seismic design provisions for RC moment frames.Despite modifications to the period-based equation for design base shear,the resulting base shear coefficient is relatively similar for nonductile and ductile RC frames of the same height,except in the shortest structures.More significant differencesbetween the two sets of buildings are apparent in member design and detailing,especially in the quantity,distribution,and detailing of transverse reinforcement.Modern RC frames are subject to shear capacity design provisions and more stringent limitations on stirrup spacing,such that transverse reinforcement is spaced two to four times more closely in ductile RC beams and columns.The SCWB ratio enforces minimum column strengths to delay the formation of story mechanisms.As a result,the ratio of column to beam strength at each joint is approximately 30%higher (on average)in the duc-tile RC frames than the nonductile RC frames.Nonductile RC frames also have no special provision for design or reinforcement of the beam-column joint region,whereas columns in ductile RC frames are sized to meet joint shear demands with transverse reinforcement in the joints.Joint shear strength requirements in special moment frames tend to increase the column size,thereby reducing axial load ratios in columns.Nonlinear Simulation ModelsNonlinear analysis models for each archetype nonductile RC frame consist of a two-dimensional three-bay representation of the lateral resisting system,as shown in Fig.1.The analytical model repre-sents material nonlinearities in beams,columns,beam-column joints,and large deformation (P -Δ)effects that are important for simulating collapse of frames.Beam and column ends and the beam-column joint regions are modeled with member end hinges that are kinematically constrained to represent finite joint sizeTable 2.Representative Modeling Parameters in Archetype Nonductile and Ductile RC Frame Structures Structure Axial load a,b (P =A g f 0c )Initial stiffness c Plastic rotation capacity (θcap ;pl ,rad)Postcapping rotation capacity (θpc ,rad)Cyclicdeterioration d (λ)First mode period e (T 1,s)Nonductile2S 0.110:35EI g 0.0180.04041 1.12P 0.030:35EI g 0.0170.05157 1.04S 0.300:57EI g 0.0210.03333 2.04P 0.090:35EI g 0.0310.10043 2.08S 0.310:53EI g 0.0130.02832 2.28P 0.110:35EI g 0.0250.10051 2.412S 0.350:54EI g 0.0290.06353 2.312P 0.140:35EI g 0.0450.10082 2.84S f 0.300:57EI g 0.0320.04748 2.04S g 0.300:57EI g 0.0210.03333 2.012S f 0.350:54EI g 0.0430.09467 2.312S g 0.350:54EI g 0.0290.06353 2.3Ductile2S 0.060:35EI g 0.0650.100870.632P 0.010:35EI g 0.0750.1001110.664S 0.130:38EI g 0.0570.100800.944P 0.020:35EI g 0.0860.100133 1.18S 0.210:51EI g 0.0510.10080 1.88P 0.060:35EI g 0.0870.100122 1.712S 0.380:68EI g 0.0360.05857 2.112P0.070:35EI g0.0700.1001182.1a Properties reported for representative interior column in the first story.(Column model properties data from Haselton et al.2008.)bExpected axial loads include the unfactored dead load and 25%of the design live load.cEffective secant stiffness through 40%of yield strength.dλis defined such that the hysteretic energy dissipation capacity is given by Et ¼λM y θy (Haselton et al.2008).eObtained from eigenvalue analysis of frame model.fThese design variants have better-than-average beam and column detailing.gThese design variants have better-than-average joint detailing.494/JOURNAL OF STRUCTURAL ENGINEERING ©ASCE /APRIL 2011D o w n l o a d e d f r o m a s c e l i b r a r y .o r g b y S u l t a n Q a b o o s U n i v e r s i t y o n 06/21/14. C o p y r i g h t A S CE .F o r p e r s o n a l u s e o n l y ; a l l r i g h t s r e s e r v e d .effects and connected to a joint shear spring (Lowes and Altoontash 2003).The structural models do not include any contribution from nonstructural components or from gravity-load resisting structural elements that are not part of the lateral resisting system.The model is implemented in OpenSees with robust convergence algorithms (OpenSees 2009).As in the companion paper,inelastic beams,columns,and joints are modeled with concentrated springs idealized by a trilinear back-bone curve and associated hysteretic rules developed by Ibarra et al.(2005).Properties of the nonlinear springs representing beam and column elements are predicted from a series of empirical relation-ships relating column design characteristics to modeling parame-ters and calibrated to experimental data for RC columns (Haselton et al.2008).Tests used to develop empirical relationships include a large number of RC columns with nonductile detailing,and predicted model parameters reflect the observed differences in moment-rotation behavior between nonductile and ductile RC elements.As in the companion paper,calibration of model param-eters for RC beams is established on columns tested with low axial load levels because of the sparse available beam data.Fig.2(a)shows column monotonic backbone curve properties for a ductile and nonductile column (each from a 4-story building).The plastic rotation capacity θcap ;pl ,which is known to have an important influence on collapse prediction,is a function of the amount of column confinement reinforcement and axial load levels,and is approximately 2.7times greater for the ductile RC column.The ductile RC column also has a larger postcapping rotation capacity (θpc )that affects the rate of postpeak strength degradation.Fig.2(b)illustrates cyclic deterioration of column strength and stiffness under a typical loading protocol.Cyclic degradation of the initial backbone curve is controlled by the deterioration parameter λ,which is a measure of the energy dissipation capacity and is smaller in nonductile columns because of poor confinement and higher axial loads.Model parameters are calibrated to the expected level of axial compression in columns because of gravity loads and do not account for axial-flexure-shear interaction during the analysis,which may be significant in taller buildings.Modeling parameters for typical RC columns in nonductile and ductile archetypes are summarized in Table 2.Properties for RC beams are similar and reported elsewhere (Liel and Deierlein 2008;Haselton and Deierlein 2007).All element model properties are calibrated to median values of test data.Although the hysteretic beam and column spring parameters incorporate bond-slip at the member ends,they do not account for significant degradations that may occur because of anchorage or splice failure in nonductile frames.Unlike ductile RC frames,in which capacity design require-ments limit joint shear deformations,nonductile RC frames may experience significant joint shear damage contributing to collapse (Liel and Deierlein 2008).Joint shear behavior is modeled with an inelastic spring,as illustrated in Fig.1and defined by a monotonic backbone and hysteretic rules (similar to those shown in Fig.2for columns).The properties of the joint shear spring are on the basisofFig.1.Schematic of the RC frame structural analysismodel(a)(b)Fig.2.Properties of inelastic springs used to model ductile and non-ductile RC columns in the first story of a typical 4-story space frame:(a)monotonic behavior;(b)cyclic behaviorJOURNAL OF STRUCTURAL ENGINEERING ©ASCE /APRIL 2011/495D o w n l o a d e d f r o m a s c e l i b r a r y .o r g b y S u l t a n Q a b o o s U n i v e r s i t y o n 06/21/14. C o p y r i g h t A S CE .F o r p e r s o n a l u s e o n l y ; a l l r i g h t s r e s e r v e d .selected subassembly data of joints with minimal amounts of trans-verse reinforcement and other nonductile characteristics.Unfortu-nately,available data on nonconforming joints are limited.Joint shear strength is computed using a modified version of the ACI 318equation (ACI 2005),and depends on joint size (b j is joint width,h is height),concrete compressive strength (f 0c ,units:psi),and confinement (γ,which is 12to 20depending on the configu-ration of confining beams)such that V ¼0:7γffiffiffiffif 0c p b j h .The 0.7modification factor is on the basis of empirical data from Mitra and Lowes (2007)and reflects differences in shear strength between seismically detailed joints (as assumed in ACI 318Chap.21)and joints without transverse reinforcement,of the type consid-ered in this study.Unlike conforming RC joints,which are assumed to behave linear elastically,nonductile RC joints have limited duc-tility,and shear plastic deformation capacity is assumed to be 0.015and 0.010rad for interior and exterior joints,respectively (Moehle et al.2006).For joints with axial load levels below 0.095,data from Pantelides et al.(2002)are used as the basis for a linear increase in deformation capacity (to a maximum of 0.025at zero axial load).Limited available data suggest a negative postcapping slope of approximately 10%of the effective initial stiffness is appropriate.Because of insubstantial data,cyclic deterioration properties are assumed to be the same as that for RC beams and columns.The calculated elastic fundamental periods of the RC frame models,reported in Table 2,reflect the effective “cracked ”stiffness of the beams and columns (35%of EI g for RC beams;35%to 80%of EI g for columns),finite joint sizes,and panel zone flexibility.The effective member stiffness properties are determined on the basis of deformations at 40%of the yield strength and include bond-slip at the member ends.The computed periods are signifi-cantly larger than values calculated from simplified formulas in ASCE (2002)and other standards,owing to the structural modeling assumptions (specifically,the assumed effective stiffness and the exclusion of the gravity-resisting system from the analysis model)and intentional conservatism in code-based formulas for building period.Nonlinear static (pushover)analysis of archetype analysis mod-els shows that the modern RC frames are stronger and have greater deformation capacities than their nonductile counterparts,as illus-trated in Fig.3.The ASCE 7-05equivalent seismic load distribu-tion is applied in the teral strength is compared on the basis of overstrength ratio,Ω,defined as the ratio between the ultimate strength and the design base shear.The ductility is com-pared on the basis of ultimate roof drift ratio (RDR ult ),defined as the roof drift ratio at which 20%of the lateral strength of the structure has been lost.As summarized in Table 3,for the archetype designs in this study,the ductile RC frames have approximately 40%more overstrength and ultimate roof drift ratios three times larger than the nonductile RC frames.The larger structural deformation capacity and overstrength in the ductile frames results from (1)greater deformation capacity in ductile versus nonductile RC components (e.g.,compare column θcap ;pl and θpc in Table 2),(2)the SCWB requirements that promote more distributed yielding over multiple stories in the ductile frames,(3)the larger column strengths in ductile frames that result from the SCWB and joint shear strength requirements,and (4)the required ratios of positive and negative bending strength of the beams in the ductile frames.Fig.3(b)illustrates the damage concentration in lower stories,especially in the nonductile archetype structures.Whereas nonlin-ear static methods are not integral to the dynamic collapse analyses,the pushover results help to relate the dynamic collapse analysis results,described subsequently,and codified nonlinear static assessment procedures.Collapse Performance Assessment ProcedureSeismic collapse performance assessment for archetype nonductile RC frame structures follows the same procedure as in the companion study of ductile RC frames (Haselton et al.2011b ).The collapse assessment is organized using incremental dynamic analysis (IDA)of nonlinear simulation models,where each RC frame model is subjected to analysis under multiple ground motions that are scaled to increasing amplitudes.For each ground motion,collapse is defined on the basis of the intensity (spectral acceleration at the first-mode period of the analysis model)of the input ground motion that results in structural collapse,as iden-tified in the analysis by excessive interstory drifts.The IDA is repeated for each record in a suite of 80ground motions,whose properties along with selection and scaling procedures are de-scribed by Haselton et al.(2011b ).The outcome of this assessment is a lognormal distribution (median,standard deviation)relating that structure ’s probability of collapse to the ground-motion inten-sity,representing a structural collapse fragility function.Uncer-tainty in prediction of the intensity at which collapse occurs,termed “record-to-record ”uncertainty (σln ;RTR ),is associated with variation in frequency content and other characteristics of ground-motion records.Although the nonlinear analysis model for RC frames can simulate sidesway collapse associated with strength and stiffness degradation in the flexural hinges of the beams andcolumnsFig.3.Pushover analysis of ductile and nonductile archetype 12-story RC perimeter frames:(a)force-displacement response;and (b)distri-bution of interstory drifts at the end of the analysis496/JOURNAL OF STRUCTURAL ENGINEERING ©ASCE /APRIL 2011D o w n l o a d e d f r o m a s c e l i b r a r y .o r g b y S u l t a n Q a b o o s U n i v e r s i t y o n 06/21/14. C o p y r i g h t A S CE .F o r p e r s o n a l u s e o n l y ; a l l r i g h t s r e s e r v e d .and beam-column joint shear deformations,the analysis model does not directly capture column shear failure.The columns in the archetype buildings in this study are expected to yield first in flexure,followed by shear failure (Elwood and Moehle 2005)rather than direct shear failure,as may be experienced by short,squat nonductile RC columns.However,observed earthquake damage and laboratory studies have shown that shear failure and subsequent loss of gravity-load-bearing capacity in one column could lead to progressive collapse in nonductile RC frames.Column shear failure is not incorporated directly because of the difficulties in accurately simulating shear or flexure-shear failure and subsequent loss of axial load-carrying capacity (Elwood 2004).Collapse modes related to column shear failure are therefore detected by postprocessing dynamic analysis results using compo-nent limit state ponent limit state functions are devel-oped from experimental data on nonductile beam-columns and predict the median column drift ratio (CDR)at which shear failure,and the subsequent loss of vertical-load-carrying capacity,will occur.Here,CDR is defined similarly to interstory drift ratio,but excludes the contribution of beam rotation and joint deforma-tion to the total drift because the functions are established on data from column component tests.Component fragility relationships for columns failing in flexure-shear developed by Aslani and Miranda (2005),building on work by Elwood (2004),are employed in this study.For columns with nonductile shear design and detailing in this study and axial load ratios of P =A g f 0c between 0.03and 0.35,Aslani and Miranda (2005)predict that shear failure occurs at a median CDR between 0.017and 0.032rad,depending on the properties of the column,and the deformation capacity decreases with increasing axial load.Sub-sequent loss of vertical-carrying capacity in a column is predicted to occur at a median CDR between 0.032and 0.10rad,again depending on the properties of the column.Since the loss of vertical-load-carrying capacity of a column may precipitate progressive structure collapse,this damage state is defined as collapse in this assessment.In postprocessing dynamic analysis results,the vertical collapse limit state is reached if,during the analysis,the drift in any column exceeds the median value of that column ’s component fragility function.If the vertical collapse mode is predicted to occur at a smaller ground-motion intensity than the sidesway collapse mode (for a particular record),then the collapse statistics are updated.This simplified approach can be shown to give comparable median results to convolving the probability distribution of column drifts experienced as a function of ground-motion intensity (engineering demands)with the com-ponent fragility curve (capacity).The total uncertainty in the col-lapse fragility is assumed to be similar in the sidesway-only case and the sidesway/axial collapse case,as it is driven by modeling and record-to-record uncertainties rather than uncertainty in the component fragilities.Incorporating this vertical collapse limit state has the effect of reducing the predicted collapse capacity of the structure.Fig.4illustrates the collapse fragility curves for the 8-story RC space frame,with and without consideration of shear failure and axial failure following shear.As shown,if one considers collapse to occur with column shear failure,then the collapse fragility can reduce considerably compared to the sidesway collapse mode.However,if one assumes that shear failure of one column does not constitute collapse and that collapse is instead associated with the loss in column axial capacity,then the resulting collapse capac-ity is only slightly less than calculations for sidesway alone.For the nonductile RC frame structures considered in this study,the limit state check for loss of vertical-carrying capacity reduces the median collapse capacity by 2%to 30%as compared to the sidesway collapse statistics that are computed without this check (Liel and Deierlein 2008).Table 3.Results of Collapse Performance Assessment for Archetype Nonductile and Ductile RC Frame Structures Structure ΩRDR ult Median Sa ðT 1Þ(g)Sa 2=50ðT 1Þ(g)Collapse marginλcollapse ×10À4IDR collapse RDR collapseNonductile 2S 1.90.0190.470.800.591090.0310.0172P 1.60.0350.680.790.85470.0400.0284S 1.40.0160.270.490.541070.0540.0284P 1.10.0130.310.470.661000.0370.0178S 1.60.0110.290.420.68640.0420.0118P 1.10.0070.230.310.751350.0340.00912S 1.90.0100.290.350.83500.0340.00612P 1.10.0050.240.420.561190.0310.0064S a 1.40.0160.350.490.72380.0560.0244S b 1.60.0180.290.490.60890.0610.02612S a 1.90.0120.330.350.93350.0390.00912S b 2.20.0120.460.351.32160.0560.012Ductile 2S 3.50.085 3.55 1.16 3.07 1.00.0970.0752P 1.80.0672.48 1.13 2.193.40.0750.0614S 2.70.047 2.220.87 2.56 1.70.0780.0504P 1.60.038 1.560.77 2.04 3.60.0850.0478S 2.30.028 1.230.54 2.29 2.40.0770.0338P 1.60.023 1.000.57 1.77 6.30.0680.02712S 2.10.0220.830.44 1.914.70.0550.01812P1.70.0260.850.471.845.20.0530.016a These design variants have better-than-average beam and column detailing.bThese design variants have better-than-average joint detailing.JOURNAL OF STRUCTURAL ENGINEERING ©ASCE /APRIL 2011/497D o w n l o a d e d f r o m a s c e l i b r a r y .o r g b y S u l t a n Q a b o o s U n i v e r s i t y o n 06/21/14. C o p y r i g h t A S CE .F o r p e r s o n a l u s e o n l y ; a l l r i g h t s r e s e r v e d .。
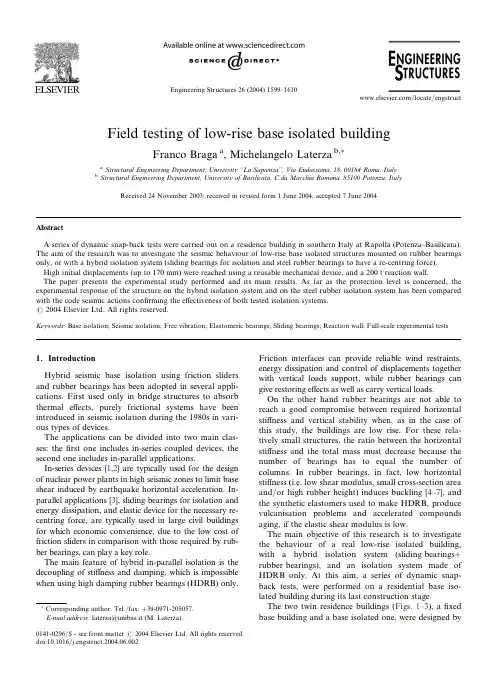
ÃCorresponding author.Tel./fax:+39-0971-205057.E-mail address:laterza@unibas.it(terza).0141-0296/$-see front matter#2004Elsevier Ltd.All rights reserved. doi:10.1016/j.engstruct.2004.06.002Fig.1.The twin buildings (fix base ‘‘B’’and base isolated ‘‘A’’)and layout oftypicalfloor.Fig.2.Foundation ofbuilding ‘‘A’’and vertical gap f orisolation.Fig.3.Transverse sections oftwin buildings.1600 F.Braga,terza /Engineering Structures 26(2004)1599–1610the authors,and are located in Southern Italy at Rapolla,Potenza,in a high seismicity area(1st Italian seismic class)on high stiffness soil.The isolated building(building‘‘A’’)has a HDRB design isolation system but a special mixed bearing, capable ofusing alternatively a slide or rubber bearing, was mounted for testing purpose.The buildings are rectangular(Fig.1)in plane (22:6mÂ13:3m)and regular along the height;the inter-story height is about 3.0m,while total height is about12m.The building is composed ofthree apartmentfloors and roof.During the tests,the total weight ofthe isolated building was about10,000kN (design weight was about16,000kN),basefloor weight was30%ofthe total weight and the same was(about 30%ofthe total)the weight ofthe‘‘top f loorþroof’’package.The columns are28,the inner columns have 40Â60cm rectangular section while the last18periph-eral columns have a40Â40cm squared section.The isolation system is placed between the founda-tions and the upper R/C structure.It is made of 28HDRB having design damping greater than10% ofcritical.Seismic design has been done according to the Italian Code Elastic Spectrum(D.M.January24,1986) for a1st seismic class(C¼0:1g)in which the town of Rapolla is located.The following acceleration spectrum was used:a g ¼aqÁCÁRðTÞÁIÁdð1Þwhere response coefficient,R(T),is equal to 1.0for T0:8s or0:862=T2=3for T>0:8s and a¼4. According to the use ofthe building,an importance coefficient I¼1has been assumed.For the isolated structure(HDRB only),an action reduction coefficient d¼1=1:2¼0:83(10%equivalent damping)has been used,in order to take into account the effects ofadditional energy dissipation.A behaviour factor q¼2was assumed for structural strength design ofthe isolated building‘‘A’’and q¼4 for thefixed base one‘‘B’’.As a result both building ‘‘A’’and‘‘B’’have been equally reinforced.The isolation system was designed to obtain a funda-mental period of2.0s,and,ifone neglects torsional effects,a maximum displacement of18cm.Structural clearances significantly greater than the latter value (about30cm)were used in order to avoid dangerous pounding between isolated and non-isolated blocks.In this way,high security is reached against further dis-placements between the topfloor and the isolated base, and against unexpected rotational motions not included in the design,due to irregular distribution of variable loads or an unexpected bearing failure.A special neoprene compound was used having low stiffness and an equivalent damping coefficient greater than10%.Table1shows the design dimensions and stiffness ofthe28bearings.Fig.4shows the main mechanical behaviour ofthe same bearings during qualification and acceptance tests on eight full-scale elastomeric bearings carried out at the Structural Laboratory ofthe University ofBasilicata. The tests were made to verify stability and creep dur-ing monotonic shear-compression tests(Fig.5),and theTable1The HDRB design dimensions and stiffnessD g(mm)D s(mm)T g(mm)N g H g(mm)T s(mm)T e(mm)H(mm)K h(kN/m)K v(kN/m) 50048043413622024265719,00000D g,rubber layers diameter(mm);D s,steel layers diameter(mm);T g,rubber layer thickness(mm);N g,number ofrubber layers;H g,total rubber height(mm);T s,steel sheets thickness(mm);T e,external plates thickness(mm);H,total isolator height(mm);K h,horizontal stiffness;K v,verticalstiffness.Fig. 4.Shear secant stiffness and equivalent damping ratioofHDRBs during laboratory tests.F.Braga,terza/Engineering Structures26(2004)1599–16101601agreement with the designed mechanical characteristics such as vertical and horizontal stiffness and energy dis-sipation during cyclic shear-compression tests (Fig.6),ofnew and accelerated ageing (21days at 70vC)devi-ces under the working conditions.The use ofa suitable number ofsteel sheets allowed attainment ofthe required ratio (about 3000)ofverti-cal over horizontal stiffness.The total height ofthe iso-lator,included the upper and lower plates,was equal to 312mm.Maximum rubber shear strain is 134%,correspond-ing to a design displacement of18cm.The distribution ofthe isolators between the two grids ofbeams allows access f or inspection and replace-ment at any time.The upper beam grid was designed and checked in order to allow replacement ofthe iso-lators using two jacks,each at 1m from the axis of the isolator.2.Hybrid system and special bearingsEach ofthe 28bearings,used in the base isolation system ofbuilding ‘‘A’’,is a package including a slider (steel–teflon bearing with about 4–5%of friction coef-ficient)mounted on top ofan HDRB.The device can work alternatively as a rubber isolator or a slider by simply locking the upper part or the lower part,respectively,(Figs.7and 8).In this way,two different isolation systems can be obtained,the first one using only the HDRBs and the second one using some bearings in which the sliders are unlocked and the elastomeric part is locked and others,for re-centring capabilities,in which the sliding part is locked and the elastomeric part unlocked.Tests on the hybrid system were performed using 12HDRB and 16sliders.The relative number of HDRBs and sliders has been fixed to obtain a natural first isolated mode period of2.0s.The presence ofa reduced mass during the tests caused the period ofthe HDRB structure to be 1.47s,instead ofthe 2.0s design period (100%mass),and keeping 12out of28HDRB was also a way to test a hybrid structure with the same period (2.0s)ofthe HDRB structure in working conditions.In the in-parallel systems,after free vibrations,the isolation system shows residual displacements generally very small because oflower f riction coefficient of sliders.In the test conditions,the number ofHDRB required to obtain a small residual displacement(aboutFig. 5.Shear-compression failure laboratory test on the Rapolla HDRBbearings.Fig. 6.Shear-compression cyclic laboratory test on the Rapolla HDRB bearings.1602 F.Braga,terza /Engineering Structures 26(2004)1599–161010mm)was about the same ofthe sliders’one (14HDRB and 14sliders).During the release tests per-formed (also by using 28HDRB system only),residual displacements larger than 10mm were measured,but they were temporary (about 24–48h)because ofthe recovery capability ofthe elastomeric bearings.The idea ofsuch a special bearing can lead to a stan-dardized production.The same type ofisolator may be employed in different applications,for different stiffness–dissipation ratio demands,for different demands of verti-cal load support,etc.,simply by changing the relative number oflocked and unlocked sliders ofthe base iso-lation system.3.Free vibration tests and snap-back test set-up In Italy,dynamic ‘‘snap-back’’tests were already carried out on the Ancona TELECOM building iso-lated on rubber bearings,using a set ofhydraulic jacks to push the structure (10cm)and dynamite for instant release [8,9],and on one ofthe isolated buildings ofthe University ofBasilicata at Potenza [10],using a mech-anical device (almost 2cm initial displacement)to push and release the structure.At Rapolla,the initial displacement was applied by moving the structure just above the isolation system using the same mechanical set-up employed at the Uni-versity ofBasilicata.The device (Fig.9)wasredesignedFig.8.Special mixed bearing used like HDRB (a)or like slider(b).Fig.7.Special mixed bearing (HDRB þslider).F.Braga,terza /Engineering Structures 26(2004)1599–16101603to apply initial displacements ranging from 0to 20cm and thrust against a 200t reaction wall founded on 5piles (150cm diameter,15m length)and designed for testing purpose (Fig.10).The release device is completely reusable and allows the tests to be repeated after a short time.It consists of a three-hinged arch (two sets oftrusses and three cylin-drical shafts)vertically pulled on the middle hinge by means ofa hydraulic jack equipped with a load cell.The release takes place when the three hinges reach the horizontal unstable alignment and the trusses detach from the middle hinge (central shaft).The device allows in-situ cyclic tests,performed by simply controlling the vertical displacement ofthe cen-tral hinge.Fig.11shows a cyclic displacement history applied to the structure and some hysteretic loops of12HDRB in parallel with 16sliders before releasing (test 4).The maximum horizontal force achieved just before the release tests was about 3000kN while maximum vertical load recorded by the jack during the load path was 1000kN.Fig.12shows horizontal and vertical loads applied before the release tests 6and the comparison with the horizontal force applied on the devices during the lab-oratory tests.In Table 2,the main tests are listed in terms ofthe applied displacement,evaluated from the original absolute position ofthe superstructure (bef ore all tests);and in terms ofthe maximum effective initial dis-placement,evaluated from the previous absolute pos-ition (end ofprevious test)minus the current test residual.Isolation system column indicates the current plane pattern ofsliders and HDRB as shown in Fig.13in which rectangles indicate unlocked sliders (HDRB locked)during tests 3–5.During the free vibrations,accelerations were recorded using 0.02or 0.2m g accuracy and Æ0.1or Æ1.0g measuring range accelerometers,and displace-ments with 0.01mm accuracy and Æ250mm measuring range linear transducers.Three horizontal accelerometers per level were loca-ted at the position shown in Fig.14for both base-floorand top-floor.Three more accelerometers were placed on the foundation frames just underneath the isolation level.Vertical accelerations were recorded by two accel-erometers G and H placed on the peripheral columns ofthe central f rame at the top floor.Two more accelerometers 1and 2were also placed on the upper corner ofthe reaction wall.Fig.14shows,also,the position ofsix displacement transducers,ofwhich,1and 2measure the displace-ments ofthe base floor relative to the ground,3and 4measure the displacements ofthe base floor relative to reaction wall,and 5and 6measure the displacements of the reaction wall relative to the ground.One more linear transducer records the vertical displacement ofthe cen-tral hinge ofthe release device during the push phase.4.Experimental resultsA comparison between the base displacements histories recorded during the main tests for the two isolation systems is shown in Fig.15.Fig.16shows the equivalent damping ratio ofthe isolation systems during the release tests calculated following the logarithmic decay law (2),n eq ¼12p ln v ðt Þv ðt þT Þ ð2Þwhere T is the first period ofisolated structure,v(t)is the peak displacement at time t ,v (t þT )is the peak displace-ment at time (t þT ).in comparison with n eq evaluated with static cyclic laboratory tests using the relationship between dissipative and elastic energy ofcycles (3).n eq ¼14p W dW e ð3Þwhere W d is the total energy dissipated by the HDRB in a complete shear-compression test cycle and W e is the elas-tic energy ofan equivalent spring at the same maximum displacement and shear force of the testcycle.Fig.9.Release device (snap-back sequence).1604 F.Braga,terza /Engineering Structures 26(2004)1599–1610F.Braga,terza/Engineering Structures26(2004)1599–16101605Fig.10.Reaction wall and test set-up.The release tests on the hybrid system gave anequivalent damping ratio n eq ofabout 30%for the first and second couple ofpeaks.The HDRB system underwent more cycles than the hybrid,allowing a more accurate evaluation of n eq ,as shown in Fig.16.HDRB bearings exhibit higher energy dissipation when the strain rate increases,as is the case for dynamic test,compared with equivalent damping ratio achieved during static laboratory tests at equal vertical stress conditions.Fig.17shows base and top-floor accelerations ofthe HDRB system in test 6and ofthe hybrid structure in test 4;it reveals higher values ofaccelerations f or the first system.The first three frequencies (Fig.18)ofthe structure were obtained using the fast Fourier transform (FFT)of the measured accelerations,and identified using an elas-tic FEM model ofthe isolated structure (Fig.19).It is clearly shown that the instantaneous release excites in the structure three different vibration frequencies.The first ofthese is due to the isolated mode,f or which the structure moves as a 1-DOF system,while the other two are related to the superstructural modes excited.Second and third mode periods equal to 0.16and 0.03s,respectively,belong to the second mode in the test direc-tion (Fig.19b )and to a vibrational mode in the plane of the first isolated floor,caused by the central impulse given to the base by the release device (Fig.19c ).The first period in the test direction (Fig.19a )ident-ified during the release is about 1.47s for the HDRB system and 2.05s for the hybrid one.It should be noted that these are underestimates ofthe real initial periods,since the FFT covered the entire duration of the signals,and periods varied during the histories.The design period (1.97s—HDRB only)is greater than the experimental period,because the masses in the release test were less than the design masses.The acquired data reveal for the hybrid system an isolated period 1.7times greater than that ofthe HDRB system (T 1mix ¼2:05s,T 1HDRB ¼1:47s),while the values ofthe higher modes periods remain almost the same (T 2¼0:16s),and FFT scanning on acceler-ation data with the windowing technique [11]shows the decrease ofthe isolated period (Fig.18,were D t0isFig.11.Cyclic test performed before the release test4.Fig.12.Applied loads before the release in situ (test 6)and to single HDRB in laboratory cyclic tests.Table 2Main tests Test number Isolation systemInitialdisplacement (mm)Effective initial displacement (mm)128HDRB 10087228HDRB150142312HDRB þ16sliders 150145412HDRB þ16sliders 155145512HDRB þ16sliders 165150628HDRB1701481606 F.Braga,terza /Engineering Structures 26(2004)1599–1610F.Braga,terza/Engineering Structures26(2004)1599–16101607Fig.13.HDRB and hybrid systems basepattern.the shift of the FFT window used to scan the signal),due to the increase in stiffness ofrubber bearings at low strain.There is also an increase in the relative importance ofthe higher mode contributions with respect to first mode contribution with change from the HDRB sys-tem to the hybrid one (Fig.18).Moreover,some other aspects are more intimately related to non-linear effects.Sliding devices,infact,while providing the structure with higher dissipation that results in a gener-ally decreased response,also amplified response of second mode as shown,after 1.5s of free vibrations,by relative ‘‘top floor-base’’accelerations time history of the hybrid system only (Fig.20).An interesting result is the maximum response induced by the release actions.The measured response can be used to compare the release action,to a typical seismic action,represented by an elastic spectrum,in terms ofmaximum acceleration induced on the isolated mass.In this way,using the Eurocode 8elastic spectrum acceleration for an A-type soil [12],as in the present case,it is possible to calculate the peak ground accel-erations oftypical Eurocode-like earthquakes that induce the same maximum measured accelerations on the total isolated mass ofbuilding A during tests 6and 4(Fig.21).A 17%equivalent damping ratio has been assumed for the HDRB system,and a 30%for the hybrid system.The equivalent ground accelerations are 0.50and 0.40g ,for the HDRB and the hybrid system,respect-ively,(neither structural or non-structural damage was observed after the tests),and become about 0.3and 0.2g in design conditions,e.g.with the design mass greater than the experimental one.The maximum accelerations ofthe isolated modes have been calculated by solving the free vibration prob-lem for two equivalent 1-DOF linear systems,by sim-ply imposing the same initial release displacements applied in the tests.The acceleration histories obtained for the first mode of the two systems are shown in Fig.22,and must be compared with the measuredbaseFig.16.Experimental evaluation ofequivalent damping n eq.Fig.18.Normalised FFT ofbase accelerations (tests 6and 4).1608 F.Braga,terza /Engineering Structures 26(2004)1599–1610and top experimental accelerations of Fig.17.The experimental signals are the sum ofthree modal responses excited by the release.The 1-DOF natural periods used,equal the experimental multi-DOF peri-ods,because ofthe high degree of isolation I !2(I ¼T ISOL =T FIX ,[13],where T ISOL is the first period of the base isolated structure and T FIX is the first period ofthe same fixed base structure).The experimental structures have I %6(28HDRB system)and I %8(12HDRB þ16sliders system)using T FIX ¼0:25s (FEM model).In this case,a M-DOF system and an equivalent 1-DOF with equal total mass and isolatorstiffness have the same first mode period,since the first M-DOF mode is essentially a rigid body translational mode,[13].5.ConclusionsThe analyses ofthe experimental data confirm good experimental behaviour for the two isolated structures,especially for the hybrid one.Hybrid isolation can be very effective in overcoming typical design problems connected with the use ofHDRB systems only,suchasFig.19.Structural modes excited by release,(a)first isolated mode (T ¼1:47s),(b)second isolated mode (T ¼0:16s),(c)mode offirst floor (T ¼0:035s).Fig.20.Relative top floor-base accelerations (tests 6and4).Fig.21.EC8elastic spectra for stiffsoils.F.Braga,terza /Engineering Structures 26(2004)1599–16101609instability,extremely low stiffness for low-rise build-ings,vertical dimensions in the seismic gap,etc.The in-parallel use ofmixed systems permits decou-pling ofstiffness and energy dissipation,especially when the re-centring action is offered by elastic devices like low damping rubber bearings (LDRB).Moreover,a hybrid-oriented design permits standardization ofthe production ofdevices,because ofthe potential changes in stiffness and energy dissipation possible by simply using different ratios among mounted sliders and rubber bearings.In the future,the two equally reinforced buildings,the traditional fixed base structure ‘‘B’’and the HDRB only base isolated structure ‘‘A’’,will provide interest-ing details on their seismic behaviour,especially regarding non-structural damage induced by low seis-mic events.At this time,the two twin experimental buildings host some residents,but the reaction wall can always be used to repeat tests on the isolated structure toinvestigate the effects ofnatural ageing and degradati-on ofHDRBs and sliders.References[1]Gue ´raud R,Noe ¨l-Leroux J-P,Livolant M,Michalopoulos AP.Seismic isolation using sliding-elastomer bearing pads.Nuclear Engineering and Design 1985;84(3):363–77.[2]Tajirian FF.Base isolation design for civil components and civilstructures.ASCE,Proceedings ofthe Structural Engineers World Congress,July 18–23,San Francisco,CA.New York:Elsevier Science;1998.[3]Ikonomou AS.Alexisismon isolation engineering for nuclear power plants.Nuclear Engineering and Design 1985;85(2):201–16.[4]Aiken D,Kelly JM,Tajirian FF.Mechanics oflow shape f ac-tor elastomeric seismic isolation bearings.Report no.UCB/EERC-89/131989.Earthquake Engineering Research Center,The University ofCalif ornia at Berkeley,1989.[5]Buckle G,Liu H.Experimental determination ofcritical loadsofelastomeric isolators at high shear strain.NCEER Bulletin 1994;8(3)[National Center for Earthquake Engineering Research,The University ofBuffalo,Buffalo NY].[6]Braga F,Laterza M,Masi A.Valutazione numerica del caricocritico di isolatori in elastomero armato.Ingegneria Sismica Anno 2000;XVII(N.1/2000):17–26[in Italian].[7]Braga F,Laterza M,Masi A,Nigro D.Valutazione sperimentaledel carico critico di isolatori cilindrici in elastomero armato.Ingegneria Sismica Anno 2000;XVII(N.1/2000):27–39[in Italian].[8]Bettinali F,Forni M,Indirli M,Martelli A,Masoni P,BonacinaG,et al.On site dynamic tests ofa large seismically isolated building.Proceedings of I nternational Meeting on Earthquake Protection ofBuildings,June,Ancona,I taly.1991,p.145.[9]Forni M,Martelli A,Spadoni B,Casalini E,Bonacina G,PucciG,et al.Dynamic tests on seismically isolated structure mock—ups and validation ofnumerical models.Proceedings of Inter-national Meeting on Earthquake Protection ofBuildings,June,Ancona,Italy.1991,p.169.[10]Bixio AR,Dolce M,Nigro D,Ponzo FC,Braga F,Nicoletti M.Repeatable dynamic release tests on a base-isolated building.Journal ofEarthquake Engineering 2001;5(3):369–93.[11]Onsay T,Haddow parison ofSTFT,gabor,and wave-let transforms in transient vibration analysis of mechanical sys-tems.ASA (Acoustical Society ofAmerica)125th Meeting.Ottawa,May.1993[2aNS5].[12]Eurocode 8:design ofstructures f or earthquake resistance.Part1:general rules,seismic actions and rules for buildings.prEN 1998-1,Draft n.5,May 2002(Doc CEN/TC250/SC8/N317).[13]Skinner RI,Robinson WH,William H.An introduction to seis-mic isolation.John Wiley and Sons;1993.Fig.22.Acceleration time histories oftotal mass due to isolation mode (tests 6and 4).1610 F.Braga,terza /Engineering Structures 26(2004)1599–1610。


Personal Data Protection Act 2010The Personal Data Protection Act2010 [Act 709] regulates the collection, recording, holding or storing of personal data, and carrying out of any operation on personal data for commercial transactions. The Act, however, does not restrain a party from processing data if the processing is done legitimately, in accordance with its principles.The Personal Data Protection Act (PDPA) does not apply to Federal and State Governments; non-commercial transactions; personal, family and household affairs; credit reference agencies; personal data processed outside of Malaysia (unless the data is intended to be further processed in Malaysia).The PDPA applies to personal data used in commercial transactions that relates to a living individual who can be identified directly or indirectly. Personal data includes : Name, NRIC No., Passport No., Address, email Address, information from personal file, photos, sensitive data (e.g. medical history), CCTV images.The stakeholders under the PDPA are :•The Minister of Information, Communications and Culture – who is charged with the responsibility for the protection of personal data•Personal Data Protection Commissioner (PDPC) – who is appointed by the Minister to carry out the function and powers assigned to the PDPC•Advisory Committee– to advise the PDPC on matters relating to personal data protection, administration and enforcement of the PDPA•Appeal Tribunal– any person assigned with the decision of the PDPC such as registration of data use, refusal of PDPC to register code of practice, etc. may appeal to the Appeal Tribunal•Data User Forum– Members from the industries such as banks, telcos, insurance companiesThe various roles under the PDPA comprise :•Data User(banks, insurance companies, telcos, private dental clinics, etc.) – person authorized to process personal data•Data Processor – organization that holds or processes data on behalf of the data user •Data Subject - person whose data is collected for processing•Third Party(e.g. solicitors, parents, court-appointed guardians– other than the data subject, data user or data processor)Classes of Data Users :All Data Users must be registered with the PDPC before they can process personal data. The form can be downloaded from the website (.my). Personal Data Protection (Class of Data Users) Order 2013 is effective 15 November 2013 and specifies the following classes of Data Users :1. Communications2. Banking and Financial Institutions3. Insurance4. Health*5. Tourism and Hospitalities6. Transportation7. Education8. Direct Selling9. Services10. Real Estate11. Utilities*For Health, the Data User is :(a) A licensee under the Private Healthcare Facilities and Services Act 1998 [Act 586](b) A holder of the certificate of registration of a private medical clinic or a private dentalclinic under the PHFSA 1998(c) A body corporate registered under the Registration of Pharmacists Act 1951 [Act 371] IMPORTANTData Users have 3 months to be registered as a Data User from 15 November 2013, and 3 months to comply with the provisions of the PDPA from that date. The certificate of registration is valid for not less than12 months unless revoked by the PDPC. Renewal of certificate of registration is upon expiration of the validity. The certificate is to be displayed prominently at the principal place of business, and a certified true copy of the certificate for each branch.The processing of personal data by a Data User has to be in compliance with Personal Data Protection Principles :1. General Principle2. Notice and Choice Principle3. Disclosure Principle4. Security Principle5. Retention Principle6. Data Integrity Principle7. Access PrincipleIn brief, these can be summarized as :•Data Users can process personal data once the Data Subject has given consent to the processing.•Processing is for a lawful purpose directly related to and activity of the data user.•Processing is necessary or directly related to that purpose (the Data User requires to operate the business).•Personal Data is adequate but not excessive to that purpose.•Sensitive Data can be processed with explicit consent from the Data subject and subject to Section 40 of the PDPA.(Section 40 of the PDPA – processing is necessary for employment, medical, legal, administration of justice, information has been made public by Data Subject)•Sensitive Data means physical or mental health or condition of a Data Subject, political opinions, religious beliefs of a similar nature, any crime or alleged crime committed by Data Subject or any other personal data the Minister may determine.Consent of Data Subject :These are listed under the Personal Data Protection Regulations - Regulations 3(1) – (5), as follows:•Consent in any form as long as it can be recorded and maintained properly by Data User •Consent form appearance must be distinguishable from other matters•Consent can be obtained from parent, guardian or person with parental responsibility if Data Subject is under 18 years old•Consent can be obtained from a person appointed by court to manage affairs of the Data Subject or person authorized in writing by Data Subject to act on his behalf •Burden of proof for such consent shall lie on the Data UserExemptions to Consent :•Performance of a contract to which Data Subject is a party•At the request of the Data Subject with a view of entering into a contract•Compliance with legal obligation•To protect the vital interest of the Data Subject (e.g. in life and death situation where medical history is disclosed after a serious accident when it is impossible to obtain Data Subject’s prior consent)•Administration of justice•Exercise of any functions conferred on any person by or under the lawThe PDPA Criminal Offences are as follows :•Failure to register•Contravention of Data Protection Principles•Processing after registration revoked•Disclosure without consent•Transferring data without adequate protection•Unlawful collection•Selling dataPenalties under the PDPA are :•Processing without registration – S 16 – RM500K or a prison term not exceeding 3 years or both•Contravention of Data Protection Principles – S 5(2) – RM300K or a prison term not exceeding 2 years or both•Failure to comply with data correction request – S 37 – RM100K or a prison term not exceeding 1 year or both•Processing personal data after Data Subject consent has been withdrawn – S 38(4) – RM 100K or a prison term not exceeding 1 year or bothRECOMMENDATIONSAll Data Users have to comply with this Act. It must be emphasized that Registration has to be undertaken by 15 February, 2014.。
A Planar Magic-T Structure Using SubstrateIntegrated Circuits Concept andIts Mixer ApplicationsFan Fan He,Ke Wu ,Fellow,IEEE ,Wei Hong ,Senior Member,IEEE ,Liang Han ,Student Member,IEEE ,and Xiaoping ChenAbstract—In this paper,a planar 180phase-reversal T-junc-tion and a modified magic-T using substrate integrated waveguide (SIW)and slotline are proposed and developed for RF/microwave applications on the basis of the substrate integrated circuits con-cept.In this case,slotline is used to generate the odd-symmetric field pattern of the SIW in the phase-reverse T-junction.Measured results indicate that 0.3-dB amplitude imbalance and 3phase imbalance can be achieved for the proposed 180phase-reversal T-junction over theentire -band.The modified narrowband and optimized wideband magic-T are developed and fabricated,respectively.Measured results of all those circuits agree well with their simulated ones.Finally,as an application demonstration of our proposed magic-T,a singly balanced mixer based on this structure is designed and measured with good performances.Index Terms—Magic-T,180phase-reverse T-junction,slotline,substrate integrated circuits (SICs),substrate integrated wave-guide (SIW).I.I NTRODUCTIONASLOTINE presents advantages in the design of mi-crowave and millimeter-wave integrated circuits,espe-cially when solid-state active devices are involved.Recently,the substrate integrated circuits (SICs)concept,involving the substrate integrated waveguide (SIW)technique and other synthesized nonplanar structures in planar form with planar circuits,has been demonstrated as a very promising scheme for low-cost,small size,relatively high power,low radiation loss,and high-density integrated microwave and millimeter-waveManuscript received December 22,2009;revised May 21,2010;accepted September 08,2010.Date of publication December 03,2010;date of current version January 12,2011.This work was supported in part by the Natural Sci-ences and Engineering Research Council of Canada (NSERC),in part by the National 973Project of China under Grant 2010CB327400and in part by the National Nature Science Foundation of China (NSFC)under Grant 60921063.F.F.He is with the Poly-Grames Research Center,Department of Electrical Engineering,École Polytechnique de Montreal,Montreal,QC,Canada H3C 3A7,and also with the State Key Laboraotry of Millimeter Waves,College of Information Science and Engineering,Southeast University,Nanjing 210096,China (e-mail:fanfan.he@polymtl.ca).K.Wu,L.Han,and X.Chen are with the Poly-Grames Research Center,De-partment of Electrical Engineering,École Polytechnique de Montreal,Montreal,QC,Canada H3C 3A7(e-mail:ke.wu@).W.Hong is with the State Key Laboratory of Millimeter Waves,College of Information Science and Engineering,Southeast University,Nanjing 210096,China (e-mail:weihong@).Color versions of one or more of the figures in this paper are available online at .Digital Object Identifier 10.1109/TMTT.2010.2091195components and systems [1]–[6].Alternatively named inte-grated waveguide structures of the SIW,such as laminated waveguide or post-wall waveguide,can be found in [7]and [8].The transitions from the SIW to slotline [9]have already been investigated theoretically and experimentally,which provide a design base to integrate SIW circuits with slotline circuits.As a fundamental and important component,the magic-T has widely been used in microwave and millimeter-wave circuits such as balanced mixers,power combiners or dividers,balance amplifiers,frequency discriminators,and feeding networks of antenna array [10],[11].Following intensive investigations of SIW components and systems in the past ten years,more and more attention is being paid to integrate the conventional magic-T based on SIW technology.Some SIW-based magic-T structures have been proposed and studied [9],[12],[13].In [12]and [13],magic-T techniques were developed using multilayer low-temperature co-fired ceramic (LTCC)or printed circuit board (PCB)processes.An SIW planar magic-T was successfully designed with relatively narrowband character-istics in [9].This magic-T consisting of an SIW T-junction,a slotline T-junction,and two phase-reverse slotline-to-SIW T-junctions,and it has an 8%bandwidth centered at 9GHz with 0.2-dB amplitude and 1.5phase imbalances.In this paper,a modified version of a planar SIW magic-T,which only consists of a phase-reverse slotline-to-SIW T-junction andan -plane SIW T-junction,is proposed and presented,as shown in Fig.1,which has smaller size and wider bandwidth than its previous version [9].Described in Section II are the analysis and discussions of the proposed 180phase-reversal slotline-to-SIW T-junction with its simulated and measured results.In Section III,the modified planar magic-T structures with direct design and with further optimization are discussed with their transmission line models.Measured results agree with simulated results very well.Ad-ditional wideband slotline-to-microstrip and SIW-to-microstrip transitions are designed for port-to-port measurements of mi-crostrip line in support of experimental characterization of the proposed structures.In the end,a singly balanced mixer based on our modified wideband magic-T is developed.All the struc-tures in this paper are simulated with means of the full-wave simulation tool Ansoft HFSS,designed and fabricated on an RT/Duroid 6010substrate with a dielectric constant of 10.2and a thickness of 0.635mm.0018-9480/$26.00©2010IEEEFig.1.Physical 3-D configurations of the modified magic-T.II.P HASE -R EVERSAL S LOTLINE -TO -SIW T-J UNCTION Here,the slotline-to-SIW T-junction acts as a mode converter between the slotline and SIW.Fig.2(a)depicts the physical 3-Dconfiguration of the slotline-to-SIW T-junction,whereis the width of metallicslot,is the SIW width,and is the slotline width.The yellow (in online version)and dark layers are the top metal cover and bottom metal cover.The light gray area means substrate.The slotline and SIW structures in-tersect with each other in which the slotline extendslength into the metallic cover of the SIW with a short-circuited termina-tion.Two via-posts with the diameterof are used to optimize the return loss of the T-junction.Fig.2(b)shows the cross sec-tion at the A–A plane,where the orientation of electric fields is sketched.When the signal is coupled from the slotline into the SIW at the A–A plane,the electric fields of the slotline mode are converted to those of the half-mode SIW (or HMSIW)mode [14]because of overlapped metallic covers on the top and bottom of the SIW.As such,two phase-reverse waves come out of ports P2and P3.Fig.2(c)shows the equivalent circuit model of the T-junction.The model is similar to that of an -plane waveguide T-junc-tion due to their similar electric fieldconversion.and are the characteristic admittances of the slotline and HMSIW,re-spectively.In the equivalentcircuit,is used instead of the SIW characteristic admittance because both of them have al-most the same value.Based on the above principle,parameters,,and are mainly dependent on slotline’slength ,width ,and at the slotline port (port 1),and mainly depends on the SIWwidth .Therefore,the rela-tionship between parameters of the equivalent circuit and return loss at port 1is replaced by that between parameters of phys-ical configuration and return loss at port 1.In order to minimize any potential radiation loss while transmitting signal from the slotline to the SIW,a possible minimum width of the slot line ischosenasmm.Fig.2.(a)Physical description and parameters of the slotline-to-SIW T-junc-tion.W=0:2mm,W =7:3mm,D =0:6mm,L =4:6mm,L =4mm,andW =8mm.(b)Electric field distribution at cross section A–A plane.(c)Equivalent circuit for the slotline-to-SIW T-junction.Fig.3shows simulated and measured frequency responses of power dividing and return loss of the 180phase-reversal slot-line-to-SIW T-junction.The imbalance in amplitude and phase are,respectively,0.3dB and 3,as shown in Fig.4.These results suggest that the junction has broadband characteristics.Fig.5presents a photograph of the T-junction.III.M ODIFIED P LANAR S LOTLINE -TO -SIW M AGIC -T A.Magic-T Circuit Configuration and Operating Principle Fig.1describes the physical 3-D configuration of the pro-posed magic-T.The yellow (in online version)and dark layers are the top metal cover and bottom metal cover.The light gray area means substrate.The orange areas (in online version)are metallic slots for the SIW.This magic-T consists of anSIW -plane T-junction and a slotline-to-SIW T-junction.Two such T-junctions share the two common arms with 45rotation.Metallic vias V1and V2withdiameter are used to construct theSIW -plane T-junction.Ports 1(port)and 4(port)are sum and difference ports,respectively,while ports 2and 3are the power dividing arms.Without the microstrip line-to-SIW and slotline-to-microstrip line transitions,the size of the magic-T is about 20mm 20mm.A signal applied toFig.3.Simulated and measured frequency responses of power dividing and return loss for the 180slotline-to-SIWT-junction.Fig.4.Measured amplitude and phase imbalances of the slotline-to-SIWT-junction.Fig.5Photograph of the slotline-to-SIW T-junction.Left and right figures are the top view and bottom view,respectively.port 1is split into two in-phase components by metallic via V1.The two components cancel each other at the slotline,while port 4is isolated.In this case,the four-port junction works as anSIW -plane T-junction and the symmetrical plane A–B becomes a virtual open plane.Otherwise,the four-port junction works as a slotline-to-SIW T-junction and the plane A–B becomes a virtual ground plane when a signal is applied to port 4.The input signal is naturally split into two equal and out-of-phase signals at ports 2and 3,and port 1is isolated in thiscase.Fig.6.Corresponding equivalent circuit of themagic-T.Fig.7.Simplified equivalent circuits of the magic-T.(a)In-phase.(b)Out-of-phase.The operating principle of the modified magic-T can also be well explained by its corresponding equivalent cir-cuit at the working frequency shown in Fig.6,where the slot-to-SIW T-junction can be seen as an ideal transformer and theSIW -plane T-junction as a divider.Parameters,,,and stand for the characteristic impedances,slotline,ground slotline,HMSIW,and SIW,re-spectively.In the in-phase case,the equivalent circuit model will further be simplified as depicted in Fig.7(a),whenat the working frequency.Inthe out-of-phase case,the simplified equivalent is shown inFig.7(b),where.On the basis of the above dis-cussion,distancesand should depend on the positions of the three metallic vias in the magic-T circuit.B.Implementation and ResultsBased on the above-stated principle,two magic-T struc-tures are designed and fabricated on an RT/Duroid 6010LMFig.8.Photograph of the modified magic-T.Left and right figures are the top view and bottom view,respectively.TABLE ID IMENSIONS OF THE M ODIFIED N ARROWBAND M AGIC-Tsubstrate,respectively,with narrowband and wideband char-acteristics.Thus,the narrowband and wideband cases of the magic-T will be discussed separately.Fig.8shows the top view and bottom views of the modified magic-T’s photograph.From this photograph,we can estimate that the size of the magic-T is reduced by near 50%with reference to [9].1)Narrowband Case:The two out-of-phase signals cancel each other at port 1as described in Section II-A,and simulta-neously thedistance is equal to a quarter of the guide wave-length of the SIW at the working frequency.Thus,the working bandwidth of the return loss at port 4should be narrow in a sim-ilar manner to the previous design [9].However,the working bandwidth judging from the return loss at port 1should be wider because the two in-phase signals cancel each other in the slotline at port 4.In this demonstration,the magic-T was designed at 9GHz.All design parameters of the magic-T are listed in Table I.Fig.9shows the return loss and insertion loss of the fabri-cated narrowbandmagic-T.is lower than 15dB from 8.7to 9.4GHz with a 7.8%bandwidth,which has validated the above discussion.Within the frequency range of interest,the minimum insertion loss is 0.7dB and it is less than 0.8dB in both in-phase and out-of-phase cases.Simulated and measured isolation characteristics are described in Fig.10.The isolation is better than 30dB between ports 1and 4,and better than 20dB between ports 2and 3over the entire frequency range.As shown in Fig.11(a)and (b),the maximum phase and amplitude imbal-ances for both in-phase and out-of-phase cases are less than 1.5and 0.5dB,respectively.2)Wideband Case:The narrowband characteristics of this magic-T have well been confirmed in the above discussion.However,an interesting outcome can be observed in that the re-turn-loss defined bandwidth can be broadened by optimizing theparameter valuesof,,,and .When the signal flows into the SIW from the slotline in this slotline-to-SIW structure,it would be split into two components and each ofthem will propagate alonglineat the working frequency,as Fig.9.Simulated and measured frequency responses of the magic-T.(a)Returnloss.(b)Insertionloss.Fig.10.Simulated and measured isolation characteristics of the magic-T.shown in Fig.1.Nevertheless,the propagating directions being different slightly at different frequencies provide a possibility of broadening the bandwidth of the magic-T.In other words,it is possible for the magic-T to simultaneouslyrealize,and,at twodifferent frequencies.In our proposed broadband design,these two frequencies are set at 8.7and 9.8GHz.Through optimiza-tion,some geometrical parameters of magic-T are changedFig.11.Measured results of amplitude and phase imbalance characteristics of the magic-T.(a)Amplitude.(b)Phase.suchthatmm,mm,mm,and mm.Fig.12(a)shows the newly designed magic-T’s simulated andmeasured return losses at each port.Among the results,simu-lated indicates that the above two geometrical conditionsfor achieving broadband performances are readily satisfied at8.7and9.8GHz.Measured return loss is better than15dB from8.4to10.6GHz with23.2%bandwidth.In this broadband fre-quency range,the insertion loss is less than0.9dB and the min-imum insertion loss is0.7dB in both in-phase and out-of-phasecases,as shown in Fig.12(b).Measured and simulated isola-tion curves between port1and port4or port2and port3areplotted in Fig.13.In addition,the amplitude and phase imbal-ances of the magic-T are2and0.5dB,respectively,as shownin Fig.14(a)and(b).Measured results of all circuits agree wellwith their simulated counterparts.IV.M ODIFIED M AGIC-T’s A PPLICATION IN M IXER D ESIGNAs a practical and straightforward demonstration of ourmodified magic-T applications,a singly balanced mixer isdesigned,as shown in Fig.15.Fig.16shows the photographof the practical mixer.An antiparallel pair of seriesconnectedFig.12Simulated and measured frequency responses of the magic-T.(a)Re-turn loss.(b)Insertionloss.Fig.13.Simulated and measured isolation characteristics of the magic-T.diodes(SMS7630-006LF from Skyworks Inc.,Woburn,MA)is adopted.Generally,a quarter-wavelength short stub in thematching circuit is need for providing a dc return and goodIF-to-RF and IF-to-local oscillator(LO)isolations.However,a matching circuit is designed between the diode and SIWwithout using a quarter-wavelength short stub because the SIWis grounded inherently.Two open-circuited stubs onFig.14.Measured results of amplitude and phase imbalance characteristics of the magic-T.(a)Amplitude.(b)Phase.Fig.15.Circuit topology of the proposed mixer.the right side of the diodes pair are used to provide a terminal virtual grounding point for LO frequency and RF frequency simultaneously.In addition,a low-pass filter is designed to suppress LO and RF signals at IF port.The mixer designed and simulated by the harmonic balance (HB)method in Agilent ADS software combined withmeasured -parameters of the wideband magic-T structure.Fig.17depicts the measured conversion loss versus LO input power level when the IF signal is fixed at 1GHz with an input power level of 30dBm and LO frequency is fixed at 10.2GHz.When the LO input power level is larger than 13dBm,the con-version loss almost is about 7.4dB.Fig.18shows the measured conversion loss versus IF frequency when the IF signal isswept Fig.16.Photograph of themixer.Fig.17.Measured conversion loss versus LO inputpower.Fig.18.Measured conversion loss versus IF frequency.from 0.1to 4GHz (RF is from 10.1to 6.2GHz)with a constant input power level of 30dBm,and the LO signal is fixed at the frequency of 10.2GHz with a 13-dBm power level.The mea-sured conversion loss is about80.6dB over the IF frequency range of 0.1–3GHz (RF is from 7.2to 10.1GHz).Fig.19plots the measured conversion loss versus input RF power level,where RF frequency is set at 9.2GHz and LO frequency is at 10.2GHz with a power level of 13dBm,input RF power level is swept from 30to 5dBm.The output IF power almost in-creases with the RF power linearly when the RF power level is less than 3dBm.On the other hand,when the RF power level is larger than 0dBm,the mixer is driven into the nonlinearity region.From this figure,it can also be seen that the input 1-dBFig.19.Measured IF output power versus RF input powercompression point is around 3dBm.Moreover,the LO-to-IF isolation is about 40dB.All the measurement results dictate that this mixer is suitable for wideband applications.V .C ONCLUSIONThe slotline-to-SIW 180reversal T-junction with its simple equivalent circuit model has been presented.The modified SIW magic-Ts were then developed with narrowband and wideband cases,respectively.The operating principles and transmission line models for both cases have also been presented.Good per-formances related to the insertion loss,isolation,and balance were observed for our fabricated prototypes designed over theentire -band.Finally,a singly balanced mixer based on the modified magic-T was designed to validate the magic-T.Those novel structures are key components for designing integrated microwave and millimeter-wave circuits and systems such as the antenna feed network and mono-pulse radar.A CKNOWLEDGMENTThe authors would like to thank the Rogers Corporation,Rogers,CT,for providing the free samples of the RT/Duroid 6010LM substrate and to S.Dubéand A.Traian,both with the Poly-Grames Research Center,Montreal,QC,Canada,for the fabrication of the experimental prototypes.The authors also thank the anonymous reviewers for their comments and suggestions on this paper.R EFERENCES[1]K.Wu, D.Deslandes,and Y.Cassivi,“The substrate integratedcircuits—A new concept for high-frequency electronics and op-toeletronics,”in Telecommun.Modern Satellite,Cable,Broadcast.Service/TELSIKS 6th Int.Conf.,Oct.2003,vol.1,pp.P-III–P-X.[2]F.Xu,Y.L.Zhang,W.Hong,K.Wu,and T.J.Cui,“Finite-differencefrequency-domain algorithm for modeling guided-wave properties of substrate integrated waveguide,”IEEE Trans.Microw.Theory Tech.,vol.51,no.11,pp.2221–2227,Nov.2003.[3]F.F.He,K.Wu,W.Hong,J.T.Hong,H.B.Zhu,and J.X.Chen,“Suppression of second and third harmonics using =4low-impedance substrate integrated waveguide bias line in power amplifier,”IEEE Mi-crow.Wireless Compon.Lett.,vol.18,no.7,pp.479–481,Jul.2008.[4]P.Chen,W.Hong,Z.Q.Kuai,J.F.Xu,H.M.Wang,J.X.Chen,H.J.Tang,J.Y.Zhou,and K.Wu,“A multibeam antenna based on sub-strate integrated waveguide technology for MIMO Wireless Communi-cations,”IEEE Trans.Antennas Propag.,vol.57,no.6,pp.1813–1821,Jun.2009.[5]D.Deslandes and K.Wu,“Integrated microstrip and rectangular wave-guide in planar form,”IEEE Microw.Wireless Compon.Lett.,vol.11,no.2,pp.68–70,Feb.2001.[6]J.X.Chen,W.Hong,Z.C.Hao,H.Li,and K.Wu,“Developmentof a low cost microwave mixer using a broadband substrate integrated waveguide (SIW)coupler,”IEEE Microw.Wireless Compon.Lett.,vol.16,no.2,pp.84–86,Feb.2006.[7]A.Piloto,K.Leahy,B.Flanick,and K.A.Zaki,“Waveguide filtershaving a layered dielectric structures,”U.S.Patent 5382931,Jan.17,1995.[8]J.Hirokawa and M.Ando,“45linearly polarized post-wall wave-guide-fed parallel-plate slot arrays,”Proc.Inst.Elect.Eng.–Microw.Antennas,Propag.,vol.147,no.6,pp.515–519,Dec.2000.[9]F.F.He,K.Wu,W.Hong,H.J.Hong,H.B.Zhu,and J.X.Chen,“A planar magic-T using substrate integrated circuits concept,”IEEE Microw.Wireless Compon.Lett.,vol.18,no.6,pp.386–388,Jun.2008.[10]T.Tokumitsu,S.Hara,and M.Aikawa,“Very small ultra-wide-bandMMIC magic T and applications to combiners and dividers,”IEEE Trans.Microw.Theory Tech.,vol.37,no.12,pp.1985–1990,Dec.1989.[11]C.P.Tresselt,“Broad-band high IF mixers based on magic T’s,”IEEETrans.Microw.Theory Tech.,vol.MTT-18,no.1,pp.58–60,Jan.1970.[12]T.M.Shen,T.Y.Huang,and R.B.Wu,“A laminated waveguidemagic-T in multilayer LTCC,”in IEEE MTT-S Int.Microw.Symp.Dig.,Jun.2009,pp.713–716.[13]L.Han,K.Wu,and S.Winkler,“Singly balanced mixer using substrateintegrated waveguide magic-T structure,”in Eur.Wireless Technol.Conf.,2008,pp.9–12.[14]W.Hong,B.Liu,Y.Q.Wang,i,H.J.Tang,X.X.Yin,Y.D.Dong,Y.Zhang,and K.Wu,“Half mode substrate integrated wave-guide:A new guided wave structure for microwave and millimeter wave application,”in Joint 31st Int.Infrared Millim.Waves Conf./14th Int.Terahertz Electron.Conf.,Shanghai,China,Sep.18–22,2006,p.219.Fan Fan He was born in Nanjing,China.He received the M.S.degree in mechanical–electrical engineering from Xidian University,Xi’an,China,in 2005,and is currently working toward the Ph.D.degree in elec-trical engineering both at Southeast University,Nan-jing,China,and the École Polytechnique de Mon-tréal,Montréal,QC,Canada,as an exchange student.His current research interests include advanced microwave and millimeter-wave components andsystems.Ke Wu (M’87–SM’92–F’01)is currently a Professor of electrical engineering and Tier-I Canada Research Chair in RF and millimeter-wave engineering with the École Polytechnique de Montreal,Montreal,QC,Canada.He also holds the first Cheung Kong endowed chair professorship (visiting)with South-east University,the first Sir Yue-Kong Pao chair professorship (visiting)with Ningbo University,and an honorary professorship with the Nanjing University of Science and Technology and the City University of Hong Kong.He has been the Directorof the Poly-Grames Research Center and the Director of the Center for Radiofrequency Electronics Research of Quebec (Regroupement stratégique of FRQNT).He has authored or coauthored over 630referred papers and a number of books/book chapters.He holds numerous patents.He has served on the Editorial/Review Boards of many technical journals,transactions and letters,as well as scientific encyclopedia as both an editor and guest editor.His current research interests involve SICs,antenna arrays,advanced computer-aided design (CAD)and modeling techniques,and development of low-cost RF and millimeter-wave transceivers and sensors for wireless systems and biomedical applications.He is also interested in the modeling and design of microwave photonic circuits and systems.Dr.Wu is a member of the Electromagnetics Academy,Sigma Xi,and the URSI.He is a Fellow of the Canadian Academy of Engineering (CAE)and the Royal Society of Canada (The Canadian Academy of the Sciences and Human-ities).He has held key positions in and has served on various panels and in-ternational committees including the chair of Technical Program Committees,International Steering Committees,and international conferences/symposia.He will be the general chair of the 2012IEEE Microwave Theory and Techniques Society (IEEE MTT-S)International Microwave Symposium (IMS).He is cur-rently the chair of the joint IEEE chapters of the IEEE MTT-S/Antennas and Propagation Society (AP-S)/Lasers and Electro-Optics Society (LEOS),Mon-treal,QC,Canada.He was an elected IEEE MTT-S Administrative Committee (AdCom)member for 2006–2009.He is the chair of the IEEE MTT-S Transna-tional Committee.He is an IEEE MTT-S Distinguished Microwave Lecturer (2009–2011).He was the recipient of many awards and prizes including the first IEEE MTT-S Outstanding Young Engineer Award and the 2004Fessenden Medal of the IEEECanada.Wei Hong (M’92–SM’07)was born in Hebei Province,China,on October 24,1962.He received the B.S.degree from the Zhenzhou Institute of Technology,Zhenzhou,China,in 1982,and the M.S.and Ph.D.degrees from Southeast University,Nanjing,China,in 1985and 1988,respectively,all in radio engineering.Since 1988,he has been with the State Key Lab-oratory of Millimeter Waves,Southeast University,where he is currently a Professor and the Associate Dean of the Department of Radio Engineering.In 1993and from 1995to 1998,he was a short-term Visiting Scholar with the University of California at Berkeley and the University of Santa Cruz,respectively.He has authored or coauthored over 200technical publications.He authored Principle and Application of the Method of Lines (Southeast Univ.Press,1993,in Chinese)and Domain Decomposition Method for EM Boundary Value Problems (Sci.Press,2005,in Chinese).He has been engaged in numerical methods for electromagnetic problems,millimeter-wave theory and technology,antennas,electromagnetic scattering and RF technology for mobile communications,etc.Prof.Hong is a Senior Member of the China Institute of Electronics (CIE).He is vice-president of the Microwave Society and Antenna Society of CIE.He has been a reviewer for many technical journals including the IEEE T RANSACTIONS ON A NTENNAS AND P ROPAGATION and is currently an associate editor for the IEEE T RANSACTIONS ON M ICROW A VE T HEORY AND T ECHNIQUES .He was a two-time recipient of the First-Class Science and Technology Progress Prize issued by the State Education Commission in 1992and 1994.He was a recip-ient of the Fourth-Class National Natural Science Prize in 1991,and the First-and Third-Class Science and Technology Progress Prize of Jiangsu Province.He was also the recipient of the Foundations for China Distinguished Young Investigators and the “Innovation Group”issued by the National Science Foun-dation ofChina.Liang Han (S’07)was born in Nanjing,China.He received the B.E.(with distinction)and M.S.degrees from Southeast University,Nanjing,China,in 2004and 2007,respectively,both in electrical engineering.He is currently working toward the Ph.D.degree in electrical engineering at the École Polytechnique de Montréal,Montréal,QC,Canada.His current research interests include advanced CAD and modeling techniques,and development of multifunctional RFtransceivers.Xiaoping Chen was born in Hubei province,China.He received the Ph.D.degree in electrical engineering from the Huazhong University of Science and Tech-nology,Wuhan,China,in 2003.From 2003to 2006,he was a Post-Doctoral Researcher with the State Key Laboratory of Mil-limeter-waves,Radio Engineering Department,Southeast University,Nanjing,China,where he was involved with the design of advanced microwave and millimeter-wave components and circuits for communication systems.In May 2006,he workedas a Post-Doctoral Research Fellow with the Poly-Grames Research Center,Department of Electrical Engineering,Ecole Polytechnique (University of Montréal),Montréal,QC,Canada,where he is currently a Researcher Asso-ciate.He has authored or coauthored over 30referred journals and conference papers and some proprietary research reports.He has been a member of the Editorial Board of the IET Journal.He holds several patents.His current research interests are focused on millimeter-wave components,antennas,and subsystems for radar sensors.Dr.Chen has been a reviewer for several IEEE publications.He was the re-cipient of a 2004China Postdoctoral Fellowship.He was also the recipient of the 2005Open Foundation of the State Key Laboratory of Millimeter-waves,Southeast University.。

critical_structure_corrupion
CRITICAL_STRUCTURE_CORRUPTION是一个常见的蓝屏错误代码,通常在Windows系统中出现,表示关键结构损坏。
出现此错误代码的一些常见解决方法如下:
- 检查系统软件和驱动程序:查看系统的软件安装列表,根据蓝屏出现的时间,检查是否有导致系统冲突或者出现蓝屏的软件,进行卸载。
如果最近通过第三方安全软件或驱动程序更新软件更新了驱动程序,请依次卸载更新的驱动程序,然后在设备品牌网站上找到要重新安装的驱动程序的最新版本。
- 检查注册表:检查系统中是否存在注册表残留,删除相关注册表项。
- 进行干净启动:按“Windows徽标键+R”,运行“msconfig”,单击“服务>隐藏所有Microsoft服务>全部禁用”。
然后单击开始>打开任务管理器并禁用所有启动项目。
如果以上方法无法解决问题,建议将Windows系统更新为最新版本,或联系设备制造商寻求支持。
第38卷第4期________________________________计算机仿真___________________________________2021年4月文章编号:1006 -9348(2021 )04 -0047-06火箭结构气动载荷样条插值中的数据预处理张洋洋、于哲峰^ ,毛玉明2,王吉飞2(1.上海交通大学航空航天学院,上海200240;2.上海宇航系统工程研究所,上海201109)摘要:在运载火箭结构载荷精细化设计中,需要把三维流场压力载荷向结构网格等效转换,采用了薄板样条法和无限板样条法进行具有复杂表面火箭结构的载荷转换。
针对应用中因线性方程组条件数巨大而导致解的误差较大、薄板样条法与无限板样条法插值的选择和火箭表面某些外形突变处插值误差较大的三个问题,提出了对插值点和待插值点的坐标进行预处理、使用平面度判断方法和智能判断算法三个预处理方法。
运用上述方法后线性方程组的条件数大大降低,压力突变处插值误差大大减少,最终使转换前后合力和合力矩偏差在可接受范围内。
以上处理方法的应用有效地防止计算出错,提高了 计算稳定性和载荷转换精度,增强了火箭结构三维气动载荷计算的工程可实施性。
关键词:火箭结构;气动载荷转换;样条;条件数;线性方程组中图分类号:V448. 15 +3 文献标识码:BData Preprocessing of Spline Interpolation in AerodynamicLoad of Rocket StructureZHANG Yang - yang1,YU Zhe - feng丨,*,MAO Yu - ming2,WANG Ji - fei2(1. School of Aeronautics and Astronautics,Shanghai Jiao Tong University,Shanghai 200240, China ;2. Shanghai I n s t i t u t e of Aerospace System Engineering, Shanghai 201109,China)A B S T R A C T:In the research and development of launch vehicle structure load,i t i s necessary t o transform the three-dimensional flow f i e l d pressure load t o the structure network.Therefore,thin - plate spline method and i n f i n i t e plate spline method were adopted t o transform the load of rocket structure with complex surface.The large condition number of linear equations not only leads t o a larger error of solution but also the interpolation choice of thin plate spline method and i n f i n i t e plate spline method and the interpolation error of abrupt change of rocket surface shape.In t h i s regard,this paper used the f latness judgment method and i n t e l l i g e n t judgment algorithm t o preprocess the coordinates of inteq^olation points and points t o be interpolated.Data preprocessing reduces the condition number of the l i near equations and the interpolation error a t the pressure mutation.The resu l t s show t h a t t h i s method can e f f e c t i v e l y prevent calculation errors,improve the s t a b i l i t y of calculation and the accuracy of load conversion,and enhance the engineering f e a s i b i l i t y of three - dimensional aerodynamic load calculation of rocket structure.K E Y W O R D S:Rocket structure;Aerodynamic loads transformation;Spline;Condition number;Linear equationsi引言运载火箭结构设计时需要计算其在各种外力作用下各 横截面上的轴力、剪力和弯矩等内力。
Solid State Ionics124(1999)37–43Structure characterisation and lithium insertion in La NbO0.333perovskite*G.X.Wang,P.Yao,D.H.Bradhurst,S.X.Dou,H.K.LiuEnergy Storage Materials Program,Institute for Superconducting and Electronic Materials,University of Wollongong,Northfield Avenue,Wollongong,NSW2522,AustraliaReceived2April1999;accepted24May1999AbstractThe A-site La NbO perovskite was prepared by a solid-state reaction at high temperature.A superstructure was0.33331 observed in both the XRD and electron diffraction patterns of La NbO,which is related to the ordering of La ions and0.333vacancies in the A sites.The La NbO was used as the electrode material in lithium cells.Approximately0.67lithiums0.333can be electrochemically inserted per La NbO formula,which confirms the structural analysis.The kinetic process of0.333lithium insertion/extraction in a La NbO electrode was determined by electrochemical impedance spectroscopy(EIS).0.333The charge-transfer resistance(R)decreases and the diffusion coefficient increases with lithium insertion into La NbOCT0.333 structure.©1999Elsevier Science B.V.All rights reserved.1.Introduction used for lithium intercalation hosts.The materialswith intercalation capability can be considered forThe ABO perovskites contain a large number of use as electrode material for the lithium ion battery.3compounds with a variety of special properties such Inaguma et al.first reported the intercalation ofas ionic conductivity[1–4],magnetism[5]and lithium into La Li TiO[1].Recently,0.510.34 2.94 ferroelectricity[6,7].The A-site deficient ABO LiLaNb O perovskite demonstrated an intercalation327compounds La Li TiO[8–11]and capacity of1lithium per formula[14]0.6723x x3La Li NbO[12,13]have demonstrated high lithium From a structural point of view,if there exists a x y3ionic conductivity,which have the potential to be two-dimensional channel or three-dimensional tunnel used as the electrolyte for solid state lithium batteries in the structure of a compound with vacancies,then, and electrochromic devices.Since there are vac-lithium ions could be reversibly inserted into and ancies in their structure,it is possible for them to be extracted from its structure.Ideally,the metal ion inthe compound should be multivalent,so that it canaccept or donate NbO perovskite0.333exactly meets the above conditions.*Corresponding author.Fax:161-2-4221-5731.E-mail address:Guoxiu@.au(G.X.Wang)In this paper,the structure and lithium intercala-0167-2738/99/$–see front matter©1999Elsevier Science B.V.All rights reserved.PII:S0167-2738(99)00138-138G.X.Wang et al./Solid State Ionics124(1999)37–43tion characteristics of La NbO perovskite were 3.Results and discussion0.333investigated.The mechanism of intercalation wasexplored based on the crystal structure and AC 3.1.Structural characterisation of the La NbO0.333 impedance analysis.The powder XRD pattern of La NbO perov-0.333skite is shown in Fig.1.All reflections were indexed 2.Experimental as a cubic unit cell with the stacking of twoperovskite subcells along the c-axis(called doubleThe La NbO perovskite was prepared from primitive cell).The parameter for the primitive unit0.333˚La O(99.9%,Aldrich)and Nb O(99.9%,Al-cell was calculated as a53.928A.Superstructure 2325drich).The mixture of precursors was calcined at lines were observed,which are generally considered3112008C for8h.After that,the calcined powder was to originate from the ordering of La and vacancies51ground andfired at13508C for10h and cooled in the A-sites.As shown in Fig.2,Nb ions occupy3131down.In order to improve the ordering of La ions the octahedral interstitial and La ions locate at theand vacancies in La NbO perovskite,the sample corner of the cubic unit NbO perovskite0.3330.333was then heated at8008C for3days and quenched in is A-site deficient and two or three A-site vacancies liquid nitrogen[10].X-ray diffraction and electron exist in the structure.Due to the electrostatic inter-diffraction were employed to characterise the struc-action among the constituent ions,the ordering of ture of the synthesised perovskite.The XRD patterns A-site vacancies along the c-axis occurs naturally.Itwere taken with a Phillips PW1730diffractometer is possible for deficient La NbO to accommodate0.333with Cu-K a radiation and electron diffraction was lithium in its structure because it contains vacancies. performed on a JEOL2000FX electron microscope.The ordering arrangement of vacancies provides a To determine the lithium intercalation in the two-dimensional channel for lithium insertion andLa NbO compound,CR2032Li/LiPF(EC1extraction.Therefore,lithium ions could intercalate0.3336DMC)/La NbO coin cells were assembled in an into and de-intercalate from La NbO perovskite.0.3330.3335141 argonfilled glove-box,in which the moisture and Simultaneously,Nb ions are reduced to Nb.The oxygen were controlled to less than5ppm.The materials possessing the above properties could be working electrode was made by dispersing the used as electrode materials for the lithium ion mixture of98%wt La NbO active materials and battery.0.3332%wt PVDF binder into dimethyl phthalate to To determine the superlattice of La NbO,0.333 obtain a slurry.The slurry was spread onto alu-electron diffraction was performed on La NbO0.333 minium foil and then dried at1408C for24h.Theelectrolyte was1M LiPF in the solution of EC6(ethylene carbonate)and DMC(dimethyl carbonate).The charge and discharge of the La NbO elec-0.333trodes were performed under a constant current2density of40m A/cm.The galvanostatic intermittent titration technique(GITT)was used to investigate the intercalationprocess.The electrode was discharged to a desired2value of x at a current density of20m A/cm andthen relaxed for10h to approach the equilibrium.Thefinal potential of the electrode was recorded asthe OCV state for that composition.The kineticprocess of lithium insertion was determined via ACimpedance spectroscopy on an electrochemical impe-dance analyser(EG&G Princeton Applied Research,Model6310).The AC amplitude was5mV and the Fig. 1.X-ray diffraction pattern of La NbO perovskite.↓0.333 frequency range was100kHz–1mHz.Superstructure lines.40G .X .Wang et al ./Solid State Ionics 124(1999)37–43Fig. 4.The first discharge of lithium intercalation into aFig.5.The discharge profile of the La NbO electrode obtained 0.3332La NbO electrode.Current density:40m A/cm .0.333by the galvanostatic intermittent titration technique (GITT).A 2discharge current of 10m A/cm was switched on for a certain time with a step of D x 50.02,and then switched off for 10h for equilibration.1state are between 3.2V and 3.4V vs.Li/Li .Whendischarged,the potential of the LaNbOelectrode0.333quickly dropped down to 2.0V .After this,a de-scending discharging slope followed to 1.2V .Noobvious discharging plateau was observed,suggest-ing no phase transformation during lithium intercala-tion.Consequently,we can deduce that lithium ionsoccupy A-vacancy sites in the perovskite structure.Theoretically,0.67lithiums can be inserted performula of La NbO .Under the constant current0.3332density of 40m A/cm ,approximately 0.63lithiumcan be electrochemically inserted per formula ofLa NbO ,corresponding to |95%of theoretical0.333capacity.This is maybe because the equilibration ofthe electrode was not reached under the condition of2Fig. 6.The cycling data for a Li/La NbO cell.Current 0.333constant current of 40m A/cm discharging.There-2density:40m A/cm .fore,a galvanostatic intermittent titration technique(GITT)was employed to measure the lithium inter-calation process.The profile of GITT measurementis shown in Fig.5.The maximum lithium uptakeabout 20%of the lithium was trapped in the reached 0.72lithium per formula La NbO .ThisLa NbO electrode.After that,lithium ions can 0.3330.333means that all of the vacancies in La NbO couldreversibly intercalate into and de-intercalate from the 0.333be occupied by lithium.The additional 0.05lithiumLa NbO perovskite structure with an efficiency 0.333was possibly consumed to form a passivation film onof 99%in 60cycles.From the structural analysis,it 31the surface of the electrode.is known that La ions and vacancies order along To determine the reversibility of La NbO the c -axis,which provides positions and a diffusion 0.333electrode for lithium insertion and extraction.tunnel for lithium ion insertion and extraction.The Charge/discharge cycles for Li/La NbO cellselectrochemical cycling test confirms the above 0.333were performed.The cycling data of one of theseproposal.Although La NbO is not suitable as an0.333cells are presented in Fig.6.During the first cycle,electrode material for the lithium ion battery,withG.X.Wang et al./Solid State Ionics124(1999)37–4341analysis and understanding of the structure of the capacitance.The charge-transfer resistance(R)andCT material,more electrode materials may be identified exchange current density(i)can be deduced fromoor even designed for the lithium ion battery.this semicircle.A straight line inclined to the realaxis at458in the low frequency range is ascribed to 3.3.Kinetic process of lithium insertion/extraction a Warburg diffusion process.The chemical diffusionin the La NbO electrode coefficient D may be obtained from the Warburg’s0.333Liprefactor s according the following equation[15]: Electrochemical impedance spectroscopy is aV d Epowerful tool to characterise the interface of the m]]]]]]]s53]Œd xelectrode/electrolyte.Fig.7presents the AC impe-23nF3S3D1Lidance spectra of La NbO electrode(Nyquist0.3333 plots)at different discharge states.A semicircle was V is the molar volume of La NbO(36.6cm/m0.333observed in the high frequency range,which corre-mole),d E/d x is the slope of the GITT curve at each sponds to a charge-transfer reaction and a non-x value and S is the apparent geometric area of thefaradic process of the charging of the double-layer La NbO electrode.0.333Fig.7.AC impedance spectra(Nyquist plots)for La Nb electrode at different discharge state:(a)x50,(b)x50.28,(c)x50.55,(d)0.333x50.67.*x is the amount of lithium in La Li NbO.0.33x342G.X.Wang et al./Solid State Ionics124(1999)37–43the damage of the surface layer at low potential orsome other unknown mechanism.Fig.9shows the chemical diffusion coefficients(D)of lithium ions in the La NbO electrode atLi0.333different discharge state.The values of D increaseLiwith the insertion of lithium.This behaviour issimilar to the graphite electrode[16].4.ConclusionsThe A-site vacant La NbO perovskite can be0.333Fig.8.The charge-transfer resistance(R)and exchange currentCT synthesised by a solid-state reaction.X-ray diffrac-density(i)at different discharge states.o tion and electron diffraction confirmed the orderingarrangement of vacancies in the La NbO perov-0.333As shown in Fig.8,the charge-transfer resistance skite structure,which provides diffusion tunnels for1(R)decreases with the insertion of Li ions into lithium insertion and extraction.The electrochemical CTthe La NbO electrode.Consequently,the ex-tests demonstrate that lithium ions can reversibly0.333change current density(i)increases as lithium intercalate into and de-intercalate from La NbOo0.3331insertion proceeds.When Li ions intercalate into perovskite electrode in a potential range of2.0V to51the La NbO structure,Nb ions are reduced to 1.2V vs.Li.The kinetic process of lithium insertion0.333414151Nb.With the mixture of Nb and Nb ions in in the La NbO perovskite electrode was char-0.333the perovskite structure,the electronic conductivity acterised via AC impedance measurement.Theis improved,which could be responsible for the charge-transfer resistance(R)for La NbO elec-CT0.333 decrease of the charge-transfer resistance.A second trode decreases and the diffusion coefficient in-semicircle was observed in the discharged state of creases as lithium insertion into La NbO struc-0.333x50.28.The absorption surface layer formed on the ture.surface of the La NbO electrode could be the0.333cause for this second semicircle.However,in thefurther deeply discharged state,even in the fully Referencesdischarged state,no second semicircle was observedin the AC impedance spectra.It is possibly due to[1]Y.Inaguma,L.Chen,M.Itoh,T.Nakamura,Solid StateCommun.86(1993)689–693.[2]M.Morales,A.R.West,Solid State Ionics91(1996)33–43.[3]K.Nomura,S.Tanase,Solid State Ionics98(1997)229–236.[4]A.G.Belous,Solid State Ionics90(1996)193–196.[5]W.J.Merz,Phys.Rev.76(1949)1221.[6]M.A.Subramanian et al.,Science273(1996)81.[7]A.P.Ramirez,R.J.Cava,J.Krajewski,Nature(London)386(1997)156.[8]Hiroo Kawai,Jun Kuwano,J.Electrochem.Soc.142(1995)L8.[9]Y.Inaguma,J.Yu,Y.Shan,M.Itoh,T.Nakamura,J.Electrochem.Soc.142(1995)L8.[10]Y.Harada,T.Ishigaki,H.Kawai,J.Kawano,Solid StateIonics108(1998)407–413.[11]O.Bohnke,J.Emery,A.Veron et al.,Solid State Ionics109(1998)25–34.Fig.9.The chemical diffusion coefficients(D)of lithium ion[12]Y.Shan,N.Sinozaki,T.Nakamura,Solid State Ionics108Liwithin La NbO electrode.(1998)403–406.0.333G.X.Wang et al./Solid State Ionics124(1999)37–4343[13]Y.Kawakami,M.Fukuda,H.Ikata,M.Wakihara,Solid State[15]R.Parsons,T.Vandernoot,J.Electroanal.Chem.257(1987)Ionics110(1998)187–192.9.[14]C.Bohnke,O.Bohnke,J.L.Fourquet,J.Electrochem.Soc.[16]A.Funabiki,M.Inaba,Z.Ogumi,J.Electrochem.Soc.145144(1997)1151–1158.(1998)172.。

![用于提取组的序列的控制对分支预测单元的存取[发明专利]](https://uimg.taocdn.com/6f9bb809f8c75fbfc67db26a.webp)
专利名称:用于提取组的序列的控制对分支预测单元的存取专利类型:发明专利
发明人:阿迪蒂亚·雅拉瓦蒂,约翰·卡拉马丁纳斯,马修·R·波伦巴
申请号:CN201980058993.9
申请日:20190618
公开号:CN112673346A
公开日:
20210416
专利内容由知识产权出版社提供
摘要:描述一种在执行程序代码中的指令时处置控制传送指令(CTI)的电子装置。
所述电子装置具有处理器,所述处理器包括分支预测功能块和顺序提取逻辑功能块。
所述顺序提取逻辑功能块基于与CTI相关联的记录来确定将提取先前被确定为不包括CTI的指定数目的指令提取组以在所述CIT之后顺序地执行。
在所述指定数目的提取组中的每一组被提取并准备执行时,所述顺序提取逻辑阻止对所述分支预测功能块进行对应存取来获取关于所述提取组中的指令的分支预测信息。
申请人:超威半导体公司
地址:美国加利福尼亚州
国籍:US
代理机构:上海胜康律师事务所
更多信息请下载全文后查看。
1INTRODUCTIONThis paper reviews actions on structures from an Australian regulatory perspective. The purpose is to provide practitioners with some insight into the background and principles underpinning the system currently in place. Discussions on specific actions such as wind and earthquake are covered by other papers. The paper is best read in conjunction with the current Building Code of Australia (BCA) and the Loading Standard Series AS/NZS 1170 and its Commentaries. The information in these documents is not going to be reproduced here.There were a couple of changes in terminology that will affect the overall discussion in this paper:a) The first is about the use of the word ‘code’.Structural standards used to be referred to as ‘codes’ meaning ‘codes of practice’ e.g. loading code, steel code etc. In 1996, the BCA was intro-duced as the ‘Building Code’. To avoid confu-sion, the word ‘Code’ is now used to denote the BCA and the word ‘Standard’ is used for Stan-dards Australia (SA) publication.b) The second change was introduced by SA itself tothe loading terminology to conform to ISO in 2002. The most significant changes are: ‘load’ is re-placed by ‘permanent action’, ‘live load’ is replaced by ‘imposed action’.2HISTORICAL BACKGROUNDThe responsibility for building construction rests with the State and Territory governments. Loading specifications were originally included in State and Territory building regulations. For example, South Australia Building Acts, 1923-1964 Part II specified height restriction, live loads in accordance with types of occupancy and wind loads (South Austra-lian Government 1965).In 1952, Standard Association of Australia (SAA) published Int. 350 Minimum Design Loads on Buildings (SAA, 1952). It covered dead, live and wind load provisions in a single volume of 20 A5 pages. From that date onwards, the regulatory sys-tems could refer to this document for their loading specifications; thus started the practice of ‘refer-enced documents’ in building regulations. For ex-ample, South Australian Government introduced this in an amendment in 1958 as an ‘Alternative Compu-tation of Loading’ (South Australian Government, 1965). The committee responsible for preparing the SAA Loading Code (as it was known) consisted mainly of representatives from Commonwealth and State Public Works Departments. By using SAA, a national loading specification was achieved at a time when a national building regulatory system was out of reach.In 1969, Int. 350 was revised and issued as AS CA34. It contained two parts. Part II - Wind Forces (SAA, 1971) was published separately; thus starting the process of fragmentation of the loading specifi-cation by independent ‘expert’ sub-committees. Earthquake loading and design was covered in a separate standard AS2121-1979 known as SAA Earthquake Code (SAA, 1979), independent of other loadings. This tradition of treating earthquake load-ing and design separately from other loading and de-sign considerations still exists in many other coun-tries. The SAA Loading Code specified loads as independent quantities, it was the material design codes (Steel, Concrete, Timber etc.) that decidedActions on Structures: Regulations and StandardsL. PhamCSIRO Sustainable Ecosystems, AustraliaABSTRACT: This paper presents an overview of the historical development of Australian loading specifica-tions followed by discussions on the regulatory and policy aspects of the development. These included the historical and rational reasons for the development of each individual standard as well as the state of the cur-rent system. It is hoped that practitioners will gain some insights into the background and principles under-pinning the system that is currently in place.4how these loads are to be used in combinations in design. In 1971, there was a change in designation to AS1170 which is still in place today. The major change, however, occurred in 1989 with the conver-sion to Limit States Design (LSD). The loading standard became the ‘mother’ of all structural stan-dards, driving the whole design process. Major changes introduced with the LSD conversion in-cluded:• Load combinations were specified in theloading code independent of the materials ofconstruction (SA, 1989a).• A new ‘AS1170 - Part 3: Snow loads’ wasintroduced in 1990 to coincide with the re-moval of all snow load provisions from Stateand Territory building regulations (SA,1990).• A new ‘AS1170 - Part 4: Earthquake loads’was introduced in 1993 to supersedeAS2121, thus terminating the practice oftreating earthquakes separately from otherloads (SA, 1993a). The latest makeover occurred in 2002, when a joint Australian -New Zealand Loading Standard se-ries was introduced. Changes introduced in this edi-tion will be discussed in subsequent sections of this paper.3 LIMIT STATE DESIGN SYSTEMThe loading specification is best viewed as part of the overall limit state design (LSD) system which was introduced in 1975 (SAA, 1975) but not opera-tional in Australia until 1989 with a new revision of the loading specifications. The basic concept of LSD is that the ‘action effects’ must not exceed the avail-able ‘resistance’ at both serviceability and ultimate limit states, i.e. Q ≤ R (1) where Q represents the design action effects and R represents the design resistance. Both Q and R are considered as ‘random vari-ables’ i.e. quantities that cannot be determined pre-cisely. In design practice, Eq. (1) is replaced by γQ . Q N ≤ Ф R N (2) whereγQ is the specified load factor for the nominated ac-tion effect Q N. Ф is the specified capacity factor for the nominated resistance R N. ‘specified’ here means to be specified in an Austra-lian Standard and ‘nominated’ means to be nomi-nated in the Building Code of Australia or Austra-lian Standard. The relationship between these quantities is illus-trated in Fig. 1. Figure 1: Compliant vertical surface-piercing cylinder 4 ROLES OF BUILDING CODE AND AUSTRALIAN STANDARDS The specification of the levels of actions and re-sistance to be used in design is a public policy deci-sion which is best determined by governments while the processes used in calculation can be standardized and published as standards. The separation of policy decisions and standardized processes is relevant for Australia because Australian Standards are produced by voluntary committees for a corporate entity. This is not an issue for countries where national standards are produced by national governments. Prior to 2002, the Structural Provisions of the BCA consisted mainly of references to Australian Standards (ABCB, 1996). In Amendment 11 (ABCB, 2002), ‘public policy matters, with respect to structural adequacy’ were transferred from AS1170 to the BCA. At present, the Building Code of Australia (ABCB, 2006) chooses to nominate the following key components for the calculation of ac-tions and resistance: a) For actions, it specifies the Importance Levels for Buildings and Structures and the annual prob-abilities of exceedence of the design events for safety for Wind, Snow and Earthquakes. b) For resistance, it specifies the five percentile characteristic material properties and factors that must be taken into considerations when determin-ing resistance.5All other matters are dealt with in the Australian Standards. The relevant Standards are also refer-enced in the Building Code as they have become parts of the regulatory system.It is worth noting that ‘Standards’ as prepared by SA are ‘voluntary’ standards. They become manda-tory only if they are referenced in government regu-lations. There might be structures that are not within the jurisdiction of the BCA (e.g. mining structures) where it is advisable to check with the appropriate authorities whether SA publications are approved for use in design.The act of ‘referencing in the BCA’ is the only independent checking mechanism available to en-sure that the Australian Standards are not in conflict with government policies such as Competition Pol-icy or other regulations such as Trade Practices Act. It is expected that, in the future, the examination of Australian Standards for referencing in the Building Code of Australia will be pursued with more rigor than current practice.5RISK MANAGEMENT AND LOADING SPECIFICATIONSFrom the building regulatory perspective, loading specifications can be considered as a tool for risk management of buildings against natural or man-made disasters. The Importance Levels (ABCB, 2002) reflect the values and the expectations the community place on these types of buildings. The specification of the design events is the method used to describe the varying building performance expec-tation for different classes of buildings against ex-treme events.The following points should be noted:a) The design events for different natural phenomenaneed not be the same. The basic design event for Importance Level 2 buildings and structures, for example, is set at 1:500 for wind and earthquake and 1:150 for snow. The decision should be made based on the consequences of failure caused by a particular phenomenon. In reality, the current re-quirements were derived from a process called ‘code calibration’ to match actual practice.b) While the design events are specified for ultimatelimit states, the performance expectation at ulti-mate limit states was never defined precisely. It is generally accepted that the structure is expected not to collapse but substantially damaged when this condition is reached. The interpretation of the performance expectations for a 1:500 event of wind or earthquake for buildings of different Im-portance Level might be as follows: - Buildings of Importance Level 1: not expect to sur-vive- Buildings of Importance Level 2: expect not to col-lapse but substantially damaged- Buildings of Importance Level 3: expect to survive with some damage- Buildings of Importance Level 4: expect to survive intact and continue to functionThis is the rational for specifying lower annual probability of exceedance of the design events for higher level of importance of buildings.c) The regulatory specified design events are MINI-MUM requirements. The levels are not necessar-ily the most cost effective. The designers can al-ways choose to design for a better level of protection. This may be worth considering if a small increase in cost will result in substantial in-crease in safety or performance.6STRUCTURAL RELIABILITYThere are various ways of defining the reliability of structure using the model of Fig. 1. The most commonly accepted measure is the probability of failure p F as outlined in ISO2394 - General princi-ples on reliability for structures (ISO, 1998), i.e.p F = Pr { R < Q }The results are usually stated in terms of a safety index β defined byp F = Φ(-β)where Φ( ) denotes the cumulative distribution func-tion of a standardized unit normal variate.The safety implicit in Australian structural stan-dards was based on estimates of p F for a 50 year pe-riod. A fairly extensive collection of these studies was reported in a special publication by the Institu-tion of Engineers Australia (1985). Structural reli-ability theory had two major applications in the de-velopment of Limit State Design. One was to correct any major anomalies in safety within and between different sets of material design rules and the other was in the derivation of a basic set of load combina-tions for design.7LOAD COMBINATIONSPrior to 1989, load combinations were given separately in each material design standard. The in-6troduction of LSD provided an opportunity to unify different sets of load combinations into a single set to be placed in the Loading Standard. The adopted load combination set was the result of extensive reli-ability analysis aiming at achieving reasonable con-sistency in reliability levels for different combina-tions and material characteristics.In addition to the use of reliability analysis, the load combinations for ultimate limit states were based on a simple rule for the combination of peak loads that stated the peak combinations of independ-ent loads resulted from the combinations of the peak of one load and the arbitrary point-in-time values of other loads in the combination. This rule acknowl-edged that the probability of simultaneous occur-rences of peak loads is very rare.For serviceability consideration, load levels for short term and long term effects were proposed as benchmarks. Two sets of loads and load combina-tions were given to represent the following condi-tions with five percent chance of being exceeded: a) Short term actions in which the specified service-ability loads were peak loads in a single year.b) Long term action in which the specified service-ability loads were average loads over the lifetime of the building.8CURRENT AUSTRALIAN LOADINGSPECIFICATION SYSTEMThe current Australian loading specification sys-tem has three components: AS1170 Series, Deriva-tive Loading Specifications and Loadings on special structures.8.1AS1170 SeriesThis is the major Australian loading specification applicable to buildings and other structures. It in-cludes the following parts:AS/NZS 1170.0 Structural design actions Part 0: General principles (SA/SNZ, 2002a)AS/NZS 1170.1 Structural design actions Part 1: Permanent, imposed and other actions (SA/SNZ, 2002b)AS/NZS 1170.2 Structural design actions Part 2: Wind actions (SA/SNZ, 2002c)AS/NZS 1170.3 Structural design actions Part 3: Snow actions (SA/SNZ, 2003)AS1170.4 Structural design actions Part 4: Earth-quake actions (The current version is still the 1993 version but a new version - Australia only - is ex-pected to be published soon)These Standards are referenced (or about to be referenced) in the BCA and therefore are part of the building regulatory system.This series resulted from the effort to produce joint Australia - New Zealand Standards. Two major changes are worth noting:a) The introduction of Part 0 - General principleswhere all design requirements and the methods for demonstrating compliance are discussed.These include design events for safety, load com-binations, robustness and serviceability.(i) For the specification of the design events forsafety, AS1170.0 refers to the BCA. This ar-rangement resulted from the separation of ‘so-cial policy’ and ‘standardized processes’ asdiscussed earlier.(ii) The only major change to the load combina-tions from previous editions is the load factorfor permanent load when acting in oppositionto wind or other loads from 0.8 to 0.9. Thisrevision was made to align the practice withthose of New Zealand and the USA.(iii) The specification for structural robustness is somewhat problematical. The specification ofminimum resistance for members and con-nections is based on current accepted practicebut does not address the issue in any mean-ingful way.(iv) The serviceability criteria are included as an ‘informative’ appendix. This implies thatthere is considerable room for ‘engineeringjudgment’ in serviceability design, as itshould be. In regulatory terms, it means thatwhile it is mandatory to consider serviceabil-ity conditions, the exact criteria to be used indesign are still up to the designer judgment.b) Earthquake Loading Standard: In contrast toother parts of the AS1170 Series, Part 4 - Earth-quake loads contains considerable material design requirements that are further supplemented in ma-terial design standards in the form of appendices.Attempts to have a joint standard with New Zea-land on earthquake have been unsuccessful; not only because the seismic conditions are funda-mentally different but also the design philosophy and practice in the two countries are also radi-cally different. A joint earthquake standard would need a large educational campaign to explain the changes and is considered not to be in the na-tional interest.78.2Derivative Loading SpecificationsThere are also derivative loading specifications that give specific interpretations of the actions and action combinations to be used in a particular class of buildings, such as:AS4055 - Wind load for housing (SA, 2006): The Standard was first introduced in 1992 to facilitate the specification of wind loads for low-rise single family dwelling. It includes a wind classification system for use in conjunction with deemed-to satisfy ‘span’ tables such as AS1684.2 (SA, 1999). One of the rational for its introduction was to provide a ‘simple’ interpretation of AS1170.2, which was con-sidered to be too complicated for house designers. NASH Standard Residential and Low-rise Steel Framing Part 1: Design Criteria (NASH, 2005): This document is to replace AS3623-1993: Domestic metal framing (SA, 1993b). The technical reason for having this Standard is to provide designers with a set of design criteria for steel house framing. This has proven necessary because, unlike timber which has standardized span tables, all steel framing sys-tems are proprietary products and each must have its own span tables. A common set of design criteria, including loads and load combinations, is necessary for public safety as well as the functioning of the market. The publication of this document under the auspices of the National Association of Steel-framed Housing also indicated the Australian Building Codes Board’s willingness to reference sources other than Standards Australia as long as they can demonstrate their willingness to comply with the regulatory protocol for referencing which was de-signed to protect public interest.These two documents are also referenced in the BCA.8.3Loadings on special structuressThere are also loading recommendations for spe-cial structures, usually published together with de-sign procedures as Australian Standards, such as:AS3774 - Loads on bulk solid containersAS3995 - Design of steel lattice tower and mastsThese documents are not referenced in the BCA since these special structures are outside its jurisdic-tion. 9CONCLUSIONSA brief overview of the historical development of Australian loading specifications was presented. The paper focused on regulatory and policy aspects of the development. These included the historical and rational reasons for the development of each indi-vidual standard as well as the state of the current system. It is hoped that practitioners will gain some insights into the background and principles under-pinning the system that is currently in place.REFERENCESABCB (1996) Building Code of Australia BCA96 (Volume One & Volume Two) Australian Building Codes Board ABCB (2002) Amendment No 11 to the 1996 Edition of the Building Code of Australia.ABCB (2006) Building Code of Australia BCA2006 (Volume One & Volume Two) Australian Building Codes Board ISO (1998) General principles on reliability for structures ISO 2394:1998(E)NASH (2005): NASH Standard Residential and Low-rise Steel Framing Part 1: Design CriteriaSAA (1952) Minimum Design Loads on Buildings - SAA In-terim 350, Standards Association of AustraliaSAA (1971) Minimum Design Loads on Structures - SAA Loading Code Part II - Wind Forces AS CA34, Part II, Standards Association of Australia.SAA (1971) Minimum Design Loads on Structures - SAA Loading Code Part I - Dead and Live Loads AS 1170.1 - 1071 Standards Association of Australia.SAA (1975) Limit state design method - AS1793 -1975 Stan-dards Association of Australia.SAA (1979) The Design of Earthquake-Resistant Buildings - SAA Earthquake Code - AS 2121 - 1979 Standards Asso-ciation of Australia.SA (1989a) Minimum Design Loads on Structures - SAA Loading Code Part 1 - Dead and Live Loads and Load Combinations AS 1170.1 - 1989 Standards Australia.SA (1989b) Minimum Design Loads on Structures - SAA Loading Code Part 2 - Wind loads AS 1170.2 - 1989 Stan-dards Australia.SA (1990) Minimum Design Loads on Structures - SAA Load-ing Code Part 3 - Snow loads AS 1170.3 - 1990 Standards Australia.SA (1993a) Minimum Design Loads on Structures - SAA Loading Code Part 4 - Earthquake loads AS 1170.4 - 1993 Standards Australia.SA (1993b) Domestic metal framing - AS 3623 - 1993, Stan-dards Australia.SA (1994) Design of steel lattice towers and masts - AS3995 - 1994, Standards Australia.SA (1996) Loads on bulk solids containers - AS3774 - 1996, Standards Australia.SA (1999) National Timber Framing Code Part 2: Non-cyclonic areas - AS1684.2 N1/N2 Supplement 1- 15: Tim-ber framing span tables - 1999, Standards Australia.SA (2006) Wind loads for housing - AS4055 - 2006, Standards Australia.SA/SNZ (2002a) Structural design actions - Part 0: General principles - AS/NZS 1170.0:2002.SA/SNZ (2002b) Structural design actions - Part 1: Permanent, imposed and other actions - AS/NZS 1170.1:2002.8。