Format for Laboratory Reports (实验报告格式 英文版本)
- 格式:pdf
- 大小:352.07 KB
- 文档页数:2
实验报告的格式
实验报告一般应包含以下内容:
1. 标题:实验报告的标题应能够准确地反映实验的内容和目的。
2. 实验目的:明确实验的目的是什么,为什么进行这个实验。
3. 实验原理:介绍实验的基本原理、理论知识和相关概念。
4. 实验装置和材料:描述实验所使用的设备、仪器以及实验所需的材料。
5. 实验步骤:详细描述实验的步骤、操作方法和注意事项。
6. 实验结果与数据处理:记录实验的观察结果、测量数据和数据处理方法。
7. 结果的分析与讨论:对实验结果进行分析和讨论,比较理论预期和实际结果之间的差异,并解释可能产生差异的原因。
8. 实验误差与改进措施:评估实验误差的大小和来源,并提出可能的改进措施。
9. 实验结论:根据实验结果和数据分析,结论要明确、准确,回答实验目的中的问题。
10. 参考文献:列出所有在实验报告中引用的文献,格式要符
合要求。
11. 附录:包括实验中的原始数据、计算过程、图表、图片等
详细资料。
实验报告的格式一般采用文稿格式,包括封面、目录、正文、参考文献等部分,主要以分节的形式呈现,确保内容结构清晰、层次明确。
实验报告中应避免出现个人感受和主观评价,要注重事实陈述和客观分析,语言要准确、简明,条理清晰,尽量使用科技术语,术语的使用要准确恰当。
总之,实验报告的格式应当符合学校或教师的要求,整齐、规范,以确保信息的传递和沟通效果。
实验报告格式范文实验报告格式范文如何写?我们在学习某一些学科的时候都会做一些实验,实验做完过后我们都要提交一份实验报告,那么你们知道实验报告的格式是怎样的吗?下面是小编为大家带来的实验报告格式范文_个人实验报告格式,仅供参考。
实验报告格式范文1:姓名:指导老师:学院:专业:实验内容:其他组员:【实验时间】___年__月__日【实验地点】在这里填上实验地点。
【实验目的】在这里填上实验目的。
成绩:班级:年月日【实验设备与软件】在这里填上实验设备与软件。
【实验原理】在这里简要的叙述实验原理。
(简明扼要)【实验内容、方法、过程与分析】1、实验内容在这里简要的叙述实验内容。
(注意:是对实验内容的总结归纳,言简意赅,不是照抄,不要多于400字)2、实验方法在此说明实验所采用的方法,比如:根据实验内容要求,对表达式进行处理,画出模拟电路图并在Mltisim中仿真,然后在实验箱中验证并比较仿真结果。
3、实验过程与分析在这里详细说明您的实验过程及记录的数据,并适时进行分析。
【实验结论与总结】在这里先写上本实验得到的结论(可以分点列出),以及你做实验的总结(获得了什么?明白了什么?等,可以分点列出),并提出一些改进的措施。
实验报告格式范文2:课程名称班级图文处理 20_ 编辑出版学任雪飞指导教师学号学生姓名20_ - 20_ 学年第一学期实验报告填写说明1.实验项目名称:要用最简练的语言反映实验的内容。
要求与实验教学大纲中相一致。
2.实验类型:一般需说明是演示性、验证型实验还是综合性、设计型实验。
要求与实验教学大纲中相一致。
3.实验目的与要求:目的要明确,要抓住重点,符合实验教学大纲中的要求。
4.实验环境:实验用的软硬件环境(配置)。
5.实验方案设计(思路、步骤和方法等):这是实验报告极其重要的内容。
说明整个实验的设计方案,包括实验前的思考、实验中将采用的步骤和方法等。
对于演示性和验证性实验,要写明依据何种原理、方法进行实验,要写明需要经过哪几个步骤来实现其操作。
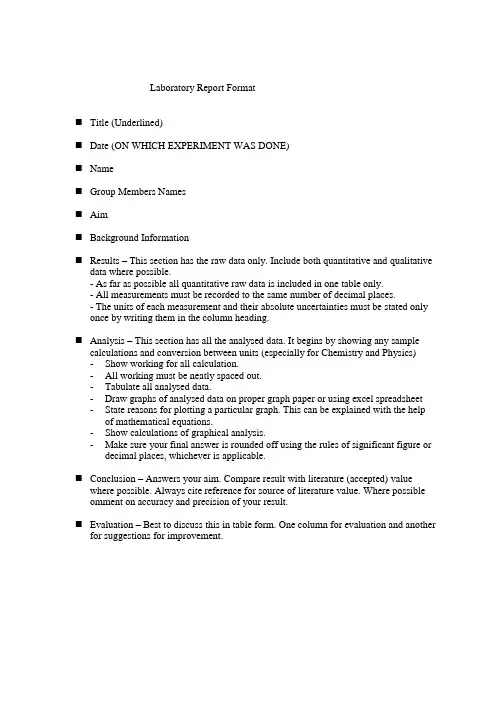
Laboratory Report Format⏹Title (Underlined)⏹Date (ON WHICH EXPERIMENT WAS DONE)⏹Name⏹Group Members Names⏹Aim⏹Background Information⏹Results – This section has the raw data only. Include both quantitative and qualitativedata where possible.- As far as possible all quantitative raw data is included in one table only.- All measurements must be recorded to the same number of decimal places.- The units of each measurement and their absolute uncertainties must be stated only once by writing them in the column heading.⏹Analysis – This section has all the analysed data. It begins by showing any samplecalculations and conversion between units (especially for Chemistry and Physics) -Show working for all calculation.-All working must be neatly spaced out.-Tabulate all analysed data.-Draw graphs of analysed data on proper graph paper or using excel spreadsheet -State reasons for plotting a particular graph. This can be explained with the help of mathematical equations.-Show calculations of graphical analysis.-Make sure your final answer is rounded off using the rules of significant figure or decimal places, whichever is applicable.⏹Conclusion – Answers your aim. Compare result with literature (accepted) valuewhere possible. Always cite reference for source of literature value. Where possible omment on accuracy and precision of your result.⏹Evaluation – Best to discuss this in table form. One column for evaluation and anotherfor suggestions for improvement.。
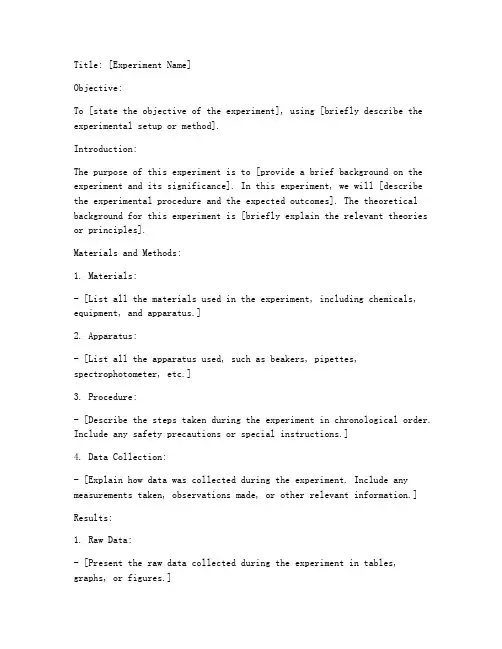
Title: [Experiment Name]Objective:To [state the objective of the experiment], using [briefly describe the experimental setup or method].Introduction:The purpose of this experiment is to [provide a brief background on the experiment and its significance]. In this experiment, we will [describe the experimental procedure and the expected outcomes]. The theoretical background for this experiment is [briefly explain the relevant theories or principles].Materials and Methods:1. Materials:- [List all the materials used in the experiment, including chemicals, equipment, and apparatus.]2. Apparatus:- [List all the apparatus used, such as beakers, pipettes, spectrophotometer, etc.]3. Procedure:- [Describe the steps taken during the experiment in chronological order. Include any safety precautions or special instructions.]4. Data Collection:- [Explain how data was collected during the experiment. Include any measurements taken, observations made, or other relevant information.]Results:1. Raw Data:- [Present the raw data collected during the experiment in tables, graphs, or figures.]2. Analysis:- [Discuss the data collected, including any calculations performed or statistical analysis conducted.]Discussion:1. Comparison with Theoretical Predictions:- [Compare the experimental results with the theoretical predictions or known values, explaining any discrepancies.]2. Possible Sources of Error:- [Identify and discuss any potential sources of error in the experiment, including procedural, equipment, or environmental factors.]3. Implications and Limitations:- [Discuss the implications of the results and any limitations of the experiment.]Conclusion:The objective of this experiment was to [state the objective again briefly]. The results indicate that [state the main findings of the experiment]. The experiment was successful in achieving the intended objective, [if applicable], and the data collected support the [relevant theories or hypotheses]. Further studies could include [suggestions for future research].References:[Include any references cited in the report, formatted according to the required citation style.]Appendices:[Include any additional information, such as detailed calculations, additional graphs, or photos, that may be helpful for understanding the experiment.]---Note:This is a basic template for a laboratory report. Depending on the specific requirements of your course or instructor, you may need to adjust the format, content, or sections of the report.。
实验报告模板格式实验报告模板格式引言:实验报告是科学研究和实验的重要成果之一,它记录了实验的目的、方法、结果和结论,为科学研究提供了重要的参考依据。
本文将介绍实验报告的模板格式,以帮助读者更好地撰写自己的实验报告。
一、标题和作者信息实验报告的标题应简明扼要地概括实验的内容,通常采用精确的名词短语。
作者信息包括实验人员的姓名、学号和实验日期等。
二、引言部分引言部分应包括实验的背景和目的。
背景介绍实验所涉及的相关领域和已有的研究成果,目的明确实验的目标和意义。
三、实验方法实验方法部分应详细描述实验的步骤和所使用的仪器、材料等。
需要注意的是,实验方法应该具备可重复性,即其他人能够根据实验报告的描述重现实验。
四、实验结果实验结果部分应以文字、表格、图表等形式展示实验的主要数据和观察结果。
数据的呈现应准确、清晰,图表应有适当的标注和图例,以便读者理解和分析。
五、结果讨论结果讨论部分是对实验结果的进一步解释和分析。
在这一部分中,可以对实验结果进行比较、统计和推理,从而得出结论。
同时,还可以探讨实验中存在的误差和不确定性,并提出改进的建议。
六、结论结论部分应简明扼要地总结实验的主要结果和发现。
结论应该与实验目的相一致,且具备一定的科学性和可信度。
七、参考文献参考文献部分列出了实验过程中所参考的文献和资料。
引用格式应符合学术规范,例如APA、MLA等。
八、致谢致谢部分感谢在实验过程中给予帮助和支持的人员和机构。
这一部分可以表达对导师、实验室成员、同学、家人等的感激之情。
九、附录附录部分包括了实验中所用到的原始数据、计算方法、程序代码等。
这些信息对于读者进一步了解实验过程和结果的可靠性具有重要意义。
结语:实验报告模板格式的合理运用可以使实验报告更加规范、清晰和易读。
在撰写实验报告时,我们应该注意以上各部分的内容和顺序,并根据实际需要进行适当的调整和补充。
通过良好的实验报告撰写,我们能够更好地记录实验过程和结果,为科学研究的发展做出贡献。

( 实验报告)姓名:____________________单位:____________________日期:____________________编号:YB-BH-053889实验报告的书写格式模版Writing format template of experimental report实验报告的书写格式模版有关实验报告的书写格式一、完整实验报告的书写完整的一份实验报告一般包括以下项目:实验名称:实验目的:实验器材:实验原理:实验步骤:实验数据记录(表格)及处理:实验结论(结果推导):实验讨论或分析等。
二、实验报告书写方法1、实验名称:就是这个实验是做什么的。
2、实验目的:一般都写掌握什么方法啊;了解什么啊;知道什么啊;会什么啊;……等。
3、实验器材:就是做这个实验需要的所有器材(仪器)。
4、实验原理:就是这个实验是根据什么来做的,一般书上会写,抄一下也就可以啦。
5、实验步骤:就是你做实验的过程,开始操作时,(1)做什么;(2)做什么;(3)做什么;……6、实验数据记录(表格)及处理:根据实验中涉及以及实验得到的数据,设计表格,将有关数据填在表格相应的位置;数据处理,就是该计算的,按要求计算后填入表格对应位置。
7、实验结论(结果推导):就是做这个实验要得到的结果。
8、分析于讨论:写你的实验结果是否适合真实值?如果有误差要分析产生误差的原因,还有实验的一些比较关键的步骤的注意事项等。
对于初中生或小学生来说,书写的实验报告也可简单一点,有时也可不要分析于讨论,也可不写实验原理等。
三、探究实验书写一般有七个环节1.提出问题:就是在生活中发现、提出问题。
2.猜想与假设:发现问题,就要弄清楚问题,在没有搞清楚之前总有基本的猜测和设想,这就是猜想与假设。
3.制定计划与设计实验:有了猜想,就有了实验的目的,再根据实验的目的设计实验方案,制定实验计划,包括取得证据的途径和方法,确定收集证据的范围。
包括实验的理论依据(实验原理)、实验器材、实验步骤等。
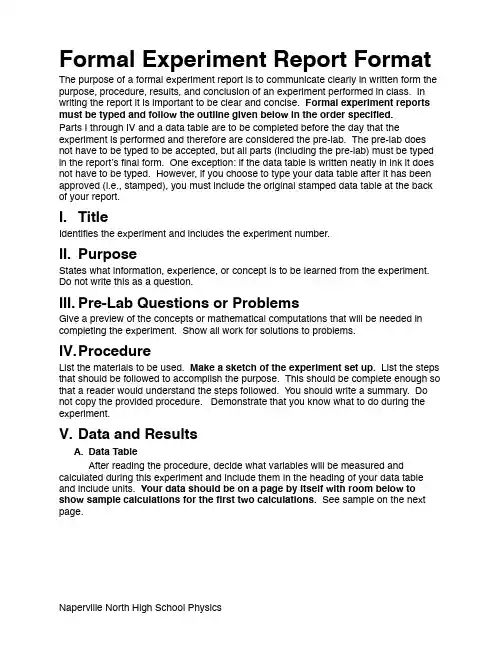
Formal Experiment Report Format The purpose of a formal experiment report is to communicate clearly in written form the purpose, procedure, results, and conclusion of an experiment performed in class. In writing the report it is important to be clear and concise. Formal experiment reports must be typed and follow the outline given below in the order specified.Parts I through IV and a data table are to be completed before the day that the experiment is performed and therefore are considered the pre-lab. The pre-lab does not have to be typed to be accepted, but all parts (including the pre-lab) must be typed in the reportʼs final form. One exception: if the data table is written neatly in ink it does not have to be typed. However, if you choose to type your data table after it has been approved (i.e., stamped), you must include the original stamped data table at the back of your report.I.TitleIdentifies the experiment and includes the experiment number.II.PurposeStates what information, experience, or concept is to be learned from the experiment. Do not write this as a question.III.Pre-Lab Questions or ProblemsGive a preview of the concepts or mathematical computations that will be needed in completing the experiment. Show all work for solutions to problems.IV.ProcedureList the materials to be used. Make a sketch of the experiment set up. List the steps that should be followed to accomplish the purpose. This should be complete enough so that a reader would understand the steps followed. You should write a summary. Do not copy the provided procedure. Demonstrate that you know what to do during the experiment.V.Data and ResultsA.Data TableAfter reading the procedure, decide what variables will be measured and calculated during this experiment and include them in the heading of your data table and include units. Your data should be on a page by itself with room below to show sample calculations for the first two calculations. See sample on the next page.Sample Data TableDistance Traveled by an Object During Three TrialsTrial Distance (m)Time (s)Speed (m/s)10.240.0201220.300.0301030.360.0606Sample Calculations: speed = 0.24 m / 0.020 s = 12 m/s; 0.30 m / 0.030 s = 10 m/sB.DataMeasurements made during the investigation are to be recorded in the prepared data table. All entries should be made in ink. If you make an error neatly cross it out and write in the new data. Have your instructor initial or stamp the data table before you go. Note: you may type your data table for your final report but you must include the original stamped data table at the back of your report.C.ResultsThese are your calculated values and answers to any questions in the procedure. Include percent error when appropriate. Remember to show sample calculations below your data table.D.Procedure QuestionsAny questions asked in the procedure should be answered under the Data and Results sections.E.GraphInclude a graph when instructed and follow the requirements listed below.All graphs must be on graph paper. If permission is given to include a computer-generated graph, it must contain a grid on it.Each graph must contain the following:•Title that describes the data graphed.•An appropriate scale that uses most of the graph paper but is easy to interpret.•(0,0) at the origin. Do not use to signify that part of the scale is omitted.•Labels for the independent variables (x-axis or abscissa) and for the dependent variable (y-axis or ordinate).•Labels for the units for the variables.•Draw the best-fit line that includes as many points as possible with the same number below the line as above it. Never connect the dots.•State the type of curve: linear, direct, inverse, or exponential.All lines do not go through (0,0). You do not take data at (0,0) so you must think about your experiment and decide if the data would logically include (0,0). If it would, then you must include (0,0) as one of your points.Slope: If the experiment requires you to find the slope, you must show your calculations (y2 - y2) / (x2 - x1) on the graph as well as the point that you used.VI.Error AnalysisIn the laboratory there are three kinds of error:•Personal – Mistakes that should be eliminated and not reported unless you discover the mistake after you completed the experiment.•Systematic errors – Associated with particular measurement instruments or techniques and their direction of error can be identified. Example: friction during an experiment may reduce the speed of an object whereas a slanted surface may increase the speed of an object moving in the direction of the slant or decrease the speed of an object moving against the slant.•Random errors – Result from unknown and unpredictable variations in the experimental situations including fluctuations of line voltage, mechanical vibrations, and unbiased estimates of measurement readings by the observer. The last digit of any measurement is an estimate.Random and systematic errors, unlike personal errors, may not be able to be eliminated, but should be kept to a minimum by the design of the experiment and the care taken by the experimenter.Your discussion of error should include the following:1.The estimated uncertainty for each measuring device and the maximum percentuncertainty.•Estimated uncertainty is found from taking the smallest marked graduation of the measuring device and dividing it by two.•Maximum percent uncertainty is found from taking the estimated uncertainty and dividing it by the smallest measurement taken with that instrument and multiplying it by 100%.2.Look at your data in the table and graph. What evidence do you have for error?List all the evidence of error.3.List at least two sources of error and determine if these errors are random orsystematic.4.For each error listed in part 3 of the Error Analysis section, explain how each wasminimized either by the given procedure or by special steps that you devised. VII.Discussion or Related QuestionsThese questions are found at the end of the experiment and will help you analyze your data and understand the concepts that are developed in the experiment. Always use complete sentences. The reader must be able to interpret the question in your response.VIII.ConclusionStates what idea, concept, relationship or information you have learned during the experiment. This statement should refer to the purpose and be general enough that it can be applied to new but similar situations. Often your conclusion can be stated as an if (conditions) then (conclusion) statement. The conclusion should also include any major implications learned in completing the discussion questions.IX.ReflectionWhen you reflect, you think about your thinking. Through reflection, you become more aware of what you have learned and what you still need to learn. Reflection is a tool that you will leverage throughout your life as a learner.Reflection is an important part of the learning process and, therefore, you have the opportunity to reflect after performing each experiment. Besides assisting your own learning, your reflection provides me with valuable feedback. After completing your conclusion, reflect on the experiment as a whole. Below are some potential questions to direct your reflection. Do not feel constrained to only focus on these questions.Reflect on at least 3 different questions and capture your reflection in your experiment report.Teamwork•In what ways did you work well as a team during this experiment?•In what ways did you not work well as a team during this experiment?•What could you do in future experiments to better work as a team?Learning•What was the most surprising result of your experiments? Why was this the most surprising?•What did you expect to learn by performing this experiment that you did not?•Now that youʼve completed this experiment, about what would you like to learn more (either due to new interest or remaining confusion)? How are you going to ensure you learn this?Feedback•What did you like about this experiment?•What did you dislike about this experiment?•What would you change about this experiment to benefit future classes? Frequently Asked Questions•Do I have to type the pre-lab for the day the experiment is done?•No. You may write it up by hand but it must be typed for the final report andattached the stamped pre-lab to the back of the final report.•May I retype my data table if it is messy?•Yes, but you need to attach the original data table to the back of your report.•What is included in the pre-lab?•Purpose, pre-lab questions, procedure with materials list and diagram of setup, and data table.•Do I have to get my data stamped before I leave the classroom?•Yes, if you want full credit.•What happens if I do not have my pre-lab done on time?•Besides forfeiting points on your report, you will not be allowed to do theexperiment until you have completed the pre-lab.。
实验报告格式范文第1篇生物学是一门以实验为基础的自然科学,现代生物科学的发展尤其依赖科学实验。
在生物教学中,实验、学习和观察等实践环节对我们掌握生物学知识、科学方法、培养我们的动手能力和形成科学素质都起到了至关重要的作用。
正是因此,从我们开始接触生物这门学科开始,就不断有生物实验课程,锻炼我们各式各样的能力。
但是,也的确是上过各式各样的生物实验课,我才更加深刻的感受到这次做的现代生物技术综合实验对我的影响有多大。
老师在第一次课上,对我们详尽的讲解了我们此学期需要完成的一系列实验。
其中全是环环相扣,嵌合紧密,有点一招即失,满盘皆输的压力,不过我们更多的是怀着一种跃跃欲试的激动,恨不得立马动手,靠着自己学来的知识,认真的完成这套实验,并且还能看到最终那令人欣喜的结果。
就这么妄想着妄想着,我们从第二周开始的现代生物技术综合实验的漫长旅程。
由于,老师没有硬性的要求实验时间,我们便是一有空闲就往实验室里钻,也就少了以前实验课上出现的,因为部分实验仪器的数量缺少,同学们每次做实验都是你推我嚷的,造成了实验兴趣的流失。
以至于做实验的态度越来越涣散,甚至只是简单的走下过场而已,几次实验课下来,热情全无。
但按照金老师的提议来,大家来实验的时间不同,使得对仪器使用的时间错开,减少了为争抢仪器或是药品而嘈杂不堪的场面,实验也变得顺利了许多。
金老师会很体谅一些先开始忙活的同学,在黑板上写清他们实验大概会做到的步骤和注意事项,后面实验的准备物品和要求,然后开始在忙于实验而奔走中的同学之间晃悠。
观察我们的实验操作,或是时不时提点解释一下我们实验步骤的缘由;实验药品的作用;如何做会得到更好的结果;实验没有得到好的结果或是做的失败了的原因。
可是,随着实验的发展,后来更多的时候,是我们在看过书本上要求的实验步骤后,去缠着金老师,围在他周围,问他关于实验的各种问题,就算同样的问题被问过许多次,金老师依然是和蔼的笑着一一解答我们的疑问,他的平易近人,他的悉心教导,他的不骄不躁,他的耐性与笑容都深深的打动了实验中的每位同学。

英文实验报告的格式和写法【转】2010-10-04 06:03一份最标准的实验报告的格式:1. Abstract2. Introduction3. Method4. Results5. Discussion6. Conclusion7. Reference分别来分享下近来学到的。
Abstract摘要摘要,就是整篇文章摘出来的要。
强烈建议整篇文章写完后再写摘要。
把文章每个部分选一些句子出来就可以拼凑成一个abstract了。
一个abstract 的模板:1 一两句话说明这个实验的主要理论依据,或者实验需要证明的假说。
2 一两句话说一下这个理论或者假说的相关的研究。
3 两三句话描述一下实验4 两三句话概括一下实验结果5 一句话说一个结论,解释一下这个实验的意义或结果的重要性转一个别人的example:Does a child’s focus correlate with barometric pressure? if so, does it correlate positively or negatively? Tucker (1999) hypothesized a negative correlation, but this assertion has never been tested. Our team used the MISHA CPT to measure the focus of a group of 150 third-grade students. we divided the students into three groups of 50 students. one group took the MISHA CPT when barometric pressure was low, another group took it when barometric pressure was neutral, and the final group took it when barometric pressure was high. the results found that children focused significantly better when barometric pressure was low than when barometric pressure was neutral or high. the results suggest that when diagnosing ADHD, practitioners should give the CPT when barometric pressure is neutral.IntroductionIntroduction以实验目的为开头,解释一下这个实验需要证明的东西。
实验报告格式
实验报告通常包括以下几个部分:
1. 标题:实验名称和实验编号。
2. 实验目的:阐述实验的目的和背景。
3. 材料与方法:描述实验所用的材料、设备和实验步骤。
4. 结果:将实验过程中的观察、测量和数据记录等结果进行整理和汇报。
可以使用文
字描述、表格、图表等形式进行展示。
5. 讨论与分析:对实验结果进行解释和分析,讨论实验中可能存在的误差和不确定性,与理论知识进行对比和讨论。
6. 结论:根据实验结果和分析得出的结论。
7. 参考文献:列出实验报告中引用的文献和资料。
8. 附录:如实验原始数据、计算过程等。
对于实验报告的格式要求,一般要求使用A4纸张,左右边距为2.5厘米,上下边距为2.0厘米。
正文一般使用宋体、小四号字,并按照章节进行分段。
标题、表格、图表等需要居中对齐,并标明编号和标题。
参考文献一般按照某种格式(如APA、MLA)进
行标注和排列。
此外,还需要注意实验报告的语言清晰明确,逻辑严密,准确描述实验过程和结果,避免主观评价和夸大其词。
实验报告格式实验报告要求1、认真完成实验报告,报告要用中国海洋大学实验报告纸,作图要用坐标纸。
2、报告中的电路图、光路图、表格必须用直尺画,数据使用钢笔、圆珠笔不得使用铅笔。
3、应在理解的基础上简单扼要的书写实验原理,不提倡大段抄书。
4、应结合具体的实验现象和问题进行讨论。
1、学生姓名、学号、实验组号及组内编号;2、实验题目;3、目的要求;4、仪器用具: 仪器名称及主要规格(包括量程、分度值等)、用具名称;5、实验原理:简单但要抓住要点,即要写出原理依据的公式名称、公式表达式、公式中各物理量的名称、公式成立的条件。
画出电路图、光路图等;6、实验内容:应包括主要实验步骤、测量及调节方法、观察到的现象、变化的规律以及相应的解释等;7、数据处理:画出数据表格(写明物理量和单位);按实验要求处理数据。
写出处理过程及误差。
8、结果讨论:写出结论,对实验中存在的问题、进一步的想法等进行讨论;9、作业题。
实验报告要求篇二1、用“查找和替换”的方法将正文中所有的“继续教育”设置为楷体并加粗。
2、将将主标题从“(2023—2023年)”处进行段内折行显示,副标题“第六章继续教育”设置为加宽3磅。
3、将正文各段设置为“首行缩进2字符”,行间距设置为“22磅”。
4、将正文段落加边框,边框距正文各边均为4磅。
5、使用换页法在文档新的一页处创建一个3×4的表格并居中显示,将第一行单元格合并,整个表格的字符格式设置水平垂直居中,外框设为3磅,内部网格设为1磅。
安徽省中长期教育和发展规划纲要(2023—2023年)第六章继续教育加快发展继续教育。
继续教育是面向学校教育之后所有社会成员的教育活动,是实现人的终身发展、全面发展的有效途径,是构建学习型社会的有效手段。
以加强人力资源能力建设为核心,大力发展非学历继续教育,稳步发展学历继续教育,重视老年教育。
大力发展城乡社区教育,构建社区教育网络,围绕居民生产、生活所需,灵活有效地提供职业技能服务及满足个人兴趣爱好的多样化服务。
实验报告格式英文实验报告格式英文IntroductionIn scientific research, conducting experiments is a crucial step in gathering data and analyzing results. To effectively communicate the findings, it is essential to follow a specific format for writing an experimental report. This article aims to provide a comprehensive guide on the format of an experimental report in English.Title and AbstractThe title of the experimental report should be concise and accurately reflect the content of the study. It should be followed by an abstract, which provides a brief summary of the experiment's objectives, methods, and key findings. The abstract should be concise, informative, and no more than 200 words.IntroductionThe introduction section sets the context for the experiment and provides background information on the topic. It should clearly state the research question or hypothesis that the experiment aims to address. Additionally, it should highlight the significance of the study and its potential contributions to the field.MethodsIn this section, the experimental procedures and materials used should be described in detail. This includes information on the study design, sample size,data collection methods, and any statistical analyses performed. The aim is to provide sufficient information for other researchers to replicate the experiment accurately.ResultsThe results section presents the findings of the experiment in a clear and organized manner. It should include relevant data, tables, graphs, or figures to support the conclusions drawn. The results should be presented objectively, without interpretation or discussion.DiscussionIn the discussion section, the results are interpreted and analyzed in the context of the research question or hypothesis. Any limitations or sources of error should be acknowledged, and possible explanations for unexpected results should be discussed. This section should also compare the findings with previous studies and highlight any novel or significant contributions made by the experiment.ConclusionThe conclusion section summarizes the main findings of the experiment and restates the research question or hypothesis. It should also provide insights into the broader implications of the study and suggest potential avenues for future research.ReferencesA list of references should be included at the end of the report, following aspecific citation style such as APA or MLA. This section acknowledges the sources of information and research that have been cited throughout the report. AppendicesIf necessary, additional information that supports the experimental report can be included in the appendices. This may include raw data, calculations, or any supplementary materials that are relevant to the study but too detailed for the main body of the report.ConclusionWriting an experimental report in English requires adherence to a specific format to effectively communicate the research findings. By following the structure outlined in this article, researchers can ensure that their reports are clear, concise, and easily understood by their peers. Remember, the key to a successful experimental report lies in accurately presenting the methods, results, and interpretations in a logical and organized manner.。
Title:[Insert the title of your experiment here]Student’s Name:[Your Name]Student’s ID:[Your Student ID]Course Name:[Name of the Course]Course Code:[Course Code]Date of Experiment:[Date of the Experiment]Objective:[State the main objective of the experiment in a single sentence.]Background Information:[Provide a brief overview of the scientific principles or theories related to the experiment. This section should include the history, significance, and relevance of the topic.]---Abstract:[Write a concise summary of the experiment, including the objective, methodology, results, and conclusions. This section should be around 150-200 words.]---1. Introduction[Provide a detailed introduction to the experiment, including the following sections:]1.1 Problem Statement:[Clearly state the problem or research question that the experiment aims to address.]1.2 Literature Review:[Summarize the existing research or theories related to the experiment, highlighting any gaps or questions that your experiment aims to fill or answer.]1.3 Hypothesis:[State the hypothesis or prediction that you are testing in the experiment.]1.4 Significance:[Explain the importance and potential impact of the experiment on the field of study.]---2. Materials and Methods[Describe the materials, procedures, and techniques used in the experiment. Include the following sections:]2.1 Materials:[List all the equipment, chemicals, samples, or other materials used in the experiment.]2.2 Procedure:[Provide a step-by-step description of the experimental procedure, including any measurements, observations, or data collection methods.]2.3 Control and Variable:[Identify the control variables and explain how they were controlled. Also, describe the independent and dependent variables and how they were manipulated or measured.]2.4 Data Analysis:[Explain the methods used to analyze the data collected during the experiment.]---3. Results[Present the results of the experiment in a clear and organized manner. Include the following sections:3.1 Raw Data:[Provide tables, charts, or graphs that present the raw data collected during the experiment.]3.2 Observations:[Record any observations made during the experiment that are relevant to the results.]3.3 Analysis:[Discuss the analysis of the data, including any calculations,statistical tests, or other methods used to interpret the results.]---4. Discussion[Analyze and interpret the results in the context of the experiment’s objective and hypothesis. Include the following sections:4.1 Results Validation:[Discuss the validity of the results, considering any potential sources of error or limitations in the experiment.]4.2 Hypothesis Testing:[Evaluate whether the results support or contradict the hypothesis.]4.3 Comparison with Literature:[Compare the results with those reported in the literature, highlighting any similarities or differences.]4.4 Implications:[Discuss the implications of the results for the field of study and any potential applications.]---5. Conclusion[Summarize the main findings of the experiment and restate the conclusion in relation to the hypothesis. Include the following sections:5.1 Summary:[Provide a brief summary of the experiment, including the objective, methodology, and results.]5.2 Conclusion:[State the conclusion based on the results and discuss whether the hypothesis was supported or refuted.]5.3 Recommendations:[Offer suggestions for future research or improvements to the experiment.]---6. References[List all the references cited in the report in the appropriate citation style (e.g., APA, MLA, Chicago).---Appendices[Include any additional information, such as detailed data tables, code, or additional figures that are not part of the main text but may be useful for understanding the experiment.]---Note: This template is a guide and should be customized according to the specific requirements of your experiment and the guidelines provided by your instructor or institution.。
实验室检验报告书写规范为了保证实验室检验报告的准确性和可读性,以下是实验室检验报告书写的一些规范:1. 报告注明:在报告的第一页上,清楚注明实验室的名称、报告的标题、报告编号、日期和报告的页数。
这些信息应该位于报告的顶部,并使用加粗和居中的字体显示。
2. 报告内容概述:在报告的第一页下方,提供对报告内容的简要概述。
该概述应该简洁明了,涵盖报告的主要目的、方法和结果。
3. 报告结构:报告的主体应包括以下几个部分:- 引言:介绍实验目的、背景和相关理论知识。
- 材料与方法:描述实验所使用的材料和实验方法的详细信息。
- 结果与讨论:提供实验结果的详细解释和分析,包括数据表、图表等。
- 结论:总结实验结果,阐明实验目的是否达到。
- 参考文献:列出实验中引用的文献。
4. 文字表述:报告中的文字应该准确、简练明了。
使用科学术语和专业术语来描述实验过程和结果,避免使用口语化的表达。
应该遵循语法规则和语言规范,并避免使用复杂的句子结构。
5. 图表使用:如果有适用的话,实验结果可以以表格、图表或图像的形式展示。
这些图表应该清晰可读,包含必要的标题和标注,以便读者理解。
6. 计量单位和符号使用:实验中使用的计量单位和符号应该符合国际通用的标准。
在报告中使用这些符号时,应提供相应的解释和说明。
7. 写作风格和格式:实验室检验报告应该采用正式的写作风格和格式。
报告应使用标准的字体、字号和行间距,并遵循学术写作的规范。
段落应该有清晰的结构和逻辑,使用标题和子标题来组织内容,使报告更具可读性。
以上是实验室检验报告书写的一些规范。
遵循这些规范可以确保实验室检验报告的质量和可靠性。
任何报告在提交前都应进行仔细校对和审查,以确保没有拼写错误、语法错误或其他排版问题。
参考文献:- [参考文献1]- [参考文献2]- [参考文献3]- ...以上回答了您的问题。
如果您还有其他问题,请随时提问。
实验报告英文格式Experimental Report FormatIntroductionIn scientific research, experimental reports play a crucial role in presenting the findings and conclusions of a study. These reports follow a specific format, which ensures clarity, consistency, and reproducibility. In this article, we will discuss the key components of an experimental report in English, highlighting their importance and providing examples where necessary.TitleThe title of an experimental report should be concise and informative, accurately reflecting the essence of the study. It should be written in a way that captures the attention of the reader while conveying the main focus of the experiment. For instance, a suitable title for a study investigating the effects of caffeine on cognitive performance could be "The Impact of Caffeine Consumption on Cognitive Function: A Controlled Experiment."AbstractThe abstract provides a brief summary of the experiment, highlighting the objectives, methods, results, and conclusions. It should be concise, usually ranging from 100 to 250 words. The abstract serves as a snapshot of the entire report, allowing readers to quickly determine if the study is relevant to their area of interest.IntroductionThe introduction section provides background information on the topic, justifies the need for the study, and outlines the research question or hypothesis. It should include a literature review, highlighting previous research related to the experiment. The introduction sets the context for the experiment and helps the reader understand the significance of the study. For example, in a report investigating the effects of exercise on mood, the introduction could discuss the existing literature on the relationship between physical activity and mental well-being.MethodsThe methods section describes in detail how the experiment was conducted. It should include information on the participants, materials used, procedures followed, and data collection methods. This section should be written in a clear and concise manner, allowing other researchers to replicate the study. For instance, in a report on a study examining the impact of a new drug on blood pressure, the methods section would include details on the dosage, administration, and monitoring procedures.ResultsThe results section presents the findings of the experiment. It should be organized in a logical and systematic manner, using tables, graphs, and figures to enhance clarity. The results should be presented objectively, without interpretation or discussion. For example, if the experiment involved measuring the growth rate of plants under different lighting conditions, the results sectionwould include the measurements recorded and any statistical analysis performed.DiscussionThe discussion section allows the researchers to interpret the results, compare them with previous studies, and draw conclusions. It should address the research question or hypothesis and provide explanations for the findings. Additionally, any limitations or potential sources of error should be acknowledged. The discussion section offers an opportunity to critically analyze the experiment and suggest future directions for research. For instance, in a report on a study investigating the effects of a new teaching method on student performance, the discussion section would analyze the results and discuss their implications for educational practices.ConclusionThe conclusion section summarizes the main findings of the experiment and restates the significance of the study. It should be concise and avoid introducing new information. The conclusion provides closure to the report and emphasizes the key takeaways for the reader.ReferencesThe references section lists all the sources cited within the report. It should follow a specific citation style, such as APA or MLA, ensuring proper credit is given to the original authors.In conclusion, an experimental report in English follows a structured format thatincludes a title, abstract, introduction, methods, results, discussion, conclusion, and references. Each section serves a specific purpose, contributing to the overall clarity and comprehensibility of the report. By adhering to this format, researchers can effectively communicate their findings and contribute to the scientific knowledge in their respective fields.。
报告编号:YT-FS-3318-53实验报告范本格式(完整版)After Completing The T ask According To The Original Plan, A Report Will Be Formed T o Reflect The Basic Situation Encountered, Reveal The Existing Problems And Put Forward Future Ideas.互惠互利共同繁荣Mutual Benefit And Common Prosperity实验报告范本格式(完整版)备注:该报告书文本主要按照原定计划完成任务后形成报告,并反映遇到的基本情况、实际取得的成功和过程中取得的经验教训、揭露存在的问题以及提出今后设想。
文档可根据实际情况进行修改和使用。
实验名称要用最简练的语言反映实验的内容。
如验证某程序、定律、算法,可写成"验证×××";分析×××。
学生姓名、学号、及合作者实验日期和地点(年、月、日)实验目的目的要明确,在理论上验证定理、公式、算法,并使实验者获得深刻和系统的理解,在实践上,掌握使用实验设备的技能技巧和程序的调试方法。
一般需说明是验证型实验还是设计型实验,是创新型实验还是综合型实验。
实验原理在此阐述实验相关的主要原理。
实验内容这是实验报告极其重要的内容。
要抓住重点,可以从理论和实践两个方面考虑。
这部分要写明依据何种原理、定律算法、或操作方法进行实验。
详细理论计算过程。
实验步骤只写主要操作步骤,不要照抄实习指导,要简明扼要。
还应该画出实验流程图(实验装置的结构示意图),再配以相应的文字说明,这样既可以节省许多文字说明,又能使实验报告简明扼要,清楚明白。
实验结果实验现象的描述,实验数据的处理等。
原始资料应附在本次实验主要操作者的实验报告上,同组的合作者要复制原始资料。
检验报告格式1. 引言检验报告是在实验室分析和测试完成后生成的文档,用于记录和呈现实验的结果和结论。
一个好的检验报告应当清晰、准确地呈现实验数据,提供结果的解释和分析,并根据需要提出建议和改进意见。
本文档将介绍检验报告的标准格式和要素,帮助读者编写规范的检验报告。
2. 报告信息检验报告开头应包含必要的报告信息,以便读者了解实验的背景和目的。
以下是报告信息的常见要素:•报告标题:清楚地描述实验的内容和目的。
•报告编号:对实验进行唯一标识的编号。
•报告日期:实验完成的日期。
•实验室名称:进行实验的实验室或机构的名称。
•实验人员:参与实验的人员姓名或实验小组名。
•联系方式:实验人员的联系方式,包括电话号码和电子邮件地址。
报告信息应以适当的格式和排版方式呈现,使其清晰易读。
3. 报告目录如果检验报告较长且包含多个章节,建议在开头添加一个目录,以方便读者快速浏览和定位到感兴趣的内容。
目录应包含报告各个章节的标题和页码。
4. 引言与背景在检验报告的引言部分,应该提供相关的背景信息和实验的目的。
这些信息将帮助读者了解实验的背景和意义,并有助于他们对实验结果的理解和解释。
引言部分的内容可能包括:•实验的背景和相关研究•实验的目的和研究问题•实验的方法和设计引言部分的撰写应简明扼要,但不应遗漏重要的背景信息。
5. 实验方法在检验报告的实验方法部分,应描述实验所采取的方法和步骤。
这些信息应足够详细,以便读者能够复制实验并获得相似的结果。
实验方法部分的内容可能包括:•实验的设备和工具•实验的样本和材料•实验的步骤和操作•实验的测量和分析方法实验方法应按照逻辑顺序呈现,以使读者能够按步骤进行实验。
6. 实验结果在检验报告的实验结果部分,应呈现实验所得的数据和观察结果。
数据可以以表格、图表或图像等形式表示。
为了提高数据的可读性和可理解性,应选择合适的图形和图像类型,并对其进行适当的标注和说明。
实验结果部分还可以包括数据的统计分析和解释。
Format for Laboratory ReportsThis text describes a general format for lab reports. A good lab report does more than present data; it demonstrates the writer's comprehension of the concepts behind the data. Merely recording the expected and observed results is not sufficient. Bear in mind that a format, however helpful, cannot replace clear thinking and organized writing. You still need to organize your ideas carefully and express them coherently.Title Page needs to contain the name of the experiment, the names of lab partners, and the date.Abstract summarizes four essential aspects of the report: the purpose of the experiment (the purpose of the report), key findings, significance and major conclusions. The abstract can also include a brief reference to theory or methodology. The information should clearly enable readers to decide whether they need to read your whole report. The abstract should be one paragraph of 100-200 wordsIntroduction states the objective of the experiment and provides the reader with background to the experiment. State the topic of your report clearly and concisely, in one or two sentences Introduction also provides background theory, previous research, or expressions (equations) the reader needs to know in order to follow the experiment. You need not repeat the lab manual, but show your own understanding of the problem. If the amount of introductory material seems to be extensive consider splitting in into subsections. The Introduction section must present (1) purpose of the experiment and (2) background information and/or theory. It also May include description of specialized equipment and justification of experiment's importanceEquipment and Experimental Setup This section can be a simple list, but make sure it is accurate and complete. In most cases you need to provide a block diagram or a schematic explaining the measurement setup.Measurement Procedures (or Methods) discusses how the experiment occurred. Documenting the procedures of your laboratory experiment is important not only so that others can repeat your results but also so that you can replicate the work later, if the need arises. You need to describe the process in chronological order. Using clear paragraph structure, explain all steps in the order they actually happened, not as they were supposed to happen.Results and Discussion section contains calculations, tables and figures; however, you still need to state and explain all significant results explicitly in verbal form. The heart of a laboratory report is the presentation of the results and the discussion of those results. In some formats, "Results" and "Discussion" appear as two sections.Graphs need to be clear, easily interpreted, properly labelled and need to include Figure captions. An important strategy for making your results effective is to draw the reader's attention to them with asentence or two, so the reader has a focus when reading the graph. To learn how to do this properly simply analyse a good (well written) experimental journal paper. Your raw data (especially if the size is considerable) can be placed in an appendix. Refer to appendices as necessary.Discussion is the most important part of your report, because here, you show that you understand the experiment beyond the simple level of completing it. Explain. Analyse. Interpret. You may like to think of this as the "subjective" part of the report. This means that the material you place in the Discussion section is what is not readily observable. This section of the report focuses on a question of understanding "What is the significance or meaning of the results?" To answer this question, use both aspects of discussion the analysis and the interpretation.●Compare expected results with those obtained.If there were differences, how can you account for them? Saying "human error" implies you're incompetent. Be specific; for example, the instruments could not measure precisely, the sample was not pure or was contaminated, or calculated values did not take account of friction.●Analyse experimental errors.Was it avoidable? Was it a result of equipment? If an experiment was within the tolerances, you can still account for the difference from the ideal. If the flaws result from the experimental design explain how the design might be improved. Starting from the known errors of sensors and instruments estimate the error of the measured quantity.●Relate results to your experimental objectives.●Compare your results to similar investigations.In some cases, it is legitimate to compare outcomes with classmates, not to change your answer, but to look for any anomalies between the groups and discuss those.●Analyse the strengths and limitations of this particular measurement setup.This is particularly useful if you need to design a similar measure3ment setup in the futureConclusion can be very short in most undergraduate laboratories. Simply state what you identified with certainty as a result of the measurement.References include your lab manual and any additional references you have used including print, electronic and online resources. References have to be presented in an appropriate standard format (IEEE, Optical Society of America, AIP, APS). Make sure you refer to each reference at least once in your report, if you don't, then it is likely you do not need that reference at all.Appendices One type of appendix that appears in laboratory reports presents information that is too detailed to be placed into the body of the report. Typically they include raw data, calculations, graphs pictures or tables that have not been included in the report itself and manufacturer's Data Sheets. Each group of data should be contained in a separate appendix. Make sure you refer to each appendix at least once in your report, if you don't then it is likely you do not need that data or it should not be in the appendix。