Raman and UV-Vis Spectroscopy Applied to the Analysis of Liver Tissues from Rats with Myocardial
- 格式:pdf
- 大小:257.36 KB
- 文档页数:4
光谱分析仪的相关应用介绍光谱分析仪是一种基于光谱技术进行分析的仪器,其通过对样品吸收或发射光谱进行测量,推断样品的物理或化学性质。
光谱分析仪应用广泛,包括但不限于以下几个领域。
材料科学光谱分析仪在材料科学领域得到广泛应用。
一般来说,材料都具有不同的化学成分和结构,这些特征会表现为材料的光学特性。
而光谱分析仪可以利用材料对不同波长的光谱响应不同的原理,来探测材料中的成分和结构的情况。
例如,利用X射线吸收光谱(XAS)技术可以研究材料中的元素价态、晶体结构等信息,而拉曼光谱(Raman spectroscopy)则可以研究材料分子结构、取向等信息。
化学分析光谱分析仪在化学分析中有广泛的应用。
它可以用于分析样品的物质成分、浓度和结构等信息。
例如,紫外-可见吸收光谱(UV-VIS)可以用于分析化合物浓度、金属离子浓度等,荧光光谱则可以用于研究生物化学反应、生物分子等信息,质谱则是一种对化学成分进行分析的有力工具。
生物医学光谱分析在生物医学领域也被广泛使用。
例如,红外线光谱技术,可以用于分析蛋白结构和折叠状态,探测生物分子的结构和变化,也可以用于药物研究和生化分析。
另一种常见的生物医学应用是Atom probe tomography(APT)技术,该技术结合了光谱分析和离子显微镜技术,可以进行三维微观结构的高分辨率分析,对材料和生物组织的化学/结构特征进行研究。
环境科学光谱分析在处理和分析环境样品中有着广泛的应用。
例如,在水质检测中,紫外吸收光谱可以用于测定水中有机和无机物的浓度和性质;拉曼光谱可以用于检测环境中有机化合物、颗粒物、甚至生物成分的分布和催化反应的观察。
综上,光谱分析仪广泛应用于材料科学、化学分析、生物医学和环境科学等领域。
随着技术的发展,相信现有的光谱分析仪将会在这些领域发挥越来越大的作用,为科学研究和社会生产提供更多的便捷和支持。
“海纹石”的矿物学及谱学特征研究郑晨;尹作为;殷科;李益龙;陈全莉;刘云贵【期刊名称】《光谱学与光谱分析》【年(卷),期】2013(033)007【摘要】“海纹石”是具有蓝色条带的针钠钙石,是一种稀有的宝石材料,具有较好的市场前景.为查明其矿物学特征及成因,采用常规宝石学测试并结合X射线衍射(XRD)、傅里叶红外吸收光谱(FTIR)、拉曼光谱(Raman)、扫描电镜(SEM)及紫外-可见分光光度计(UV-Vis)等现代测试方法,对“海纹石”不同颜色部分的矿物成分及特征进行了深入分析.XRD,FTIR,Raman分析结果表明,“海纹石”的主要组成矿物为针钠钙石,并含有少量的方解石,与SEM分析结果较为一致.FTIR分析显示,“海纹石”白色部分在1500 cm-1处出现一个明显的宽吸收带并伴有883和710 cm-1的吸收峰,表明含有少量方解石,而蓝色部分在该处没有此吸收.紫外可见吸收光谱分析显示蓝色部分在可见光区有640 nm宽吸收峰,表明可能含有微量元素Cu.“海纹石”白色和蓝色部分矿物组分的差异,表明两者可能形成于不同的地质环境.%Copper pectolite,a type of pectolite with blue stripes,is a rare gem material with a great market prospect.Mineralogy and genesis were investigated using X-ray diffraction (XRD),Fourier infrared absorption spectroscopy (FTIR),Raman spectroscopy (Raman),scanning electron microscopes (SEM) and ultraviolet-visible spectrometer(UV-VIS) to understand the mineralogical compositions and characteristics of the parts with different color.XRD,FTIR and Raman result showed that copper pectolite is composed of pectolite and minor calcite,consistent with theresult of SEM.FTIR showed that an obvious band at 1 500 cm-1 with 883 and 710 cm-1 occurred on the white part that contain minor calcite,while the band was absent on the blue part.UV-Vis absorption spectroscopy analysis showed that the blue part has 640 nm absorption band in the UV area that indicates containing elements Ct.The different mineralogical compositions of the white and blue part indicate their different geological conditions【总页数】5页(P1977-1981)【作者】郑晨;尹作为;殷科;李益龙;陈全莉;刘云贵【作者单位】中国地质大学珠宝学院,湖北武汉430074;中国地质大学珠宝学院,湖北武汉430074;中国地质大学地球科学学院,湖北武汉430074;中国地质大学地球科学学院,湖北武汉430074;中国地质大学珠宝学院,湖北武汉430074;中国地质大学珠宝学院,湖北武汉430074【正文语种】中文【中图分类】P575.4【相关文献】1.新疆哈密绿松石的矿物学和光谱学特征研究 [J], 刘喜锋;林晨露;李丹丹;朱琳;宋双;刘琰;沈崇辉2.坦桑石的矿物学及谱学特征研究 [J], 赖萌;廖宗廷;杨如增;周征宇;钟倩3.江西“高洲石”的矿物学和谱学特征研究 [J], 袁野;施光海;楼法生;吴师金;史淼;黄安杰4.陕西汉中蛇纹石玉的矿物学及光谱学特征研究 [J], 杨眉;何明跃;王峰;吴少坤;李前志;张碧瑶5.海纹石的宝玉石矿物学特征 [J], 彭立华;秦善因版权原因,仅展示原文概要,查看原文内容请购买。
光谱的分析原理及应用光谱分析是一种通过观察物体发射或吸收光的特定波长和强度来确定其组成和性质的方法。
基于不同的原理和应用,光谱分析可以分为多种类型。
原子吸收光谱(Atomic Absorption Spectroscopy, AAS)是一种常用的光谱分析方法。
它利用化学元素在特定波长下吸收光的规律,通过测量样品吸收光的强度来确定元素的存在和浓度。
原子吸收光谱广泛应用于环境监测、食品安全等领域。
紫外-可见吸收光谱(Ultraviolet-Visible Absorption Spectroscopy, UV-Vis)是一种用于分析有机物和无机化合物的常见方法。
UV-Vis光谱通过测量样品对紫外和可见光的吸收程度,可以确定其化学结构和浓度。
此技术广泛应用于生物化学、药学、环境科学等领域。
红外光谱(Infrared Spectroscopy, IR)是一种用于分析物质结构和化学键的方法。
红外光谱通过测量样品对红外光的吸收能谱,可以获得物质分子的信息,如官能团的存在和化学键的类型。
红外光谱在有机化学、医药研究等领域具有广泛应用。
拉曼光谱(Raman Spectroscopy)是一种通过测量样品散射光的频移来分析其结构和组成的技术。
拉曼光谱具有高灵敏度和非破坏性的特点,可被应用于材料科学、药物分析等领域。
核磁共振光谱(Nuclear Magnetic Resonance Spectroscopy, NMR)是一种常用的结构分析方法。
核磁共振光谱通过测量原子核在外加磁场下的共振行为,可以获得物质的结构和化学环境信息。
核磁共振光谱广泛应用于有机化学、生化学和医药领域。
光谱分析在许多领域中具有重要的应用价值,如环境监测、食品安全、药物研发、材料科学等。
通过光谱分析技术,可以确定物质的组成、浓度、结构以及相互作用等信息,为科学研究和工业生产提供了可靠的数据支持。

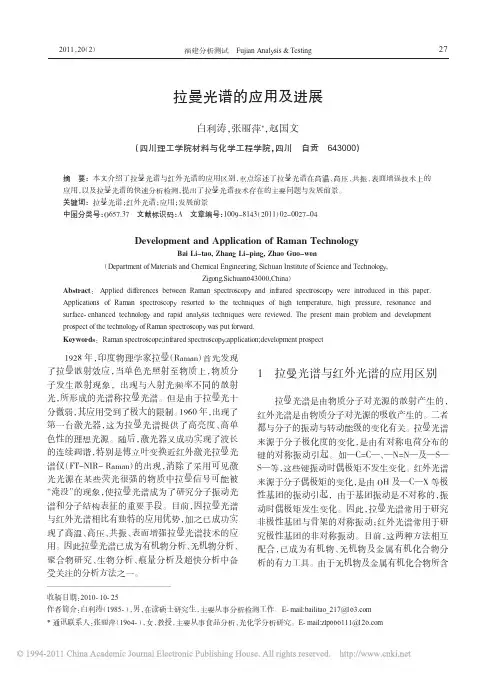
2011,20(2)拉曼光谱的应用及进展白利涛,张丽萍*,赵国文(四川理工学院材料与化学工程学院,四川自贡643000)摘要:本文介绍了拉曼光谱与红外光谱的应用区别,重点综述了拉曼光谱在高温、高压、共振、表面增强技术上的应用,以及拉曼光谱的快速分析检测,提出了拉曼光谱技术存在的主要问题与发展前景。
关键词:拉曼光谱;红外光谱;应用;发展前景中图分类号:O657.37文献标识码:A 文章编号:1009-8143(2011)02-0027-04Development and Application of Raman TechnologyBai Li-tao,Zhang Li-ping,Zhao Guo-wen(Department of M aterials and Chemical Engineering,Sichuan Institute of Science and Technology,Zigong,Sichuan643000,China)Abstract :Applied differences between Raman spectroscopy and infrared spectroscopy were introduced in this paper.Applications of Raman spectroscopy resorted to the techniques of high temperature,high pressure,resonance and surface-enhanced technology and rapid analysis techniques were reviewed.The present main problem and development prospect of the technology of Raman spectroscopy was put forward.Keywords :Raman spectroscope;infrared spectroscopy;application;development prospect收稿日期:2010-10-25作者简介:白利涛(1985-),男,在读硕士研究生,主要从事分析检测工作。
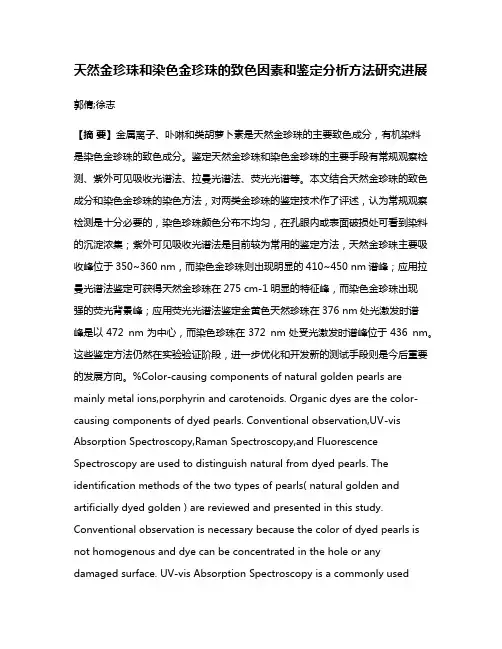
天然金珍珠和染色金珍珠的致色因素和鉴定分析方法研究进展郭倩;徐志【摘要】金属离子、卟啉和类胡萝卜素是天然金珍珠的主要致色成分,有机染料是染色金珍珠的致色成分。
鉴定天然金珍珠和染色金珍珠的主要手段有常规观察检测、紫外可见吸收光谱法、拉曼光谱法、荧光光谱等。
本文结合天然金珍珠的致色成分和染色金珍珠的染色方法,对两类金珍珠的鉴定技术作了评述,认为常规观察检测是十分必要的,染色珍珠颜色分布不均匀,在孔眼内或表面破损处可看到染料的沉淀浓集;紫外可见吸收光谱法是目前较为常用的鉴定方法,天然金珍珠主要吸收峰位于350~360 nm,而染色金珍珠则出现明显的410~450 nm谱峰;应用拉曼光谱法鉴定可获得天然金珍珠在275 cm-1明显的特征峰,而染色金珍珠出现强的荧光背景峰;应用荧光光谱法鉴定金黄色天然珍珠在376 nm处光激发时谱峰是以472 nm为中心,而染色珍珠在372 nm处受光激发时谱峰位于436 nm。
这些鉴定方法仍然在实验验证阶段,进一步优化和开发新的测试手段则是今后重要的发展方向。
%Color-causing components of natural golden pearls are mainly metal ions,porphyrin and carotenoids. Organic dyes are the color-causing components of dyed pearls. Conventional observation,UV-vis Absorption Spectroscopy,Raman Spectroscopy,and Fluorescence Spectroscopy are used to distinguish natural from dyed pearls. The identification methods of the two types of pearls( natural golden and artificially dyed golden ) are reviewed and presented in this study. Conventional observation is necessary because the color of dyed pearls is not homogenous and dye can be concentrated in the hole or any damaged surface. UV-vis Absorption Spectroscopy is a commonly usedidentification method. The main absorption peaks of natural golden pearls lie between 350 nm and 360 nm,whereas those of dyed pearls lie between 410 nm and 450 nm. Raman Spectroscopy has identified that natural golden pearl has a characteristic peak of 275 cm-1 ,but dyed pearl has a strong fluorescence background peak. Fluorescence Spectroscopy has identified that the natural golden pearl has a central peak of 472 nm as excitation by 376 nm light,whereas the dyed pearl has a central peak of 436 nm as excitation by 372 nm light. Further verification of these identification methods should be undertaken,along with improvements in optimization and the development of new methods.【期刊名称】《岩矿测试》【年(卷),期】2015(000)005【总页数】8页(P512-519)【关键词】金珍珠;致色成分;常规检测;紫外可见吸收光谱法;拉曼光谱法;荧光光谱法【作者】郭倩;徐志【作者单位】广东省地质实验测试中心,广东广州510080;广东省地质实验测试中心,广东广州510080【正文语种】中文【中图分类】O657.32;O657.37;O657.34金黄色海水珍珠,属于南洋珠的一种,产自白唇贝或金唇贝中(大珠母贝),两种贝的主要产地在澳大利亚北部、印尼群岛、菲律宾、缅甸、日本以及泰国关沙梅和中国三亚。
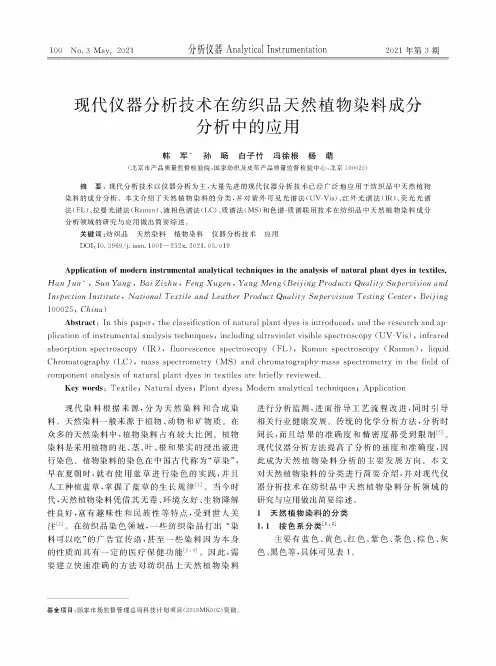
现代仪器分析技术在纺织品天然植物染料成分分析中的应用韩军$孙肠白子竹冯徐根杨萌(北京市产品质量监督检验院,国家纺织及皮革产品质量监督检验中心"匕京100025)摘要:现代分析技术以仪器分析为主,大量先进的现代仪器分析技术已经广泛地应用于纺织品中天然植物染料的成分分析&本文介绍了天然植物染料的分类,并对紫外可见光谱法(UV-Vis)、红外光谱法(IR)、荧光光谱法(FL)、拉曼光谱法(Raman)、液相色谱法(LC)、质谱法(MS)和色谱-质谱联用技术在纺织品中天然植物染料成分分析领域的研究与应用做出简要综述&关键词:纺织品天然染料植物染料仪器分析技术应用DOI:10.3969/j.issn.1001—232x.2021.03.019Application of modern instrumental analytical techniques in the analysis of natural plant dyes in textiles. Han Jun$,Sun Yang,Bai Zizhu,FengXugen,Dang Meng(Beijing ProducSs Quality Supervision and Inspection Institute,National Textile and Leather Product Quality Supervision Testing Center,Beijing 125,Chin$)Abstract:Inthispaper,theclassificationofnaturalplantdyesisintroduced,andtheresearchandap-plication of instrumental analysis techniques,including ultraviolet visible spectroscopy(UV-Vis),infrared absorptionspectroscopy(IR),fluorescencespectroscopy(FL),Raman spectroscopy(Raman),liquid Chromatography(LC),massspectrometry(MS)andchromatography-massspectrometryinthefieldof componentanalysisofnaturalplantdyesintextilesarebrieflyreviewed.Key words:Textile;Natural dyes;Plant dyes;Modern analytical techniques;Application现代染料根据来源,分为天然染料和合成染料&天然染料一般来源于植物、动物和矿物质&在众多的天然染料中,植物染料占有较大比例&植物染料是采用植物的花、茎、叶、根和果实的浸出液进行染色&植物染料的染色在中国古代称为“草染.早在夏朝时,就有使用蓝草进行染色的实践,并且人工种植蓝草,掌握了蓝草的生长规律[1\当今时代,天然植物染料凭借其无毒、环境友好、生物降解性良好,富有趣味性和民族性等特点,受到世人关注在纺织品染色领域,一些纺织染品打出“染料可以吃”的广告宣传语,甚至一些染料因为本身的性质而具有一定的医疗保健功能34&因此,需要建立快速准确的方法对纺织品上天然植物染料进行分析监测,进而指导工艺流程改进,同时引导相关行业健康发展&传统的化学分析方法,分析时间长,而且结果的准确度和精密度都受到限制5&现代仪器分析方法提高了分析的速度和准确度,因此成为天然植物染料分析的主要发展方向&本文对天然植物染料的分类进行简要介绍,并对现代仪器分析技术在纺织品中天然植物染料分析领域的研究与应用做出简要综述&1天然植物染料的分类1.1按色系分类12*主要有蓝色、黄色、红色、紫色、茶色、棕色、灰色、黑色等,具体可见表1&基金项目:国家市场监督管理总局科技计划项目(2019MK002)资助&表1天然植物染料按颜色分类表颜色天然植物染料蓝色靛蓝、马蓝、蓼蓝(又名大青)、菘蓝(又名大蓝)、木蓝(又名槐蓝)等黄色梔子、姜黄、银杏、苏木、大黄、柘黄、槐花、黄檗、荩草、青茅草、黄柏、橡树、地黄、石榴、涩柿、黄栌、郁金、核桃、林檎、桑树、菊花、黄连、洋葱等红色花生衣、茜草、红花(又名红蓝草)、番红花、苏枋(又称苏木)、苹果花、樱花、洋葱等紫色紫草、紫檀(青龙木)、落葵、野苋、梅等茶色和棕色桑木、杨梅栎木、茶叶、养麦、柳、艾、樟、薯萇、栎木、橡木、桦木、紫苏、紫衫、石榴、益母草、板栗壳、胡桃、冬瓜、乌梅、杜松、虎杖等灰色和黑色五倍子、菱、乌柏、盐肤木、柯树、槲木(槲若)、漆大姑、钩吻、菰、化香树等1.2按应用特点分类⑴类胡萝卜素类、黄酮类、萘醌类、蔥醌类、苯并毗喃按照染料应用特点的不同,可以分为易溶型、类、单宁类、生物碱类等,具体可见表2。
光谱法的鉴别内容光谱法是一种通过分析物质产生的光谱特征来进行物质鉴别的方法。
以下是各种光谱法的鉴别内容:1.紫外可见光谱法(UV-Vis Spectroscopy)紫外可见光谱法是一种利用物质在紫外和可见光区域内的吸收光谱特征进行物质鉴别的方法。
它可以用于分析有机化合物、金属离子、配合物等的结构,以及研究分子在激发状态下的行为。
2.红外光谱法(Infrared Spectroscopy)红外光谱法是一种利用物质在红外光区域内的吸收光谱特征进行物质鉴别的方法。
它可以用于分析有机化合物、聚合物、蛋白质、矿物等物质的分子结构和化学键信息。
3.核磁共振法(NMR)核磁共振法是一种利用原子核自旋磁矩进行研究的方法,通常用于分析分子结构和化学键信息。
通过测量样品在特定频率的磁场中吸收的能量,可以获得样品的核磁共振谱,从而进行物质鉴别。
4.质谱法(MS)质谱法是一种通过测量样品离子在电场或磁场中的运动轨迹来进行物质鉴别的方法。
通过将样品离子化并使其在电场或磁场中加速,可以获得样品的质谱图,从而确定样品的分子量和化学结构信息。
5.X射线衍射法(XRD)X射线衍射法是一种利用X射线在样品中产生的衍射现象进行研究的方法。
通过测量衍射角和衍射强度,可以获得样品的晶体结构和化学组成信息。
6.拉曼光谱法(Raman Spectroscopy)拉曼光谱法是一种利用拉曼散射现象进行研究的方法。
当激光束照射到样品上时,会与样品分子相互作用并产生拉曼散射,从而获得样品的拉曼光谱。
拉曼光谱可以提供有关样品分子结构和化学键的信息,常用于材料科学、生物学和化学领域。
7.荧光光谱法(Fluorescence Spectroscopy)荧光光谱法是一种利用样品在激发光照射下产生的荧光现象进行研究的方法。
通过测量荧光发射波长和强度随激发波长的变化,可以获得样品的荧光光谱。
荧光光谱可以提供有关样品分子结构和化学键的信息,常用于生物医学、环境监测等领域。
RM5PHARMACEUTICALSPOLYMERS NANO-MATERIALSCHEMICALS BIOSCIENCES MOLECULAR SPECTROSCOPY SINCE 1971 CIRCLE Photoluminescence CIRCLE Raman CIRCLE UV-Vis CIRCLE Transient AbsorptionEDINBURGH INSTRUMENTSEdinburgh Instruments has been providing high performance instrumentation in the Molecular Spectroscopy market for almost 50 years. Our commitment to offering the highest quality, highest sensitivity instruments for our customers has now expanded to include the best Raman microscopes for all research and analytical requirements.As always, Edinburgh Instruments provides world-class customer support and service throughout the lifetime of our instruments.1PRECISIONRAMANSEMICONDUCTORS GEOLOGYFORENSICS ART & MUSEUM COSMETICSRM5 RAMAN MICROSCOPEThe RM5 is a compact and fully automated Raman microscope for analytical and research purposes. The truly confocal design of the RM5 is unique to the market and offers uncompromised spectral resolution, spatial resolution, and sensitivity.The RM5 builds on the expertise of robust and proven building blocks, combined with modern optical design considerations; and a focus on function, precision and speed. The result is a modern Raman microscope that stands alone in both specifications and ease of use.Truly Confocal – with variable slit and multiple position adjustablepinhole for higher image definition, better fluorescence rejection and application optimisation Integrated Narrowband Raman Lasers – up to 3 computer-controlled lasers for ease of use, enhanced stability and reduced footprint 5-Position Grating Turret – for unrivalled spectral resolutionof 1.4 cm -1 (FWHM) and optimisation over the full spectral range 50 cm -1 - 4000 cm -1 Integrated Detectors – up to 2, including high efficiency CCD,EMCCD and InGaAs arrays for low noise, increased speed, high sensitivity and wide spectral range Internal Standards and Auto-Calibration – to ensure thehighest quality data at all times 4-Position Raman Filter Turret – fully automated notch and edgefilters to match the Raman range to excitation laser wavelength Ramacle ® Software – one powerful software package forcomplete system control, data acquisition, analysis and ease of upgrade High Performance Microscope – compatible with all thelatest accessories2D E S I G N F E A T U R E SRM5DESIGN FEATURESLaser excitation, from one of three possible lasers (1), is directed to the microscope and sample stage via a series of motorised mirrors with laser power at the sample controlled through an adjustable attenuator. The beam is focussed onto the sample that sits on an XYZ-movable stage (3) through a microscope objective, and can be viewed live on screen thanks to an integrated CMOS camera (4). The scattered light produced is then collected by the same objective before being passed through a filter to remove unwanted laser light. The Raman scattered light passes through an adjustable confocal pinhole (5) before entering the spectrograph. One of five possible diffraction gratings splits the light into its constituent wavelengths (6) which are then focussed onto the detector(s) (7) and displayed to the user as a spectrum.1Multiple LasersUp to 3 integrated and computer-controlled lasers with choice of wavelengths, combined with a computer-controlled continuous laser beam attenuator to allow control over laser power at the sample position.3High Performance MicroscopeThe latest generation research-grade upright microscope (Olympus BX53series), allows the RM5 to benefit from all modern sample visualisation and contrast enhancement techniques availableincluding brightfield, darkfield, polarised light, Nomarski differential interference contrast (DIC) and fluorescence. A manual or computer-controlled XYZ stage provides movement to locate and map areas of interest on the sample.2Automated CalibrationFor recalibration and validation, the RM5 comes with integrated Raman reference materials. Internal standards are included for spectrograph calibration and for laser wavelength calibration and adjustment. All calibration and validation routines are part of the instrument’s operating software, Ramacle ®, and allow for complete ease-of-use and user-friendliness.3535Automated Optical RoutingThis compartment contains a 4-position turret of dichroic laser rejection filters, computer-controlled beam splitter and an adjustable confocal pinhole. Auto-alignment of the instrument is achieved by two embedded piezo-controlled mirrors. An optional polariser and analyser accessory is available for advanced analysis of polarised Raman scattering.microscope for higher resolution and image stitching of Raman mapping.7Multiple Detector PortsThermo-electrically cooled spectroscopic CCD cameras are used for low noise and fast image detection. A second CCD camera port is available for a camera with complementary spectral coverage,increased speed, higher spectral sampling or sensitivity, pushing the flexibility of the RM5.6High Resolution SpectrographA high resolution 225 mm focal lengthspectrograph of asymmetric Czerny-Turner design is integrated. This includes acontinuously adjustable precision slit and a grating turret with up to 5 pre-aligned gratings for wide spectral coverage. The spectrograph undergoes comprehensive calibration and validation procedures at the factory.2Triptycene triplet, excited by 785 nm laser, 600 g/mm grating (blue) and 1800 g/mm grating (red), arbitrary scaled1 μm Polystyrene bead scanned over a distance 12 μm, excited with 532 nm laserSilicon, excited with 785 nm laserL-Histidine,excited with 785 nm laserThe software provides control, visualisation, data acquisition, analysis and presentation of the RM5 whether it is used for generating Raman spectra or with advanced upgrades suchas Raman mapping.Ramacle enables sample visualisation, live signal monitoringand parameter optimisation before every measurement. The instrument status and signal are displayed and constantly updated during measurements.Data generated by Ramacle have a proprietary file format. This contains all measurement and instrumental properties, allowing the user to retrieve important information whenever neededand ensures data traceability. Simple input and output functions provide the required compatibility with third party data analysis or presentation packages.KnowItAll TM Raman Identification Pro spectral library is availablefor material identification and advanced analysis. Data acquisition methods such as single measurements, multiple and accumulated scans, kinetic scans and generation of maps (accessory dependent)Cyclohexane, excited with 785 nm laser. Parallel polarised intensity (orange), perpendicular polarised intensity (blue). Inset: Depolarisation ratio. Raman spectrum of 1,2(4-pyridyl)ethylene 40 nm Au, recorded over time, showing the significant enhancement of the signal intensity of this SERS sample.Benzonitrile, excited with 532 nm laser. Multiple spectra joined together. The resulting spectrum contains 6700 data points with 3500 cm-1 spectral coverage and a resolution of 0.54 cm-1 per pixel.Paracetamol / Caffeine / Phenylephrine Hydrochloride tablet, excited with 638 nm laser (blue) and 785 nm laser (red).Raman spectra of the constituents of a commercial pharmaceutical tablet, excited with 785 nm laser.White light image of the tablet under investigation.Using a 10x objective, the image has been composed of 1,650 (55 x 30) individual white light images automatically acquired and stitched together into one large image by Ramacle. The blue grid scale shows the frame size of the individual images.Raman map superimposed on the white light image.Using the same 10x objective, 785 nm laser excitation, and a 50 μm pinhole, spectra were collected at 100 μm steps along the X and Y axes. This results in over 18,000 individual Raman acquisitions.The matrix of spectra was then analysed and superimposed onto the white light image using Ramacle software. The colours in the resulting map represent Aspirin (red), Caffeine (blue) and Paracetamol (green) demonstrated by their Raman spectra above. The red grid scale shows the area that was scanned for Raman with 1 mm graduation.8U P G R A D E O P T I O N SLASERSThe RM5 is built with flexibility in mind. A choice of excitation lasers and associated laser rejection filters (both edge and notch) are available depending on application requirements.GRATINGSGratings are chosen for optimum resolution for each laser excitation, with up to a maximum of five gratings per system.DETECTORSA choice of CCD, EMCCD and InGaAs detectors are also available dependent on requirements, with a maximum of two detectors being integrated per system.ACCESSORIES AND LASER SAFETYOther accessories such as a polarisation kit and a Class Ilaser safety enclosure are also available to further expand the capabilities, flexibility and safety of your RM5 system.MICROSCOPEThe RM5 uses one of the most modern microscopes on the market for first class Raman microscopy. You can use the microscope beyond pure Raman microscopy; the RM5 has been designed to maintain the full capability of the microscope allowing all the necessary tools to be added for exceptional visualisation and contrast of your samples. Brightfield, darkfield, polarised light, differential interference contrast (DIC) and fluorescence are all available. Alongside a choice of high quality microscope objectives, a highperformance camera can be added to the microscope to ensure pictures of your samples (and associated Raman maps) are captured with excellent quality and resolution.SAMPLE STAGESA choice of microscope stages, including manual and an XYZ motorised stage which allows ease of navigation around your samples and stage area. Automated Raman maps can be obtained and generated through Ramacle.Heating/cooling of stages is also available.SPECIFICATIONS – RM5LASERS Up to 3 narrow-band lasers including: 532 nm, 638 nm, 785 nmOther wavelengths available on requestLaser selection is fully computer-controlledLASER REJECTION FILTERS Up to 3 laser rejection filters includedFilter exchange is fully computer-controlledLASER ATTENUATION 4 orders of magnitude, continuousFully computer-controlledSPECTRAL RESOLUTION From 1.4 cm-1 *SPECTRAL RANGE50 cm-1 - 4000 cm-1 *SPECTROGRAPH T ype Asymmetric Czerny-TurnerFocal Length225 mmGratings5-position grating turret, fully computer-controlledSlits Continuously adjustable, fully computer-controlledCONFOCAL IMAGING Adjustable confocal pinhole, fully computer-controlledDETECTORS Standard Detector High sensitivity ultra low noise CCD1650 x 200 pixels, TE-cooled -60o C (standard) OR2000 x 256 pixels, TE-cooled -60o C (enhanced sensitivity and spectral range)Optional Second Detector EMCCD detector, InGaAs and others available on requestSelection of detectors, fully computer-controlledRAMAN POLARISATION Optional Polarisation kit available, fully computer-controlledINTERNAL CALIBRATION Wavelength calibration standard (Neon)Raman shift standard (Silicon)Sensitivity validation standard (Silicon)Automated laser alignmentMICROSCOPE SYSTEM Functionality Full upright microscope with brightfield and darkfield illuminatorOptional Polarisation, Differential Interference Contrast (DIC) capability and fluorescence imagingObjective(s)10x and 100x objective included as standard; up to 5 can be includedSample Viewing Trinocular eyepiece, embedded CMOS video camera, second video camera optionalSample Stage XY manual stageOptional XYZ motorised stage (75 mm x 50 mm XY), confocal Raman mappingT emperature-controlled sample stages availableSOFTWARE Ramacle®Comprehensive all-in-one, intuitive software packageOperating System Windows®Functionality Data acquisition, spectrograph control, graphical display, data processingOptional Chemometric, spectral library packages - KnowItAll TMLASER SAFETY Without Laser Enclosure Class 3BWith Laser Enclosure Class 1DIMENSIONS W x D x H †600 mm x 800 mm x 600 mmWeight †63 kg*depending on grating, laser and CCD selection† without laser enclosure9EDINBURGHINSTRUMENTS2 Bain Square,Kirkton Campus,Livingston, EH54 7DQUnited KingdomTel: +44 (0)1506 425 300Fax: +44 (0)1506 425 320****************U.S. OFFICECONTACT:Tel: +1 800 323 6115******************Registered in England and Wales No: 962331 VAT No:GB 271 7379 37 ©Edinburgh Instruments Ltd 2019F / 06.2019MANUFACTURED WITH PRIDE IN THEUNITED KINGDOMCustomer support isavailable worldwideP h o to lu m ine s c e n c e CIRCLE R a m a n CIRCLE U V -V i s CIRCLET ransie nt Abso rp tionEXPERTS IN MOLECULAR SPECTROSCOPY S I N C E 1971。
纳米材料的表征及其催化效果评价方式纳米材料的表征主要目的是确定纳米材料的一些物理化学特性如形貌、尺寸、粒径、等电点、化学组成、晶型结构、禁带宽度和吸光特性等。
纳米材料催化效果评价方式主要是在光照(紫外、可见光、红外光或者太阳光)条件下纳米材料对一些污染物质(甲基橙、罗丹明B、亚甲基蓝和Cr6+等)的降解或者对一些物质的转化(用于选择性的合成过程)。
评价指标为污染物质的去除效率、物质的转化效率以及反应的一级动力学常数k的大小。
1 、结构表征XRD,ED,FT-IR, Raman,DLS2 、成份分析AAS,ICP-AES,XPS,EDS3 、形貌表征TEM,SEM,AFM4 、性质表征-光、电、磁、热、力等UV-Vis,PL,Photocurrent1. TEMTEM为透射电子显微镜,分辨率为0.1~0.2nm,放大倍数为几万~百万倍,用于观察超微结构,即小于0.2微米、光学显微镜下无法看清的结构。
TEM是一种对纳米材料形貌、粒径和尺寸进行表征的常规仪器,一般纳米材料的文献中都会用到。
The morphologies of the samples were studied by a Shimadzu SSX-550 field-emission scanning electron microscopy (SEM) system, and a JEOL JEM-2010 transmission electron microscopy (TEM)[1].一般情况下,TEM还会装配High-Resolution TEM(高分辨率透射电子显微镜)、EDX(能量弥散X射线谱)和SAED(选区电子衍射)。
High-Resolution TEM用于观察纳米材料的晶面参数,推断出纳米材料的晶型;EDX一般用于分析样品里面含有的元素,以及元素所占的比率;SAED用于实现晶体样品的形貌特征与晶体学性质的原位分析。
2. SEMSEM 表示扫描电子显微镜,可以获取被测样品本身的各种物理、化学性质的信息,如形貌、组成、晶体结构和电子结构等等。
药物分析学报:英文版一、发表说明本团队专注于论文写作与发表服务,擅长案例分析、编程仿真、图表绘制、理论分析等,论文写作、发表300起,具体价格信息联系:本团队并非任何杂志编辑中心,本中心是专业代发论文的机构,与各个杂志社具有长期良好的合作关系,也就是我们通过我们的特殊渠道将论文送给杂志社我们特定的内部人处理论文,保证较高的上稿率,以解决投稿人投稿后焦急的等待与石沉大海的结局。
通过我们可以较为容易达到发表的目地,当然,论文的质量也是重要的基础。
二、期刊简介如下是西安交通大学主办、教育部主管的学术理论刊物,2011年1月由“Academic Journal of Xi’an Jiaotong University:《西安交通大学学报(英文版)》”,经报请教育部、科技部、新闻出版总署批准,于2011年2月更名为“Journal of Pharmaceutical Analysis(JPA,药物分析学报)”。
JPA为国内外公开发行的英文学术期刊,季刊。
JAP主要集中反映与药品质量、用药安全和分析方法等相关的最新研究成果,重点报道:(1)中药(药材、成药、方剂、注射剂)分析;(2)药物复杂体系分析;(3)生物技术药物质量控制技术与方法;(4)药物体内作用过程分析;(5)药物发现过程中的定量与定性分析;(6)分子药理学中的示踪分析;(7)生物药剂学中的定量分析;(8)临床检验与生物分析等。
栏目有:Review、Original Articles 和 Short Communication。
JPA是世界上第一份有关药物分析的专业学术期刊,主编由西安交通大学医学院药物研究所所长、中国药学会药物分析专业委员会主任委员贺浪冲教授担任。
JPA目前被美国《化学文摘》(CA)和荷兰《医学文摘》(EM)收录,并进入中文科技期刊数据库、万方数据库、中国学术光盘数据库(CNKI) 和重庆维普数据库等多家国内著名检索系统。
ReviewPaperQuantitative bioanalytical and analytical method development of dibenzazepine derivative, carbamazepine: A revieworiginalArticle Development and validation of a GC-FID method for quantitative analysis of oleic acid and related fatty acidsORIGlNAL ARTICLEDetermination of cilostazol and its active metabolite 3,4-dehydro cilostazol from small plasma volume by UPLC-MS/MSSHORT COMMUNICATION Capillary electrophoresis to determine entrapment efficiency of a nanostructured lipid carrier loaded with piroxicamINFORMATION Application of analytical instruments in pharmaceutical analysisBioautography and its scope in the field of natural product chemistryORIGINAL ARTICLENon-covalent binding analysis of sulfamethoxazole to human serum albumin:Fluorescence spectroscopy, UV-vis, FT-IR, voltammetric and molecular modelingSHORT COMMUNICATIONIsolation and characterization of a degradation product in leflunomide and a validated selective stability-indicating HPLC-UV method for their quantificationINFORMATIONApplication of analytical instruments in pharmaceutical analysisReviewPaperQuantitative bioanalytical and analytical method development of dibenzazepine derivative, carbamazepine: A revieworiginalArticle Development and validation of a GC-FID method for quantitative analysis of oleic acid and related fatty acidsREVIEW ARTICLEMeasurement uncertainty in pharmaceutical analysis and its applicationORIGINAL ARTICLEMetabolic profiling of plasma from cardiac surgical patients concurrently administered with tranexamic acid:DI-SPME-LC-MS analysisINFORMATIONApplication of analytical instruments in pharmaceutical analysisORIGINAL ARTICLECharge-transfer interaction of drug quinidine with quinol, picric acidand DDQ:Spectroscopic characterization and biological activity studies towards understanding the drug-receptor mechanismINFORMATION Application of analytical instruments in pharmaceutical analysisREVIEW PAPERDevelopment of forced degradation and stability indicating studies of drugs-A review0RIGINAL ARTICLEDirect detection and identification of active pharmaceutical ingredients in intact tablets by helium plasma ionization (HePI) mass spectrometryINFORMATI0NApplication of analytical instruments in pharmaceutical analysisREVIEW PAPERChemometrics: A new scenario in herbal drug standardizationORIGINAL ARTICLEQuantification of anandamide, oleoylethanolamide and palmitoylethanolamide in rodent brain tissue using high performance liquid chromatographyelectrospray mass spectroscopyINFORMATIONApplication of analytical instruments in pharmaceutical analysisREVIEW PAPERPioglitazone:A review of analytical methodsORIGINAL ARTICLERisk evaluation of impurities in topical excipients:The acetol caseSHORT COMMUNICATIONSimultaneous determination of borneol and its metabolite in rat plasma by GC-MS and its application to pharmacokinetic studyINFORMATIONApplication of analytical instruments in pharmaceutical analysisSynthesis of carbon nanosheet from barley and its use as non-enzymatic glucose biosensor0RIGINALARrICLEQuantitation of bivalirudin, a novel anticoagulant peptide, in human plasma by LC-MS/MS: Method development, validation and application to pharmacokineticsLiquid chromatography tandem mass spectrometry method for the estimation of lamotrigine in human plasma:Application to a pharmacokinetic studySimultaneous quantification of prodrug oseltamivir and its metabolite oseltamivir carboxylate in human plasma by LC-MS[MS to support a bioequivalence studyA sensitive, simple and rapid HPLC-MS/MS method for simultaneous quantification of buprenorpine and its N-dealkylated metabolitenorbuprenorphine in human plasmaSPECIALISSUE:HPLCinpharmaceuticalanalysisFused-core particle technology in high-performance liquid chromatography: An overviewREVIEWPAPERApplication of LC–MS/MS for quantitative analysis of glucocorticoids and stimulants in biological fuids0RIGINALARTICLEChiral separation of bavachinin in Fructus Psoraleae and rat plasma by liquid chromatography using permethylated-p-CD as a chiral selectorSHORTCOMMUNICATIONA novel and rapid microbiological assay for ciprofoxacin hydrochlorideORIGINAL ARTICLEPharmacokinetic study of inosiplex tablets in healthy Chinese volunteers by hyphenated HPLC and tandem MS techniquesSHORT COMMUNICATIONI Simultaneous determination of five diterpenoid alkaloids in Herba Delphinii by HPLC/ELSDRapid determination of anti-estrogens by gas chromatography/mass spectrometry in urine:Method validation and application to real samplesImmobilized enzyme reactors in HPLC and its application in inhibitor screening:A reviewSimultaneous determination of pioglitazone and candesartan in human plasma by LC-MS/MS and its application to a human pharmacokinetic studySchisandra chinensis (Turcz.) BaillSimultaneous determination of telmisartan and amlodipine in human plasma by LC-MS]MS and its application in a human pharmacokinetic studyORIGINAL ARTICLESeparation and enrichment of trace ractopamine in biological samples by uniformly-sized molecularly imprinted polymersSHORT COMMUNIC ATION An analytical method for Fe(Ⅱ)and Fe(Ⅲ)determination in pharmaceutical grade iron sucrose complex and sodium ferric gluconate complexORIGINAL ARTICLESIdentification and determination of the major constituents in traditional Chinese medicine Longdan Xiegan Pill by HPLC-DAD-ESI-MSINFORMATIONPublished the papers of GC-MS analysis—Traditional ChinesemedicineRECRUITMENTLecturer/Professor Wanted at Xi'an Jiaotong UniversityREVIEWApplications of HPLC/MS in the analysis of traditional Chinese medicinesORIGlNAL ARTICLESDetermination of phthalate esters in physiological saline solution by monolithic silica spin column extraction methodINFORMATION Published papers about fingerprint and quality control of traditional Chinese medicineRECRUITMENTLecturer/Professor Wanted at Xi'an Jiaotong UniversityORIGINAL ARTICLEHighly sensitive chemiluminescence technology for protein detection using aptamer-based rolling circle amplification platformINFORMATION Published papers about food safetyRECRUITMENTChair Professors and Visiting Professors of "Chang Jiang Scholars Program"Liquid chromatography coupled with time-of-flight and ion trap mass spectrometry for qualitative analysis of herbal medicinesDetection of captopril based on its enhanced resonance lightscattering signals of fluorosurfactant-capped gold nanoparticlesLC-ESI-MS/MS,a modified method for simultaneous quantification of isoflavonoids,flavonoids,alkaloids and saponins in a Chinese herbal preparation Gegen-Qinlian decoctionStudy on chromatographic fingerprint of sarcandra glabra (Thunb.) by microwave-assisted extraction coupled to HPLC/DAD。