New Response Evaluation Criteria in Solid Tumors (RECIST)
- 格式:pdf
- 大小:741.21 KB
- 文档页数:8

关于临床试验中新发病灶的标准,这通常是根据特定的研究协议、治疗方案和国际标准来确定的。
具体的标准可能会因研究类型、疾病特征、试验设计等因素而有所不同。
在进行临床试验时,通常会使用一些通用的标准来评估和报告新发病灶,这样有助于确保试验结果的一致性和可比性。
以下是一些可能涉及到新发病灶评估的通用原则:
1. Response Evaluation Criteria in Solid Tumors(RECIST):
-RECIST是用于评估实体肿瘤治疗反应的常用标准,通常用于癌症临床试验。
它定义了新发病灶的标准和评估方法。
2. World Health Organization(WHO)标准:
- WHO标准也被广泛用于评估肿瘤治疗反应,包括对新发病灶的评估。
3. Immune-related Response Criteria(irRC):
-对于免疫治疗临床试验,可能采用irRC来评估患者的治疗反应,包括新发病灶的定义和评估。
4. RECIST 1.1:
- RECIST标准经过多次更新,最新版本是RECIST 1.1,它对新发病灶的定义和测量方法进行了更新和澄清。
在临床试验的研究协议和相关文件中,会详细描述用于评估新发病灶的标准和方法。
研究团队通常会按照这些规定来进行新发病灶的评估和报告。
研究者和相关人员需要严格按照协议中的规定执行,以确保试验的科学性和数据的准确性。
请注意,具体的标准和方法可能因疾病类型、治疗方案和研究设计的不同而异,因此在进行临床试验时,研究人员需要仔细阅读研究协议和相关文献,遵循相应的评估标准。

Response Evaluation Criteria in Solid Tumors (RECIST)Eligibility∙Only patients with measurable disease at baseline should be included in protocols where objective tumor response is the primary endpoint.Measurable disease - the presence of at least one measurable lesion. If the measurable disease is restricted to a solitary lesion, its neoplastic nature should be confirmed by cytology/histology.Measurable lesions - lesions that can be accurately measured in at least one dimension with longest diameter ≥20 mm using conventional techniques or ≥10 mm with spiral CT scan.Non-measurable lesions- all other lesions, including small lesions (longest diameter <20 mm with conventional techniques or <10 mm with spiral CT scan), i.e., bone lesions, leptomeningeal disease, ascites, pleural/pericardial effusion, inflammatory breast disease, lymphangitis cutis/pulmonis, cystic lesions, and also abdominal masses that are not confirmed and followed by imaging techniques; and.∙All measurements should be taken and recorded in metric notation, using a ruler or calipers. All baseline evaluations should be performed as closely as possible to the beginning of treatment and never more than 4 weeks before the beginning of the treatment.∙The same method of assessment and the same technique should be used to characterize each identified and reported lesion at baseline and during follow-up.∙Clinical lesions will only be considered measurable when they are superficial (e.g., skin nodules and palpable lymph nodes). For the case of skin lesions, documentation by color photography, including a ruler to estimate the size of the lesion, is recommended.Methods of Measurement –∙CT and MRI are the best currently available and reproducible methods to measure target lesions selected fo r response assessment. Conventional CT and MRI should be performed with cuts of 10 mm or less in slicethickness contiguously. Spiral CT should be performed using a 5 mm contiguous reconstruction algorithm.This applies to tumors of the chest, abdomen and pelvis. Head and neck tumors and those of extremities usually require specific protocols.∙Lesions on chest X-ray are acceptable as measurable lesions when they are clearly defined and surrounded by aerated lung. However, CT is preferable.∙When the primary endpoint of the study is objective response evaluation, ultrasound (US) should not be used to measure tumor lesions. It is, however, a possible alternative to clinical measurements of superficial palpable lymph nodes, subcutaneous lesions and thyroid nodules. US might also be useful to confirm the completedisappearance of superficial lesions usually assessed by clinical examination.∙The utilization of endoscopy and laparoscopy for objective tumor evaluation has not yet been fully and widely validated. Their uses in this specific context require sophisticated equipment and a high level of expertise that may only be available in some centers. Therefore, the utilization of such techniques for objective tumorresponse should be restricted to validation purposes in specialized centers. However, such techniques can be useful in confirming complete pathological response when biopsies are obtained.∙Tumor markers alone cannot be used to assess response. If markers are initially above the upper normal limit, they must normalize for a patient to be considered in complete clinical response when all lesions havedisappeared.∙Cytology and histology can be used to differentiate between PR and CR in rare cases (e.g., after treatment to differentiate between residual benign lesions and residual malignant lesions in tumor types such as germ celltumors).Baseline documentation of “Target” and “Non-Target” lesions∙All measurable lesions up to a maximum of five lesions per organ and 10 lesions in total, representative of all involved organs should be identified as target lesions and recorded and measured at baseline.∙Target lesions should be selected on the basis of their size (lesions with the longest diameter) and their suitability for accurate repeated measurements (either by imaging techniques or clinically).∙ A sum of the longest diameter (LD) for all target lesions will be calculated and reported as the baseline sum LD.The baseline sum LD will be used as reference by which to characterize the objective tumor.∙All other lesions (or sites of disease) should be identified as non-target lesions and should also be recorded at baseline. Measurements of these lesions are not required, but the presence or absence of each should be noted throughout follow-up.Response CriteriaEvaluation of target lesions* Complete Response (CR): Disappearance of all target lesions* Partial Response (PR): At least a 30% decrease in the sum of the LD of target lesions, taking as reference thebaseline sum LD* Progressive Disease (PD): At least a 20% increase in the sum of the LD of target lesions, taking as reference thesmallest sum LD recorded since the treatment started or the appearance of one ormore new lesions* Stable Disease (SD): Neither sufficient shrinkage to qualify for PR nor sufficient increase to qualify for PD,taking as reference the smallest sum LD since the treatment startedEvaluation of non-target lesions* Complete Response (CR): Disappearance of all non-target lesions and normalization of tumor marker level* Incomplete Response/ Stable Disease (SD): Persistence of one or more non-target lesion(s) or/and maintenance of tumor marker level above the normal limits* Progressive Disease (PD): Appearance of one or more new lesions and/or unequivocal progres sion of existingnon-target lesions (1)(1)Although a clear progression of “non target” lesions only is exceptional, in such circumstances,the opinion of the treating physician should prevail and the progression status should be confirmed later on by the review panel (or study chair).Evaluation of best overall responseThe best overall response is the best response recorded from the start of the treatment until disease progression/recurrence (taking as reference for PD the smallest measurements recorded s ince the treatment started). In general, the patient's best response assignment will depend on the achievement of both measurement and confirmation criteriaCR CR No CRCR Incomplete response/SD No PRPR Non-PD No PRSD Non-PD No SDPD Any Yes or No PDAny PD Yes or No PDAny Any Yes PD∙Patients with a global deterioration of health status requiring discontinuation of treatment without objective evidence of disease progression at that time should be classified as having “symptomatic deterioration”. Every effort should be made to document the objective progression even after discontinuation of treatment.∙In some circumstances it may be difficult to distinguish residual disease from nor mal tissue. When the evaluation of complete response depends on this determination, it is recommended that the residual lesion be investigated (fine needle aspirate/biopsy) to confirm the complete response status.Confirmation∙The main goal of confirmation of objective response is to avoid overestimating the response rate observed. In cases where confirmation of response is not feasible, it should be made clear when reporting the outcome of such studies that the responses are not confirmed.∙To be assigned a status of PR or CR, changes in tumor measurements must be confirmed by repeat assessments that should be performed no less than 4 weeks after the criteria for response are first met. Longer intervals as determined by the study protocol may also be appropriate.∙In the case of SD, follow-up measurements must have met the SD criteria at least once after study entry at a minimum interval (in general, not less than 6-8 weeks) that is defined in the study protocolDuration of overall response∙The duration of overall response is measured from the time measurement criteria are met for CR or PR (whichever status is recorded first) until the first date that recurrence or PD is objectively documented, taking as reference for PD the smallest measurements recorded s ince the treatment started.Duration of stable disease∙SD is measured from the start of the treatment until the criteria for disease progression are met, taking as reference the smallest measurements recorded since the treatment started.∙The clinical relevance of the duration of SD varies for different tumor types and grades. Therefore, it is highly recommended that the protocol specify the minimal time interval required between two measurements for determination of SD. This time interval should take into account the expected clinical benefit that such a status may bring to the population under study.Response review∙For trials where the response rate is the primary endpoint it is strongly recommended that all responses be reviewed by an expert(s) indepen dent of the study at the study’s completion. Simultaneous review of the patients’ files and radiological images is the best approach.Reporting of results∙All patients included in the study must be assessed for response to treatment, even if there are ma jor protocol treatment deviations or if they are ineligible. Each patient will be assigned one of the following categories: 1) complete response, 2) partial response, 3) stable disease, 4) progressive disease, 5) early death from malignant disease, 6) early death from toxicity, 7) early death because of other cause, or 9) unknown (not assessable, insufficient data).∙All of the patients who met the eligibility criteria should be included in the main analysis of the response rate.Patients in response categories 4-9 should be considered as failing to respond to treatment (disease progression).Thus, an incorrect treatment schedule or drug administration does not result in exclusion from the analysis of the response rate. Precise definitions for categories 4-9 will be protocol specific.∙All conclusions should be based on all eligible patients.∙Subanalyses may then be performed on the basis of a subset of patients, excluding those for whom major protocol deviations have been identified (e.g., early death due to other reasons, early discontinuation of treatment, major protocol violations, etc.). However, these subanalyses may not serve as the basi s for drawing conclusions concerning treatment efficacy, and the reasons for excluding patients from the analysis s hould be clearly reported.∙The 95% confidence intervals should be provided.。
New response evaluation criteria in solid tumours: Revised RECIST guideline (version 1.1)新版实体瘤疗效评价标准:修订的RECIST指南(1.1版本)Abstract摘要Background背景介绍Assessment of the change in tumour burden is an important feature of the clinical evaluation of cancer therapeutics: both tumour shrinkage (objective response) and disease progression are useful endpoints in clinical trials. Since RECIST was published in 2000, many investigators, cooperative groups, industry and government authorities have adopted these criteria in the assessment of treatment outcomes. However, a number of questions and issues have arisen which have led to the development of a revised RECIST guideline (version 1.1). Evidence for changes, summarised in separate papers in this special issue, has come from assessment of a large data warehouse (>6500 patients), simulation studies and literature reviews.临床上评价肿瘤治疗效果最重要的一点就是对肿瘤负荷变化的评估:瘤体皱缩(目标疗效)和病情恶化在临床试验中都是有意义的判断终点。

肿瘤评估标准recist1.1测试题全文共四篇示例,供您参考第一篇示例:肿瘤评估是肿瘤医学领域的重要课题之一,而RECIST1.1则是肿瘤评估标准中的一种常用方法。
RECIST的全称是Response Evaluation Criteria in Solid Tumors,即实体肿瘤反应评估标准。
它是一种针对实体肿瘤治疗效果进行评估的标准,广泛应用于临床研究和临床实践中。
RECIST1.1版本是对之前版本的修订和更新,旨在更准确和客观地评估肿瘤治疗效果,对肿瘤医学研究和临床实践具有重要意义。
一、选择题1. RECIST1.1标准中,对肿瘤测量的要求是:A. 单纯依靠CT检查B. 采用最大短径测量方法C. 用MRI检查为主D. 只针对肺部肿瘤2. 在RECIST1.1标准中,肿瘤反应的评估包括哪几种情况?A. 完全缓解B. 部分缓解C. 稳定疾病D. 全身性恶化3. 对于深部肿瘤的测量,RECIST1.1标准中推荐的检查方式是:A. CT检查B. MRI检查C. 超声检查D. PET检查4. 根据RECIST1.1标准,部分缓解的定义是指肿瘤总体直径缩小了:A. <30%B. ≥30%且<50%C. ≥50%且<70%D. ≥70%5. 对于RECIST1.1标准的适用范围,以下哪项描述是正确的?A. 仅适用于固实肿瘤B. 适用于所有类型的肿瘤C. 仅适用于表浅肿瘤D. 适用于深部和表浅的所有肿瘤二、判断题判断下列叙述是否符合RECIST1.1标准的要求,符合的请打“√”,不符合的请打“×”。
1. ()RECIST1.1标准只适用于实体肿瘤的导管造影诊断,不适用于其他形式的影像检查。
2. ()RECIST1.1标准的测量结果应该以肿瘤某一病灶的最大直径为准。
3. ()在RECIST1.1标准中,完全缓解是指所有的肿瘤病灶均消失,持续4周以上。
4. ()RECIST1.1标准中,对肿瘤的测量不包括长径和短径。

实体瘤的疗效评价标准(RECIST 1.0 )( Response Evaluation Criteria in Solid Tumors,RECIST )一.基本概念:只有那些在基准状态下有可测量病灶的肿瘤患者才可以被选择进入试验,这些患者的肿瘤治疗疗效做为临床试验的主要研究目的。
1.可测量病灶——至少在一个径线上可以精确测量的病灶(纪录为最大直径)。
常规检测条件下肿瘤最大径应≥20mm,螺旋CT检测时肿瘤最大径应≥10mm。
2.不可测量病灶——其他病变,包括小病灶(常规检测条件下最大径小于20mm,或螺旋CT检测时最大径小于10mm)和真正不可测量病灶。
3.真正不能测量的病灶——包括以下情况:骨骼病变、软脑膜病变、腹水、胸腔/心包腔积液、炎性乳癌、皮肤/肺淋巴管炎、未被证实或不能被影像学随访的腹部包块、囊性病变。
所有的测量数据使用标尺或卡尺测量并记录,记录结果用公制米制表示。
所有的基准测量应该尽可能在接近治疗开始前完成,绝对不允许在早于治疗开始前4周完成。
4.靶病灶——如果一个器官内可测量病灶加起来多达5个或全身共有10个(要求描述累及器官),所有这些可测量病灶均应视为靶病灶,(最新版要求最多5个可测量病灶)并在基线状态进行测量和纪录。
靶病灶的选择要根据病灶大小(有可测量的最大径)和病灶是否适合准确的重复测定(临床或影像学)。
5.非靶病灶——所有其它病灶(或病变部位)视为非靶病灶,并在基线状态时纪录,但不要求对这些病变进行测量,只需在随访全过程纪录它们是存在或是消失。
二.具体测量方法和手段:对于每一个确定的和报告的病灶, 基线状态和随访时均应采取同样的测量技术和评估方法。
如果影像学方法和临床检查同时用来评价抗肿瘤疗效,前者优于后者。
1.临床检查只有当病灶位于表浅部位时(皮肤结节和可摸到的淋巴结),临床检测到的病变才能认为是可测量的。
对皮肤病灶而言,推荐使用彩色照片来纪录存档,照片中应有比例尺来用来测量病灶大小。

recist标准RECISt标准。
RECISt标准是一种用于评估肿瘤治疗疗效的标准,全称为Response Evaluation Criteria in Solid Tumors。
它是一种用于临床试验中对肿瘤治疗效果进行评估的标准,包括肿瘤的缩小、稳定或增大等情况。
RECISt标准的制定旨在提高肿瘤治疗效果的评估标准化和统一性,从而为临床试验结果的可比性和可信度提供保障。
RECISt标准的核心内容包括对肿瘤疗效的评估标准和评估方法。
在对肿瘤疗效的评估标准上,RECISt标准将肿瘤的治疗效果分为完全缩小、部分缩小、稳定和进展四个等级,从而对肿瘤治疗效果进行了明确的定义和分类。
在评估方法上,RECISt标准规定了肿瘤治疗效果的评估时间点、评估方法和评估指标,从而确保了对肿瘤治疗效果的评估过程的科学性和可操作性。
RECISt标准的应用范围涵盖了临床试验和临床实践两个方面。
在临床试验中,RECISt标准作为肿瘤治疗效果评估的金标准,被广泛应用于临床试验的设计、执行和结果解读中,从而确保了临床试验结果的科学性和可比性。
在临床实践中,RECISt标准作为肿瘤治疗效果评估的指导原则,被广泛应用于临床医生对肿瘤治疗效果的评估和决策中,从而确保了临床医生对肿瘤治疗效果的客观性和准确性。
RECISt标准的制定和应用离不开临床试验和临床实践的支持和推动。
在临床试验中,RECISt标准的制定需要充分考虑临床试验的特点和需求,从而确保RECISt标准与临床试验的结合紧密和协调。
在临床实践中,RECISt标准的应用需要充分考虑临床医生的实际需求和操作习惯,从而确保RECISt标准与临床实践的结合灵活和便捷。
总之,RECISt标准作为一种用于评估肿瘤治疗疗效的标准,在临床试验和临床实践中发挥着重要作用。
它的制定和应用不仅提高了肿瘤治疗效果评估的标准化和统一性,也为临床试验结果的可比性和可信度提供了保障。
希望RECISt标准能够在未来的临床试验和临床实践中得到更广泛的应用和推广,为肿瘤治疗效果的评估提供更科学、更准确的指导。
recist pd定义RECIST PD定义RECIST PD(Response Evaluation Criteria in Solid Tumors for Progressive Disease)是一种用于评估固体肿瘤患者疾病进展的标准。
该标准主要针对以CT(计算机断层扫描)或MRI(磁共振成像)为依据的影像学检查结果进行评估。
RECIST PD标准的目的是确定患者是否存在肿瘤进展,以帮助医生调整治疗方案或决定进行其他治疗策略。
它通常在肿瘤治疗的临床试验中使用,并且已被广泛认可和采用。
根据RECIST PD标准,肿瘤的进展被定义为目标病灶的直径增加,以及新出现或增大的非靶病灶的出现。
目标病灶是指在早期评估中被确定为需要监测的特定病灶或病变。
每个病灶的直径都要进行测量,并与基线开始治疗前的测量结果进行比较。
对于RECIST PD的评估,需要至少两个时间点的影像学检查结果。
如果目标病灶的直径增加了20%以上,或新的病灶出现,就可以判定为肿瘤进展。
此外,还要排除其他原因导致的直径增加,例如肿瘤坏死、炎症反应或出血等。
需要注意的是,RECIST PD标准只适用于固体肿瘤评估,并且在其他类型的肿瘤(如白血病或淋巴瘤)中并不适用。
此外,该标准还有一些局限性,例如忽视了肿瘤的生物学特征和复杂的异质性。
因此,在临床实践中,医生通常会综合考虑多种因素进行综合评估,包括病人的症状、体格检查和其他相关检查结果。
RECIST PD是一种常用的评估固体肿瘤患者疾病进展的标准。
它是基于影像学检查来判断肿瘤的发展情况,有助于指导治疗决策和监测患者的疗效。
在临床实践中,医生还会综合考虑其他因素来做出综合评估。
肿瘤治疗疗效评价标准(RICIST)目前采用RICIST(Response evaluation criteria in solid tumors RECIST,NCI,2000)标准:患者必须具有可测量病灶作为判定客观疗效的起始依据,准确测量至少有一个最长径以常用方法≥20mm,或螺旋CT测量≥10mm,以上测量数据距开始治疗时间不应超过4周,判效时必须以同样测量方法评估,如治疗前用CT测量病灶大小,治疗完成后仍用CT测量。
在具体测量病灶时取最长径(longest diameter, LD),如果有多个病灶应测每个病灶LD,相加为所有病灶的总合,以此为治疗前的数据,与治疗完成后测的LD之和相比,得出缩小百分率。
完全缓解(complete response, CR):所有病灶完全消失。
部分缓解(partial response, PR):可测病灶(LD的总和)缩小程度为30%以上。
疾病稳定(stable disease, SD):未达到PR(缩小30%)又未增大到PD(>20%)的标准。
疾病进展(progressⅣe disease, PD):病灶LD总和至少增大20%以上,或出现一个或一个以上的新发病灶。
CR,PR,SD均不得出现新发病灶。
对于评定为PR或CR者,不少于4周后进行病灶测量变化的确认,方法与判效时相同,未确认者不能作为有效病例,应予删除。
肿瘤临床实验常用缩写肿瘤临床实验(Clinical Trials in Oncology)是评估新型药物、治疗方法或其他干预措施对患者的疗效和安全性的系统研究。
为了便于沟通和交流,临床实验中常使用缩写来简化术语,提高效率。
本文将介绍一些肿瘤临床实验常用的缩写以及其含义。
I. 常用缩写列表:1. CT:Clinical Trial. 临床试验。
2. RCT:Randomized Controlled Trial. 随机对照试验。
3. PFS:Progression-Free Survival. 无进展生存期。
4. OS:Overall Survival. 总体生存期。
5. CR:Complete Response. 完全缓解。
6. PR:Partial Response. 部分缓解。
7. ORR:Overall Response Rate. 总体缓解率。
8. AE:Adverse Event. 不良事件。
9. DLT:Dose-Limiting Toxicity. 剂量限制性毒性。
10. TTP:Time to Progression. 进展时间。
11. QoL:Quality of Life. 生活质量。
12. ECOG:Eastern Cooperative Oncology Group. 东部合作肿瘤研究组。
13. GCP:Good Clinical Practice. 良好临床实践。
14. RECIST:Response Evaluation Criteria in Solid Tumors. 固实瘤疗效评价标准。
II. 缩写解析:1. CT:Clinical Trial临床试验是为了评估新型治疗方法在人体中的疗效和安全性而进行的研究。
临床试验可以分为多个阶段,从最初的药理学实验,到小规模的I期试验,然后是较大规模的II期试验和III期试验,最终是将成果应用到实际临床的IV期试验。
临床试验的结果对于改善肿瘤患者的治疗效果具有重要意义。
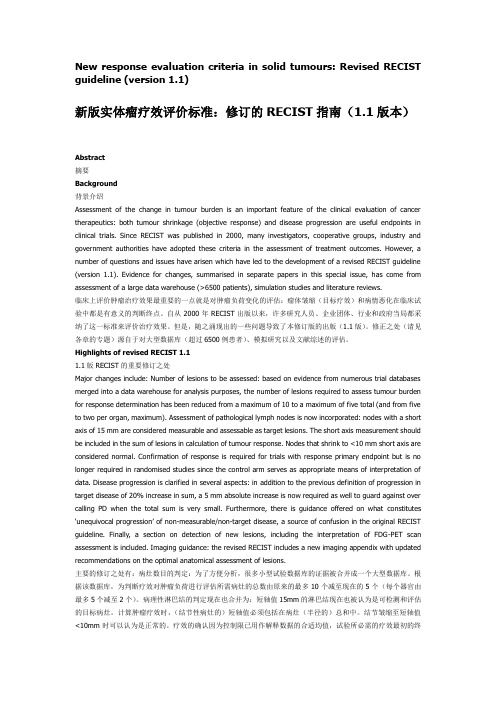
RECIST has subsequently been widely accepted as a standardized measure of tu-mor response, especially in clinical trials where the primary end points are objective response or time to progression [2]. Howev-er, with rapid technical innovations in imag-ing techniques, such as MDCT and PET/CT, over the past decade, the limitations of the original RECIST and the need for revision have become clear [2, 3].In January 2009, a revised RECIST guide-line (version 1.1) was published by the RECIST Working Group, based in part on the investi-gations using the database consisting of more than 6,500 patients with more than 18,000 target lesions [2, 4–6]. Major imaging-relat-ed changes in RECIST 1.1 included a reduc-tion in the number of lesions to be assessed, from a maximum of 10 to a maximum of five and from five per organ to two per organ;New Response Evaluation Criteria in Solid Tumors (RECIST) Guidelines for Advanced Non –Small Cell Lung Cancer: Comparison With Original RECIST and Impact on Assessment of Tumor Response to Targeted TherapyMizuki Nishino 1David M. Jackman 2Hiroto Hatabu 3Beow Y. Yeap 4Leigh-Anne Cioffredi 2Jeffrey T. Yap 1Pasi A. Jänne 2Bruce E. Johnson 2Annick D. Van den Abbeele 11Department of Radiology, Dana-Farber Cancer Institute, 44 Binney St., Boston, MA 02116. Address correspon-dence to M. Nishino (Mizuki_Nishino@).2Department of Medical Oncology, Dana-Farber Cancer Institute and Brigham and Women’s Hospital, Boston, MA.3Department of Radiology, Brigham and Women’s Hospital, Boston, MA.4Department of Medicine, Massachusetts General Hospital, Boston, MA.Ca rdiopulmona r y Imaging • Or igina l Resea rchWEBThis is a Web exclusive article.AJR 2010; 195:W221–W2280361–803X/10/1953–W221© American Roentgen Ray SocietyObjective assessment of the change in tumor burden is important for evaluating the tumor response to anticancer drugs as a surrogate forsymptomatic response, and objective response has been shown to be closely correlated with prolonged survival with solid tumors. The Re-sponse Evaluation Criteria in Solid Tumors (RECIST) guideline was introduced in 2000 by an international working group to standard-ize and simplify tumor response criteria [1]. The key features of the original RECIST (ver-sion 1.0) included definitions of minimum CT size of measurable lesions, instructions on how many lesions to follow (up to 10, with a maximum of five per organ), and the use of unidimensional CT measures for overall evaluation of tumor burden [1, 2]. RECIST supplanted the bidimensional tumor size as-sessment that had been in common use.Keywords: CT, lung cancer, PET/CT, Response Evaluation Criteria in Solid Tumors (RECIST), tumor measurement DOI:10.2214/AJR.09.3928Received November 6, 2009; accepted after revision January 30, 2010.The authors received support from Agfa HealthCare (2009–2010 RSNA Research Scholar Grant toM. Nishino); the National Institutes of Health (grant 5R21CA11627-02 to H. Hatabu and grant 1RO-1CA114465-01 to B. Y. Yeap, P. A. Jänne, andB. E. Johnson); the National Cancer Institute Specialized Program of Research Excellence in Lung Cancer (grant 2P50CA090578-06 to B. Y. Yeap, P. A. Jänne, and B. E. Johnson); Genentech, Inc.; and the Doris and William Krupp Research Fund in Thoracic Oncology.OBJECTIVE. The purpose of this article is to compare the recently published revised Response Evaluation Criteria in Solid Tumors (RECIST) guidelines (version 1.1) to the original guidelines (RECIST 1.0) for advanced non–small cell lung cancer (NSCLC) after erlotinib therapy and to evaluate the impact of the new CT tumor measurement guideline on response assessment.MATERIALS AND METHODS. Forty-three chemotherapy-naive patients with ad-vanced NSCLC treated with erlotinib in a single-arm phase 2 multicenter open-label clini-cal trial were retrospectively studied. CT tumor measurement records using RECIST 1.0 that were generated as part of the prospective clinical trial were reviewed. A second set of CT tu-mor measurements was generated from the records to meet RECIST 1.1 guidelines. The num-ber of target lesions, best response, and time to progression were compared between RECIST 1.1 and RECIST 1.0.RESULTS. The number of target lesions according to RECIST 1.1 decreased in 22 pa-tients (51%) and did not change in 21 patients (49%) compared with the number according to RECIST 1.0 (p < 0.0001, paired Student’s t test). Almost perfect agreement was observed be-tween best responses using RECIST 1.1 and RECIST 1.0 (weighted κ = 0.905). Two patients with stable disease according to RECIST 1.0 had progressive disease according to RECIST 1.1 criteria because of new lesions found on PET/CT. There was no significant difference in time to progression between RECIST 1.1 and RECIST 1.0 (p = 1.000, sign test).CONCLUSION. RECIST 1.1 provided almost perfect agreement in response assess-ment after erlotinib therapy compared with RECIST 1.0. Assessment with PET/CT was a major factor that influenced the difference in best response assessment between RECIST 1.1 and RECIST 1.0.Nishino et al.assessment of lymph node size (lesions ≥ 15 mm in the short axis are considered measur-able and assessable as target lesions, and the short-axis measurement should be included in the sum of lesions in calculation of the tu-mor response); clarification of disease pro-gression (in addition to the previous defini-tion of progression in target disease of 20% increase in sum, a 5-mm absolute increase is now required); and inclusion of FDG PET assessment exclusively in the section on de-tection of new lesions [2] (Table 1).It is anticipated that the new guideline im-proves feasibility and provides more accu-rate assessment of tumor response and time to progression while incorporating the cur-rent state-of-art imaging in the clinical on-cologic practice. However, it remains to be seen how RECIST 1.1 will affect the selec-tion and the CT measurement of the target le-sions, assessment of tumor response to ther-apy, and time to progression compared with RECIST 1.0.Lung cancer is a leading cause of cancer death in the United States and worldwide, accounting for over 150,000 deaths per year in the United States [7]. Eighty-five percent of subjects have non–small cell lung can-cer (NSCLC), for which the 5-year surviv-al rate is only 15% [7]. Newer therapeutic agents have been clinically applied for lung cancer, including erlotinib, an inhibitor of the tyrosine kinase domain of the epidermal growth factor receptor [8–10]. Erlotinib can be associated with dramatic clinical response in patients with epidermal growth factor re-ceptor mutations. However, patients with aninitial response to erlotinib eventually havea relapse due to development of acquired re-sistance [11–13]. With the emerging preclini-cal understanding of the mechanisms of erlo-tinib resistance, new therapies targeting thesemechanisms are being developed. Therefore,the accurate CT tumor measurement and re-sponse assessment in advanced NSCLC treat-ed with targeted therapy are critically im-portant to determine the timing to adjust thetherapeutic regimen for further prolongationof survival.The purpose of this study is to compare CTtumor measurement and tumor response as-sessment based on RECIST 1.1 versus RECIST1.0 in a phase 2 clinical trial of patients with ad-vanced NSCLC treated with erlotinib.Materials and MethodsPatients and TreatmentThe original clinical trial was already per-formed with 80 eligible patients [14]. The studywas approved by the Dana-Farber/Harvard Can-cer Center institutional review board. Of 80 pa-tients, complete CT tumor measurement recordswere available for 43 patients. Therefore, the studypopulation of the current study consisted of 43 pa-tients (22 men and 21 women; mean age, 77 years;range, 70–91 years) with histologically confirmedstage IIIB/IV NSCLC that had not been treatedwith chemotherapy. Patients enrolled in this phase2 multicenter open-label study were treated with150 mg of erlotinib by mouth each day as part offirst-line therapy between March 2003 and May2005 [14]. Thirty-nine patients were treated at theDana-Farber Cancer Institute, and four patientswere treated at the Massachusetts General Hospi-tal. All patients gave written informed consent. Pa-tients were treated without interruption until dis-ease progression, severe or intolerable toxicity, orwithdrawal of consent. Compliance was checkedafter each 28-day cycle with a treatment diary.CT ExaminationsCT scans of the chest were obtained at baselineand at every two cycles (8 weeks) of therapy todetermine response to erlotinib or progression ofdisease. Each clinical trial site used their standardclinical chest CT protocol with iodinated IV con-trast agent unless medically contraindicated. Theprotocol at the Dana-Farber Cancer Institute wasas follows: a 4-MDCT scanner (Volume Zoom,Siemens Healthcare) was used. Patients werescanned in the supine position from the cranialto caudal direction from the clavicles to the adre-nal glands at end-inspiration. One hundred micro-liters of iopromide (300 mg I/mL; Ultra v ist 300,Bayer HealthCare Pharmaceuticals) was injectedIV with an automated injector (Stellant, Medrad)at a rate of 2–3 mL/s, with a scan delay of 30 sec-onds. Axial images (5 or 7 mm thickness) werereconstructed using standard and lung algorithmsand were transferred to the PACS.CT Tumor Measurement and Assessmentof Tumor Response to TherapyCT tumor measurement was prospectively per-formed by attending radiologists at Dana-FarberCancer Institute and was recorded at the baselineand at every follow-up CT examination accordingto the original RECIST 1.0 criteria as a part of theongoing phase 2 clinical trial [14]. The longest di-ameter of each target lesion was manually mea-sured by radiologists on an axial CT image planeusing calipers of a measurement tool on PACS.The CT tumor measurement record included thenumber of the treatment cycle, the date of assess-ment, the clinical site where imaging was per-formed, the method of imaging, the target lesiondescription and CT size measurement, the sum ofthe longest tumor diameters of target lesions, de-scriptions of nontarget lesions, the presence or ab-sence of new lesions, the overall response for eachimaging study, and the best response and time toprogression for each patient.The results of the RECIST 1.0 CT measurementsfor the completed clinical trial were retrospectivelyreviewed by a board-certified thoracic radiologistwho was blinded to the patients’ outcome, to gen-erate a second set of CT tumor measurements thatmeet the RECIST 1.1 guideline. Briefly, the tar-TABLE 1: Summary of Major Changes in Response Evaluation Criteria in Solid Tumors (RECIST) 1.1 Compared With RECIST 1.0 RECIST Guideline RECIST 1.1RECIST 1.0No. of target lesions Up to 2 per organ; up to 5 in total Up to 5 per organ; up to 10 in total Assessment of lymph nodes Short-axis measurements should beused and recorded; ≥ 15 mm, targetlesions; ≥ 10 mm but < 15 mm,nontarget lesions; < 10 mm,nonpathologicalNo clear guideline providedClarification of disease progression 20% increase in the sum of targetlesions and 5-mm absoluteincrease are required20% increase in the sum oftarget lesions (no minimumabsolute size increase isrequired)FDG PET scan Included only in the detection of newlesions aNot includeda New lesions on the basis of FDG PET can be identified according to the following algorithm [2]: a negative FDG PET at baseline with a positive FDG PET at follow-up is a sign of progressive disease based on a new lesion. For no FDG PET at baseline and a positive FDG PET at follow-up, if the positive FDG PET at follow-up corresponds to a new site of disease confirmed by CT, this is progressive disease. If the positive FDG PET at follow-up is not confirmed as a new site of disease on CT, additional follow-up CT scans are needed to determine whether there is truly progression occurring at that site. If the positive FDG PET at follow-up corresponds to a preexisting site of disease on CT that is not progressing on the basis of the anatomic images, this is not progressive disease.Revised RECIST Guidelines for Lung Cancerget lesions recorded in the original measurements were reassessed if they met the criteria of RECIST 1.1: lymph nodes less than 15 mm in the short axis were excluded from target lesions; when the num-ber of target lesions exceeded the limits according to RECIST 1.1 (up to five in total and up to two per organ), smaller lesions were eliminated from tar-get lesions; short-axis measurements were used for lymph nodes instead of long-axis measurements; and the PET/CT clinical reports were also reviewed for the patients who underwent PET/CT during the treatment to determine whether any new lesion was detected on PET/CT meeting the RECIST 1.1 criteria for progression. The number of RECIST 1.1 target lesions and the sums of tumor diameters at baseline and follow-up was calculated and re-corded. The percentage change in the sum of tu-mor diameters of target lesions was calculated and recorded at every two cycles of therapy. Tumor re-sponse to therapy was reassessed using the revised RECIST 1.1 for each CT measurement, and best re-sponse for each patient was assigned.Time to progression and survival were calcu-lated from the date of enrollment to the date of progression, using RECIST 1.1 and RECIST 1.0, or to the time of death, respectively. Time to pro-gression was censored (i.e., losses from the sam-ple before the observation of the final outcome were taken into account) if an end point was not reached by the time of last follow-up, or if a pa-tient was lost to follow-up, or if it was not possible to determine the date of progression according to RECIST 1.1. Time to progression was estimated using the Kaplan-Meier method [15].To assess interobserver variability, a new set of CT tumor measurements was obtained on the baseline CT scans of 39 patients treated at the Da-na-Farber Cancer Institute using RECIST 1.0 and RECIST 1.1 by a board-certified thoracic radiolo-gist. Of 43 patients, four were treated at an outsideinstitution, and their CT scans were not availablefor this component of the study. The CT measure-ment was performed using a measurement tool onPACS workstation (Centricity, GE Healthcare).The sum of the longest diameters of the target le-sions measured by this observer using RECIST1.0 and RECIST 1.1 were compared with the CTmeasurements obtained during the clinical trialusing RECIST 1.0 and RECIST 1.1, respectively.The CT measurement performed during the clini-cal trial (measurement 1) and that performed bythe observer in the present study (measurement2) were compared using Pearson’s correlation andlinear regression. Agreement in the two CT mea-surements was shown visually using Bland-Alt-man plots with 95% limits of agreement [16, 17].Statistical AnalysisA paired Student’s t test was used to assess thestatistical significance of changes in the numberof target lesions and the sum of lesion diametersat baseline between RECIST 1.1 and RECIST1.0. The baseline CT measurements by RECIST1.1 versus RECIST 1.0 as well as the percentagechanges in follow-up CT measurements relative tobaseline were compared using Pearson’s correla-tion and linear regression.The level of agreement between best responsesby RECIST 1.1 versus RECIST 1.0 was assessed us-ing a weighted kappa analysis based on the absolutedifference of equally spaced scores. Agreement be-tween the two assessments was categorized as poor(weighted κ < 0), slight (weighted κ = 0–0.20), fair(weighted κ = 0.21–0.40), moderate (weighted κ =0.41–0.60), substantial (weighted κ= 0.61–0.80),and almost perfect (weighted κ > 0.80) [18].Time to progression according to RECIST 1.1versus RECIST 1.0 was compared using a signtest. All p values are based on a two-sided hypoth-esis. A p value of less than 0.05 was considered tobe significant.ResultsThe number of target lesions using RECIST1.1 was significantly lower than that usingRECIST 1.0 (p < 0.0001, paired Student’s ttest), with a decrease in the lesion number in22 patients (51%) and no change in the re-maining 21 patients (49%) (Fig. 1). The num-ber of target lesions according to RECIST 1.0ranged from one to nine (mean, 2.7; median,2; mode, 2), whereas the number of target le-sions according to RECIST 1.1 ranged fromzero to five (mean, 1.8; median, 2; mode, 1).The number of target lesions according toRECIST 1.1 was decreased by one in 15 pa-tients, by two in two patients, by three in twopatients, and by four in three patients, witha mean decrease of 0.86. The number of thetarget lesions was decreased as a result of thenew definition of measurability of malignantlymph nodes at the baseline (a lymph nodemust be 15 mm in the short axis to be consid-ered pathologically enlarged and measurable[2]), for 18 patients, and as a result of the re-duction of the number of lesions required toassess tumor burden (from a maximum of 10to a maximum of five total, and from five totwo per organ, maximum), for four patients.There were three patients who had no targetlesions when RECIST 1.1 was used. In thesepatients, all the target lesions according toRECIST 1.0 were lymph nodes smaller than1.5 cm in the short axis and did not meet theRECIST 1.1 criteria for a target lesion.Comparison of the sum of tumor diam-eters of target lesions on baseline CT mea-surements by RECIST 1.1 and by RECIST1.0 is shown in Figure 2A. A high correlationwas noted between the baseline CT measure-ments by RECIST 1.1 and RECIST 1.0 (r =0.936 and r2 = 0.876, Pearson’s correlation).The baseline CT measurement using RECIST1.1 was significantly smaller than that us-ing RECIST 1.0, with a mean difference of−1.6 cm and a regression slope of 0.73 (p =0.0001, paired Student’s t test). The distribu-tion of the differences between baseline CTmeasurements by RECIST 1.0 and by RECIST1.1 is shown in Figure 2B.The percentage changes between RECIST1.1 and RECIST 1.0 in the sum of tumor diam-eters of target lesions showed a high correlation(r = 0.986 and r2 = 0.972 at cycle 2 [n = 28]; r =0.998 and r2 = 0.996 at cycle 4 [n = 7]; r = 0.657and r2 = 0.432 at cycle 6 [n = 5]; r = 0.949 andFig. 1—Number of target lesions according to Response Evaluation Criteria in Solid Tumors (RECIST) 1.1 versus that according to RECIST 1.0. Number of target lesions calculated using RECIST 1.1 was significantly lower than that calculated using RECIST 1.0 (p < 0.0001, paired Student’s t test).Nishino et al.r2 = 0.901 at cycle 8 [n = 4]; r = not applicable and r2 = not applicable at cycle 10, [n = 1]; and r = 0.979 and r2 = 0.959 at cycles 2–10 [n = 45], Pearson’s correlation) (Figs. 3 and 4). One pa-tient showed discrepant response assessment based on the percentage change in the sum of tumor diameters of target lesions according to RECIST 1.1 and RECIST 1.0 after the first two cycles of therapy (stable disease according to RECIST 1.1 and progressive disease according to RECIST 1.0; circle in Figure 3, asterisk in Figure 4). However, coincidently the patient also had a new lesion on CT performed at two cycles of therapy. Therefore, the overall re-sponse assessment of this patient at two cycles of therapy was progressive disease by both RECIST 1.1 and RECIST 1.0, resulting in thesame best response and time to progression byRECIST 1.1 and by RECIST 1.0.Of 43 patients, the best response accordingto RECIST 1.1 was the same as the best re-sponse according to RECIST 1.0 in 40 patients(93%) and was different in three patients (7%).Almost perfect agreement was observed be-tween the best response according to RECIST 1.1versus the best response according to RECIST1.0 (weighted κ = 0.905) (Table 2). Amongthree patients with differences in best responseaccording to RECIST 1.1 and RECIST 1.0,two patients had stable disease based onRECIST 1.0 but had progressive disease ac-cording to RECIST 1.1 because of new lesionsnoted on PET/CT. The other patient had pro-gressive disease using RECIST 1.0 but was as-sessed as stable disease according to RECIST1.1 because of a new lesion by RECIST 1.0 thatwas a lymph node measuring less than 10 mmin the short axis, which does not meet the newcriteria of pathologic lymph node by RECIST1.1. This patient was removed from the clin-ical trial and the erlotinib therapy when pro-gressive disease was determined on the basisof RECIST 1.0, whereas the patient could havecontinued the erlotinib therapy if RECIST 1.1were used for assessment.Of 43 patients, only six (14%) underwentPET/CT during the course of the treatment.Of these six patients, four had no findings onPET/CT that influenced the assessment of re-sponse therapy; however, two (33%) of the sixpatients had new lesions on PET/CT, whichchanged the best response from stable diseaseto progressive disease. In the actual trial uti-lizing RECIST 1.0, which does not includenew lesions on PET/CT as a criterion for dis-ease progression, these two patients were notconsidered to meet the criteria of progressionat the time of PET/CT and continued with thetrial. These two patients could have come offthe clinical trial sooner if RECIST 1.1 criteriaincluding PET/CT were used.Fig. 2—Comparison of diameters of target lesions by Response Evaluation Criteria in Solid Tumors (RECIST) 1.1 and 1.0.A, Comparison of sum of longest diameters of target lesions on baseline CT measurements by RECIST 1.1 and RECIST 1.0 showed high correlation between two CT measurements (r = 0.936 and r2 = 0.8758, Pearson’s correlation).B, Decrease in sum of longest diameters of target lesions on baseline CT measurements by RECIST 1.1 (B1.1) compared with baseline CT measurement RECIST 1.0 (B1.0) (p = 0.0001, paired Student’s t test).Fig. 3—Percentage changes in sum of long diameter CT measurements byResponse Evaluation Criteria in Solid Tumors (RECIST) 1.1 versus RECIST 1.0at every two cycles of therapy. High correlation in percentage changes andhigh concordance of response assessments were observed between CTmeasurements by RECIST 1.1 and by RECIST 1.0. (r = 0.986 and r2 = 0.972 at cycle2 [n = 28]; r = 0.998 and r2 = 0.996 at cycle 4 [n = 7]; r = 0.657 and r2 = 0.432 at cycle6 [n = 5]; r = 0.949 and r2 = 0.901 at cycle 8 [n = 4]; r = not applicable and r2 = notapplicable at cycle 10 [n = 1]; and r = 0.979 and r2 = 0.959 at cycles 2–10 [n = 45],Pearson’s correlation). PD = progressive disease, PR = partial response, SD =stable disease.Revised RECIST Guidelines for Lung CancerTime to progression did not show any sig-nificant difference (p = 1.000, sign test) be-tween RECIST 1.1 and RECIST 1.0 (Fig. 5). Time to progression between RECIST 1.1 and RECIST 1.0 did not differ in 40 patients (93%). Time to progression according to RECIST 1.1 was shorter than that according to RECIST 1.0 in two patients whose best re-sponse changed from stable disease according to RECIST 1.0 to progressive disease accord-ing to RECIST 1.1 (54 days according to RECIST 1.1 vs 108 days according to RECIST 1.0; and 51 days according to RECIST 1.1 vs 92 days according to RECIST 1.0). In one pa-tient whose best response changed from pro-gressive disease by RECIST 1.0 to stable dis-ease by RECIST 1.1, time to progression according to RECIST 1.1 was longer than that according to RECIST 1.0. For this patient, it was not possible to obtain the exact days of time to progression by RECIST 1.1 because the patient was removed from the protocol and the erlotinib therapy was discontinued atthe time of documented progression by RECIST 1.0 (54 days) in the actual clinical trial.A high correlation was noted between the CT measurement performed during the clinical trial (measurement 1) and that per-formed by the observer in the present study (measurement 2) for both RECIST 1.0 (r 2 = 0.9740, Pearson’s correlation) and RECIST 1.1 (r 2 = 0.9846, Pearson’s correlation) (Figs. 6A and 6B). Figures 6C and 6D show the Bland-Altman plots with the mean percent-age of relative difference and the limits of agreement. For the two CT measurements using RECIST 1.0, the mean difference was −0.2% (95% limits of agreement, −30.8%, 30.4%) (Fig. 6C). For the two measurements using RECIST 1.1, the mean difference was 3.4% (95% limits of agreement, −18.6%, 25.4%) (Fig. 6D).DiscussionThe RECIST 1.1 criteria provided almost perfect agreement in the assessment of tu-mor response to therapy compared with the RECIST 1.0 criteria, with a decreased num-ber of target lesions in patients with NSCLC treated with targeted therapy. To our knowl-edge, this is the first report that evaluated the impact of RECIST 1.1 on CT tumor mea-surement and the response assessment since the new guideline has been published [2].The most common reason for the decrease in the number of target lesions using RECIST 1.1 was the new definition of measurability of malignant lymph nodes at the baseline (a lymph node must be at least 15 mm in the short axis to be considered pathologically enlarged and measurable as a target lesion [2]), which affected 18 patients. The new definition is intended to eliminate the inclu-sion of lymph nodes less than 15 mm in the short axis as target lesions [6]. Another rea-son for the decreased number of target le-sions was the reduction in the number of le-sions required to assess tumor burden (from100755025P r o g r e s s i o n -F r e e P r o b a b i l i t y (%)Time to Progression (d)0150120906030RECIST 1.1RECIST 1.0Fig. 4—Percentage changes in sum of longest diameter CT measurements by Response Evaluation Criteria in Solid Tumors (RECIST) 1.1 and RECIST 1.0 after first two cycles of therapy. Response assessments of targetlesions at first two cycles of therapy by RECIST 1.1 and RECIST 1.0 were concordant in 27 (96%) of 28 patients and discordant in one patient (4%; asterisk ). PD = progressive disease, PR = partial response, and SD = stable disease.Fig. 5—Time toprogression by Response Evaluation Criteria in Solid Tumors (RECIST) 1.1 versus RECIST 1.0. Difference in time to progression was not significant (p = 1.000, sign test).TABLE 2: Best Response Assessment by Response Evaluation Criteria inSolid Tumors (RECIST) 1.1 Versus RECIST 1.0Best Response by RECIST 1.0Best Response by RECIST 1.1Progressive DiseaseStable DiseaseNonevaluableProgressive disease 1710Stable disease 2170Nonevaluable6Note—Data are number of patients. Weighted κ = 0.905.Nishino et al.a maximum of 10 to a maximum of five, and from five to two per organ), which influenced four patients [2]. Three of these four patients had three lesions in the lung according to RECIST 1.0. The smallest of the three le-sions at the baseline was excluded from the target lesions. The other patient had wide-spread disease in the chest, upper abdomen, and ribs, with a total of nine target lesions according to RECIST 1.0. The largest five le-sions by the longest diameter were chosen in keeping with the limit of two lesions per or-gan. Three patients (7%) had no target le-sions according to RECIST 1.1, because all the target lesions according to RECIST 1.0 were lymph nodes smaller than 1.5 cm in the short axis, which does not meet the RECIST 1.1 criteria for a target lesion. Hence, these three patients would be nonassessable patientsand would likely be excluded from participa-tion in a prospective trial using RECIST 1.1.The result indicates that RECIST 1.1 influenc-es the eligibility of the patients for clinical trials,which requires measurable lesion by RECIST atbaseline for enrollment.The baseline RECIST CT measurementwas decreased in 25 patients (58%) whenRECIST 1.1 was used. The mean differencein the baseline CT measurement of summedlesion diameters was 1.6 cm, and 19 (76%)of the 25 patients with decreases in baselineCT measurement by RECIST 1.1 had reduc-tions of less than 3 cm. The decrease in thebaseline CT size measurement was due to adecrease in the number of target lesions in22 patients. For three patients, the baselineCT measurement by RECIST 1.1 was de-creased because of the inclusion of the short-axis measurement for the lymph node, ratherthan the long axis, without a decrease in thenumber of target lesions. The decrease in thebaseline CT measurement for these three pa-tients was less than 1 cm. RECIST 1.1 pro-vided concordant response assessment oftarget lesions with RECIST 1.0 at each mea-surement on CT scans at every two cycles oftherapy except for one (2.2%) of 45 patients.New lesions noted on PET/CT changedthe best response for two patients from stabledisease according to RECIST 1.0 to progres-sive disease according to RECIST 1.1. Theresults suggest that the inclusion of PET/CTin the assessment of new lesions may have asignificant influence on response assessmentFig. 6—Comparison of sum of longest diameters of target lesions on baseline CT measurements performed in clinical trial (measurement 1) and by observer in present study (measurement 2).A and B, High correlation was noted between two measurements for both Response Evaluation Criteria in Solid Tumors (RECIST) 1.0 (A) and RECIST 1.1 (B) (r2 = 0.9740 and r2 = 0.9846, respectively; Pearson’s correlation).C and D, Bland-Altman plots of two sets of baseline CT measurements for RECIST 1.0 (C) and RECIST 1.1 (D) are shown. Interobserver variability is shown as function of mean of two measurements. Dotted lines indicate upper and lower 95% limits of agreement. Dashed lines indicate mean relative difference.。