RGB - D斯拉姆数据集和基准(RGB-D SLAM Dataset and Benchmark)
- 格式:pdf
- 大小:584.08 KB
- 文档页数:18
基于RGB—D数据的SLAM算法作者:颜义鹏许志强翟漪璇韩金鑫成怡来源:《科技视界》2018年第14期【摘要】本文提出了一种基于RGB-D数据的SLAM算法,通过对相机获取的图像进行ORB特征点的提取与匹配,估计相机运动关系,实现点云拼接,最后会得到全局一致的点云地图和轨迹。
为了消除误差积累引起的干扰,引入通用图优化库g2o,得到光滑的优化轨迹;在后端回环检测的过程中,引入关键帧选取机制,提高点云地图的生成效率,减少其消耗的存储空间。
实验结果表明,本文的研究方法在RGB-D SLAM 算法中具有可行性,并且能够满足实时性要求,具备较高的精度。
【关键词】RGB-D;ORB特征点提取;SLAM;图优化中图分类号: TP391.41 文献标识码: A 文章编号: 2095-2457(2018)14-0152-002DOI:10.19694/ki.issn2095-2457.2018.14.069SLAM algorithm research based on RGB-D dataYAN Yi-peng XU Zhi-qiang ZHAI Yi-xuan HAN Jin-xin CHENG Yi(Tianjin polytechnic university,Tianjin 300387, China)【Abstract】This paper proposes a SLAM algorithm based on RGB-D data. By extracting and matching the ORB keypoints of the images obtained by the camera, the camera motion relationship is estimated and the point clouds are stitched. Finally, a globally consistent point cloud map and trajectory are obtained. In the process of detection of the backend end loop closure, a key frame selection mechanism is introduced to improve the generation efficiency of the point cloud map to reduce the amount of storage space. The experimental results show that the research method of this paper is feasible in the RGB-D SLAM algorithm, and it can meet the real-time requirements with high accuracy.【Key words】RGB-D; ORB keypoint extraction; SLAM; Graph optimization0 引言因激光雷达具有测距精度高的特点,所以早期的Slam多使用激光雷达作为传感器,但激光雷达存在价格昂贵、数据难以处理等固有缺陷。
slam 初始化基准尺度SLAM(Simultaneous Localization and Mapping,同时定位与地图构建)是指机器人在未知环境中实现自主定位和地图构建的技术。
在SLAM中,机器人需要同时完成自身位置的估计和环境地图的构建,这对于实现机器人自主导航和探索具有重要意义。
本文将从SLAM初始化、基准尺度等方面进行详细阐述。
一、SLAM初始化SLAM系统需要在开始工作前对机器人的初始位置进行估计,这个过程称为初始化。
通常情况下,SLAM系统通过激光雷达或摄像头获取环境信息,并通过特征点匹配或视觉里程计算法来确定机器人的初始位置。
具体来说,可以采用以下方法:1. 利用激光雷达获取环境信息激光雷达可以扫描环境并生成点云数据,这些数据包含了环境中物体的位置和形状等信息。
利用这些数据可以进行特征提取和匹配,从而确定机器人的初始位置。
2. 利用摄像头获取环境信息摄像头可以获取图像信息,在SLAM系统中常用的方法是利用视觉里程计算法来估计机器人的位姿。
该算法通过比较相邻帧之间的图像特征点来计算机器人的位移和旋转,从而确定机器人的初始位置。
二、基准尺度基准尺度是指在SLAM系统中用来测量物体大小和距离的标准单位。
在SLAM系统中,需要对环境进行三维重建,因此需要知道物体的实际大小和距离。
基准尺度通常通过以下方法确定:1. 利用已知物体进行测量可以利用已知大小的物体(如标定棋盘)进行测量,从而确定相机或激光雷达的内外参数。
利用这些参数可以计算出环境中物体的实际大小和距离。
2. 利用GPS进行测量GPS可以提供位置信息,因此可以利用GPS来确定机器人在地球坐标系下的位置。
利用这些信息可以计算出环境中物体的实际大小和距离。
三、SLAM系统构建流程SLAM系统构建流程主要包括以下步骤:1. 传感器数据采集:通过激光雷达、摄像头等传感器获取环境信息。
2. 特征提取与匹配:根据传感器数据提取特征点,并将其与之前获取到的特征点进行匹配。
基于鱼眼相机和RGBD相机的异构协同SLAM基于鱼眼相机和RGB-D相机的异构协同SLAM摘要:SLAM(Simultaneous Localization and Mapping)是自主导航和环境建模中的重要技术。
本文提出了一种使用异构传感器——鱼眼相机和RGB-D相机进行协同SLAM的方法。
该方法旨在充分利用两种传感器的优势,提高SLAM系统的精度和鲁棒性。
1. 引言SLAM技术是无人系统、自主导航和增强现实等领域的核心技术之一。
传统的SLAM方法通常使用单目相机或激光雷达进行环境建模和定位,但存在定位漂移和环境不完全重建等问题。
基于此,本文提出了一种使用异构传感器的协同SLAM方法。
2. 鱼眼相机和RGB-D相机的优势鱼眼相机具有广角视野和大视场深度,能够提供更加全面的环境信息。
它能够捕捉到更多的特征点,减少图像模糊和运动失真。
RGB-D相机通过红外光和深度传感器可以获得相对精确的三维点云数据,使得环境重建更加准确。
3. 异构传感器的数据融合本文提出了一种将鱼眼相机和RGB-D相机的数据进行融合的方法。
首先,通过特征点匹配和鲁棒的图像配准方法将两种相机的图像对齐。
然后,利用双目视觉几何学方法将鱼眼相机的图像转化为等效的透视投影图像,与RGB-D相机的深度图像进行配准。
最后,利用数据融合算法将两种相机的信息进行融合,得到更加准确和完整的环境地图。
4. SLAM系统建模和优化在异构协同SLAM系统中,需要建立一个能够同时描述相机位姿和环境地图的模型。
本文采用基于特征的方法,提取鱼眼相机和RGB-D相机的特征点,并通过三角化得到三维点云。
然后,使用非线性优化算法对位姿和地图进行迭代优化,使得SLAM系统能够更准确地定位和建模。
5. 实验结果与分析本文使用了自主车辆进行了一系列的实验。
结果表明,相比单独使用鱼眼相机或RGB-D相机,异构协同SLAM方法能够显著提高定位精度和环境地图的准确性。
同时,该方法对于光线变化、遮挡等场景具有更强的鲁棒性。

基于RGB-D相机的SLAM关键技术研究基于RGB-D相机的SLAM关键技术研究摘要:随着3D传感技术的快速发展,RGB-D相机在即时建图和定位中发挥了重要作用。
本文旨在研究基于RGB-D相机的实时定位与建图(SLAM)技术,并介绍其中的关键技术,包括特征提取与描述、图像匹配与配准、地图构建与更新以及位姿估计与优化等方面。
在实验中,我们采用RGB-D相机(如Microsoft Kinect),通过对传感器数据的处理和分析,实现对室内环境的快速建立和精确定位。
实验结果表明,基于RGB-D相机的SLAM技术能够有效地进行环境感知和位姿估计,并有望应用于室内导航、机器人导航、增强现实等领域。
关键词:RGB-D相机;实时定位与建图;特征提取与描述;图像匹配与配准;地图构建与更新;位姿估计;优化一、引言同时进行实时建图与定位是许多机器人和计算机视觉应用的关键问题。
此前,主要基于激光雷达和摄像机等传感器进行建图和定位。
然而,随着RGB-D相机技术的出现,它不仅可以提供像素级的彩色图像,还可通过深度信息获取物体的三维空间坐标。
这使得RGB-D相机成为了一种理想的传感器用于实时定位与建图(SLAM)任务。
二、特征提取与描述在SLAM任务中,特征提取与描述是一个十分重要的步骤。
首先,通过RGB图像提取出特征点,并计算出特征描述子。
同时,还需通过深度图像提取深度信息,并与特征点进行匹配。
常用的特征点提取算法有Harris角点检测、FAST角点检测和SIFT算法等。
对于特征描述子的计算,常用的方法有SIFT、SURF和ORB等。
特征的质量和数量对后续的图像匹配和位姿估计有很大影响,因此需要选择合适的特征提取和描述方法。
三、图像匹配与配准图像匹配是SLAM任务中的核心问题之一。
通常,通过计算特征匹配的一致性来确定两幅图像之间的相对位姿关系。
匹配的难点在于对特征点进行有效的筛选,并进行准确的匹配。
在RGB-D相机中,可以利用深度图像来辅助特征点的匹配,提高匹配的准确性和鲁棒性。
视觉SLAM的分类引言随着计算机视觉和机器人技术的发展,视觉SLAM(Simultaneous Localization and Mapping,即时定位与建图)作为一种重要的感知和导航技术,被广泛应用于自主导航、增强现实、机器人导航等领域。
视觉SLAM通过从视觉传感器获取图像信息,并将其与运动估计算法相结合,实现同时定位机器人的位置和构建环境地图。
在这篇文章中,我们将对视觉SLAM的分类进行全面、详细、完整且深入地探讨。
单目视觉SLAM概述单目视觉SLAM是指仅通过单个摄像头获取的图像信息来实现同时定位和建图的技术。
相对于使用多个传感器的多传感器SLAM来说,单目视觉SLAM更加具有挑战性,因为单个视角往往无法提供足够的几何信息来进行定位和建图。
方法•特征点法:基于特征点的方法是最常用的单目视觉SLAM方法之一。
通常通过提取图像中的关键点,并使用特征描述子来进行特征匹配和跟踪。
同时,该方法也会估计摄像头的运动和三维场景点的位置,以实现定位和建图。
•直接法:直接法是另一种常用的单目视觉SLAM方法。
该方法通过将图像像素值直接用于估计摄像头的运动和场景的深度信息。
与特征点法相比,直接法能够获得更多的几何信息,但该方法对光照变化和纹理稀疏场景比较敏感。
应用•自主导航:单目视觉SLAM可以用于机器人的自主导航。
通过结合图像信息和运动估计,机器人可以实时地感知自身位置和周围环境,从而进行路径规划和避障。
•增强现实:单目视觉SLAM也可以应用于增强现实。
通过追踪相机的运动以及对场景中物体的建模,可以将虚拟对象与真实世界进行融合,使用户能够在现实世界中与虚拟对象进行交互。
双目视觉SLAM概述双目视觉SLAM是指基于双目(左右)摄像头获取的图像信息来实现同时定位和建图的技术。
相对于单目视觉SLAM来说,双目视觉SLAM可以通过摄像头之间的视差来获得更多的三维信息,从而提高定位和建图的精度。
方法•立体匹配法:双目视觉SLAM中最常用的方法是立体匹配法。
slam本科毕设题目
SLAM(Simultaneous Localization and Mapping)是一个复杂的研究领域,涉及机器人技术、计算机视觉和传感器融合等多个学科。
因此,对于本科生来说,完成一个完整的SLAM项目作为毕业设计题目是一个很大的挑战。
不过,我可以为你提供一些可能的题目和思路,供你参考:
1. 基于RGB-D相机的SLAM系统实现
在这个题目中,你可以使用微软的Kinect或Intel的RealSense等RGB-D相机作为传感器,通过实现一个SLAM系统来处理3D场景中的定位和地图构建问题。
你可以选择使用开源的SLAM框架,如ORB-SLAM或LOAM等,并根据需要进行修改和优化。
2. 基于激光雷达的SLAM系统实现
激光雷达是一种常用的传感器,可以用于实现精确的SLAM系统。
在这个题目中,你可以选择使用开源的激光雷达数据集,如KITTI或Velodyne HDL32E等,并实现一个SLAM系统来处理激光雷达数据。
你可以选择使用开源的SLAM框架,如Cartographer或LeGO-LOAM 等,并根据需要进行修改和优化。
3. 基于IMU和轮速传感器的SLAM系统实现
在这个题目中,你可以使用IMU(Inertial Measurement Unit)和轮速传感器来获取机器人的运动信息,并实现一个SLAM系统来处理机器人在动态环境中的定位和地图构建问题。
你可以选择使用开源的
SLAM框架,如Cartographer或OKVIS等,并根据需要进行修改和优化。
基于前后端图优化的RGB-D三维SLAM邢科新;竺海光;林叶贵;张雪波【摘要】针对传统滤波方法在解决移动机器人同时定位与地图构建(SLAM)中存在的累积误差问题,将图优化方法应用于前端和后端优化中,以提高移动机器人位姿估计和建图的准确性.运用O RB算法进行图像的特征提取与匹配,将图优化的方法应用到PnP问题的求解中,实现了机器人位姿的准确估计.基于词典(Bag of words)的闭环检测算法来进行闭环检测,得到存在的大回环,同时利用相邻几帧的匹配关系实时检测邻近几帧之间可能存在的局部回环.用图优化的方法对这些回环进行优化,得到准确的运动轨迹和点云地图.实验结果表明:基于前后端图优化的RGB-D三维SLAM算法,在室内环境下具有良好的精度和实时性.【期刊名称】《浙江工业大学学报》【年(卷),期】2018(046)006【总页数】6页(P616-621)【关键词】图优化;三维SLAM;PnP;视觉词典;回环检测【作者】邢科新;竺海光;林叶贵;张雪波【作者单位】浙江工业大学信息工程学院,浙江杭州 310023;浙江工业大学信息工程学院,浙江杭州 310023;浙江工业大学信息工程学院,浙江杭州 310023;南开大学机器人与信息自动化研究所,天津 300071【正文语种】中文【中图分类】TP242针对处在复杂环境中的机器人,利用自身所携带的视觉传感器获取机器人所在环境的三维空间模型和机器人的运动轨迹,这是视觉SLAM(Simultaneous localization and mapping,即时定位与地图构建)所要完成的工作,也是实现移动机器人任务规划、导航和控制等自主运动的前提之一[1]。
近几年,流行的深度摄像机不仅可以获得环境的二维图像信息,还可以准确得到对应环境的深度信息。
因此,利用深度摄像机来做视觉SLAM成为研究的热点。
现行的RGB-D SLAM算法主要由前端和后端两部分组成[2]。
前端部分利用得到的彩色图和深度图计算提取各帧间的空间位置关系,而后端部分对所得到的这些移动机器人位姿进行优化,来减少其中存在的非线性误差。
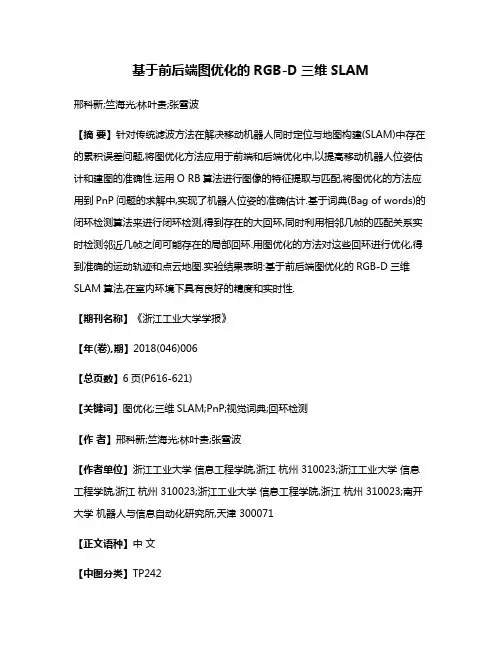
度图像。
如图1和图2所示。
图1RGB-D数据1图2RGB-D数据2
图3特征点匹配
使用ORB特征提取与匹配算法对图1和2的图像进行特征点的提取和匹配,匹配之后的结果如图3所示。
通过前述的实验结果,可以计算出两张图像间的运动关系。
将提取出的图像特征点的二维像素坐标转云坐标,并采用相机内参参数
Opencv中的SolvePnPRansac函数
动图,如图6所示。
图4未经回环检测的点云地图
图5经回环检测的点云地图图6运动轨迹
5总结
本文采用标准开源测试数据集nyuv2并对文中提出的一种基于RGB-D SLAM算法进行了一系列的实验验证:基于ORB算法的图像特征点提取与匹配、估计图像间的运动关系、生成点云地图与图优化轨迹。
并在生成点云地图部分,将未引入回环检测环节与引入回环检测环节生成的点云地图进行了对比分析。
结果表明,本文的研究方法具有可行性。
【参考文献】
[1]李海洋,李洪波,林颖,等.基于Kinect的SLAM方法[J],中南大学学报:自然科学版,2013(S2).
[2]贾松敏,王可,郭兵,等.基于RGB-D相机的移动机器人三维SLAM[J].华中科技大学学报:自然科学版,2014(I):103-109.。
RGB - D斯拉姆数据集和基准(RGB-D SLAM Datasetand Benchmark)数据介绍:We provide a large dataset containing RGB-D data and ground-truth data with the goal to establish a novel benchmark for the evaluation of visual odometry and visual SLAM systems. Our dataset contains the color and depth images of a Microsoft Kinect sensor along theground-truth trajectory of the sensor. The data was recorded at full frame rate (30 Hz) and sensor resolution (640×480). The ground-truth trajectory was obtained from a high-accuracy motion-capture system with eight high-speed tracking cameras (100 Hz). Further, we provide the accelerometer data from the Kinect. Finally, we propose an evaluation criterion for measuring the quality of the estimated camera trajectory of visual SLAM systems.关键词:RGB-D,地面实况,基准,测程,轨迹,RGB-D,ground-truth,benchmark,odometry,trajectory,数据格式:IMAGE数据详细介绍:RGB-D SLAM Dataset and BenchmarkContact: Jürgen SturmWe provide a large dataset containing RGB-D data and ground-truth data with the goal to establish a novel benchmark for the evaluation of visual odometry and visual SLAM systems. Our dataset contains the color and depth images of a Microsoft Kinect sensor along the ground-truth trajectory of the sensor. The data was recorded at full frame rate (30 Hz) and sensor resolution (640×480). The ground-truth trajectory was obtained from a high-accuracy motion-capture system with eight high-speed tracking cameras (100 Hz). Further, we provide the accelerometer data from the Kinect. Finally, we propose an evaluation criterion for measuring the quality of the estimated camera trajectory of visual SLAM systems.How can I use the RGB-D Benchmark to evaluate my SLAM system?1. Download one or more of the RGB-D benchmark sequences (fileformats, useful tools)2. Run your favorite visual odometry/visual SLAM algorithm (for example,RGB-D SLAM)3. Save the estimated camera trajectory to a file (file formats, exampletrajectory)4. Evaluate your algorithm by comparing the estimated trajectory with theground truth trajectory. We provide an automated evaluation tool to help you with the evaluation. There is also an online version of the tool. Further remarksJose Luis Blanco has added our dataset to the mobile robot programming toolkit (MRPT) repository. The dataset (including example code and tools) can be downloaded here.∙If you have any questions about the dataset/benchmark/evaluation/file formats, please don't hesitate to contact Jürgen Sturm.∙We are happy to share our data with other researchers. Please refer to the respective publication when using this data.Related publications2011Conference and Workshop PapersReal-Time Visual Odometry from Dense RGB-D Images (F. Steinbruecker, J. Sturm, D. Cremers), In Workshop on Live Dense Reconstruction with Moving Cameras at the Intl. Conf. on Computer Vision (ICCV), 2011. [bib] [pdf] Towards a benchmark for RGB-D SLAM evaluation (J. Sturm, S. Magnenat, N. Engelhard, F. Pomerleau, F. Colas, W. Burgard, D. Cremers, R. Siegwart), In Proc. of the RGB-D Workshop on Advanced Reasoning with Depth Cameras at Robotics: Science and Systems Conf. (RSS), 2011. [bib] [pdf] [pdf]Real-time 3D visual SLAM with a hand-held camera (N. Engelhard, F. Endres, J. Hess, J. Sturm, W. Burgard), In Proc. of the RGB-D Workshop on 3D Perception in Robotics at the European Robotics Forum, 2011. [bib] [pdf] [video] [video] [video]File FormatsWe provide the RGB-D datasets from the Kinect in the following format:Color images and depth mapsWe provide the time-stamped color and depth images as a gzipped tar file (TGZ).∙The color images are stored as 640×480 8-bit RGB images in PNG format.∙The depth maps are stored as 640×480 16-bit monochrome images in PNG format.∙The color and depth images are already pre-registered using the OpenNI driver from PrimeSense, i.e., the pixels in the color and depthimages correspond already 1:1.∙The depth images are scaled by a factor of 5000, i.e., a pixel value of 5000 in the depth image corresponds to a distance of 1 meter from thecamera, 10000 to 2 meter distance, etc. A pixel value of 0 meansmissing value/no data.Ground-truth trajectoriesWe provide the groundtruth trajectory as a text file containing the translation and orientation of the camera in a fixed coordinate frame. Note that also our automatic evaluation tool expects both the groundtruth and estimated trajectory to be in this format.∙Each line in the text file contains a single pose.∙The format of each line is 'timestamp tx ty tz qx qy qz qw'∙timestamp (float) gives the number of seconds since the Unix epoch.∙tx ty tz (3 floats) give the position of the optical center of the color camera with respect to the world origin as defined by the motion capture system.∙qx qy qz qw (4 floats) give the orientation of the optical center of the color camera in form of a unit quaternion with respect to the world origin as defined by the motion capture system.∙The file may contain comments that have to start with ”#”.Intrinsic Camera Calibration of the KinectThe Kinect has a factory calibration stored onboard, based on a high level polynomial warping function. The OpenNI driver uses this calibration for undistorting the images, and for registering the depth images (taken by the IR camera) to the RGB images. Therefore, the depth images in our datasets are reprojected into the frame of the color camera, which means that there is a 1:1 correspondence between pixels in the depth map and the color image.The conversion from the 2D images to 3D point clouds works as follows. Note that the focal lengths (fx/fy), the optical center (cx/cy), the distortion parameters (d0-d4) and the depth correction factor are different for each camera. The Python code below illustrates how the 3D point can be computed from the pixel coordinates and the depth value:fx = 525.0 # focal length xfy = 525.0 # focal length ycx = 319.5 # optical center xcy = 239.5 # optical center yds = 1.0 # depth scalingfactor = 5000 # for the 16-bit PNG files# OR: factor = 1 # for the 32-bit float images in the ROS bag filesfor v in range(depth_image.height):for u in range(depth_image.width):Z = (depth_image[v,u] / factor) * ds;X = (u - cx) * Z / fx;Y = (v - cy) * Z / fy;Note that the above script uses the default (uncalibrated) intrinsic parameters. The intrinsic parameters for the Kinects used in the fr1 and fr2 dataset are as follows:Calibration of the color cameraWe computed the intrinsic parameters of the RGB camera from thergbd_dataset_freiburg1/2_rgb_calibration.bag.Camera fx fy cx cy d0 d1 d2 d3 d4(ROS525.0 525.0 319.5 239.5 0.0 0.0 0.0 0.0 0.0 default)Freiburg 1517.3 516.5 318.6 255.3 0.2624 -0.9531 -0.0054 0.0026 1.1633 RGBFreiburg 2520.9 521.0 325.1 249.7 0.2312 -0.7849 -0.0033 -0.0001 0.9172 RGBCalibration of the depth imagesWe verified the depth values by comparing the reported depth values to the depth estimated from the RGB checkerboard. In this experiment, we found that the reported depth values from the Kinect were off by a constant scaling factor, as given in the following table:Camera dsFreiburg 1 Depth 1.035Freiburg 2 Depth 1.031Calibration of the infrared cameraWe also provide the intrinsic parameters for the infraredcamera. Note that the depth images provided in our dataset are alreadypre-registered to the RGB images. Therefore, rectifying the depth images based on the intrinsic parameters is not straight forward.Camera fx fy cx cy d0 d1 d2 d3 d4 Freiburg 1 IR591.1 590.1 331.0 234.0 -0.0410 0.3286 0.0087 0.0051 -0.5643Freiburg 2 IR580.8 581.8 308.8 253.0 -0.2297 1.4766 0.0005 -0.0075 -3.4194 Movies for visual inspectionFor visual inspection of the individual datasets, we also provide movies of the Kinect (RGB and depth) and of an external camcorder. The movie format is mpeg4 stored in an AVI container.Alternate file formatsROS bagFor people using ROS, we also provide ROS bag files that contain the color images, monochrome images, depth images, camera infos, point clouds and transforms – including the groundtruth transformation from the /world frame all in a single file. The bag files (ROS diamondback) contain the following message topics:∙/camera/depth/camera_info (sensor_msgs/CameraInfo) contains the intrinsic camera parameters for the depth/infrared camera, asreported by the OpenNI driver∙/camera/depth/image (sensor_msgs/Image) contains the depth map ∙/camera/rgb/camera_info (sensor_msgs/CameraInfo) contains the intrinsic camera parameters for the RGB camera, as reported by theOpenNI driver∙/camera/rgb/image_color (sensor_msgs/Image) contains the color image from the RGB camera∙/imu (sensor_msgs/Imu), contains the accelerometer data from the Kinect∙/tf (tf/tfMessage), contains:o the ground-truth data from the mocap (/world to /Kinect)o the calibration betwenn mocap and the optical center of the Kinect's color camera (/Kinect to /openni_camera),o and the ROS-specific, internal transformations (/openni_camera to /openni_rgb_frame to /openni_rgb_optical_frame).If you need the point clouds and monochrome images, you can use the adding_point_clouds_to_ros_bag_files script to add them:∙/camera/rgb/image_mono (sensor_msgs/Image) contains the monochrome image from the RGB camera∙/camera/rgb/points (sensor_msgs/PointCloud2) contains the colored point clouds/camera/depth/points (sensor_msgs/PointCloud2) contains the point cloudMobile Robot Programming Toolkit (MRPT)Jose Luis Blanco has added our dataset to the mobile robot programming toolkit (MRPT) repository. The dataset (including example code and tools) can be downloaded hereUseful tools for the RGB-D benchmarkWe provide a set of tools that can be used to pre-process the datasets and to evaluate the SLAM/tracking results. The scripts can be downloaded here.To checkout the repository using subversion, runsvn checkouthttps://svncvpr.in.tum.de/cvpr-ros-pkg/trunk/rgbd_benchmark/rgbd_benchmar k_toolsAssociating color and depth imagesThe Kinect provides the color and depth images in an un-synchronized way. This means that the set of time stamps from the color images do not intersect with those of the depth images. Therefore, we need some way of associating color images to depth images.For this purpose, you can use the ''associate.py'' script. It reads the time stamps from the rgb.txt file and the depth.txt file, and joins them by finding the best matches.usage: associate.py [-h] [--first_only] [--offset OFFSET][--max_difference MAX_DIFFERENCE]first_file second_fileThis script takes two data files with timestamps and associates them positional arguments:first_file first text file (format: timestamp data)second_file second text file (format: timestamp data)optional arguments:-h, --help show this help message and exit--first_only only output associated lines from first file--offset OFFSET time offset added to the timestamps of the second file(default: 0.0)--max_difference MAX_DIFFERENCEmaximally allowed time difference for matching entries(default: 0.02)EvaluationAfter estimating the camera trajectory of the Kinect and saving it to a file, we need to evaluate the error in the estimated trajectory by comparing it with the ground-truth. There are different error metrics. Two prominent methods is the absolute trajectory error (ATE) and the relative pose error (RPE). The ATE is well-suited for measuring the performance of visual SLAM systems. In contrast, the RPE is well-suited for measuring the drift of a visual odometry system, for example the drift per second.For both metrics, we provide automated evaluation scripts that can be downloaded here. Note that there is also an online version available on our website. Both trajectories have to be stored in a text file (format: 'timestamp tx ty tz qx qy qz qw', more information). For comparison, we offer a set of trajectories from RGBD-SLAM.Absolute Trajectory Error (ATE)The absolute trajectory error directly measures the difference between points of the true and the estimated trajectory. As a pre-processing step, we associate the estimated poses with ground truth poses using the timestamps. Based on this association, we align the true and the estimated trajectory using singular value decomposition. Finally, we compute the difference between each pair of poses, and output the mean/median/standard deviation of these differences. Optionally, the script can plot both trajectories to a png or pdf file. usage: evaluate_ate.py [-h] [--offset OFFSET] [--scale SCALE][--max_difference MAX_DIFFERENCE] [--save SAVE][--save_associations SAVE_ASSOCIATIONS][--plot PLOT][--verbose]first_file second_fileThis script computes the absolute trajectory error from the ground truthtrajectory and the estimated trajectory.positional arguments:first_file first text file (format: timestamp tx ty tz qx qy qzqw)second_file second text file (format: timestamp tx ty tz qx qy qzqw)optional arguments:-h, --help show this help message and exit--offset OFFSET time offset added to the timestamps of the second file(default: 0.0)--scale SCALE scaling factor for the second trajectory (default:1.0)--max_difference MAX_DIFFERENCEmaximally allowed time difference for matching entries(default: 0.02)--save SAVE save aligned second trajectory to disk (format: stamp2x2 y2 z2)--save_associations SAVE_ASSOCIATIONSsave associated first and aligned second trajectory todisk (format: stamp1 x1 y1 z1 stamp2 x2 y2 z2)--plot PLOT plot the first and the aligned second trajectory to animage (format: png)--verbose print all evaluation data (otherwise, only the RMSEabsolute translational error in meters after alignmentwill be printed)Relative Pose Error (RPE)For computing the relative pose error, we provide a script ''evaluate_rpe.py''. This script computes the error in the relative motion between pairs of timestamps. By default, the script computes the error between all pairs of timestamps in the estimated trajectory file. As the number of timestamp pairs in the estimated trajectory is quadratic in the length of the trajectory, it can make sense to downsample this set to a fixed number (–max_pairs). Alternatively, one can choose to use a fixed window size (–fixed_delta). In this case, each pose in the estimated trajectory is associated with a later pose according to the window size (–delta) and unit (–delta_unit). This evaluation technique is useful for estimating the drift.usage: evaluate_rpe.py [-h] [--max_pairs MAX_PAIRS] [--fixed_delta][--delta DELTA] [--delta_unit DELTA_UNIT][--offset OFFSET] [--scale SCALE] [--save SAVE][--plot PLOT] [--verbose]groundtruth_file estimated_fileThis script computes the relative pose error from the ground truth trajectory and the estimated trajectory.positional arguments:groundtruth_file ground-truth trajectory file (format: "timestamp tx tytz qx qy qz qw")estimated_file estimated trajectory file (format: "timestamp tx ty tzqx qy qz qw")optional arguments:-h, --help show this help message and exit--max_pairs MAX_PAIRSmaximum number of pose comparisons (default: 10000,set to zero to disable downsampling)--fixed_delta only consider pose pairs that have a distance of deltadelta_unit (e.g., for evaluating the drift persecond/meter/radian)--delta DELTA delta for evaluation (default: 1.0)--delta_unit DELTA_UNITunit of delta (options: 's' for seconds, 'm' formeters, 'rad' for radians, 'f' for frames; default:'s')--offset OFFSET time offset between ground-truth and estimatedtrajectory (default: 0.0)--scale SCALE scaling factor for the estimated trajectory (default:1.0)--save SAVE text file to which the evaluation will be saved(format: stamp_est0 stamp_est1 stamp_gt0stamp_gt1trans_error rot_error)--plot PLOT plot the result to a file (requires --fixed_delta,output format: png)--verbose print all evaluation data (otherwise, only the meantranslational error measured in meters will beprinted)Generating a point cloud from imagesThe depth images are already registered to the color images, so the pixels in the depth image already correspond one-to-one to the pixels in the color image. Therefore, generating colored point clouds is straight-forward. An example script is available in ''generate_pointcloud.py'', that takes a color image and a depth map as input, and generates a point cloud file in the PLY format. This format can be read by many 3D modelling programs, for example meshlab. You can download meshlab for Windows, Mac and Linux.usage: generate_pointcloud.py [-h] rgb_file depth_file ply_fileThis script reads a registered pair of color and depth images and generates a colored 3D point cloud in the PLY format.positional arguments:rgb_file input color image (format:png)depth_file input depth image (format: png)ply_file output PLY file (format: ply)optional arguments:-h, --help show this help message and exitAdding point clouds to ROS bag filesOn the download page, we already provide ROS bag files with added point clouds for the datasets for visual inspection in RVIZ. Because of the large size of the resulting files, we downsampled these bag files to 2 Hz. In case that you want to generate ROS bag files that contain the point clouds for all images (at 30 Hz), you can use the ''add_pointclouds_to_bagfile.py'' script.usage: add_pointclouds_to_bagfile.py [-h] [--start START][--duration DURATION] [--nth NTH][--skip SKIP] [--compress]inputbag [outputbag]This scripts reads a bag file containing RGBD data, adds the corresponding PointCloud2 messages, and saves it again into a bag file. Optional argumentsallow to select only a portion of the original bag file.positional arguments:inputbag input bag fileoutputbag output bag fileoptional arguments:-h, --help show this help message and exit--start START skip the first N seconds of input bag file (default:0.0)--duration DURATION only process N seconds of input bag file (default: off)--nth NTH only process every N-th frame of input bag file(default: 15)--skip SKIP skip N blocks in the beginning (default: 1)--compress compress output bag fileVisualizing the datasets in RVIZRVIZ is the standard visualization tool in ROS. It can be easily adapted to display many different messages. In particular, it can be used to display the point clouds from a ROS bag file. For this, run (in three different consoles) roscorerosrun rviz rvizrosbag play rgbd_dataset_freiburg1_xyz-2hz-with-pointclouds.bagIf this is the first launch, you will have to enable the built-in displays (Menu –> Plugins –> Check “Loaded” for the builtin plugins). In the displays tab, set the “fixed frame” to ”/world”. Click on “Add”, and select the PointCloud2 display, and set topic to ”/camera/rgb/points”. To show the colors, change “color transformer” to “RGB8” in the point cloud display and the “style”to “points”. If you want, you can set the decay time to a suitable value, for example 5 seconds, to accumulate the points in the viewer as they come in. The result should then look as follows:数据预览:点此下载完整数据集。
基于多模态深度学习的RGB-D物体识别骆健;蒋旻;刘星;周龙【期刊名称】《计算机工程与设计》【年(卷),期】2017(038)006【摘要】针对现有RGB-D物体识别方法存在图像特征学习不全面、类间相似的物体识别精度不高等问题,联合稀疏自编码(sparse auto-encoder,SAE)及递归神经网络(recursive neural networks,RNNs)提出多模态稀疏自编码递归神经网络(multi-modal sparse auto-encoder and recursive neural networks,MSAE-RNNs)的深度学习模型.SAE结合卷积及池化技术分别从RGB-D图像的RGB图、灰度图、深度图、3D曲面法线中提取低层次的平移不变性特征,作为多个固定树RNNs的输入,得到更加抽象的高层特征,融合后的多模态特征,采用SVM分类器进行分类.在RGB-D数据集上的实验结果表明,该算法的物体识别率达到90.7%,较其它算法提高了3% 9%,能很好完成RGB-D物体的识别.%For the problems such as insufficient feature learning and lower accuracy of inter-class similar object recognition in cur rent RGB-D object recognition methods,a deep learning model called multimodal sparse auto-encoder and recursive neural networks (MSAE RNNs),which based on a combination of the sparse auto-encoder (SAE) and recursive neural networks (RNNs)for learning features was proposed.The SAE integrating convolution and pooling technology were used to extract low-level transnationally invariant features which were then taken as inputs to multiple and fixed-tree RNNs to compose higher order features.The multi-modal feature representationslearnt from RGB images,gray images,depth images and 3D surface normal maps were sent to a SVM classifier for classification.Experimental results on RGB-D dataset demonstrate that the recognition accuracy of the proposed method for RGB-D objects can reach 90.7%oo.Moreover,compared with other methods,the proposed method improves the recognition rate by 3 % 9 %,and completes the RGB-D object recognition commendably.【总页数】6页(P1624-1629)【作者】骆健;蒋旻;刘星;周龙【作者单位】武汉科技大学计算机科学与技术学院,湖北武汉430065;武汉科技大学湖北省智能信息处理与实时工业系统重点实验室,湖北武汉430065;武汉科技大学计算机科学与技术学院,湖北武汉430065;武汉科技大学湖北省智能信息处理与实时工业系统重点实验室,湖北武汉430065;武汉科技大学计算机科学与技术学院,湖北武汉430065;武汉科技大学湖北省智能信息处理与实时工业系统重点实验室,湖北武汉430065;武汉科技大学计算机科学与技术学院,湖北武汉430065;武汉科技大学湖北省智能信息处理与实时工业系统重点实验室,湖北武汉430065【正文语种】中文【中图分类】TP391.4【相关文献】1.基于深度学习的RGB-D物体识别算法 [J], 卢良锋;何加铭;谢志军;孙德超2.基于多模态融合的RGB-D物体识别 [J], 孙逊之;王月海3.基于ResNet的RGB-D物体识别 [J], 王熙敏;丁宾;张宇;鞠训光4.基于改进双流卷积递归神经网络的RGB-D物体识别方法 [J], 李珣;李林鹏;Alexander Lazovik;王文杰;王晓华5.基于RGB-D图像的物体识别方法 [J], 李珣;王高平;李林鹏;王晓华;景军锋;张凯兵因版权原因,仅展示原文概要,查看原文内容请购买。
【泡泡图灵智库】伪RGB-D自增强单目SLAM与深度预测泡泡图灵智库,带你精读机器人顶级会议文章标题:Pseudo RGB-D for Self-Improving Monocular SLAM and Depth Prediction作者: Lokender Tiwari1, Pan Ji2, Quoc-Huy Tran2, Bingbing Zhuang2, Saket Anand1,and Manmohan Chandraker2,3 来源:ECCV 2020编译:Weirse审核:wyc这是泡泡图灵智库推送的第504 篇文章,欢迎个人转发朋友圈;其他机构或自媒体如需转载,后台留言申请授权摘要大家好,今天为大家带来的文章是—— Pseudo RGB-D for Self-Improving Monocular SLAM and Depth Prediction经典的单目SLAM和最近出现的用于单目深度预测的卷积神经网络(CNNs)代表了两种相互独立的方法来构建周围环境的三维地图。
在这篇文章中,我们证明了这两者的耦合关系通过利用各自的优势来减轻其他缺点。
具体来说,我们提出了一种基于窄宽基线的联合自改进框架,一方面利用CNN预测的深度来执行基于伪RGB-D特征的SLAM,从而获得比单眼RGB-SLAM更好的精度和鲁棒性。
另一方面,通过为改进深度预测网络而提出的新的宽基线损失,将BA的三维场景结构和相机姿态注入深度网络,从而在下一次迭代中继续为更好的姿势和三维结构估计做出贡献。
我们的框架只需要在训练和推理阶段使用未标记的单目视频,并且能够比最先进的自监督单目和立体深度预测网络(例如monodeepth2)和基于特征的单目SLAM系统(即ORB-SLAM)表现得更好。
在KITTI和TUM-RGB-D数据集上的大量实验验证了我们的改进几何CNN框架的优越性。
主要贡献本文主要有以下贡献:1.提出了一种自我改进的策略,将SLAM输出更普遍适用的几何原理的监督注入深度预测网络2.本文引入了两种宽基线损失,即对称深度转移损失和共同跟踪点的深度一致性损失,并提出了一种基于窄基线和宽基线的联合深度预测学习系统,其中基于外观的损失在窄基线上计算,纯几何损失在宽基线上计算(非连续的时间距离关键帧)。
基于RGB-D相机的视觉里程计设计
霍智豪;苗艳松
【期刊名称】《电子制作》
【年(卷),期】2022(30)17
【摘要】同时定位与地图构建(SLAM,Simultaneous Localization And Mapping)技术,突破了传统的GPS与二维码定位的环境依赖性,仅依靠自身携带的相机作为视觉传感器,通过一系列的图像处理算法,完成相机位姿的估计,进而在世界坐标系下标定相机的运动轨迹。
同时,对相机采集的有效帧结合位姿估计值,便可以重现相机所在空间的稠密地图。
本文将从视觉SLAM(Simultaneous Localization And Mapping)技术传统的原理如相机模型、特征点的提取与匹配等出发并做出改进,结合RGB-D相机的应用,进而详细阐述各物理模型的实现方法,经过优化之后,以此作为视觉里程计的最终框架,完成视觉里程计的设计。
【总页数】5页(P60-64)
【作者】霍智豪;苗艳松
【作者单位】山东大学信息科学与工程学院;鲁东大学教育科学学院
【正文语种】中文
【中图分类】TP2
【相关文献】
1.基于RGB-D相机的视觉里程计实现
2.基于ORB特征的改进RGB-D视觉里程计算法研究
3.基于kinect的改进RGB-D视觉里程计
4.一种基于线特征的RGB-D视觉里程计算法
5.基于ORB特征的改进RGB-D视觉里程计
因版权原因,仅展示原文概要,查看原文内容请购买。
基于RGB-D相机的点线特征融合SLAM算法
马立;徐梦聪;周磊
【期刊名称】《华南理工大学学报:自然科学版》
【年(卷),期】2022(50)2
【摘要】针对大场景、弱纹理环境下ORB-SLAM算法特征点采集困难和精度低的问题,提出一种基于RGB-D相机的点线特征融合SLAM算法——PAL-SLAM。
在ORB-SLAM算法基础上设计点线特征融合新框架,通过研究点特征与线特征的融合原理来推导点线融合的重投影误差模型,进而得到该模型的雅可比矩阵解析形式,以此为基础提出PAL-SLAM算法的框架。
利用TUM数据集对PAL-SLAM和ORB-SLAM算法进行对比实验,结果表明PAL-SLAM算法在室内大场景中的定位精度更高,标准误差仅为ORB-SLAM算法的18.9%。
PAL-SLAM算法降低了传统视觉SLAM在大场景、弱纹理环境中的定位误差,有效提升了系统的准确性。
文中还搭建了基于Kinect V2的实验平台,实验结果表明,PAL-SLAM算法能与硬件平台较好结合。
【总页数】8页(P76-83)
【作者】马立;徐梦聪;周磊
【作者单位】上海大学机电工程与自动化学院
【正文语种】中文
【中图分类】TP242;TP391.4
【相关文献】
1.基于RGB-D相机数据的SLAM算法
2.基于PROSAC算法与ORB-SLAM2的RGB-D相机室内视觉定位研究
3.基于RGB-D相机的SLAM算法优化
4.基于RGB-D相机数据的SLAM算法研究
5.融合点线特征的视觉惯性SLAM算法
因版权原因,仅展示原文概要,查看原文内容请购买。
基于改进关键帧选择的RGB-D SLAM算法李弋星;刘士荣;仲朝亮;王坚【摘要】The key-frame selection is an important factor to improve the accuracy and real-time of visual SLAM algorithm.The key-frame selection is often based on the relative motion distance of the images.This method is simple and effective,but with poor real-time and robustness,and is easy to generate a large number of redundant key-frames.Aiming at the above problems,an improved key-frame selection algorithm is proposed.The algorithm incorporates the distance of relative motion of the frames,the feature points tracking and the minimum visual change to select a key-frame and delete the redundant key-frames.Based on thisalgorithm,combined the ORB (oriented FAST and rotated BRIEF)features with better direction and illumination invariant,the RGB-D SLAM algorithm is implemented. Experiments on RGB-D datasets indicate that the improved key-frame selection algorithm can be more accurate,timely in selecting key-frames,and improve the real-time and the accuracy of mapping and localization while reduce the redundant key-frames.%关键帧选择是提高视觉SLAM(simultaneous localization and mapping)算法精度及实时性的重要因素.关键帧常以图像的帧间相对运动距离为选择依据.该方法虽简单有效,但实时性、鲁棒性较差且容易产生大量冗余关键帧.针对上述问题,提出一种改进的关键帧选择算法.该算法整合了帧间相对运动距离、帧间特征点跟踪以及最小视觉变化来选择关键帧并删除冗余关键帧.基于该算法,结合具有较好方向和光照不变性的ORB(oriented FAST and rotated BRIEF)特征,实现了RGB-D SLAM算法.在RGB-D数据集上的实验表明,改进的关键帧选择算法能够更精准、及时地选择关键帧,并在减少RGB-D SLAM中冗余关键帧的同时提高算法的实时性、建图和定位精度.【期刊名称】《大连理工大学学报》【年(卷),期】2017(057)004【总页数】7页(P411-417)【关键词】关键帧选择;冗余关键帧删除;ORB特征;RGB-DSLAM【作者】李弋星;刘士荣;仲朝亮;王坚【作者单位】杭州电子科技大学自动化学院,浙江杭州 310018;杭州电子科技大学自动化学院,浙江杭州 310018;杭州电子科技大学自动化学院,浙江杭州 310018;杭州电子科技大学自动化学院,浙江杭州 310018【正文语种】中文【中图分类】TP242近年来,机器人三维同时定位与建图(3D SLAM)问题已经成为机器人领域研究的热点[1].相较于二维SLAM,三维SLAM能够更好地利用环境的三维属性,描述出环境中物体的空间几何外形,对机器人在未知环境中的导航具有重要的意义[2].得益于视觉传感器信号探测范围宽、信号获取内容全、价格低廉等特点,国内外学者对VSLAM[3](visual SLAM)进行了大量研究,包括LSD SLAM[4]、ORB-SLAM[5]、RGB-D SLAM[6]等.TUM(Technische Universität München)计算机视觉组提出的LSD SLAM直接利用单目相机实现三维SLAM.不同于ORB-SLAM采用特征点进行帧间匹配,LSDSLAM采用直接法,根据灰度图强度(image intensities)进行帧间匹配和建图,实现了大规模环境下的准确定位与建图.ORB-SLAM利用ORB特征完成SLAM中的所有任务:跟踪、建图、重定位和环形闭合检测.在室内、室外以及大规模环境下,ORB-SLAM有较好的鲁棒性和实时性.与LSD SLAM使用单目相机通过三角测量方法恢复环境深度相比,RGB-D相机(如微软公司的Kinect)能够在捕获RGB 图像的同时获得每一个像素的深度信息,很大程度上简化了利用三角测量方法获取深度信息的过程.基于上述优点,德国弗莱堡大学Endres等[6]提出了RGB-D SLAM算法,使用视觉传感器Kinect 作为唯一传感器对周围环境进行三维建图.实验证明,RGB-D SLAM算法能快速建图并具有很好的鲁棒性.在VSLAM中,通常使用关键帧进行建图和定位,这样可以避免因逐帧插入导致系统实时性降低、计算代价增加、系统内存消耗过大的问题.迄今为止,根据帧间相对运动距离来选择关键帧是VSLAM最常用的方法[7].该方法虽简单有效,但精度低、实时性差.同时该方法往往直接将已选择的关键帧全部储存[1,6],导致VSLAM算法后期存在大量冗余关键帧.本文针对上述问题,首先提出一种结合帧间相对运动距离、特征点跟踪以及最小视觉变化的关键帧选择算法,以便更加及时、准确地插入关键帧.然后通过关键帧之间的图像可跟踪点进行二次判断,删除冗余关键帧.最后基于改进的关键帧选择算法,结合具有较好方向和光照不变性的ORB特征,实现RGB-D SLAM算法.本文通过基于图(graph-based)的方法实现RGB-D SLAM算法.该算法主要由前端(front-end)、后端(back-end)、地图构建3部分组成,如图1所示.前端又叫位姿图构建;后端又叫图优化,用以优化全局位姿图.图构建主要包括特征检测与匹配、运动估计、关键帧选择与冗余关键帧删除以及环形闭合检测4部分.常用的特征点包括SIFT[8]、SURF[9]、FAST[10]等.考虑到SLAM对实时性的要求,采用ORB[11]特征进行特征检测与提取.ORB特征由Rublee等[11]于2011年提出,其计算速率更快、精度更高且具有更好的鲁棒性(尺度和旋转不变性).对于ORB特征,采用BruteForceMatcher结合汉明距离进行匹配.由于图像匹配后会包含大量误匹配对,采用随机采样一致性算法(RANSAC)[12]并利用RGB-D 相机提供的深度信息对初匹配结果进行采样,从而剔除外点(outliers)、抑制噪声并利用正确的匹配对计算帧间匹配的内点(inliers)、旋转向量和平移向量;然后根据旋转向量和平移向量进行运动估计,计算出帧间相对运动距离;再结合特征点跟踪和最小视觉变化进行关键帧选择,之后通过关键帧之间的图像可跟踪点进行二次判断,删除冗余关键帧;最后,再次利用RANSAC算法进行局部环形闭合检测和全局环形闭合检测,用以检索当前场景是否重复出现,从而完成SLAM算法前端的所有环节.完成图构建后,通过优化位姿图可以求解相机的最优位姿.常用的图优化方法包括非线性最小二乘法[13]、基于松弛的优化方法[14]、基于随机梯度下降法[15]以及流形优化方法[16].非线性最小二乘法、基于松弛的优化方法和基于随机梯度下降法都是在欧氏空间中进行优化,但机器人的真实位姿变化却是在非欧氏空间中的.为了防止欧氏空间中奇异值的出现,使用四元数来表示机器人的位姿变化并在流形空间中进行优化.这样不仅克服了欧氏空间中产生奇异值的问题,还可取得更高的精度.本文具体采用g2o进行后端优化.g2o是Kümmerle等[16]提出能用于流形优化的开源工具,可以大大提高开发效率.三维环境地图有很多表示方法,本文采用3D点云地图和3D OctoMap[17]来建图.3D点云地图能够清晰直观地表示环境信息,但存在大量冗余点且系统内存占用较大,不适合在大规模环境以及终生SLAM(life-long SLAM)算法中使用.3D OctoMap克服了点云地图上述缺点,在表示地图的同时占用少量的内存.此外,3D OctoMap能够更加直观地表示环境中的占用、空闲和未知区域,更有利于机器人导航和路径规划.当前端完成图像匹配后,利用RGB-D相机提供的各像素深度信息和RANSAC算法,可计算出帧间旋转向量r和平移向量t,从而求解帧间相对运动距离:①若Dmin≤D≤Dmax,则Framecurr=Framekey;②若D<Dmin,则Framecurr≠Framekey;③若D>Dmax,则Framecurr≠Framekey除此之外,还可以结合RANSAC算法中Inliers 来选择关键帧.该算法虽然结合了D和Inliers 来判断是否选择关键帧,但仍不能很好地满足SLAM算法对实时性、鲁棒性和精度的要求.在一些相机旋转或抖动的特殊情况下仍会出现判断错误甚至关键帧丢失的现象.对于终生SLAM算法来说,由于没有判定冗余关键帧,还会导致系统存储大量冗余的关键帧,使计算和存储负荷不断增大.为了克服常用关键帧选择存在的不足,本文提出选择关键帧后,检测冗余关键帧,并将其删除.为此,在常用关键帧选择算法中引入了特征点跟踪和最小视觉变化作为关键帧判断依据.该算法伪代码描述如下:If(Inliers>Inliersmin)ThenIf(Dmin≤D≤Dmax)ThenIf(Track(Framecurr-1,Framecurr)>α)ThenIf(Match(KeyframeL,Framecurr)>β)Then选择关键帧EndIfEndIfEndIfEndIf在上述算法中,Inliersmin为最少内点数,Framecurr为当前帧,Framecurr-1为上一帧,KeyframeL为最新插入的关键帧,α、β、z为可调参数.Track(Framecurr-1,Framecurr)用以计算Framecurr与Framecurr-1之间跟踪到的特征点个数,Match(KeyframeL,Framecurr)用以计算Framecurr与KeyframeL之间匹配的特征点个数占KeyframeL特征点个数的比例.首先,判定是否插入关键帧,即在不进行环形闭合检测时,插入关键帧能够保证环形闭合检测的准确率、有效性.在距KeyframeL插入后检测到第z个非关键帧时插入关键帧,能够确保在建图空闲时插入,提高关键帧的检测效率.其次,利用帧间相对运动距离D以及内点数Inliers对关键帧进行筛选.例如,算法语句If (Track(Framecurr-1,Framecurr)>α) Then用来对相邻帧间特征点进行跟踪.条件Track(Framecurr-1,Framecurr)>α说明帧间相关性强、匹配度高,将Framecurr作为候选关键帧,从而避免关键帧丢失.最后,以最小视觉变化进行判定,检测Framecurr与KeyframeL之间跟踪到的特征点个数.当Match(KeyframeL,Framecurr)>β时,说明新插入的关键帧与当前帧之间有足够运动距离,帧间旋转角度满足要求且匹配度高,将Framecurr选定为关键帧,并在位姿图中插入该帧.本文通过比较相邻n个关键帧图像间的可跟踪特征点进行关键帧的二次判断.冗余关键帧具体检测方法如下:①Track(Keyframecurr-1,Keyframecurr)>ε;②重复上述比较方法;③Tr ack(Keyframecurr-n,Keyframecurr)>ε;④如果以上判别式均成立,Keyframecurr为冗余关键帧,将其删除.上述检测方法中,Keyframecurr-1,…,Keyframecurr-n为Keyframecurr之前的n个关键帧,Keyframecurr为当前关键帧,Track(Keyframecurr-n,Keyframecurr)用以计算Keyframecurr与Keyframecurr-n之间匹配的特征点个数.当Keyframecurr上占比ε(ε>70%)的特征点能够在Keyframecurr-n上检测到时,说明Keyframecurr相对于之前的n个关键帧的运动尺度过小,Keyframecurr为冗余关键帧,删除Keyframecurr.这种方法本质上是关键帧的局部删除,由于是在已选择的关键帧中进行二次判断,在减少关键帧数量的同时提高了建图和定位精度.所有实验均在Ubuntu 12.04环境下完成,计算机CPU为2.0 GHz Intel i5,运行内存为3 GB.实验数据来自于RGB-D数据集——TUM RGB-D Benchmark[18]和NYU RGB-D Datasets[19].其中,coffee来自于NYU RGB-D Datasets,fr1_xyz和long_office_household(loh)来自于TUM RGB-D Benchmark.实验分别比较了常用关键帧选择算法(仅以D、Inliers为关键帧选择依据)、改进关键帧选择算法(包含冗余关键帧)、改进关键帧选择算法(删除冗余关键帧)对RGB-D SLAM实时性、建图和定位精度以及关键帧数量的影响.实时性对任何SLAM来说都是重要的性能评价指标.表1比较了ORB、SIFT和SURF特征在同一数据集下的实时性和匹配精度.从表1可知,ORB特征检测时间约为SIFT和SURF特征的1/10,且匹配时间远远少于SIFT和SURF特征.同时,ORB特征的匹配精度为SIFT和SURF特征的2倍以上.显然ORB特征在检测和匹配速率上都比其他特征更快且精度更高.在使用ORB特征的基础上,3种关键帧选择算法对RGB-D SLAM实时性的影响结果如表2所示.从表2可知,无论是否删除冗余关键帧,改进的关键帧选择算法都可以减少系统运作时间,提高实时性.特别是在场景loh中,由于数据较多,基于删除冗余关键帧的改进算法的实时性尤为显著.图2为3种关键帧选择算法构建的3D点云地图.显然,图2(a)、(b)中存在大量漂移点,场景中房屋、桌子和人的轮廓都不够清晰.由于场景中存在动态行人,前两种关键帧选择算法都不能很好地构建人所经过区域的局部地图.与图2(a)、(b)相比,图2(c)中的漂移点和冗余点较少,房屋、桌子和人的轮廓很清晰.并且人在移动过程中未被遮挡时的图像也可以清晰显示.由此可见,删除冗余关键帧改进算法构建的3D点云地图比其他两种算法精度更高.图3(a)为TUM计算机视觉组利用运动视觉捕捉系统记录的摄像头在该场景下真实且连续的轨迹,图3(b)、(c)、(d)分别为fr1_xyz场景下常用关键帧选择算法、删除冗余关键帧改进算法以及包含冗余关键帧改进算法计算的轨迹.各关键帧选择算法生成轨迹是非连续的,且与真实运动轨迹(ground truth)间存在旋转和平移关系,所以并未将所有轨迹统一到一个坐标系中.可以看出,图3(c)中删除冗余关键帧改进算法对应的运动轨迹奇点较少,与真实轨迹更加一致.对于定位精度[18],采用实际运动轨迹与真实运动轨迹间的均方根误差(root mean square error,Erms)进行比较.Erms越小,精度越高,计算式如下:表3比较了3种关键帧选择算法对应的Erms.从表3可知,在不同实验数据下,改进关键帧选择算法(删除冗余关键帧)的Erms最小,约为常用关键帧选择算法的1/2,从而表明该算法的定位精度最高.本文通过对相邻两关键帧(n=2)进行二次判断来删除冗余关键帧.图4比较了不同数据集下3种关键帧选择算法计算的关键帧数量N.很显然,改进关键帧选择算法(删除冗余关键帧)的关键帧数量远远小于其他两种算法.当RGB-D SLAM算法在大规模环境loh中使用时,这种差异尤为明显,其计算的关键帧数量约为常用关键帧选择算法的一半.从上述实验中可以发现,引入删除冗余关键帧方法的改进关键帧选择算法在实时性、建图和定位精度方面性能较其他两种算法更好.在加入“当前环形闭合检测空闲或距KeyframeL插入后又经过了z个帧”条件且未删除冗余关键帧时,改进算法中关键帧数量略多于常用关键帧选择算法中的数量.但是在加入删除冗余关键帧的方法后,改进算法中的关键帧的数量就会有所下降.特别是在大规模环境中,基于删除冗余关键帧的改进算法中的关键帧数量更是大幅下降.实验过程中,当可调参数设置不准确时会出现地图重影、定位有奇异值等现象.对于不同的数据集,文中提到的这些参数最优取值范围往往需要通过大量的实验反复测试才能确定.一般情况下,Inliersmin、Dmin和Dmax可以通过相邻两帧图像之间的匹配情况以及算法实际所需精度来确定:Inliersmin越大,Dmin和Dmax的范围越小,关键帧的选取条件就越严格,在一定程度上会提高定位和建图的精度但也会增加系统的计算代价.α表示Framecurr与Framecurr-1之间跟踪到的特征点个数,α越大表明可跟踪的特征点个数越多,两帧图像匹配度越高.由于在Track(Framecurr-1,Framecurr) 之前已经使用常用关键帧选择算法进行了一次关键帧的筛选且还需为后续环节留有足够的候选关键帧,所以此时α在50~100为宜.β表示Framecurr与KeyframeL之间匹配的特征点个数所占KeyframeL特征点个数的比例.β越大表明Framecurr与KeyframeL之间的相关性越高.为了防止关键帧丢失以及满足最小视觉变化原则,β在85%~95%为宜.对于α、β,均不能因精度要求而选择过大,这样不仅会导致候选关键帧数量不足,还会增加计算量,降低算法实时性.设参数d表示帧间间隔空隙.d过小会频繁插入关键帧,在增加计算负荷的同时降低建图的精度甚至出现定位和环形闭合检测错误的现象;d过大则不能充分利用系统资源合理进行计算.一般情况下,d在20~30为宜.设参数k 表示关键帧删除时需检测的关键帧个数,该参数可随着环境规模的增加适当增加.考虑到整个算法的实时性,k在2~4即可满足删除冗余关键帧的需求.本文提出的改进关键帧选择算法不仅在一定程度上解决了常用关键帧选择算法鲁棒性较差、精度较低的问题,还通过删除冗余关键帧的方法减少了关键帧数量.整体上,本文提出的关键帧选择算法在及时、准确地插入关键帧的同时,提高了RGB-D SLAM算法的实时性、建图和定位精度.。
RGB - D斯拉姆数据集和基准(RGB-D SLAM Datasetand Benchmark)数据介绍:We provide a large dataset containing RGB-D data and ground-truth data with the goal to establish a novel benchmark for the evaluation of visual odometry and visual SLAM systems. Our dataset contains the color and depth images of a Microsoft Kinect sensor along theground-truth trajectory of the sensor. The data was recorded at full frame rate (30 Hz) and sensor resolution (640×480). The ground-truth trajectory was obtained from a high-accuracy motion-capture system with eight high-speed tracking cameras (100 Hz). Further, we provide the accelerometer data from the Kinect. Finally, we propose an evaluation criterion for measuring the quality of the estimated camera trajectory of visual SLAM systems.关键词:RGB-D,地面实况,基准,测程,轨迹,RGB-D,ground-truth,benchmark,odometry,trajectory,数据格式:IMAGE数据详细介绍:RGB-D SLAM Dataset and BenchmarkContact: Jürgen SturmWe provide a large dataset containing RGB-D data and ground-truth data with the goal to establish a novel benchmark for the evaluation of visual odometry and visual SLAM systems. Our dataset contains the color and depth images of a Microsoft Kinect sensor along the ground-truth trajectory of the sensor. The data was recorded at full frame rate (30 Hz) and sensor resolution (640×480). The ground-truth trajectory was obtained from a high-accuracy motion-capture system with eight high-speed tracking cameras (100 Hz). Further, we provide the accelerometer data from the Kinect. Finally, we propose an evaluation criterion for measuring the quality of the estimated camera trajectory of visual SLAM systems.How can I use the RGB-D Benchmark to evaluate my SLAM system?1. Download one or more of the RGB-D benchmark sequences (fileformats, useful tools)2. Run your favorite visual odometry/visual SLAM algorithm (for example,RGB-D SLAM)3. Save the estimated camera trajectory to a file (file formats, exampletrajectory)4. Evaluate your algorithm by comparing the estimated trajectory with theground truth trajectory. We provide an automated evaluation tool to help you with the evaluation. There is also an online version of the tool. Further remarksJose Luis Blanco has added our dataset to the mobile robot programming toolkit (MRPT) repository. The dataset (including example code and tools) can be downloaded here.∙If you have any questions about the dataset/benchmark/evaluation/file formats, please don't hesitate to contact Jürgen Sturm.∙We are happy to share our data with other researchers. Please refer to the respective publication when using this data.Related publications2011Conference and Workshop PapersReal-Time Visual Odometry from Dense RGB-D Images (F. Steinbruecker, J. Sturm, D. Cremers), In Workshop on Live Dense Reconstruction with Moving Cameras at the Intl. Conf. on Computer Vision (ICCV), 2011. [bib] [pdf] Towards a benchmark for RGB-D SLAM evaluation (J. Sturm, S. Magnenat, N. Engelhard, F. Pomerleau, F. Colas, W. Burgard, D. Cremers, R. Siegwart), In Proc. of the RGB-D Workshop on Advanced Reasoning with Depth Cameras at Robotics: Science and Systems Conf. (RSS), 2011. [bib] [pdf] [pdf]Real-time 3D visual SLAM with a hand-held camera (N. Engelhard, F. Endres, J. Hess, J. Sturm, W. Burgard), In Proc. of the RGB-D Workshop on 3D Perception in Robotics at the European Robotics Forum, 2011. [bib] [pdf] [video] [video] [video]File FormatsWe provide the RGB-D datasets from the Kinect in the following format:Color images and depth mapsWe provide the time-stamped color and depth images as a gzipped tar file (TGZ).∙The color images are stored as 640×480 8-bit RGB images in PNG format.∙The depth maps are stored as 640×480 16-bit monochrome images in PNG format.∙The color and depth images are already pre-registered using the OpenNI driver from PrimeSense, i.e., the pixels in the color and depthimages correspond already 1:1.∙The depth images are scaled by a factor of 5000, i.e., a pixel value of 5000 in the depth image corresponds to a distance of 1 meter from thecamera, 10000 to 2 meter distance, etc. A pixel value of 0 meansmissing value/no data.Ground-truth trajectoriesWe provide the groundtruth trajectory as a text file containing the translation and orientation of the camera in a fixed coordinate frame. Note that also our automatic evaluation tool expects both the groundtruth and estimated trajectory to be in this format.∙Each line in the text file contains a single pose.∙The format of each line is 'timestamp tx ty tz qx qy qz qw'∙timestamp (float) gives the number of seconds since the Unix epoch.∙tx ty tz (3 floats) give the position of the optical center of the color camera with respect to the world origin as defined by the motion capture system.∙qx qy qz qw (4 floats) give the orientation of the optical center of the color camera in form of a unit quaternion with respect to the world origin as defined by the motion capture system.∙The file may contain comments that have to start with ”#”.Intrinsic Camera Calibration of the KinectThe Kinect has a factory calibration stored onboard, based on a high level polynomial warping function. The OpenNI driver uses this calibration for undistorting the images, and for registering the depth images (taken by the IR camera) to the RGB images. Therefore, the depth images in our datasets are reprojected into the frame of the color camera, which means that there is a 1:1 correspondence between pixels in the depth map and the color image.The conversion from the 2D images to 3D point clouds works as follows. Note that the focal lengths (fx/fy), the optical center (cx/cy), the distortion parameters (d0-d4) and the depth correction factor are different for each camera. The Python code below illustrates how the 3D point can be computed from the pixel coordinates and the depth value:fx = 525.0 # focal length xfy = 525.0 # focal length ycx = 319.5 # optical center xcy = 239.5 # optical center yds = 1.0 # depth scalingfactor = 5000 # for the 16-bit PNG files# OR: factor = 1 # for the 32-bit float images in the ROS bag filesfor v in range(depth_image.height):for u in range(depth_image.width):Z = (depth_image[v,u] / factor) * ds;X = (u - cx) * Z / fx;Y = (v - cy) * Z / fy;Note that the above script uses the default (uncalibrated) intrinsic parameters. The intrinsic parameters for the Kinects used in the fr1 and fr2 dataset are as follows:Calibration of the color cameraWe computed the intrinsic parameters of the RGB camera from thergbd_dataset_freiburg1/2_rgb_calibration.bag.Camera fx fy cx cy d0 d1 d2 d3 d4(ROS525.0 525.0 319.5 239.5 0.0 0.0 0.0 0.0 0.0 default)Freiburg 1517.3 516.5 318.6 255.3 0.2624 -0.9531 -0.0054 0.0026 1.1633 RGBFreiburg 2520.9 521.0 325.1 249.7 0.2312 -0.7849 -0.0033 -0.0001 0.9172 RGBCalibration of the depth imagesWe verified the depth values by comparing the reported depth values to the depth estimated from the RGB checkerboard. In this experiment, we found that the reported depth values from the Kinect were off by a constant scaling factor, as given in the following table:Camera dsFreiburg 1 Depth 1.035Freiburg 2 Depth 1.031Calibration of the infrared cameraWe also provide the intrinsic parameters for the infraredcamera. Note that the depth images provided in our dataset are alreadypre-registered to the RGB images. Therefore, rectifying the depth images based on the intrinsic parameters is not straight forward.Camera fx fy cx cy d0 d1 d2 d3 d4 Freiburg 1 IR591.1 590.1 331.0 234.0 -0.0410 0.3286 0.0087 0.0051 -0.5643Freiburg 2 IR580.8 581.8 308.8 253.0 -0.2297 1.4766 0.0005 -0.0075 -3.4194 Movies for visual inspectionFor visual inspection of the individual datasets, we also provide movies of the Kinect (RGB and depth) and of an external camcorder. The movie format is mpeg4 stored in an AVI container.Alternate file formatsROS bagFor people using ROS, we also provide ROS bag files that contain the color images, monochrome images, depth images, camera infos, point clouds and transforms – including the groundtruth transformation from the /world frame all in a single file. The bag files (ROS diamondback) contain the following message topics:∙/camera/depth/camera_info (sensor_msgs/CameraInfo) contains the intrinsic camera parameters for the depth/infrared camera, asreported by the OpenNI driver∙/camera/depth/image (sensor_msgs/Image) contains the depth map ∙/camera/rgb/camera_info (sensor_msgs/CameraInfo) contains the intrinsic camera parameters for the RGB camera, as reported by theOpenNI driver∙/camera/rgb/image_color (sensor_msgs/Image) contains the color image from the RGB camera∙/imu (sensor_msgs/Imu), contains the accelerometer data from the Kinect∙/tf (tf/tfMessage), contains:o the ground-truth data from the mocap (/world to /Kinect)o the calibration betwenn mocap and the optical center of the Kinect's color camera (/Kinect to /openni_camera),o and the ROS-specific, internal transformations (/openni_camera to /openni_rgb_frame to /openni_rgb_optical_frame).If you need the point clouds and monochrome images, you can use the adding_point_clouds_to_ros_bag_files script to add them:∙/camera/rgb/image_mono (sensor_msgs/Image) contains the monochrome image from the RGB camera∙/camera/rgb/points (sensor_msgs/PointCloud2) contains the colored point clouds/camera/depth/points (sensor_msgs/PointCloud2) contains the point cloudMobile Robot Programming Toolkit (MRPT)Jose Luis Blanco has added our dataset to the mobile robot programming toolkit (MRPT) repository. The dataset (including example code and tools) can be downloaded hereUseful tools for the RGB-D benchmarkWe provide a set of tools that can be used to pre-process the datasets and to evaluate the SLAM/tracking results. The scripts can be downloaded here.To checkout the repository using subversion, runsvn checkouthttps://svncvpr.in.tum.de/cvpr-ros-pkg/trunk/rgbd_benchmark/rgbd_benchmar k_toolsAssociating color and depth imagesThe Kinect provides the color and depth images in an un-synchronized way. This means that the set of time stamps from the color images do not intersect with those of the depth images. Therefore, we need some way of associating color images to depth images.For this purpose, you can use the ''associate.py'' script. It reads the time stamps from the rgb.txt file and the depth.txt file, and joins them by finding the best matches.usage: associate.py [-h] [--first_only] [--offset OFFSET][--max_difference MAX_DIFFERENCE]first_file second_fileThis script takes two data files with timestamps and associates them positional arguments:first_file first text file (format: timestamp data)second_file second text file (format: timestamp data)optional arguments:-h, --help show this help message and exit--first_only only output associated lines from first file--offset OFFSET time offset added to the timestamps of the second file(default: 0.0)--max_difference MAX_DIFFERENCEmaximally allowed time difference for matching entries(default: 0.02)EvaluationAfter estimating the camera trajectory of the Kinect and saving it to a file, we need to evaluate the error in the estimated trajectory by comparing it with the ground-truth. There are different error metrics. Two prominent methods is the absolute trajectory error (ATE) and the relative pose error (RPE). The ATE is well-suited for measuring the performance of visual SLAM systems. In contrast, the RPE is well-suited for measuring the drift of a visual odometry system, for example the drift per second.For both metrics, we provide automated evaluation scripts that can be downloaded here. Note that there is also an online version available on our website. Both trajectories have to be stored in a text file (format: 'timestamp tx ty tz qx qy qz qw', more information). For comparison, we offer a set of trajectories from RGBD-SLAM.Absolute Trajectory Error (ATE)The absolute trajectory error directly measures the difference between points of the true and the estimated trajectory. As a pre-processing step, we associate the estimated poses with ground truth poses using the timestamps. Based on this association, we align the true and the estimated trajectory using singular value decomposition. Finally, we compute the difference between each pair of poses, and output the mean/median/standard deviation of these differences. Optionally, the script can plot both trajectories to a png or pdf file. usage: evaluate_ate.py [-h] [--offset OFFSET] [--scale SCALE][--max_difference MAX_DIFFERENCE] [--save SAVE][--save_associations SAVE_ASSOCIATIONS][--plot PLOT][--verbose]first_file second_fileThis script computes the absolute trajectory error from the ground truthtrajectory and the estimated trajectory.positional arguments:first_file first text file (format: timestamp tx ty tz qx qy qzqw)second_file second text file (format: timestamp tx ty tz qx qy qzqw)optional arguments:-h, --help show this help message and exit--offset OFFSET time offset added to the timestamps of the second file(default: 0.0)--scale SCALE scaling factor for the second trajectory (default:1.0)--max_difference MAX_DIFFERENCEmaximally allowed time difference for matching entries(default: 0.02)--save SAVE save aligned second trajectory to disk (format: stamp2x2 y2 z2)--save_associations SAVE_ASSOCIATIONSsave associated first and aligned second trajectory todisk (format: stamp1 x1 y1 z1 stamp2 x2 y2 z2)--plot PLOT plot the first and the aligned second trajectory to animage (format: png)--verbose print all evaluation data (otherwise, only the RMSEabsolute translational error in meters after alignmentwill be printed)Relative Pose Error (RPE)For computing the relative pose error, we provide a script ''evaluate_rpe.py''. This script computes the error in the relative motion between pairs of timestamps. By default, the script computes the error between all pairs of timestamps in the estimated trajectory file. As the number of timestamp pairs in the estimated trajectory is quadratic in the length of the trajectory, it can make sense to downsample this set to a fixed number (–max_pairs). Alternatively, one can choose to use a fixed window size (–fixed_delta). In this case, each pose in the estimated trajectory is associated with a later pose according to the window size (–delta) and unit (–delta_unit). This evaluation technique is useful for estimating the drift.usage: evaluate_rpe.py [-h] [--max_pairs MAX_PAIRS] [--fixed_delta][--delta DELTA] [--delta_unit DELTA_UNIT][--offset OFFSET] [--scale SCALE] [--save SAVE][--plot PLOT] [--verbose]groundtruth_file estimated_fileThis script computes the relative pose error from the ground truth trajectory and the estimated trajectory.positional arguments:groundtruth_file ground-truth trajectory file (format: "timestamp tx tytz qx qy qz qw")estimated_file estimated trajectory file (format: "timestamp tx ty tzqx qy qz qw")optional arguments:-h, --help show this help message and exit--max_pairs MAX_PAIRSmaximum number of pose comparisons (default: 10000,set to zero to disable downsampling)--fixed_delta only consider pose pairs that have a distance of deltadelta_unit (e.g., for evaluating the drift persecond/meter/radian)--delta DELTA delta for evaluation (default: 1.0)--delta_unit DELTA_UNITunit of delta (options: 's' for seconds, 'm' formeters, 'rad' for radians, 'f' for frames; default:'s')--offset OFFSET time offset between ground-truth and estimatedtrajectory (default: 0.0)--scale SCALE scaling factor for the estimated trajectory (default:1.0)--save SAVE text file to which the evaluation will be saved(format: stamp_est0 stamp_est1 stamp_gt0stamp_gt1trans_error rot_error)--plot PLOT plot the result to a file (requires --fixed_delta,output format: png)--verbose print all evaluation data (otherwise, only the meantranslational error measured in meters will beprinted)Generating a point cloud from imagesThe depth images are already registered to the color images, so the pixels in the depth image already correspond one-to-one to the pixels in the color image. Therefore, generating colored point clouds is straight-forward. An example script is available in ''generate_pointcloud.py'', that takes a color image and a depth map as input, and generates a point cloud file in the PLY format. This format can be read by many 3D modelling programs, for example meshlab. You can download meshlab for Windows, Mac and Linux.usage: generate_pointcloud.py [-h] rgb_file depth_file ply_fileThis script reads a registered pair of color and depth images and generates a colored 3D point cloud in the PLY format.positional arguments:rgb_file input color image (format:png)depth_file input depth image (format: png)ply_file output PLY file (format: ply)optional arguments:-h, --help show this help message and exitAdding point clouds to ROS bag filesOn the download page, we already provide ROS bag files with added point clouds for the datasets for visual inspection in RVIZ. Because of the large size of the resulting files, we downsampled these bag files to 2 Hz. In case that you want to generate ROS bag files that contain the point clouds for all images (at 30 Hz), you can use the ''add_pointclouds_to_bagfile.py'' script.usage: add_pointclouds_to_bagfile.py [-h] [--start START][--duration DURATION] [--nth NTH][--skip SKIP] [--compress]inputbag [outputbag]This scripts reads a bag file containing RGBD data, adds the corresponding PointCloud2 messages, and saves it again into a bag file. Optional argumentsallow to select only a portion of the original bag file.positional arguments:inputbag input bag fileoutputbag output bag fileoptional arguments:-h, --help show this help message and exit--start START skip the first N seconds of input bag file (default:0.0)--duration DURATION only process N seconds of input bag file (default: off)--nth NTH only process every N-th frame of input bag file(default: 15)--skip SKIP skip N blocks in the beginning (default: 1)--compress compress output bag fileVisualizing the datasets in RVIZRVIZ is the standard visualization tool in ROS. It can be easily adapted to display many different messages. In particular, it can be used to display the point clouds from a ROS bag file. For this, run (in three different consoles) roscorerosrun rviz rvizrosbag play rgbd_dataset_freiburg1_xyz-2hz-with-pointclouds.bagIf this is the first launch, you will have to enable the built-in displays (Menu –> Plugins –> Check “Loaded” for the builtin plugins). In the displays tab, set the “fixed frame” to ”/world”. Click on “Add”, and select the PointCloud2 display, and set topic to ”/camera/rgb/points”. To show the colors, change “color transformer” to “RGB8” in the point cloud display and the “style”to “points”. If you want, you can set the decay time to a suitable value, for example 5 seconds, to accumulate the points in the viewer as they come in. The result should then look as follows:数据预览:点此下载完整数据集。