Validation of coastal sea and lake surface temperature measurements derived from NOAAAVHRR
- 格式:pdf
- 大小:453.56 KB
- 文档页数:19
TPO-9Colonizing the Americas via the Northwest CoastIt has long been accepted that the Americas were colonized by a migrationof peoples from Asia, slowly traveling across a land bridge called Beringia (nowthe Bering Strait between northeastern Asia and Alaska) during the last Ice Age.The first water craft theory about this migration was that around 11,000-12,000years ago there was an ice-free corridor stretching from eastern Beringia to theareas of North America south of the great northern glaciers. It was thismidcontinental corridor between two massive ice sheets–the Laurentide to theeast and the Cordilleran to the west–that enabled the southward migration. Butbelief in this ice-free corridor began to crumble when paleoecologist GlenMacDonald demonstrated that some of the most important radiocarbon datesused to support the existence of an ice-free corridor were incorrect. Hepersuasively argued that such an ice-free corridor did not exist until much later,when the continental ice began its final retreat.Support is growing for the alternative theory that people using watercraft, possibly skin boats, moved southward from Beringia along the Gulf of Alaska and then southward along the Northwest coast of North America possibly as early as 16,000 years ago. This route would have enabled humans to enter southern areas of the Americas prior to the melting of the continental glaciers. Until the early 1970s,most archaeologists did not consider the coast a possible migration route into the Americas because geologists originally believed that during the last Ice Age the entire Northwest Coast was covered by glacial ice. It had been assumed that the ice extended westward from the Alaskan/Canadian mountains to the very edge of the continental shelf, the flat, submerged part of the continent that extends into the ocean. This would have created a barrier of ice extending from the Alaska Peninsula, through the Gulf of Alaska and southward along the Northwest Coast of north America to what is today the state of Washington.The most influential proponent of the coastal migration route has been Canadian archaeologist Knut Fladmark. He theorized that with the use of watercraft, people gradually colonized unglaciated refuges and areas along the continental shelf exposed by the lower sea level. Fladmark’s hypothesis rece ived additional support from the fact that the greatest diversity in native American languages occurs along the west coast of the Americas, suggesting that this region has been settled the longest.More recent geologic studies documented deglaciation and the existence of ice-free areas throughout major coastal areas of British Columbia, Canada, by 13,000 years ago. Research now indicates that sizable areas of southeastern Alaska along the inner continental shelf were not covered by ice toward the end ofthe last Ice Age. One study suggests that except for a 250-mile coastal area between southwestern British Columbia and Washington State, the Northwest Coast of North America was largely free of ice by approximately 16,000 years ago. Vast areas along the coast may have been deglaciated beginning around 16,000 years ago, possibly providing a coastal corridor for the movement of plants, animals, and humans sometime between 13,000 and 14,000 years ago.The coastal hypothesis has gained increasing support in recent years because the remains of large land animals, such as caribou and brown bears, have been found in southeastern Alaska dating between 10,000 and 12,500 years ago. This is the time period in which most scientists formerly believed the area to be inhospitable for humans. It has been suggested that if the environment were capable of supporting breeding populations of bears, there would have been enough food resources to support humans. Fladmark and other believe that the first human colonization of America occurred by boat along the Northwest Coast during the very late Ice Age, possibly as early as 14,000 years ago. The most recent geologic evidence indicates that it may have been possible for people to colonize ice-free regions along the continental shelf that were still exposed by the lower sea level between13,000 and 14,000 years ago.The coastal hypothesis suggests an economy based on marine mammal hunting, saltwater fishing, shellfish gathering, and the use of watercraft. Because of the barrier of ice to the east, the Pacific Ocean to the west, and populated areas to the north, there may have been a greater impetus for people to move in a southerly direction.Paragraph 1: It has long been accepted that the Americas were colonized by a migration of peoples from Asia, slowly traveling across a land bridge called Beringia (now the Bering Strait between northeastern Asia and Alaska) during the last Ice Age. The first water craft theory about this migration was that around 11,000-12,000 years ago there was an ice-free corridor stretching from eastern Beringia to the areas of North America south of the great northern glaciers. It was this midcontinental corridor between two massive ice sheets–the Laurentide to the east and the Cordilleran to the west–that enabled the southward migration. But belief in this ice-free corridor began to crumble when paleoecologist Glen MacDonald demonstrated that some of the radiocarbon dates used to support the existence of an ice-free corridor wereincorrect. argued that such an ice-free corridor did not exist until much later, when the continental ice began its final retreat.1. According to paragraph 1, the theory that people first migrated to the Americans by way of an ice-free corridor was seriously called into question by○paleoecologist Glen MacDonald's argument that the original migration occurred much later than had previously been believed○the demonstration that certain previously accepted radiocarbon dates were incorrect○evidence that the continental ice began its final retreat much later than had previously been believed○research showing that the ice-free corridor was not as long lasting as had been widely assumedin the passage is closest in meaning to○aggressively○inflexibly○convincingly○carefullyParagraph 2: Support is growing for the alternative theory that people using watercraft, possibly skin boats, moved southward from Beringia along the Gulf of Alaska and then southward along the Northwest coast of North America possibly as early as 16,000 years ago. This route would have enabled humans toenter southern areas of the Americas the melting of the continental glaciers. Until the early 1970s,most archaeologists did not consider the coast a possible migration route into the Americas because geologists originally believed that during the last Ice Age the entire Northwest Coast was covered by glacial ice. It had been assumed that the ice extended westward from the Alaskan/Canadian mountains to the very edge of the continental shelf, the flat, submerged part of the continent that extends into the ocean. This would have created a barrier of ice extending from the Alaska Peninsula, through the Gulf of Alaska and southward along the Northwest Coast of north America to what is today the state of Washington.3. Paragraph 2 begins by presenting a theory and then goes on to○discuss why the theory was rapidly accepted but then rejected○present the evidence on which the theory was based○cite evidence that now shows that the theory is incorrect○explain why the theory was not initially considered plausibleis closest in meaning to○before○immediately after○during○in spite of5. Paragraph 2 supports the idea that, before the 1970s, most archaeologists held which of the following views about the earliest people to reach the Americas?○They could not have sailed directly from Beringia to Alaska and then southward because, it was thought, glacial ice covered the entire coastal region.○They were not aware that the climate would continue to become milder.○They would have had no interest in migrating southward from Beringia until after t he continental glaciers had begun to melt.○They lacked the navigational skills and appropriate boats needed long-distance trips.Paragraph 3: The most influential proponent of the coastal migration route has been Canadian archaeologist Knut Fladmark. He theorized that with the use of watercraft, people gradually colonizedthe passage? Incorrect choices change the meaning in important ways to leave out essential information.○Because this region has been settled the longest, it also displays the greatest diversity in Native American languages.○Fladmark's hypothesis states that the west coast of the Americas has been settled longer than any other region.○The fact that the greatest diversity of Native American languages occurs along the west coast of the Americans lends strength to Fradmark's hypothesis.○According to Fladmark, Native American languages have survived the longest along the west coast of the Americas.Paragraph 4: More recent geologic studies documented deglaciation and the existence of ice-free areas throughout major coastal areas of British Columbia, Canada, by 13,000 years ago. Research now indicates that sizable areas of southeastern Alaska along the inner continental shelf were not covered by ice toward the end of the last Ice Age. One study suggests that except for a 250-mile coastal area between southwestern British Columbia and Washington the Northwest Coast of North America was largelyfree of ice by approximately 16,000 years areas along the coast may have been deglaciated beginning around 16,000 years ago, possibly providing a coastal corridor for the movement of plants, animals, and humans sometime between 13,000 and 14,000 years ago.7. The author's purpose in paragraph 4 is to○indicate that a number of recent geologic studies seem to provide support for the coastal hypothesis○indicate that c oastal and inland migrations may have happened simultaneously○explain why humans may have reached America's northwest coast before animals and plants did○show that the coastal hypothesis may explain how people first reached Alaska but it cannot explain how people reached areas like modern British Columbia and Washington State○Frozen○Various○Isolated○HugeParagraph 5: The coastal hypothesis has gained increasing support in recent years because the remains of large land animals, such as caribou and brown bears, have been found in southeastern Alaskadating between 10,000 and 12,500 years ago. This is the time period in which most scientists formerlyof supporting breeding populations of bears, there would have been enough food resources to support humans. Fladmark and other believe that the first human colonization of America occurred by boat along the Northwest Coast during the very late Ice Age, possibly as early as 14,000 years ago. The most recent geologic evidence indicates that it may have been possible for people to colonize ice-free regions along the continental shelf that were still exposed by the lower sea level between13,000 and 14,000 years ago.9. According to paragraph 5, the discovery of the remains of large land animals supports the coastal hypothesis by providing evidence that○humans were changing their hunting techniques to adapt to coastal rather than inland environments ○animals had migrated from the inland to the coasts, an indication that a midcontinental ice-free corridor was actually implausible○humans probably would have been able to find enough resources along the coastal corridor○the continental shelf was still exposed by lower sea levels during the period when the southward migration of people began○not familiar○not suitable○not dangerous○not reachable11. According to paragraph 5, the most recent geologic research provides support for a first colonization of America dating as far back as○16,000 years ago○14,000 years ago○12,500 years ago○10,000 years agoParagraph 6: The coastal hypothesis suggests an economy based on marine mammal hunting,move in a southerly direction.in the passage is closest in meaning to○chance○protection○possibility○incentiveParagraph 1: It has long been accepted that the Americas were colonized by a migration of peoples from Asia, slowly traveling across a land bridge called Beringia (now the Bering Strait between northeastern Asia and Alaska) during the last Ice A ge. ■The first water craft theory about the migration was that around 11,000-12,000 years ago there was an ice-free corridor stretching from eastern Beringia to the areas of North America south of the great northern glaciers. It was the midcontinental corridor between two massive ice sheets-the Laurentide to the west-that enabled the southward migration. ■But belief in this ice-free corridor began to crumble when paleoecologist Glen MacDonald demonstrated that some of the most important radiocarbon dates used to support the existence of an ice-free corridor were incorrect. ■He persuasively argued that such an ice-free corridor did not exist until much later, when the continental ice began its final retreat. ■13. Look at the four squares [■] that indicate where the following sentence could be added to the passage.Moreover, other evidence suggests that even if an ice-free corridor did exist, it would have lacked the resources needed for human colonization.Where could the sentence best fit?14. Directions:An introductory sentence for a brief summary of the passage is provided below. Complete the summary by selecting the THREE answer choices that express the most important ideas in the passage. Some answer choices do not belong in the summary because they express ideas that are not presented in the passage or are minor ideas in the passage. This question is worth 2 points.Recent evidence favors a rival to the long-standing theory that the Americas were colonized 11,000-12,000 years ago by people migrating south from Beringia along a midcontinental ice-free corridor.●●●Answer Choices○Evidence that an ice-free corridor between two ice sheets developed when the continental ice first began to melt came primarily from radiocarbon dating.○There is growing support for the theory that migration took place much earlier, by sea, following a coastal route along Alaska and down the northwest coast.○Recent geologic evide nce indicates that contrary to what had been believed, substantial areas along the coast were free of ice as early as 16,000 years ago.○Research now indicates that the parts of the inner continental shelf that remained covered with ice were colonized by a variety of early human groups well adapted to living in extremely cold environments.○There is evidence suggesting that areas along the coast may have contained enough food resources between 13,000 and 14,000 years ago to have made human colonization possible.○Even though the northern part of the continent allowed for a more varied economy, several earlyhuman groups quickly moved south.参考答案:1. ○22. ○33. ○44. ○15. ○16. ○37. ○18.○49. ○310. ○211. ○212. ○413. ○414. There is growing support…Recent geologic evidence…There is evidence suggesting…。
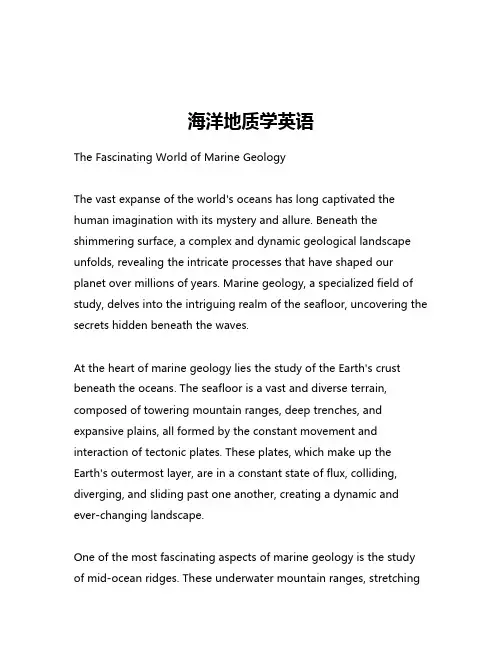
海洋地质学英语The Fascinating World of Marine GeologyThe vast expanse of the world's oceans has long captivated the human imagination with its mystery and allure. Beneath the shimmering surface, a complex and dynamic geological landscape unfolds, revealing the intricate processes that have shaped our planet over millions of years. Marine geology, a specialized field of study, delves into the intriguing realm of the seafloor, uncovering the secrets hidden beneath the waves.At the heart of marine geology lies the study of the Earth's crust beneath the oceans. The seafloor is a vast and diverse terrain, composed of towering mountain ranges, deep trenches, and expansive plains, all formed by the constant movement and interaction of tectonic plates. These plates, which make up the Earth's outermost layer, are in a constant state of flux, colliding, diverging, and sliding past one another, creating a dynamic and ever-changing landscape.One of the most fascinating aspects of marine geology is the study of mid-ocean ridges. These underwater mountain ranges, stretchingfor thousands of kilometers across the ocean basins, are the sites of intense volcanic and tectonic activity. Here, new oceanic crust is continuously being formed as molten rock rises from the Earth's mantle and solidifies, pushing the existing crust outward and creating new seafloor. This process, known as seafloor spreading, is a fundamental driver of plate tectonics, the grand theory that explains the movement and interaction of the Earth's plates.As the plates move away from the mid-ocean ridges, they gradually cool and become denser, eventually sinking back into the Earth's mantle at deep ocean trenches. This subduction process is responsible for the formation of some of the most dramatic features of the seafloor, including the towering volcanoes of the Pacific "Ring of Fire" and the deep, narrow trenches that plunge thousands of meters below the surface.But the seafloor is not just a passive canvas upon which these tectonic processes play out. It is a dynamic and ever-changing environment, home to a diverse array of geological features and processes. Underwater landslides, turbidity currents, and other sedimentary processes shape the seafloor, creating a complex and ever-evolving landscape.One of the most remarkable aspects of marine geology is the wealth of information it can provide about the Earth's past. By studying thesediments and rock formations on the seafloor, scientists can piece together a detailed record of the planet's history, from ancient climate changes to the evolution of life. The seafloor acts as a vast natural archive, preserving a wealth of data that can help us better understand the complex and ever-changing nature of our planet.In recent years, advances in technology have revolutionized the field of marine geology. Sophisticated sonar and mapping systems, remotely operated vehicles, and deep-sea drilling platforms have allowed scientists to explore the seafloor in unprecedented detail, revealing a world of wonders that was once hidden from view.As we continue to unravel the mysteries of the ocean floor, the field of marine geology promises to yield even more fascinating insights into the workings of our dynamic planet. From the towering mid-ocean ridges to the deep, mysterious trenches, the seafloor is a vast and complex landscape that holds the key to understanding the past, present, and future of our world.。

Mount St. Helens erupted on May 18, 1980. A cloud of hot rock and gas surged northward from its collapsing slope. The cloud devastated more than 500 square kilometers of forests and lakes. The effects of Mount St. Helens were well documented with geophysical instruments. The origin of the eruption is not well understood. V olcanic explosions are driven by a rapid expansion of steam. Some scientists believe the steam comes from groundwater heated by the magma. Other scientists believe the steam comes from water originally dissolved in the magma. W e need to understand the source of steam in volcanic eruptions. W e need to determine how much water the magma contains. (110)Mount St. Helens erupted on May 18, 1980. Its slope collapsing, the mountain emitted a cloud of hot rock and gas. In minutes, the cloud devastated more than 500 square kilometers of forests and lakes. Although the effects of the eruption were well documented, the origin is not well understood. V olcanic explosions are driven by a rapid expansion of steam. Recently, debate has arisen over the source for the steam. Is it groundwater heated by magma or water originally dissolved in the magma itself? To understand the source of steam in volcanic eruptions, we need to determine how much water the magma contains. (103)Effective SentencesCorrectness alone cannot make a good sentence. It has to be effective at the same time. Effective sentences have some or all of the following qualities:Unity, coherence, conciseness, emphasis and variety.1.Unity:referring to two qualities—there is only one main idea; and the idea is complete.Avoid ambiguity and fragments. Be logic.This does not mean that all sentences have to be short and simple. It is often necessary to write long sentences with many parts in it. It expresses a central idea supported or modified by various subordinate ideas, and/or more related parallel ideas.e.g. Everyone studies English in this school.___ Everyone in this school studies English.Here is a short sentence:Born in Sichuan Province, he later became a famous writer.This sentence can be said correct, but it is not a good sentence for the two facts mentioned are not logically connected. Hence we can changed into:He was born in Sichuan Province and began to work as a teacher when he graduated from university. He liked to write stories in his spare time and published many of his works in new spapers and magazines. Later he became a famous writer.(Here the meaning is clear by something about his work experience that may help make him famous.)Faulty: Du Fu was one of the greatest poets. (A)Revised: Du Fu was one of the greatest poets of the Tang Dynasty. (B) (her e the last part makes the sentence clear. Or sentence (A )may cause ambiguity. At least is not complete, not telling time or country)2.Coherence:meaning clear and correct arrangement of the parts of a sentence.1. A coherent sentence is easy to understand and its meaning cannot be mistakenbecause its connection between its words conforms to grammar rules and usage. An incoherent sentence is often hard to understand and may be interpreted in different ways.Here are some rules that may help prevent the incoherence:(1)Do not separate words that are closely related unless it is necessary;e.g. a).the funny cartoon attracts the reader’s eye on the cover of the magazine.b). the doctor promised on her way to her hospital to come and see her(2)Do not use a pronoun with ambiguous reference;e.g. Mrs Green said to her sister that she had done the right thing. (meaningMrs Green or sister?)(3)Do not a dangling modifier or put a modifier far from the word it modifies;e.g. a) Looking out of the window, only dull grey can be seen.b)After studying lesson T en, the mid-term test was given to us.(4)Do not make unnecessary or confusing shifts in person or number;e.g. a). Those who wants t join the chorus should sign your name on this sheetof paper.b) He looked up difficult words in his dictionaries, and it is very helpful.(5)Do not make unnecessary changes in the voice, tense or mood of verbs;e.g.(6)Do not use different forms to express parallel ideas.e.g. a) It is generally believed that one’s action is more important than whatone says. The young man is honest and hardworking, and is a very reliableworker.b) This composition is quite good as far as the use of language isconcerned, but its content is poor.then they can be changed into;a. It is generally believed that one’s action is more important than one’s words. The youngman is an honest, hardworking and reliable worker. Or: … the young man is honest, hardworking and reliable.b. this composition is good in language but poor in content. Or: the language of thiscomposition is good but its content is rather poor.In short, coherence is essential to the accurate and clear expression of ideas. It is advisable to read the sentences we have written and see if they are coherent and make necessary changed when needed.3.Conciseness:using only the necessary words, or as few words as possible, to express the full meaning.e.g.i.There are trees on all sides of the house, and the trees hide the house. Peoplehardly see the house from the outside. (conciseness)ii.Surrounded by trees, the house The house can hardly been seen from the outside.4.Emphasis:ways to emphasize certain words or phrases –placing (end or beginning); climatic sequence; the use of verbs in the active voice (more emphatic); Subordination (to stress the main idea); repetition of the important words; short sentences; balance sentences; periodic sentences, negative-positive statement and rhetorical questions (not asked for the answers).Cf.She made a decision that she would not take the job. – she decided not to take the job.A plane is wheeling over the big city, producing a big noise that surprised theinhabitants.5.V ariety:varying sentence structure and mixing short and long, simple and complex, and loose and periodic sentences so long as the meaning is properly expressed.e.ga)He was born in a small village. His father was a teacher in the village school. His mother didthe housework. H e began to go to his father’s school at seven. He graduated from it six years later. Then he went to the junior middle school in a nearby town.He studied at a senior middle school in the county seat. He was a good student there. He got good marks at the college entrance examinations. He enrolled in a university in the provincial capital. He studied civil engineering there. He wanted to build a highway for his home village in future. He loved his village very much. (monotonous)He was born in a small village. His father taught at the village school and his mother did the housework. He began to study in his father’s school at seven and six years later he went to the junior middle school in a nearby town. After graduating from it he entered a senior middle school at the county seat, where he was a good student and ranked in the first class. He took the national college entrance examinations and was admitted to a university in the provincial capital. As he majored in civil engineering, he wished to build a highway for his home village in future, which he loved very much.b)In this article we look at a general policy-based architecture that can be used to simplify several new technologies emerging in the context of IP networks. We explain how network administration can be simplified by defining two levels of policies.We discuss how business-level policies are validated and transformed.We then show how to apply this architecture to two areas: managing performance service level agreement, and supporting enterprise extranets using IPSec communication.(70)This paper first gives an overview of a general policy-based architecture adopted to simplify several new technologies in the context of IP networks.Then it explains the simplification of the network administration by defining two levels of policies and discusses the validation and transformation of the business-level policies. Finally, the architecture is applied to manage performance service level agreement and support enterprise extranets using IPSec communication.(66)Concisenesse non-finites to replace a clause1)In addition to bank loan in the Eurodollar market, Bell South can consider that thecompany uses a domestic loan.__ In addition to bank loan in the Eurodollar market, Bell South can consider usinga domestic loan.2)If you look car efully, you will discover even more ways to shorten the sentenceswithout changing their meaning.___ Looking carefully, you will discover even more ways to shorten thee replacement of attributes1)The precision of the experiment was affected by the noise of the engine nearby.__ The precision of the experiment was affected by the nearby engine noise.Communications satellitesNoun modifierA research on/of/in business managementA business management researchGovernment policy/decisionManagement decisione adverbs1)It is admitted that our university is one of the largest geology research center inChina.-- Our university is admittedly one of the largest geology research center in China.It is reported that… ReportedlyIt is clear that… Clearlye nouns or noun phrases1)The density of water at 400C is the greatest.⏹The greatest water density is at 400C.2)Due to the fact that the direct measurements of the radial current distributioncannot be performed at present, it is therefore complicated to describe in a detailedway the current build-up period for large machines like ours.To describe current build-up, complicated,Reason; cannot perform direct measurement⏹It is complicated to describe in detail the current build-up period for largemachines like ours due to impossible performance of the dir ectmeasurements of the radial current distribution at present.⏹The detailed description of the current build-up period for large machineslike ours is complicated due to the lack of the direct measurements of theradial current distribution at present.We began the experiment and hoped t hat the experiment could be successful.⏹We began the experiment and hoped/expected to finish the experiment (it)successfully.⏹We began the experiment and hoped for its success.⏹We began the experiment and hope it could be successful.⏹We began the hoped successful experiment⏹We began the experiment, hoping it successful.⏹We began the experiment, expecting it to be successful.⏹Hopefully, we began with the experiment.⏹We began the experiment in a hope for a success.Convey the main idea / key part of the idea in the shortest possible sentence.e verbs1)The analysis of this method will be undertaken in the following sections.⏹This method will be analyzed in the following sections.2)By the way of piping lines,the crude oil is transmitted from the w ell to therefinery.⏹The crude oil is piped from the w ell to the refinery.⏹Using the pipes, the crude oil is transmitted from the w ell to the refinery.⏹The crude oil is transmitted from the w ell to the refinery by pipes.e adjectives1)He shut himself up reading and did not know what was happening outside.⏹He shut himself up reading, knowing nothing about the outside.⏹He shut himself up reading, unknown Unawar e of (ignoring, uncertain)what was happening outside.7. Use elliptical forms1)Electromagnetic waves, though they ar e invisible to our eyes, do not exist in spaceand reveal the same speed as light waves.⏹Electromagnetic waves, though invisible,do not exist in space and revealthe same speed as light waves.e preposition phrasesMiniaturization of electronic devices would be impossible if ISI had not been invented.-- But for the invention of ISI Miniaturization of electronic devices would be impossible.bulky concisein spite of the fact that although/thoughon a regular basis regularlyin all other cases other wisebring to a consideration considerafford an opportunity to allowin conjunction with within view of the fact that seeing thaton account of the fact that becausea number of severalin regard to about/ concerningin all cases alwaysin order that (in order ) toin hasty manner hastilywith the exception of except (for)…ing elliptical formsSome motions appear to be very simple, others appear very complicated.__ Some motions appear to be very simple, others very complicated.Heat energy can be converted into mechanical energy, and vice versa, mechanical energy can be converted into electrical energy.___ Heat energy can be converted into mechanical energy, and vice versa, mechanical energy into electrical energy.One won’t learn to s wim while he is standing by the pool.__ One won’t learn to swim while standing by the pool.You may do the experiment with us if you want to do it with us.__ You may do the experiment with us if you want toThe rate of nuclear reaction is controlled by insertion of the control rods or removal of the control rods.__ The rate of nuclear reaction is controlled by insertion or removal of the control rods.ing technical termsIn assembling a steel tower, we have adopted a new approach, which is just the contrary of the conventional method – first the main leg and then the cross-arm.__ W e have adopted a new ―head-to-foot‖ approach to assemble a steel tower.ing contracted wordsThe research now being carried out in our laboratory is financially assisted by the United Nations Educational Scientific and Cultural Organization.__ The research now being carried out in our laboratory is financially assisted by the UESCO.We have obtained the data from the earth resources technology satellite.__ W e have obtained the data from ERSTS.11.Deleting redundant expressionsThe time for learning is the time of youth.__ Youth is the time for learning.The teacher can continue to monitor the entire class at the same time that he or she is working with a small group.__ The teacher can continue to monitor the entire class while working with a small group.As far as the study goes on, the result tends to show an approximate relationship between growth rate and dietary intake,__ the result shows a weak relationship between growth rate and dietary intake.At the present time, we use natural 85Rb (72.15%) and natural 87Rb (27.8%) due to the fact that they can be well mixed.__ At present, we use natural 85Rb (72.15%) and natural 87Rb (27.8%) because of their good mixing.。
Fluid-Structure Interaction Fluid-structure interaction (FSI) is a complex and fascinating phenomenon that occurs when the motion of a fluid affects the behavior of a nearby structure, and vice versa. This interaction has significant implications in various engineering and scientific fields, including aerospace, civil engineering, biomechanics, and oceanography. Understanding and effectively managing FSI is crucial for the design and performance of numerous systems and structures. In this response, we will explore the multifaceted nature of FSI, considering its impact, challenges, and potential solutions from different perspectives. From an engineering standpoint, FSI presents both opportunities and challenges. On one hand, harnessing FSI can lead to innovative designs and improved performance in a wide range of applications. For example, in aerospace engineering, FSI considerations arecritical for optimizing the aerodynamic performance of aircraft and spacecraft. By accounting for the interaction between the airflow and the structural components, engineers can develop more efficient and stable designs. Similarly, in civil engineering, understanding FSI is essential for designing resilient structuresthat can withstand the forces exerted by wind, water, or seismic events. By integrating FSI analysis into the design process, engineers can enhance the safety and longevity of infrastructure. However, managing FSI also poses significant challenges. The complex and nonlinear nature of fluid-structure interactions makes accurate prediction and analysis difficult. Engineers and researchers oftengrapple with the intricacies of FSI, including turbulence, boundary layer effects, and structural deformation. These challenges are further compounded in scenarios involving multiphysics phenomena, such as the interaction between fluid flow, heat transfer, and structural dynamics. As a result, there is a pressing need for advanced computational tools, experimental techniques, and theoretical models to improve our understanding and control of FSI. In the realm of scientific research, FSI serves as a rich area of exploration, offering insights into fundamental principles of fluid dynamics and structural mechanics. From studying the biomechanics of human physiology to investigating the behavior of marine ecosystems, FSI phenomena are pervasive in the natural world. For instance, in cardiovascular research, understanding the interaction between blood flow andarterial walls is crucial for diagnosing and treating vascular diseases. By simulating FSI scenarios, scientists can gain a deeper understanding of physiological processes and develop new medical interventions. Moreover, FSI plays a pivotal role in the study of ocean dynamics and environmental phenomena. The interaction between ocean currents, waves, and coastal structures has profound implications for coastal erosion, offshore engineering, and marine ecology. By examining FSI in these contexts, researchers can contribute to the sustainable management of coastal resources and the protection of vulnerable ecosystems. Furthermore, the insights gained from studying FSI in natural systems can inspire innovative solutions for engineering challenges, leading to the development ofbio-inspired designs and technologies. In addressing the complexities of FSI, interdisciplinary collaboration is essential. Engineers, physicists, mathematicians, and computer scientists must work together to develop comprehensive approaches for analyzing and simulating FSI phenomena. Byintegrating expertise from diverse fields, researchers can leverage advanced computational methods, such as finite element analysis, computational fluid dynamics, and coupled multiphysics simulations, to tackle FSI challenges. Furthermore, experimental validation and data-driven approaches are critical for refining FSI models and ensuring their accuracy in real-world scenarios. In conclusion, fluid-structure interaction is a multifaceted and significant aspect of engineering and scientific research. While it presents opportunities for innovation and discovery, it also poses formidable challenges that demand concerted efforts from the research community. By embracing a holistic and collaborative approach, we can advance our understanding of FSI, develop robust computational tools, and unlock new possibilities for designing resilient and efficient systems. Ultimately, the exploration of FSI holds great promise for addressing real-world problems and shaping the future of engineering and science.。
Whales,the gentle giants of the ocean,have been facing a significant decline in their populations over the past few centuries.This essay will explore the various factors contributing to the reduction in whale numbers and the implications of such a decline on the marine ecosystem.Hunting and Whaling:One of the primary reasons for the reduction in whale populations is commercial whaling. For centuries,whales have been hunted for their oil,meat,and baleen.The advent of industrial whaling in the20th century led to a massive increase in the scale of hunting, resulting in the near extinction of some species,such as the blue whale.Despite the International Whaling Commissions moratorium on commercial whaling since1986, some countries continue to hunt whales under the guise of scientific research or cultural traditions,contributing to the ongoing decline.Pollution:Marine pollution is another significant factor affecting whale populations.Chemicals, plastics,and other debris that enter the ocean can have detrimental effects on marine life. Whales can ingest these pollutants,leading to health issues such as digestive problems, entanglement,and even death.Additionally,the accumulation of toxins in the food chain can lead to bioaccumulation,affecting the overall health of the whales.Climate Change:Global climate change has led to shifts in ocean temperatures and currents,which in turn affect the distribution and abundance of the whales prey.Warmer waters can cause krill and other small marine organisms to migrate or change their behavior,making it more challenging for whales to find food.Furthermore,the melting of polar ice caps has led to a reduction in the habitat of icedependent species like the polar bear,indirectly affecting the food chain and the availability of food for whales.Noise Pollution:Underwater noise pollution from shipping,military sonar,and oil and gas exploration is another factor impacting whale populations.This noise can interfere with whales communication,navigation,and feeding behaviors.Some species,like the beaked whale, are particularly sensitive to sonar,which has been linked to mass strandings and deaths. Habitat Destruction:Coastal development and the destruction of marine habitats also play a role in the decline of whale populations.The loss of breeding and feeding grounds can lead to a decrease in reproductive success and overall population health.Additionally,the construction of shipping lanes and offshore structures can lead to increased risk of collisions andentanglements with whales.Conservation Efforts:Despite these challenges,there are ongoing efforts to protect and conserve whale populations.International agreements,such as the Convention on International Trade in Endangered Species of Wild Fauna and Flora CITES,and the establishment of marine protected areas,aim to safeguard habitats and regulate human activities that impact whales.Public awareness campaigns and research initiatives also contribute to the understanding and protection of these magnificent creatures.In conclusion,the reduction in whale populations is a complex issue with multiple contributing factors.It is crucial to address these challenges through a combination of international cooperation,policy changes,and public engagement to ensure the survival and recovery of these iconic marine mammals.。
Coastal Archeology of Britain 雅思阅读阅读短文,回答1-3题。
Coastal Archaeology of BritainThe recognition of the wealth and diversity of England’s coastal archaeology has been one of the most important developments of recent years. Some elements of this enormous resource have long been known. The so-called ‘submerged forests’ off the coasts of England, sometimes with clear evidence of the human activity, had attracted the interest of antiquarians since at least the eighteenth century, but serious and systematic attention has been given to the archaeological potential of the coast only since the early 1980s.It is possible to trace a variety of causes for this concentration of effort and interest. In the 1980s and 1990s scientific research into climate change and its environmental impact spilled over into a much broader public debate as awareness of these issues grew; the prospect of rising sea levels over the next century, and their impact on current coastal environments, has been a particular focus for concern. At the same time archaeologists were beginning to recognize that the destruction caused by natural processes of coastal erosion and by human activity was having an increasing impact on the archaeological resource of the coast.The dominant process affecting the physical form of England in the post- glacial period has been rising in the altitude of sea level relative to the land, as theglaciers melted and the landmass readjusted. The encroachment of the sea, the loss of huge areas of land now under the North Sea and the English Channel, and especially the loss of the land bridge between England and France, which finally made Britain an island, must have been immensely significant factors in the lives of our prehistoric ancestors. Yet the way in which prehistoric communities adjusted to these environmental changes has seldom been a major theme in discussions of the period. One factor contributing to this has been that, although the rise in relative sea level is comparatively well documented, we knowlittle about the constant reconfiguration of the coastline. This was affected by many processes, mostly quite, which have not yet been adequately researched. The detailed reconstruction of coastline histories and the changing environments available for human use will be an important theme for future research.So great has been the rise in sea level and the consequent regression of the coast that much of the archaeological evidence now exposed in the coastal zone. Whether being eroded or exposed as a buried land surface, is derived from what was originally terres-trial occupation. Its current location in the coastal zone is the product of later unrelated processes, and it can tell us little about past adaptations to the sea. Estimates of its significance will need to be made in the context of other related evidence from dry land sites. Nevertheless, its physical environment means that preservation is often excellent, for example in the case of the Neolithic structure excavated at the Stumble in Essex.In some cases these buried land surfaces do contain evidence for human exploitation of what was a coastal environment, and elsewhere along the modem coast there is similar evidence. Where the evidence does relate to past human exploitation of the resources and the opportunities offered by the sea and the coast, it is both diverse and as yet little understood. We are not yet in a position to make even preliminary estimates of answers to such fundamental questions as the extent to which the sea and the coast affected human life in the past, what percentage of the population at any time lived within reach of the sea, or whether human settlements in coastal environments showed a distinct character from those inland.The most striking evidence for use of the sea is in the form of boats, yet we still have much to learn about their production and use. Most of the known wrecks around our coast are not unexpectedly of post-medieval date, and offer an unparalleled opportunity for research which has yet been little used. The prehistoric sewn-plank boats such as those from the Humber estuary and Dover all seem to belong to the second millennium BC; after this there is a gap in the record of a millennium, which cannot yet be explained before boats reappear, butit built using a very different technology. Boatbuilding must have been an extremely important activity around much of our coast, yet we know almost nothing about it. Boats were some of the most complex artefacts produced by pre-modem societies, and further research on their production and use make an important contribution to our understanding of past attitudes to technology and technological change.Boats need landing places, yet here again our knowledge is very patchy. In many cases the natural shores and beaches would have sufficed, leaving little or no archaeological trace, but especially in later periods, many ports and harbors, as well as smaller facilities such as quays, wharves, and jetties, were built. Despite a growth of interest in the waterfront archaeology of some of our more important Roman and medieval towns, very little attention has been paid to the multitude of smaller landing places. Redevelopment of harbor sites and other development and natural pressures along the coast are subject these important locations to unprecedented threats, yet few surveys of such sites have been undertaken.One of the most important revelations of recent research has been the extent of industrial activity along the coast. Fishing and salt production are among the better documented activities, but even here our knowledge is patchy. Many forms of fishing will leave little archaeological trace, and one of the surprises of recent survey has been the extent of past investment in facilities for procuring fish and shellfish. Elaborate wooden fish weirs, often of considerable extent and responsive to aerial photography in shallow water, have been identified in areas such as Essex and the Severn estuary. The production of salt, especially in the late Iron Age and early Roman periods, has been recognized for some time, especially in the Thames estuary and around the Solent and Poole Harbor, but the reasons for the decline of that industry and the nature of later coastal salt working are much less well understood. Other industries were also located along the coast, either because the raw materials outcropped there or for ease of working and transport: mineral resources such as sand, gravel, stone, coal,ironstone, and alum were all exploited. These industries are poorly documented, but their remains are sometimes extensive and striking.Some appreciation of the variety and importance of the archaeological remains preserved in the coastal zone, albeit only in preliminary form, can thus be gained from recent work, but the complexity of the problem of managing that resource is also being realized. The problem arises not only from the scale and variety of the archaeological remains, but also from two other sources: the very varied natural and human threats to the resource, and the complex web of organizations with authority over, or interests in, the coastal zone. Human threats include the redevelopment of historic towns and old dockland areas, and the increased importance of the coast for the leisure and tourism industries, resulting in pressure for the increased provision of facilities such as marinas. The larger size of ferries has also caused an increase in the damage caused by their wash to fragile deposits in the intertidal zone. The most significant natural threat is the predicted rise in sea level over the next century especially in the south and east of England. Its impact on archaeology is not easy to predict, and though it is likely to be highly localized, it will be at a scale much larger than that of most archaeological sites. Thus protecting one site may simply result in transposing the threat to a point further along the coast. The management of the archaeological remains will have to be considered in a much longer time scale and a much wider geographical scale than is common in the case of dry land sites, and this will pose a serious challenge for archaeologists.1.What has caused public interest in coastal archaeology in recent years?A.The rapid development of England’s coastal archaeology.B.The rising awareness of climate change.C.The discovery of an underwater forest.D.The systematic research conducted on coastal archaeological findings.2.What does the passage say about the evidence of boats?A.There’s enough knowledge of the boatbuilding technology of the prehistoricpeople.B.Many of the boats discovered were found in harbours.C.The use of boats had not been recorded for a thousand years.D.Boats were first used for fishing.3.What can be discovered from the air?A.Salt mines.B.Roman towns.C.Harbours.D.Fisheries.。

2022-2023学年湖北省武汉中学高二下学期5月月考英语试题1. Where are the speakers probably?A.At home. B.In a library. C.In a zoo.2. How will tourists travel around the village?A.By bus. B.By car. C.On foot.3. What is the man invited to do this evening?A.Go to the cinema. B.See an art show. C.Watch a basketball game.4. Why does Brian go to the hospital?A.To see a patient. B.To see a doctor. C.To bring a book to Mary.5. What is the woman trying to do?A.Type a report. B.Print out a file. C.Set up a cloud drive.6. 听下面一段较长对话,回答以下小题。
1. What are the speakers talking about?A.A party. B.A picnic. C.Sunbathing.2. What’s the probable relationship between the speakers?A.Husband and wife. B.Hostess and guest. C.Customer and waitress.7. 听下面一段较长对话,回答以下小题。
1. What does the woman say about the new toy car?A.It is a bargain. B.It is brightly colored. C.It makes various sounds.2. Who did the woman buy the toy car for?A.Her son. B.Her nephew. C.Her grandson.3. What is the man’s real worry about the truck?A.Its safety. B.Its cost. C.Its speed.8. 听下面一段较长对话,回答以下小题。
介绍马绍尔群岛英语作文The Marshall Islands, also known as the Republic of the Marshall Islands, is a country located in the Pacific Ocean. It is a part of Micronesia and consists of 29 atolls and 5 islands. The country has a total land area of 181.43 square kilometers, with a population of approximately 58,000 people. The capital city is Majuro, which is located on the largest atoll in the Marshall Islands.The Marshall Islands were first inhabited byMicronesians who migrated from other Pacific islands over 2,000 years ago. The islands were later colonized by Spainin the 16th century and then by Germany in the 19th century. After World War I, the islands were given to Japan as partof the South Pacific Mandate by the League of Nations. During World War II, the islands were occupied by theUnited States, which continued to administer the islandsuntil 1986, when the Marshall Islands gained independence.The economy of the Marshall Islands is heavily dependent on foreign aid, with the United States being the largest donor. The country's main industries include fishing, tourism, and agriculture. The government is also trying topromote the development of the country's natural resources, such as its abundant marine life and rare earth minerals.The Marshall Islands is also known for its unique culture, which has been shaped by its history and location. The traditional Marshallese way of life is based on subsistence farming and fishing, with a strong emphasis on communal living and respect for the environment. The country is also famous for its traditional dancing, which is accompanied by drumming and chanting.One of the most pressing issues facing the Marshall Islands is the threat of climate change. The country is made up of low-lying atolls, which makes it particularly vulnerable to rising sea levels and extreme weather events. The government has been working to address this issue by promoting renewable energy, such as solar power, and advocating for international action on climate change.In conclusion, the Marshall Islands is a small but fascinating country with a rich history and culture. While it faces many challenges, such as economic dependence and climate change, it has a strong sense of community and a resilient spirit. As the world becomes increasinglyinterconnected, it is important to recognize and appreciate the unique contributions of countries like the Marshall Islands.。


abiological removal 非生物转移abiotic zone 无生命带abrasion platform 海蚀台地absolute salinity 绝对盐度abundance 丰度abyssal circulation 深渊环流abyssal clay 深海粘土abyssal fauna 深渊动物abyssal hill 深海丘陵abyssal plain 深海平原abyssal zone 深渊带abyssopelagic organism 大洋深渊水层生物abyssopelagic plankton 深渊浮游生物abyssopelagic zone 深渊层accessory mark 副轮accretionary prism 增生楔accumulation 堆积作用acoustic remote sensing 声遥感acoustical oceanography 声学海洋学active continental margin 主动大陆边缘aerial remote sensing observation 航空遥感观测African Plate 非洲板块afternoon effect 午后效应Agassiz trawl 阿氏拖网age composition 年龄组成aggregated distribution 集聚分布ahermatypic coral 非造礁珊瑚air gun 气枪air lifting 气举air-born substances 气源物质airborne infrared radiometer 机载红外辐射计air-sea boundary process 海-气边界过程air-sea interaction 海-气相互作用air-sea interface 海-气界面air-tight 气密albedo of sea 海洋反照率"algal chemistry, phycochemistry " 藻类化学algal reef 藻礁alkalinity 碱度allochthonous population 外来种群allopatry 异域分布"alternating current, rectilinear current " 往复流ambient sea noise 海洋环境噪声amphi-boreal distribution 北方两洋分布amphidromic point 无潮点"amphidromic system, amphidrome " 旋转潮波系统amphi-Pacific distribution 太平洋两岸分布anadromic fish 溯河鱼anaerobic zone 厌氧带anaerobiosis 厌氧生活analytical chemistry of sea water 海水分析化学"anchor ice, ground ice " 锚冰anchorage area 锚泊地anchored structure 锚泊结构anomalous sea level 异常水位anoxic basin 缺氧海盆anoxic event 缺氧事件anoxic water 缺氧水"Antarctic Bottom Water, AABW " 南极底层水Antarctic Circumpolar Current 南极绕极流Antarctic Circumpolar Water Mass 南极绕极水团Antarctic Plate 南极洲板块anthropogenic hydrocarbon 人源烃anthropogenic input 人源输入antifouling 防污着aphotic zone 无光带"apparent oxygen utilization, AOU " 表观耗氧量aquaculture 水产养殖aquaculture 水产栽培aquafarm 水产养殖场aquanaut work 潜水作业aquaranch 水中牧场aquatic community 水生群落aquatic ecosystem 水生生态系archipelago 群岛Arctic Ocean 北冰洋"Arctic Water, North Polar Water " 北极水arc-trench-basin system 沟弧盆系armor block 护面块体armored diving 铠装潜水artificial island 人工岛artificial sea water 人工海水aseismic ridge 无震海岭assemblage 组合assimilation efficiency 同化效率assimilation number 同化数association 群聚astronomical tide 天文潮"Atlantic Equatorial Undercurrent, Lomonosov Current " 大西洋赤道潜流Atlantic Ocean 大西洋Atlantic-type coastline 大西洋型岸线Atlantic-type continental margin 大西洋型大陆边缘atmospheric input 大气输入atmospheric sea salt 大气海盐atmospheric transport 大气输送atoll 环礁auricularia larva 耳状幼体Australia-Antarctic Rise 澳大利亚-南极海隆autecology 个体生态学authigenic sediment 自生沉积autoinhibitory substance 自体抑制物质autotroph 自养生物auxotroph 营养缺陷生物average heavy swell 中狂涌average height of the heighest one-tenth wave 1/10 [大波平均]波高average height of the heighest one-third wave 1/3 [大波平均]波高average moderate swell 中中涌axially symmetric marine gravimeter 轴对称式海洋重力仪azimuth correction 方位改正back-arc 弧后back-arc basin 弧后盆地back-arc spreading 弧后扩张backshore 后滨bacterial film 细菌膜bacterial slime 细菌粘膜bacterioneuston 漂游细菌barbor boat 港作船baroclinic ocean 斜压海洋barophilic bacteria 喜压细菌barotropic ocean 正压海洋barrier 沙坝barrier island 沙坝岛barrier reef 堡礁baseline study 基线研究batch culture 一次性培养bathyal fauna 深海动物bathyal zone 深海带bathymetry 水深测量bathypelagic organism 大洋深层生物bathypelagic plankton 深层浮游生物bathypelagic zone 深层beach 海滩beach berm 滩肩beach cusp 滩角beach cycle 海滩旋回beach face 滩面beach nourishment 人工育滩beach profile 海滩剖面beach ridge 滩脊beach rock 海滩岩beam trawl 桁拖网bench 岩滩Benioff zone 贝尼奥夫带benthic community 底栖生物群落benthic division 海底区benthic-pelagic coupling 海底-水层耦合benthology 底栖生物学benthos 底栖生物berth 泊位bioadhesion 生物粘着bioassay 生物测试"biochemical oxygen demand, BOD " 生化需氧量biodegradation 生物降解biodeterioration 生物污染bioerosion 生物侵蚀biofacy 生物相biofouling 生物污着biogenic sediment 生物沉积biogenous hydrocarbon 生源烃biogenous silica 生源硅石biological detritus 生物碎屑biological input 生物输入biological noise 生物噪声biological oceanography 生物海洋学biological purification 生物净化biological removal 生物转移biological scavenging 生物清除bioluminescence 生物发光biomass 生物量bionics 仿生学biosphere 生物圈biota 生物区系biotope 生活小区bioturbation 生物扰动biozone 生物带bipinnaria larva 羽腕幼体bipolarity 两极同源bird-foot delta 鸟足[形]三角洲Bohai Coastal Current 渤海沿岸流Bohai Sea 渤海boomerang sediment corer 自返式沉积物取芯器borate alkalinity 硼酸[盐]碱度"borer, boring organism " 钻孔生物bottom current 底层流bottom friction layer 底摩擦层bottom grab 表层取样器bottom reflection 海底声反射bottom reverberation 海底混响bottom scattering 海底散射bottom water 底层水bottom wave 底波bottom-supported platform 坐底式平台boundary flux 界面通量box corer 箱式取样器box model 箱式模型brackish water species 半咸水种brash ice 碎冰"breaker, surf " 碎波breakwater 防波堤brine 卤水"brown clay, red clay " 褐粘土bubble effect 气泡效应buoyant mat 浮力沉垫burrowing organism 穴居生物caballing [混合]增密caisson 沉箱calcareous ooze 钙质软泥"calcite compensation depth, CCD " 方解石补偿深度calcite dissolution index 方解石溶解指数calm sea 无浪capillary wave 毛细波carbon assimilation 碳同化作用carbon cycle 碳循环carbon dioxide system in sea water 海水二氧化碳系统carbonate alkalinity 碳酸[盐]碱度"carbonate critical depth, CCRD " 碳酸盐极限深度carbonate cycle 碳酸盐旋回carbonate system in sea water 海水碳酸盐系统carcinology 甲壳动物学carnivore 食肉动物catastrophe 灾变catch 渔获量catchability coefficient 可捕系数cathodic protection 阴极防护cellar connection 井口装置Central Indian Ridge 印度洋中脊central rift 中央裂谷central water 中央水chain of volcanoes 火山链"Changjiang Diluted Water, Changjiang River Plume " 长江冲淡水characteristic species 特征种chemical diagenesis 化学成岩作用chemical form 化学形态chemical oceanography 化学海洋学"chemical oxygen demand, COD " 化学需氧量chemical scavenging 化学清除chemical speciation 化学形态分析chemical speciation models 化学形态模型chemical species 化学形式chemical weathering 化学风化作用chemo-autotroph 化能自养生物chemostatic culture 恒化培养"chemotaxis, chemotaxy " 趋化性chemotrophy 化能营养"China Classification Society, ZC " 中国船级社chlorinity 氯度chlorinity ratio 氯度比值chlorosity 氯量chronostratigraphy 年代地层学ciguatoxic fish 西加毒鱼类circumpacific volcanic belt 环太平洋火山带clay 粘土"closed season, prohibited season " 禁渔期cnoidal wave 椭圆余弦波coast of emergence 上升海岸coast of submergence 下沉海岸"coastal current, littoral current " 沿岸流coastal dune 海岸沙丘coastal engineering 海岸工程coastal terrace 海岸阶地coastal water 沿岸水coastal zone 海岸带coastline 海岸线coastline effect 海岸效应coccolith ooze 颗石软泥cofferdam 围堰cold current 寒流cold eddy 冷涡cold water species 冷水种cold water sphere 冷水圈cold water tongue 冷水舌collision zone 碰撞带commensalism 共栖commensalism 偏利共生common species 习见种community 群落community ecology 群落生态学compensation current 补偿流compensation depth 补偿深度compliant structure 顺应式结构composite breakwater 混合式防波堤compound shoreline 复合滨线compound tide 复合潮conchology 贝类学"conductivity-temperature-depth system, CTD " 温盐深仪confused sea 暴涛confused swell 暴涌conservative constituents of sea water 海水保守成分constancy of composition of sea water 海水成分恒定性constituent day 分潮日constituent hour 分潮时constructive boundary 建设性板块边界consumer 消费者continental accretion 大陆增生continental drift 大陆漂移continental margin 大陆边缘continental rise 大陆隆continental shelf 大陆架continental shelf break 大陆架坡折continental slope 大陆坡continental terrace 大陆阶地"continuous cultivation, continuous culture " 连续培养continuous model 连续模型contour current 等深流contourite 等深流沉积[岩]contrast in water 水中对比度contrast transmission in water 水中对比度传输controlled ecosystem experiment 控制生态系实验convective mixing 对流混合conventional diving 常规潜水convergent boundary 会聚边界conversion efficiency 转换效率"copepodite, copepodid larva " 桡足幼体coprophagy 食粪动物coral reef 珊瑚礁coral reef coast 珊湖礁海岸corrosion in sea water 海水腐蚀cosmogenous sediment 宇宙沉积cosmopolitan 世界[广布]种cotidal chart 同潮图countercurrent 逆流crane barge 起重船critical depth 临界深度crop 收获cross-coupling effect 交叉耦合效应current meter 海流计current pattern 流型cuspate bar 尖角坝cuspate delta 尖[形]三角洲cyphonautes larva 苔藓虫幼体cypris larva 腺介幼体Dalmatian coastline 达尔马提亚岸线datum of chart 海图基准面day-night observation 连续观测deck unit 甲板装置deep current 深层流"deep scattering layer, DSL " 深海散射层deep sea fan 深海扇deep sea propagation 深海传播deep sea sand 深海砂deep sea sediment 深海沉积deep sea sound channel 深海声道deep water 深层水deep water wave 深水波delta 三角洲demersal fish 底层鱼类density current 密度流density current 异重流density-dependent mortality 密度制约死亡率deposit feeder 食底泥动物descriptive oceanography 描述海洋学destructive boundary 破坏性板块边界detached breakwater 岛式防波堤detached wharf 岛式码头detritus feeder 食碎屑动物diagonal wave 斜向浪diatom ooze 硅藻软泥"dicycle, dicycly " 双周期"diel vertical migration, diurnal vertical migration " 昼夜垂直移动dilution cycle 稀释旋回directional wave spectrum 方向波谱dissolution cycle 溶解旋回"dissolved inorganic carbon, DIC " 溶解无机碳"dissolved organic carbon, DOC " 溶解有机碳"dissolved organic matter, DOM " 溶解有机物"dissolved organic nitrogen, DON " 溶解有机氮"dissolved organic phosphorus, DOP " 溶解有机磷dissolved oxygen 溶解氧disturbing acceleration 干扰加速度diurnal inequality 日不等[现象]diurnal tide 全日潮diver 潜水员divergent boundary 离散边界diversity 多样性diving suit 潜水服dock 船坞dominant species 优势种"Donghai Coastal Current, East China Sea Coastal Current " 东海沿岸流"Donghai Sea, East China Sea " 东海Doppler current meter 多普勒海流计double diffusion 双扩散double ebb 双低潮double flood 双高潮downwelling 下降流dredge 底栖生物刮底网dredger 挖泥船dredging engineering 疏浚工程drift current 漂流drift ice 流冰drifting buoy 漂流浮标drill conductor 隔水套管drilling vessel 钻探船dry diving 干式潜水duration-limited spectrum 有限风时谱dynamic method 动力方法dynamic positioning 动力定位dynamical oceanography 动力海洋学East African Rift Zone 东非裂谷带East Pacific Rise 东太平洋海隆"ebb, ebb tide " 落潮echinopluteus larva 海胆幼体echo ranging 回声测距echosounder 测深仪ecological barrier 生态障碍ecosystem 生态系edge wave 边缘波efflux 输出通量Ekman depth 埃克曼深度Ekman layer 埃克曼层Ekman pumping 埃克曼抽吸Ekman spiral 埃克曼螺旋Ekman transport 埃克曼输送El Nino ( 西) 厄尔尼诺electrodialysis 电渗析electromagnetic vibration exciter 电磁振荡震源elliptical trochoidal wave 椭圆余摆线波embayed coast 港湾海岸endemic population 地方种群endemic species 地方种endolithion 石内生物endopelos 泥内生物endopsammon 沙内生物energy flow 能流"engineering oceanology, engineering oceanography " 海洋工程水文enhancement 增殖entrainment 卷吸environmental load 环境荷载Eotvos effect 厄特沃什效应ephyra larva 碟状幼体epibenthic sledge 底表撬网epifauna 底表动物epilithion 石面生物epipelagic organism 大洋上层生物epipelagic zone 上层epipelos 泥面生物epiphyte 附生植物epiplankton 上层浮游生物epipsammon 沙面生物Equatorial Countercurrent 赤道逆流Equatorial Current 赤道流"Equatorial Undercurrent, EUC " 赤道潜流equilibrium profile 平衡剖面equilibrium tide 平衡潮equinoctial tide 分点潮equivalent duration 等效风时equivalent fetch 等效风区estuarine chemistry 河口化学estuary 河口湾estuary improvement 河口治理euphotic layer 真光层Eurasian Plate 欧亚板块eurybaric organism 广压性生物eurybathic organism 广深性生物euryhaline species 广盐种euryphagous animal 广食性动物"eurythermal species, eurythermic species " 广温种eustasy 全球性海面升降eutrophic water 富营养水eutrophication 富营养化[作用]euxinic environment 静海环境event deposit 事件沉积exclusive economic zone 专属经济区exogenous organic matter 外源有机物"expendable bathythermograph, XBT " 投弃式温深计exploitative engineering of offshore petroleum/gas reservoir 海上油气开发工程exploratory engineering of offshore petroleum/gas reservoir 海上油气勘探explosive energy source 炸药震源exposed waters 开阔海域failure probability 破坏概率fan delta 扇[形]三角洲fast ice 固定冰fatigue break 疲劳断裂fault coast 断层海岸feather angle 羽角feathering 羽状移动fecal pellet 粪粒fecundity 生殖力feeding migration 索饵洄游fertility 肥力fetch 风区fetch-limited spectrum 有限风区谱fictitious body 假想天体"filter feeder, suspension feeder " 滤食性动物finestructure 细结构fiord 峡湾fish finder 鱼探仪fish resources 鱼类资源fisheries oceanography 渔业海洋学fishery management 渔业管理fishery resources 渔业资源fishing effort 捕捞能力fishing intensity 捕捞强度fishing mortality coefficient 渔捞死亡系数fishing season 渔期fixed oceanographic station 定点观测站fixed structure 固定式结构flare boom 火炬臂"flat coast, low coast " 低平海岸floating breakwater 浮式防波堤floating hose 浮式软管floating structure 浮式结构floating-type wharf 浮式码头floe ice 浮冰"flood, flood tide " 涨潮food chain 食物链food organism 饵料生物food pyramid 食物金字塔food web 食物网foraminiferal ooze 有孔虫软泥fore-arc 弧前fore-arc basin 弧前盆地forerunner 先行涌foreshore 前滨fouling organism 污着生物foundation bed 基床foundation capability 地基承载能力fracture zone 破裂带freshwater plume 淡水舌frictional depth 摩擦深度"fringing reef, shore reef " 岸礁fully developed sea 充分成长风浪gas exploder 气爆震源gateway 峡口general circulation 总环流geographical barrier 地理障碍geological oceanography 地质海洋学"geomagnetic electrokinetograph, GEK " 电磁海流计geostrophic current 地转流geotechnical test 土工试验glacial effect 冰川效应globigerina ooze 抱球虫软泥Gondwana 冈瓦纳古陆gravitational tide 引力潮gravity corer 重力取芯器gravity platform 重力式平台gravity wave 重力波gravity-type structure 重力式结构grazing angle 掠射角groin 丁坝gross primary production 毛初级生产量growth efficiency 生长效率growth overfishing 生长型捕捞过度Gulf Stream 湾流"gulf, bay " 海湾guyed-tower platform 拉索塔平台guyot 平顶海山gyre 流涡habitat 生境"hadal fauna, ultra-abyssal fauna " 超深渊动物"hadal zone, ultra-abyssal zone " 超深渊带half-tide level 半潮面halmyrolysis 海解作用halobiont 盐生生物halocline 盐跃层halophile organism 适盐生物harbor accommodation 港口设施harbor entrance 口门harbor hinterland 港口腹地harbor land area 港口陆域harbor siltation 港口淤积harbour basin 港池harbour site 港址Hardy continuous plankton recorder 哈迪浮游生物记录器harmonic analysis of tide 潮汐调和分析harmonic constant of tide 潮汐调和常数hatchability 孵化率"headland, cape " 岬角heave 垂荡"hekistoplankton, ultraplankton " 超微型浮游生物helium-nitrogen-oxygen saturation diving 氦-氮-氧饱和潜水helium-oxygen diving 氦-氧潜水hemipelagic deposit 半远洋沉积"herbivore, grazer " 食植动物hermatypic coral 造礁珊瑚heterogeneity 异质性heterotroph 异养生物high energy marine environment 海洋高能环境high sea 狂浪"high water, HW " 高潮"highest astronomical tide, HAT " 最高天文潮位holophytic nutrition 全植型营养holoplankton 终生浮游生物homogeneity 同质性homogeneous layer 均匀层horizontal distribution 平面分布hot spot 热点hot spring 海底热泉"Huanghai Coastal Current, Yellow Sea Coastal Current " 黄海沿岸流"Huanghai Cold Water Mass, Yellow Sea Cold Water Mass " 黄海冷水团"Huanghai Sea, Yellow Sea " 黄海"Huanghai Warm Current, Yellow Sea Warm Current " 黄海暖流humification 腐殖化[作用]hummocked ice 堆积冰hydraulic model test 水力模型试验hydraulic piston corer 液压活塞取芯器hydrobiology 水生生物学hydrobiont 水生生物hydrodynamic noise 流体动力噪声hydrothermal circulation 热液循环hydrothermal process 热液过程ice cover 冰盖ice edge 冰缘线ice field 冰原ice period 冰期ice rind 冰壳ice shelf 冰架ice thickness 冰厚iceberg 冰山ichthyology 鱼类学implosive source 聚爆式震源in situ density 现场密度in situ measurement 现场测定in situ salinometer 现场盐度计in situ specific volume 现场比容in situ temperature 现场温度incident wave 入射波"incubation, hatching " 孵化Indian Ocean 印度洋Indian Plate 印度洋板块indicator species 指示种infauna 底内动物influx 输入通量inshore 内滨instanteneous mortality rate 瞬间死亡率interface exchange process 界面交换过程intermediate water 中层水internal tide 内潮internal wave 内波interstitial fauna 间隙动物"interstitial water, pore water " 间隙水intertidal zone 潮间带"Intertropical Convergence Zone, Equatorial " 赤道辐合带intraplate volcanism 板内火山活动inversion layer 逆置层in-vivo fluorescence technique 活体荧光技术ion-exchange membrane 离子交换膜irregular wave 不规则波island 岛island arc 岛弧island shelf 岛架island slope 岛坡isohaline 等盐线isotherm 等温线jacket pile-driven platform 导管架桩基平台jack-up platform 自升式平台jetty 突堤jetty 导堤juvenile 幼年个体Kelvin wave 开尔文波key species 关键种knuckle joint 万向接头Knudsen's burette 克努森滴定管Knudsen's pipette 克努森移液管Knudsen's tables 克努森表Kuroshio 黑潮lag effect 滞后效应lagoon 湖lamellibranchia larva 瓣鳃类幼体land and sea breezes 海陆风land fabrication 陆上预制land-origin ice 陆源冰larva 幼体lateral reflection 侧反射launching 下水Laurasia 劳亚古陆law of the sea 海洋法lead lane 冰间水道level bottom community 平底生物群落level ice 平整冰life support system 生命支持系统light acclimation 光驯化light adaptation 光适性light and dark bottle technique 黑白瓶法light boat 灯船light house 灯塔light saturation 光饱和Lloyd's Register of Shipping 劳埃德船级社long heavy swell 长狂涌long low swell 长轻涌long moderate swell 长中涌long-crested wave 长峰波Longhurst-Hardy plankton recorder 朗-哈浮游生物记录器longshore current 顺岸流"longshore drift, littoral drift " 沿岸泥沙流"low water, LW " 低潮"lowest astronomical tide, LAT " 最低天文潮位luminous organism 发光生物lunar tide 太阴潮lunar tide interval 太阴潮间隙lysis 溶菌lysocline 溶跃层macrobenthos 大型底栖生物macrofauna 大型动物macroplankton 大型浮游生物magnetic lineation 磁条带magnetic quiet zone 磁场平静带main thermocline 主[温]跃层major constituents of sea water 海水主要成分malacology 软体动物学"manganese nodule, ferromanganese nodule " 锰结核mangrove coast 红树林海岸mangrove swamp 红树林沼泽manifold system 管汇系统mantle bulge 地幔隆起mantle convection 地幔对流mantle plume 地幔柱marginal basin 边缘盆地marginal sea 边缘海marginal-type wharf 顺岸码头mariculture 海产养殖mariculture 海产栽培marine accident 海损事故marine acoustics 海洋声学marine aerosol 海洋气溶胶marine bio-acoustics 海洋生物声学marine biochemical resource 海洋生化资源marine biochemistry 海洋生物化学marine biogeochemistry 海洋生物地球化学marine biological noise 海洋生物噪声marine biology 海洋生物学marine chemical resource 海洋化学资源marine chemistry 海洋化学"marine climate, ocean climate " 海洋气候marine climatology 海洋气候学marine contamination 海洋玷污marine corrosion 海洋腐蚀marine detritus 海洋碎屑marine ecology 海洋生态学marine ecosystem 海洋生态系marine element geochemistry 海洋元素地球化学marine engineering geology 海洋工程地质marine environment 海洋环境marine environmental assessment 海洋环境评价marine environmental capacity 海洋环境容量marine environmental chemistry 海洋环境化学"marine environmental forecasting, marine " 海洋环境预报marine environmental monitoring 海洋环境监测marine environmental protection 海洋环境保护marine environmental quality 海洋环境质量marine environmental sciences 海洋环境科学marine erosion 海蚀作用marine geochemistry 海洋地球化学marine geology 海洋地质学marine geomagnetic anomaly 海洋地磁异常marine geomagnetic survey 海洋地磁调查marine geomorphology 海洋地貌学marine geophysical survey 海洋地球物理调查marine geophysics 海洋地球物理学marine gravimeter 海洋重力仪marine gravity anomaly 海洋重力异常marine gravity survey 海洋重力调查marine heat flow survey 海洋地热流调查marine humus 海洋腐殖质"marine hydrography, marine hydrology " 海洋水文学marine installation 海上安装沉放marine isotope chemistry 海洋同位素化学marine meteorology 海洋气象学marine microorganism 海洋微生物marine natural hydrocarbon 海洋天然烃marine natural product 海洋天然产物marine natural product chemistry 海洋天然产物化学marine organic chemistry 海洋有机化学marine organic geochemistry 海洋有机地球化学marine pharmacognosy 海洋生药学marine photochemistry 海洋光化学marine physical chemistry 海洋物理化学marine physics 海洋物理学marine policy 海洋政策marine pollutants 海洋污染物marine pollution 海洋污染marine pressure hydrophone 海洋压力水听器marine reflection seismic survey 海洋反射地震调查marine refraction seismic survey 海洋折射地震调查marine resource chemistry 海洋资源化学marine resources 海洋资源marine salvage 海难救助"marine sciences, ocean sciences " 海洋科学marine sedimentology 海洋沉积学marine seismic profiler 海洋地震剖面仪marine seismic streamer 海洋地震漂浮电缆marine seismic survey 海洋地震调查marine seismograph 海洋地震仪marine stratigraphy 海洋地层学marine technology 海洋技术marine towage 海上拖运marine wide-angle reflection seismic survey 海洋广角反射地震调查maritime air mass 海洋气团marking 标记marsh organism 沼泽生物mass balance 质量平衡mass budget 质量收支mass transfer 质量转移"mean sea level, MSL " 平均海平面"mechanical bathythermograph, MBT " 机械式温深计medical security for diving 潜水医务保障megafauna 巨型动物megalopa larva 大眼幼体megaplankton 巨型浮游生物meiobenthos 小型底栖生物meiofauna 小型动物"meroplankton, transitory plankton " 阶段性浮游生物mesocosm 中型实验生态系mesopelagic fish 中层鱼类mesopelagic organism 大洋中层生物mesopelagic zone 中层mesoplankton 中型浮游生物mesopsammon 沙间生物mesoscale eddy 中尺度涡meteorological tide 气象潮microbenthos 微型底栖生物microbivore 食微生物者microcolony 小菌落microcontinent 微大陆microcosm 小型实验生态系microdistribution 微分布microecosystem 微生态系microfauna 微型动物microfouling 微生物污着microhabitat 微生境micronutrients 微量营养物microplankton 小型浮游生物microstructure 微结构Mid-Atlantic Ridge 大西洋中脊mid-ocean ridge 洋中脊mid-ocean ridge basalt 洋中脊玄武岩midwater trawl 中层拖网migratory fish 洄游鱼类minimum duration 最小风时minimum fetch 最小风区minor elements of sea water 海水微量元素mirage 蜃景mixed layer sound channel 混合层声道"mixed layer, mixing layer " 混合层mixed tide 混合潮mixotroph 混合营养生物mobile platform 移动式平台moderate sea 中浪module 模块"monocycle, monocycly " 单周期monophagy 单食性monsoon current 季风海流moored data buoy 锚定资料浮标mooring facilities 系泊设施mooring force 系泊力mortality 死亡率mound-type breakwater 斜坡式防波堤mud 泥muddy coast 泥质海岸multibeam echosounder 多波束测深仪multi-point mooring 多点系泊multistage flash distillation 多级闪急蒸馏multistage separator 多级分离器mysis larva 糠虾期幼体N/P ratio 氮磷比[值]"Nanhai Coastal Current, South China Sea Coastal Current " 南海沿岸流"Nanhai Sea, South China Sea " 南海"Nanhai Warm Current, South China Sea Warm Current " 南海暖流nannoplankton 微型浮游生物nauplius larva 无节幼体navigation channel 航道navigation equipment 导航设备neap tide 小潮nearshore zone 近滨带nectochaeta larva 疣足幼体nektobenthos 游泳底栖生物nekton 游泳生物nepheloid 雾状层neritic organism 近海生物neritic sediment 浅海沉积neritic zone 浅海带neritic zone 近海区net plankton 网采浮游生物net primary production 净初级生产量net primary productivity 净初级生产力neurotoxin 神经毒素niche 生态位Ninety East Ridge 东经90度洋中脊Niskin water sampler 尼斯金采水器nitrogen cycle 氮循环nitrogen-oxygen diving 氮-氧潜水no swell 无涌non-conservative constituents of sea water 海水非保守成分nonharmonic constant of tide 潮汐非调和常数non-saturation diving 非饱和潜水Norpac net 北太浮游生物网North American Plate 北美洲板块"North Atlantic Deep Water, NADW " 北大西洋深层水not fully developed sea 未充分成长风浪nursing ground 育幼场nutrient depletion 营养[盐]耗竭nutrients in sea water 海水营养盐obduction plate 仰冲板块obduction zone 仰冲带oblique haul 斜拖observation platform 观测平台ocean 洋ocean basin 洋盆ocean bottom seismograph 海底地震仪ocean circulation 大洋环流ocean color scanner 海色扫描仪ocean current 海流ocean current energy 海流能ocean energy conversion 海洋能转换ocean energy resources 海洋能源ocean engineering 海洋工程ocean exploitation 海洋开发ocean management 海洋管理ocean observation technology 海洋观测技术"ocean optics, marine optics " 海洋光学ocean power generation 海洋能发电ocean salinity energy 海洋盐差能ocean thermal energy 海洋温差能ocean wave 海浪ocean wave spectrum 海浪谱ocean-atmosphere heat exchange 海气热交换oceanic crust 洋壳oceanic front 海洋锋oceanic optical remote sensing 海洋光学遥感oceanic plate 大洋板块oceanic sound scatterer 海洋声散射体oceanic tholeiite 大洋拉斑玄武岩oceanic troposphere 大洋对流层oceanic turbulence 海洋湍流oceanic zone 大洋区oceanization 大洋化作用"oceanographic survey, oceanographic investigation " 海洋调查"oceanography, oceanology " 海洋学offshore 外滨offshore bar 滨外坝offshore engineering 近海工程offshore loading and unloading system 海上装卸油系统offshore oil-gas flowline 海上输油气管线offshore platform 近海平台offshore storage unit 海上贮油装置oil fence [围]油栅oil-gas-water treating system 油气水处理系统oligohaline species 寡盐种oligostenohaline species 低狭盐种oligotaxic ocean 少种型大洋oligotrophic water 贫营养水omnivore 杂食动物ooze 软泥ophiopluteus larva 长腕幼体opportunistic species 机会种optimum catch 最适渔获量organic coating layer 有机覆盖层overfishing 捕捞过度overlying water 上覆水overpopulation 种群过密overtide 倍潮overwintering 越冬oxide film 氧化膜oxygen maximum layer 氧最大层oxygen minimum layer 氧最小层oxygen partial pressure 氧分压Oyashio 亲潮oyster reef 牡蛎礁"Pacific Equatorial Undercurrent, Cromwell Current " 太平洋赤道潜流Pacific Ocean 太平洋Pacific Plate 太平洋板块Pacific-type coastline 太平洋型岸线Pacific-type continental margin 太平洋型大陆边缘pack ice 浮冰群paleoceanography 古海洋学paleocurrent 古海流paleodepth 古深度paleomagnetic stratigraphy 古地磁地层学paleoproductivity 古生产力paleosalinity 古盐度Pangaea 泛大陆Panthalassa 泛大洋parallel dike 顺坝parasitism 寄生"particulate inorganic carbon, PIC " 颗粒无机碳particulate matter in sea water 海水颗粒物"particulate organic carbon, POC " 颗粒有机碳"particulate organic matter, POM " 颗粒有机物"particulate organic nitrogen, PON " 颗粒有机氮"particulate organic phosphorus, POP " 颗粒有机磷passive continental margin 被动大陆边缘patch reef 点礁patchiness 斑块分布pediveliger larva 具足面盘幼体pelagic deposit 远洋沉积pelagic division 水层区pelagic egg 浮性卵pelagic fish 上层鱼类pelagic organism 水层生物pelagic organism 大洋生物pelagic phase 浮性生活期peleotemperature 古温度peninsula 半岛periphyton 周丛生物permanent thermocline 永久性温跃层phaeophytin 脱镁叶绿素phosphorus cycle 磷循环photo-autotroph 光能自养生物photobacteria 发光细菌photochemical transformation 光化学转化photophilous organism 适光生物photosynthetic activity 光合活性"phototaxis, phototaxy " 趋光性phycology 藻类学phyllosoma larva 叶状幼体physical oceanography 物理海洋学phytoplankton 浮游植物pile group 群桩pile-driving barge 打桩船pilidium larva 帽状幼体pipe-laying ship 敷管船piston corer 活塞取芯器pitch 纵摇planktobacteria 浮游细菌plankton 浮游生物plankton equivalent 浮游生物当量plankton indicator 浮游生物指示器plankton net 浮游生物网plankton pump 浮游生物泵plankton recorder 浮游生物记录器"planktonology, planktology " 浮游生物学planula larva 浮浪幼体plate 板块plate boundary 板块边界plate collision 板块碰撞plate convergence 板块会聚plate tectonics 板块构造学pleuston 漂浮生物plunging breaker 卷碎波poikilotherm 变温动物Poincare wave 庞加莱波polar ice 极地冰pollutant 污染物polymetal crust 多金属结壳polymorphism 多态现象polyphagy 复食性polystenohaline species 高狭盐种polytaxic ocean 多种型大洋population 种群population dynamics 种群动态population ecology 种群生态学porcellana larva 磁蟹幼体porosity 孔隙度"port engineering, harbor engineering " 港口工程post-larva 稚期practical salinity 实用盐度practical salinity scale 1978 1978 实用盐标precipitous sea 怒涛predation 捕食[现象]predator 捕食者preformed nutrients 原存营养盐pressure-relief tank 减压舱pressurized compartment 加压舱prey 猎物primary production 初级生产量primary productivity 初级生产力producer 生产者。
介绍马绍尔群岛英语作文The Marshall Islands, located in the central Pacific Ocean, is a country composed of 29 atolls and 5 isolated islands. The country has a population of about 53,000 people and its capital city is Majuro.The Marshall Islands has a unique and rich culture that is influenced by its Micronesian, Melanesian, and Polynesian roots. Traditional Marshallese culture places a strong emphasis on community, family, and respect for elders. The people of the Marshall Islands are known for their traditional stick dance, which is often performed at cultural events and celebrations.In terms of natural beauty, the Marshall Islands is a paradise for nature lovers. With its crystal-clear waters, white sandy beaches, and abundant marine life, it is a popular destination for diving, snorkeling, and other water sports. The country is also home to a number of World WarII-era shipwrecks, making it a fascinating destination for history enthusiasts as well.The economy of the Marshall Islands is primarily based on subsistence farming, fishing, and the service industry. The country also benefits from financial assistance from the United States under a Compact of Free Association. The government is working to develop the tourism and business sectors to diversify the economy and create more opportunities for its people.In recent years, the Marshall Islands has been facing challenges related to climate change and rising sea levels. The country is at risk of losing significant portions ofits land due to erosion and flooding, which poses a threat to its people and way of life. The government is actively working to address these challenges and has been vocal in advocating for global action on climate change.Overall, the Marshall Islands is a fascinating and beautiful country with a rich culture and warm, welcoming people. Its natural beauty and unique traditions make it a must-visit destination for anyone interested in exploring the Pacific Islands.马绍尔群岛,位于太平洋中部,由29个环礁和5个孤立岛屿组成。
目录名词部分船舶船舶与海上设施的种类………………………………………… P.3-5数据与资料……………………………………………………… P.6-8舱室处所………………………………………………………… P.8-11高级船员和船员………………………………………………… P.11-12船级……………………………………………………………… P.12-13 船体船体结构………………………………………………………. P.13-23舾装……………………………………………………………. P.23-26甲板机械………………………………………………………. P.26-28 轮机1.操舵装置………………………………………………………. P.282.锅炉与受压容器………………………………………………. P.28-313.汽轮机和燃气轮机……………………………………………. P.31-324.柴油机…………………………………………………………. P.32-365.轴、轴承以及螺旋浆…………………………………………. P.36-396.泵、阀、柜、管和舱底附件…………………………………. P.39-437.齿轮箱及其它装置……………………………………………. P.43-48 电气电力推进装置及配套设备和辅助电气设备………………….. P.48-50无线电设备……………………………………………………. P.50-52发电机与电动机………………………………………………. P.52-53配电系统………………………………………………………. P.53-56变流机、变压器等装置以及开关等………………………….. P.56-62电缆与照明系统……………………………………………….. P.62-67报警系统和信号设备………………………………………….. P.67-68 消防……………………………………………………………… P.68-69救生设备………………………………………………………… P.69-71焊接……………………………………………………………… P.71-72动词部分船舶处于或遭遇的状态或情况…………………………………. P.72-85缺陷与损坏的类别与原因……………………………………… P.85-103修理方法………………………………………………………. P.103-107检查与试验……………………………………………………. P.107-109短语句子部分短语(1-133)……………………………………………….. P.110-119句子(134-443)有关船舶以及证书报告等方面的叙述…………………… P.119-123有关各种原因、目的、条件等的叙述…………………… P.123-134有关船舶及船、机、电等状况的叙述…………………… P.134-148有关检查、试验与修理等情况的叙述…………………… P.148-156报告部分全况检验……………………………………………………………….P.156-164制造中缺陷…………………………………………………………….P.164-176火灾事故……………………………………………………………….P.176-178遭遇坏天气…………………………………………………………….P.178-182遭遇大雾……………………………………………………………….P.182-183碰撞损坏(螺旋浆被灯船锚链缠绕继而发生碰撞)……………….. P.183-190 碰撞损坏(机动货驳碰撞后沉没,已无修理价值)……………….. P.190-193 碰撞损坏(渔船船首被碰撞)……………………………………….. P.193-196 搁浅损坏……………………………………………………………….P.197-202腐蚀…………………………………………………………………….P.202-206进水损坏……………………………………………………………….P.206-209锚损坏………………………………………………………………….P.209-210货舱损坏……………………………………………………………….P.210-216舱盖损坏……………………………………………………………….P.216-218浪击损坏……………………………………………………………….P.219-220浪损…………………………………………………………………….P.220-223螺旋浆损坏…………………………………………………………….P.223-229可调节螺旋浆轴联轴器安装缺陷……………………………………..P.229-230主机损坏(连杆轴承下盖的潜在缺陷所致)……………………….. P.231-235主机损坏(推力轴承没有起到止推作用曲轴前移所致)……………P.235-244 主机损坏(主机飞车曲轴后臂红套移动所致)………………………P.244-249 主机损坏(缸套裂缝所致)………………………………………….. P.249-250 付机损坏(柴油发电机爆炸,已无修理价值)………………………P.250-253 付机损坏(活塞、缸套长期在高热应力中运转而产生裂缝所致)…P.253-255 缸套、活塞损坏………………………………………………………...P.255-256 增压器损坏……………………………………………………………. P.256-258尾轴油封装置渗漏……………………………………………………. P.258-261离合器损坏……………………………………………………………. P.261-262起重机损坏……………………………………………………………. P.262-263门式起重机损坏………………………………………………………. P.263-266履带式起重机回转支索损坏…………………………………………. P.266-267垃圾箱损坏……………………………………………………………. P.267-269码头损坏………………………………………………………………..P.269-270钻井平台远洋拖航……………………………………………………. P.270-272一.名词部分船舶1.船舶与海上设施的类型Type of Ships and Offshore Installations 货船Cargo Ship杂货船General cargo ship干货船Dry cargo ship散货船Bulk carrier矿沙船Ore carrier运煤船Coal carrier集装箱船Container ship滚装货船Ro/Ro ship冷藏船Refrigerated ship运畜船Cattle carrier运木船Timber carrier近海供应船Offshore supply ship散装矿砂船Bulk Ore carrier混装船Combination carrier载驳母船Barge Carrier汽车运输船Car carrier液货船Liquid Cargo Carrier油船Oil tanker化学品液货船Chemical tanker液化气体船Liquefied gas carrier油矿两用船Oil/ore carrier油散两用船Oil/bulk carrier油散矿三用船Oil/bulk/ore carrier客船Passenger Ship客船Passenger ship豪华旅游客船Cruise ship旅游船Tourist ship高速客船High speed passenger craft 双体客船Passenger catamaran客货船Passenger-cargo ship客箱船Passenger container ship客滚船Ro/Ro Passenger Ship高速船High Speed Craft全垫升气垫船Air-cushion Vehicle水面效应船Surface Effect Ship双体气垫船Air-cushion Catamaran侧壁气垫船Side-wall Hovercraft高速双体船High Speed Catamaran高速单体船High Speed Monohull Craft地效翼船Wing-in Ground Craft水翼船Hydrofoil Craft动力支承船Dynamically Supported Craft两栖船Amphibious Craft小水面单体船Small Waterplane Area Single Hull Ship 小水面双体船Small Waterplane Area Twin Hull Ship 驳船Barge客驳Passenger Barge货驳Cargo Barge敞口驳Open Barge甲板驳Deck Barge集装箱驳Container Barge分节驳Integrated Barge开底驳Hopper Barge油驳Oil Barge趸船(箱形驳)Pontoon拖船Tug港作拖船Harbour Tug打捞拖船Salvage Tug顶推船Pusher近海供应拖船Offshore tug/supply ship工程船Engineering Ship挖泥船Dredger耙吸式挖泥船Trailing suction dredger绞吸式挖泥船Cutter suction dredger链斗式挖泥船Bucket dredger抓斗式挖泥船Grab dredger铲斗式挖泥船Dipper dredger吹泥船Reclamation craft开底泥驳Hopper Barge对开泥驳Split Hopper Barge起重船Floating Crane浮船坞Floating Dock打桩船Floating Pile Driver布缆船Cable Layer潜水工作船Diving Boat港区工作船Harbour Operating Ship破冰船Ice breaker消防船Fire Boat救护船/救助船Rescue Ship引水船Pilot Vessel海关船Customs Boat巡逻船Patrol Boat布标船Buoy Layer灯标船Beacon Boat交通艇Traffic Boat垃圾船Garbage Boat浮油回收船Oil Recovery Ship污水处理船Sewage Disposal Vessel海水淡化船Distilling Ship渡船Ferry乘客渡船Passenger Ferry火车渡船Train Ferry车客渡船Vehicle Passenger Ferry海峡渡船Channel Ferry渔船Fishing Vessel渔品加工船Fish-Factory Ship拖网渔船Trawler围网渔船Netter捕鲸船Whaling Ship活鱼运输船Live Fish Carrier其他船舶科学调查船Research ship训练船Training Ship特殊用途船Special purpose ship内河船Inland Waterways Ship海上设施Offshore Installations海上移动平台Mobile Offshore Unit海上移动钻井平台Mobile Offshore Drilling Unit水面式平台Surface Unit船式平台Ship-type Unit驳船平台Barge-type Unit自升式平台Self-elevating Unit柱稳式平台Column-stabilized Unit半潜式平台Semi-submersible Unit坐底式平台Submersible Unit采油平台Production Unit储油平台Storage Unit生活平台Accommodation Unit修理平台Repair Unit海上固定平台Fixed Offshore Platform海底管道Submarine Pipeline潜水系统和潜水器Diving System and Submersible单点系泊Single Point Mooring (SPM)浮式生产与储油装置Floating Production and Storage Unit(FSUs)浮式生产、储存及卸载系统Floating Production, Storage andOffloading System (FPSOs) 2.数据与资料Data and Information数据总长Length overall(L OA)垂线间长Length bet. perpendiculars (L BP)首、尾垂线Forward and after perpendiculars型宽Moulded breadth型深Moulded depth建造日期Date of build签订建造合同日期Date of building contract龙骨安放日期Date of keel laid交船日期Date of delivery下水日期Launching date重大改建Major conversion安放龙骨或船舶处于相似建造阶段的日期Date on which keel was laid or ship was at a similar stage of construction 签订改建合同日期Date of conversion contract改建完工日期Date of completion of conversion船舶所有人Owner经营人Operator承租人Charterer船舶编号或呼号Distinctive number or letters航行区域Navigation area/Service area/Trade area曾用过的船名Former Name姐妹船Sister Ship总吨位Gross tonnage净吨位Net tonnage排水量Displacement载货量Cargo weight载重量Deadweight空船重量Light(-ship) weight吃水(首、尾、平均) Draft ( fwd, aft, mean)稳性Stability完整稳性Intact stability破舱稳性Damaged stability分舱(抗沉性)Subdivision初稳性高度Metacentric height衡准数Criterion numeral剖面模数Section modulus惯性矩Moment of inertia纵总强度Longitudinal strength局部强度Local strength方形系数Block coefficient静水弯矩Still water bending moment重心垂直高度Vertical height of centre of gravity屈服应力Yield stress标准舷弧Standard sheer防火分隔Fire division航区限制Navigation area restriction海况限制Sea state restriction天气限制Weather restriction最大抗风暴能力Max. weatherliness储备浮力Reserve buoyancy续航力Endurance渗透率Permeability盲区Blind area共振区域Resonance region容许载荷Permissible load核定载客数Number of persons certified to carry 干舷:Freeboard热带干舷Tropical freeboard夏季干舷Summer freeboard冬季干舷Winter freeboard北大西洋冬季干舷Winter North Atlantic freeboard热带木材干舷Timber tropical夏季木材干舷Timber summer冬季木材干舷Timber winter北大西洋冬季木材干舷Timber winter North Atlantic freeboard 淡水宽限Allowance for fresh water减少干舷的B型船舶Type B with reduced freeboard增加干舷的B型船舶Type B with increased freeboard载重线:Load line载重线标志Loadline marks资料防火控制图Fire control plans海图( up-to-date最新) Charts航路指南Sailing direction灯塔表Lists of lights航行通告Notices to mariners潮汐表Tide tables航海出版物Nautical publications应变部署表Muster list国际信号规则International Code of Signals航海日志Deck log book机舱日志Engine room log book无线电日志Radio log book线型图Lines稳性资料Stability information装载手册Loading manual干舷计算书Freeboard calculations配载图Stowage plan操作说明书Operation instructions维修计划Maintenance plan训练手册Training manual船上维修保养指南Instructions for on-board maintenance 弃船训练演习手册Abandon ship training and drill manual3.舱室处所Compartments or Spaces舱室工作和设备舱室:驾驶室wheel house海图室chart room报务室radio room雷达室radar room声纳室sonar room主机舱main engine room主机操纵室main engine control room辅机舱auxiliary engine room锅炉舱boiler room机炉舱engine and boiler room减速器舱reduction gear room舵机舱steering gear room通风机室fan room变流机室commutator room空调室air-conditioner room应急发电机室emergency generator room冷冻机室refrigerator room灭火装置室fire control room蓄电池室battery room陀螺罗经室gyro-compass room方位水平仪室azimuth level room计程仪舱log room导弹舱missile room弹药舱magazine深弹舱depth charge room弹药转运舱ammunition lobby声纳舱sonacelle, sonar nacelle机修间workshop电工间electrician’s store木工间carpente r’s store锚链舱chain locker桅屋mast house洗消室decontamination room居住舱室:居住舱室Accommodation, living accommodation 客舱Cabin船员舱室crew’s cabin墙壁wall天花板top ceiling侧壁板side ceiling里子板lining装饰decoration家具furniture书桌desk衣橱wardrobe梳妆台dressing table书柜bureaux餐具柜dresser椅子chair沙发sofa桌子table帷幔drapery窗帘curtain地毯carpet货舱:货舱cargo hold(详见船体部分的货舱)货油舱cargo oil tank, cargo tank集装箱舱container hold冷藏货舱refrigerated cargo hold液化天燃气舱liquefied natural gas tank邮件舱mail room行李舱luggage room汽车舱vehicle hold液舱liquid tank燃油舱fuel oil tank滑油舱lubricating oil tank压载水舱ballast tank淡水舱fresh water tank污水舱bilge tank储藏室store, store room帆缆间hawser store油漆间paint room粮食库provision store冷藏库refrigerating chamber其他:首尖舱fore peak tank尾尖舱aft peak tank顶边舱:topside tank甲板强横梁deck transversevertical side plating ( in line with hatch) 舱口垂向列板(与舱口一直线的垂直边板)船壳板shell plating斜板sloping plating底边舱:hopper tank斜板sloping plating双层底舱double bottom tank翼舱wing tank边舱side tank平衡舱heeling tank深舱deep tank残油舱sludge/oil residue tank隔离舱cofferdam空舱void tank处所货物处所:Cargo spaces货舱Cargo hold货油舱Cargo tank液货舱Liquid cargo tank围壁通道Trunk起居处所:Accommodation spaces公共处所Public space走廊Corridor盥洗室Lavatory住所Cabin办公室Office医务室Hospital放映室Cinema游戏室Game room娱乐室Hobby room理发室Barber shop配膳室(无烹调设备) Pantry(containing no cooking appliances) 公共处所:Public spaces:大厅Hall餐室Dining room休息室Lounge类似的固定围闭处所Similar permanently enclosed spaces 服务处所:Service spaces:厨房Galley配膳室(设有烹调设备的) Pantry (containing cooking appliances) 储物间Locker邮件舱Mail room贵重物品室Specie room储藏室Store room工作间Workshop围壁通道Trunk特种处所:Special category spaces:舱壁甲板以上或以下围闭的车辆处所Enclosed vehicle spaces above and below the bulkhead deck机器处所:Machinery spaces:A类机器处所Machinery space of category A装有下列机械的处所推进机械;锅炉;燃油装置;蒸汽机和内燃机;发电机和主要电动机;加油站;冷藏机;防摇装置;通风机;空气调节机械。
Tour ItineraryAug 31 Arrive in Phoenix and Travel to Scottsdale Sep 1 Sedona & the Grand Canyon Sep 2 Monument Valley and Lake Powell Sep 3 Leisurely Lake Powell Relaxed Start Sep 4 Bryce Canyon and Zion National Parks Sep 5 Zion National Park Relaxed Start Sep 6 Depart Salt Lake CityIncluded Features:• 6 breakfasts, 1 lunch, 3 dinners• 11 included experiences• Services of an Insight Vacations Tour Guide• Hotel and restaurant tips are included.• Baggage handling at hotels.• Hometown & On-site Transfers will be determined later,at an additional cost.• Air will be determined later, at an additional cost.•Complimentary coach and hotel Wi-Fi (where available). Tour itinerary is subject to change without notice at thetour operator’s discretion.Double Occupancy: $3,250 per personRooms & Pricing*Rates are per person, based on double occupancy. Single Occupancy, third & fourth person rates are availableupon request and are based on availability at the time of booking. Government taxes and fees are included in pricing and are subject to change until departure. Round-trip airfare will be determined at a future date for an additional cost. An additional air deposit will be due upon confirming flights. Transfers will be determined afterfinal payment has been collected.PAYMENT : A non-refundable deposit of $200.00 per person is due at time of booking to hold your reservation. Allbookings must be confirmed and deposited on or before March 22, 2024. Final payment is due to AAA Travel nolater than June 11, 2024. Payments are accepted in the form of cash, check (made payable to AAA Reading-Berks), ormost major credit cards.PROOF OF CITIZENSHIP: A valid government issued photo ID is required. All passenger names on reservationmust match the photo ID. Any passengers without proper identification and documentation will be denied boardingwithout refund. Contact your travel consultant if you have any questions on documentation. If you are not a U.S.citizen, please notify us immediately.CANCELLATION PENALTIES: Cancellation penalties up to 100% of trip cost may apply based on supplier cancellation policies.AAA STRONGLY RECOMMENDS TRAVEL INSURANCE920 Van Reed RoadWyomissing, PA 19610Phone: 610-374-5600Limits on AAA Travel Responsibilities: The American Automobile Association, Inc. gives notice that all tickets and coupons are issued and delivered by them and all arrangements for transportation or conveyance, or for hotel accommodations are made by them as AGENTS, upon the express conditions that they shall not be liable for injury, damage, loss, accident, delay, or irregularity which may be occasioned by reason or defect in any vehicle or through act of default of any company or person engaged in conveying the persons taking this tour, except its liability as a common carrier. The airline and/or steamship lines concerned are not to be held responsible for any act, omission, or events, during the time the passengers are not onboard their plane or conveyances. The passage contract in use by the airline and/or steamship concerned when issued shall constitute the sole contract between carrier and purchaser and/or passenger of these tours. The aforesaid American Automobile Association, Inc. can accept no responsibility for losses or additional expenses due to delay or changes of schedule, weather, strikes, war, quarantines, or other causes. All such losses or expenses shall have to be borne by the passengers.Please reference /travel for the most up to date information.Enchanting CanyonlandsDay -by -day ItineraryDAY 1 - SATURDAY AUGUST 31, 2024: Arrive in Phoenix and Travel to ScottsdaleMEALS: Dinner with WineHOTEL: Hotel Valley Ho, ScottsdaleDAY 2 - SUNDAY SEPTEMBER 1, 2024: Sedona & Wonders of the Mighty Grand Canyon MEALS: BreakfastHOTEL: Grand Canyon National Park LodgeDAY 3 - MONDAY SEPTEMBER 2, 2024: Monument Valley and Lake Powell Early risers will take advantage of the lodge location to witness one of Mother Nature's grand-est shows on earth: a sunrise over the Grand Canyon. Travel along the South Rim Desert View Drive, skirting the southern rim of the canyon. Head to the Cameron Trading Post, one of the oldest and most historic general stores in Arizona. Join a MAKE TRAVEL MATTER® Experience in Monument Valley Tribal Park, where Navajo Local Experts guide you through the history, cul-ture and heritage of the Navajo Nation. This carefully prepared tour keenly exemplifies the re-lationship of respect with the land in the valley and the importance placed on preserving the natural treasures found here. Enjoy a Navajo cookout amid the giant buttes and mesas of this unique landscape. Spend the rest of the day relaxing at your lakefront resort before indulging in a dinner with wine and views of Lake Powell.MEALS: Breakfast, Lunch, Dinner with Wine HOTEL: Lake Powell Resorts & Marinas At 6:00pm, join your Travel Director and fellow travelers for a Welcome Dinner at Zuzu, where you will have the opportunity to mingle and get to know one another.Travel through world -renowned Red Country along the Red Rock Scenic Byway. Explore bohemian Sedona with its shops and galleries, or simply take in the exceptional beauty of Red Rock Country before you make your way to the Grand Canyon. Follow Oak Creek Canyon Scenic Byway through Coconino National Forest. On arrival, you can take an optional flight-seeing tour (weather permitting) over the Grand Canyon. Whether you prefer a helicopter or a fixed -wing plane, you'll enjoy magnificent scenery with aerial views from above. Meet your Local Expert Canyon Tim at the South Rim of the Grand Canyon to discover its wonders. You'll discover the origins of the five -million -year -old canyon, its rock formations and the human impact on this natural masterpiece. He'll also talk to you about the bountiful flora and fauna, and where you might be able to spot them.DAY 4 - TUESDAY SEPTEMBER 3, 2024: Leisurely Lake PowellMEALS: Breakfast, Dinner with WineHOTEL: Lake Powell Resorts & MarinasDAY 5 - WEDNESDAY SEPTEMBER 4, 2024: Bryce Canyon and Zion National ParksMEALS: BreakfastHOTEL: Zion National Park LodgeDAY 6 - THURSDAY SEPTEMBER 5, 2024: Zion National ParkEnjoy a Relaxed Start this morning, as you have a full day to explore the park. After a leisurely breakfast, you will tour the canyon aboard a privately chartered open -air vehicle, with live com-mentary from a Local Expert to show you the many scenic highlights of the canyon. Explore Zion National Park with Insight Choice. Choose to join your Travel Director for a guided hike to the Emerald Pools. Alternatively, visit the Zion Canyon Visitor Center.MEALS: BreakfastHOTEL: Zion National Park LodgeDAY 7 - FRIDAY SEPTEMBER 6, 2024: Depart Salt Lake CityThis morning you ’ll bid farewell to the beautiful national parks and your fellow travelers. MEALS: Breakfast Today is entirely yours to do as you please. Partake in one of our popular optional experiences, explore on your own, or simply relax by the resort swimming pool with views of Lake Powell. As an optional activity this morning, let yourself be tempted by a gentle float trip down the Colorado River. Calmly float down the Colorado, past some of the most awe -inspiring sites, like the iconic Horseshoe Bend and Petroglyph Beach. In the evening, enjoy dinner with wine at the Red Heritage. Make Travel Matter, as you get the opportunity to watch local dancers talented in colorful powwow dancing, flute playing, and live drum music and enjoy a traditional dinner at this Navajo owned Native American Performing Arts Theater.Journey across a wide -open landscape punctuated by colorful sandstone cliffs, sagebrush -covered flats, and high ridges dotted with piñon pine and juniper. Travel through Bryce Canyon Country on a portion of the Scenic Highway 89, recognized by National Geographic as the No. 1 Driver's Drive in the world. You will be struck by the beauty of Bryce Canyon National Park, an otherworldly landscape of red rock pillars known as hoodoos, pink cliffs, and endless vistas. Follow the Rim Trail from Surprise Point to Bryce Point. Stops will be made at the major viewpoints and there will be time for a leisurely walk along Sunset Point or a more physical hike down the canyon. Either way, you will be spellbound by the beauty and majesty of this dramatic natural landscape.。
根据船东及船检意见修改2003/3/281 / 10PAGEWEIGHTSCALE底 图 总 号旧 底 图 总 号DETAIL DESIGNSHIP NO. SHANGHAI MERCHANT SHIPDESIGN & RESEARCHINSTITUTESCHEDULE FOR MOORING TEST AND SEA TRAIL OFHULL PART船体部分系泊及试航试验大纲SDARIDATESIGNCOR. MARKS DATEDESIGNED CHECKEDVERIFIEDAPPROVED CHECKED OF STA.REVISION NO. DESCRIPTIONBYDATE旧底图总号CONTENTI SEA TRIAL OF HULL PART (3)I-1GENERAL (3)I-2T EST C ONDITION AND P LACE (3)I-3P ROGRESSIVE S PEED T RIAL (S EE T ABLE H-1) (3)I-4I NERTIA T EST(O NLY H1008),C RASH S TOP A STERN T EST AND C RASH S TOP A HEAD T EST(O NLY H1008) 4I-5T URNING C IRCLE T EST (O NLY H1008)(S EE T ABLE H-5) (5)I-6Z IGZAG M ANEUVERING T EST (S EE T ABLE H-6) (5)I-7C OURSE K EEPING T EST (S EE T ABLE H-7) (5)I-8S TEERING G EAR T EST (S EE T ABLE H-8) (6)I-9W INDLASS AND A NCHORING T EST (S EE T ABLE H-9) (6)I-10S TRUCTRURE TEST (7)I-11M EASUREMENT OF V IBRATION (S EE T ABLE H-10) (7)I-12N OISE M EASUREMENT (S EE T ABLE H-11) (7)I-13W ILLIAMSON T URN T EST(O NLY H1008) (8)I-14R ESCUE BOAT AND LIFE BOAT LAUNCHING TEST (S EE T ABLE H-12) (8)II SEA TRIAL OF MACHINERY PART (9)II-1.M/E STARTING TEST AND AUXILIARY BLOWER AUTO-STARTING / STOPPING TEST(MOORING TEST IF POSSIBLE) (9)II-2.M/E LOAD TEST AND F.O. CONSUMPTION MEASUREMENT (9)II-3.M/E M.D.O.&H.F.O. CHANGEOVER TEST (10)II-4.M EASUREMENT OF M/E LOWEST STEADY REVOLUTION(S EE T ABLE M-7) (10)II-5.M/E REVERSING TEST(S EE T ABLE M-8) (10)II-6.T EST FOR COMPOSITE BOILER (EXHAUST GAS SECTION)(S EE T ABLE M-9) (10)II-7. F.W. GENERATOR TEST (S EE T ABLE M-10) (11)II-8.S HAFTING TORSIONAL VIBRATION MEASUREMENT (11)II-9.A/E OPERATION TEST BY H.F.O. AND M.D.O.&H.F.O. CHANGEOVER TEST (11)II-10.R EMOTE CONTROL OF M AIN E NGINE TEST. (11)II-11.E NGINE SIDE EMERGENCY MANEUVERING (14)II-12.A UTOMATIC UNMANNED ENGINE ROOM’S FUNCTION TEST (14)II-13. B ALLAST PUMPING TEST TO PROVE PUMPING VAPACITY AND EFFICIENCY DURING TRANFERING BALLAST WATER (15)II-14.O VERHAULING FOR M/E (15)III.SE A TRIALS OF ELECTRIC PART (16)III-1R ADIO &N AVIGATION AND I NTERIOR C OMMUNICATION E QUIPMENT(S EE T ABLE E-1) (16)III-2M AIN P OWER S TATION B LACK-O UT T EST(S EE T ABLE E-2). (17)III-3T HE PUBLIC ADDRESS, GENERAL ALARM & FIRE ALARM SOUND TEST (S EE T ABLE E-3). (17)III-4M.G.P.S T EST(S EE T ABLE E-4) (17)III-5I.C.C.P T EST (S EE T ABLE E-4) (17)III-6I NTERNAL COMMUNICATION SYSTEM(S EE T ABLE E-5) (17)III-7A LL ANGLES OF VISIBILITY FOR SIGNAL AND NAVIGATIONAL LIGHTS AS REQUIRED IN COLREGS ARE TO BE VERIFIED. (17)Ⅲ-8D EAD SHIP START(O NLY H1008)(S EE T ABLE E-6) (18)Ⅲ-9E LECTRIC LOAD MEASUREMENT (SEE T ABLE E-8) (18)底图总号旧底图总号main engine has run at stable outputs before the speed measurement commences. During speed measuring within test section course deviation shall be not more than 2 degrees, steering angle shall be not more than ±5 degrees.(4)Speed-measuring methodThe trial speed is to be measured by DGPS. The output shaft power and revolution of main engine to be measured by torsion meter. The instruments which used in the test should have the certification of verification before speed trials.(5)Measurement recorda.Test time and water depth of every trip.b.Wind velocity and direction, weather condition.c.Ship’s speed, revolutions, power of M/E (rpm) and indicator horsepower of every trip.(6)Ship’s speed calculationShip’s speed at design dra ft (16.5m) to be obtained from the following formula:V TD = V TB * V MD / V MBin the formula:V TD –actual speed at design draft.V TB –actual speed at ballast draft.V MD –model test speed at design draft inV MB –model test speed at ballast draft.I-4 Inertia Test, Crash Stop Astern Test and Crash Stop Ahead Test(1)Inertia Test (Only H1008) (See Table H-2)When ship is going full ahead at normal rpm (86.2 r/min), give an order to stop main engine. When ship’s speed reduces to the speed abt. 5kn the test is finished. During the test the course heading should be kept by changing the rudder angle. Measure and record the distance and time from the order of stop M/E to the ship’s speed reduce to 5kn.(2)Crash stop astern test (See Table H-3)When ship is going full ahead at normal rpm (86.2 r/min), give an order to make main engine run astern (63r/min). When ship’s speed reduces to the speed abt. 0kn the test is finished. During the test keep rudder angle at 0 degree. Measure and record the distance and time from command full astern to the ship’s speed reduce to 0kn.(3)Crash stop ahead test (Only H1008) (See Table H-4)When ship is going astern with 63r/min of main engine, give an order to make main engine run ahead(86.2 r/min). When ship’s speed reduces to the spe ed abt. 0kn, the test is finished. During the test keeprudder angle at 0 degree. Measure and record the distance and time from command full ahead to the ship’s speed reduce to about 0kn.底图总号旧底图总号I-5 Turning Circle Test(Only H1008) (See Table H-5)(1)Test methodWhen the steering gear is in the condition of double pump working, the test should be done at full speed (91r/min), harbor full speed (68r/min)and harbor half speed(55r/min)respectively:a.The rudder angle is turned to hard starboard (35degree) and held until t he ship’s heading anglechanges to 540 degree, the test is finished.b. Resume the straight course until the speed recovery.c. The rudder angle is turned to hard portside (35degree) and held until the ship’s heading anglechanges to 540 degree, the test is finished.d. Resume the straight course until the speed recovery.(2)Measurement record the transfer distance, advance distance, turning diameter and maximum heelingangle.I-6 Zigzag Maneuvering Test (See Table H-6)(1)Test methodWhen the vessel is running ahead (91r/min), the test is to be carried out in accordance with following steps:a.The rudder angle is turned from its zero position to 10︒ starboard and held until the course of thevessel changes to an angle of 10︒ starboard to the original course;b.The rudder angle is turned from 10︒ starboard to 10︒ port and held until the course of the vesselchanges to an angle of 10︒ port to original course;c.The rudder angle is turned from 10︒ port to 10︒ starboard and held until the course of the vesselchanges to an angle of 10︒ starboard to original course:d.The rudder angle is turned from 10︒ starboard to its zero position and held until the vessel runs inoriginal course.(2)Measurement recorda.M/E revolution.b.Initial vessel speed.c.Time of every stage and course angle.I-7 Course Keeping Test (See Table H-7)During sea trail, check the course stability:(1)Keep the steering tiller unchanged while the vessel is sailing full ahead (91r/min) with steering by hand.Record the reading of GYROCOMPASS with the interval of 30 seconds. Measurement will be continued for 3 minutes, one time for fair and counter current respectively.(2)The vessel is sailing full ahead (91r/min) and to be ensured to keep the course. Measure the times ofsteering for keeping the course and the max. Rudder angle. Measurement will be continued for 3 minutes, one time for fair and counter current respectively.底图总号旧底图总号I-8 Steering Gear Test (See Table H-8)(1)Main engine is controlled in wheelhouse, and maneuver handle to be put in the position of ahead andfull speed (91r/min). Steering test to be done in wheelhouse. Operate the hydraulic pump No.1 or No.2 respectively, do the test by putting the rudder angle from 0︒to 35︒starboard/from 35︒starboard to 35︒port/form 35︒port to 0︒/from 0︒to 35︒port/from 35︒port to35︒starboard/from 35︒starboard to 0︒. Measure ship’s heeling angle. The time required to put the rudder from 35︒of one side to 30︒of another side shall not exceed 28 second.(2)Main engine to be put on the status of ahead and full speed, running two hydraulic pumps, test thecapability of putting the rudder from 0︒to 35︒starboard/from 35︒starboard to 35︒port/form 35︒port to 35︒starboard/ from 35︒starboard to 0︒.Following data to be recordeda.Weather, sea condition.b.Time required for each moving rudder.c.Maximum oil pressure in hydraulic cylindersd.Maximum current of motor.(3)Emergency steering gear testTo test the emergency steering effectiveness in stee ring gear room with ship’s running at half speed (M/E abt 76r/min) but not less than 7Kn.By turning the pump control handle make the rudder angle changed from 0︒ - 15︒ starboard - 15︒ port - 0︒one time. Measure the time of steering from 15︒ starboard to 15︒ port. It should not exceed 60 second.(4)Auto pilot effectiveness testDuring the main engine endurance test, do the test with No.1&No2 steering system respectively.--NFU (manual) steering--HAND (following) steering--AUTO (automatic) steeringSet up a heading course, navigate with auto pilot, and observe the keeping course capacity with course recorder. Then do the test of changing heading course.I-9 Windlass and Anchoring Test (See Table H-9)(1)An anchor-ground with more than 82.5 meter depth shall be selected under a calm sea condition and thebow in the upwind.(2)Each anchor is to be let go down gradually to the surface of the water.(3)Five shots of chains of one side anchor is to be let go down freely. During this process manually brake.Check the reliability of the brake system.(4)One side anchor is to be hoisted. During hoisting process, average speed of hoisting anchor to bemeasured and recorded. (by measuring No.2 and No.3 shot of chain ) , The average speed is not less than 9m/min. Then hoist the anchor up to bell mouth with windlass.底图总号旧底图总号2.3.2 The report on chemical analysis and low calorific value to be submitted before this test.2.3.3 The ship should go straightly as possible during the F.O. consumption measurement.2.3.4 The measured F.O. consumption should be corrected according to the actual calorificvalue and ambient conditions, then be offered to owner for reference. (See Table M-6)2.4 M/E shaft power to be measured when F.O. consumption is measuring.II-3.M/E M.D.O. & H.F.O. changeover testM/E M.D.O. & H.F.O. changeover test to be executed as follows:M.D.O. --- H.F.O.(before M/E operating test for adjustment)H.F.O. --- M.D.O.(after M/E load test)II-4.Measurement of M/E lowest steady revolution(See Table M-7)M/E is adjusted to the lowest steady revolution by reducing revolution progressively atwhich the engine keep running for 5 minutes. Record the revolution of M/E andturbocharger, the graduation of the maneuvering handle and M/E fuel oil pump.Turnrudder angle to hard portside (35degree), observe change of the course.II-5.M/E reversing test(See Table M-8)M/E reversing test should be carried out while the engine running at the lowest steadyrevolution. The time for reversing should not be more than 15 seconds. The testincluding ‘ ahead –astern’ and ‘astern –ahead’ is not less than 3 times.II-6.Test for composite boiler (exhaust gas section) (See Table M-9)6.1 During M/E load test at NCR, the measurement of the evaporation of the compositeboiler (exhaust air section) to be conducted for one hour by flowmeter arranged at thedelivery side of the feed water pump. During evaporation test, composite boiler(oil-fired section) should not operate and the feed water to be kept stable.6.2 The soot blower of boiler to be tested.6.3 the safety valve popping test: Opening pressure of safety valve: 0.8 MPa6.4 Pressure accumulation test(The items tested at the mooring test stage will not be triedagain)The boiler pressure is not to rise more than 0.954 Mpa (6% above the maximum allowable working pressure) when the steam stop valve is closed under full firing condition for duration of 15 minutes. During this test no more feed water is to be supplied than that necessary to maintain a safe working water level.底图总号旧底图总号II-7.F.W. generator test (See Table M-10)7.1 During M/E NCR condition, F.W. generator to be running for one hour utilizing thewaste heat in the jacket cooling fresh water from M/E. Record the parameters asfollows:a)Vacuum and temperature of evaporation chamberb)Temperatures of cooling fresh water inlet and outletc)Temperatures of sea water inlet and outletd)Salinity in the distilled watere)Capacity(not less than 25 m3/24h,at NCR)f)Delivery pressure of sea water ejector pumpg)Delivery pressure of ejector7.2 In condition of voyage at low speed, F.W. generator to be running for function test withsteam(if some F.W. in outlet the test finished ).II-8.Shafting torsional vibration measurementThe test to be carried out from M/E lowest steady revolution to 91.0 r/min at intervals of5 r/min, and from 91.0 r/min to M/E lowest steady revolution at intervals of 5 r/min.Example: lowest steady revolution→30→35→40→45→55→60→65→70→75→80→85→91 r/min→lowest steady revolution。
关于写航海时遇到的困难作文英文Navigating the High Seas: Overcoming the Challenges of SeafaringVenturing out onto the vast expanse of the ocean is an exhilarating and often daunting experience for any seafarer. From the moment we set sail, we are confronted with a myriad of challenges that test our resilience, resourcefulness, and determination. Whether it's braving unpredictable weather conditions, navigating treacherous waters, or facing the isolation and loneliness of life at sea, the obstacles we encounter can be both physically and mentally taxing.One of the most significant challenges we face as seafarers is the ever-changing and often unpredictable nature of the weather. The open ocean is a realm governed by the whims of Mother Nature, and we must be prepared to adapt to her capricious moods at a moment's notice. Suddenly, a gentle breeze can transform into a raging storm, whipping up towering waves that threaten to engulf our vessel. In these situations, our ability to read the signs, anticipate the weather patterns, and make swift decisions can mean the difference between a safe passage and a perilous one.Navigating the treacherous waters of the open ocean is anotherformidable challenge that seafarers must confront. Submerged rocks, shifting sandbars, and treacherous currents can lurk beneath the surface, ready to wreak havoc on our ships if we are not vigilant and well-versed in the intricacies of maritime navigation. Even with the aid of advanced technology, such as GPS and sonar, the ever-changing nature of the seafloor can make it challenging to plot a safe and reliable course. Constant vigilance, keen observation, and a deep understanding of the local waterways are essential for successfully navigating these hazards.Perhaps one of the most daunting challenges of seafaring is the isolation and loneliness that can come with being at sea for extended periods. Separated from loved ones, family, and the comforts of land-based life, seafarers must learn to cope with the psychological and emotional strain of being cut off from the world. The monotony of the daily routine, the lack of personal space, and the limited opportunities for social interaction can take a heavy toll on our mental well-being. In these moments, it becomes crucial to develop coping mechanisms, foster strong bonds with our crewmates, and find ways to maintain a sense of connection with the outside world.Despite these formidable challenges, seafarers have long found solace in the beauty and grandeur of the open ocean. The sight of the sun rising over the horizon, the gentle rocking of the waves, and the awe-inspiring vastness of the sea can inspire a sense of wonderand appreciation for the natural world. It is this connection to the sea, this deep-rooted respect for its power and majesty, that drives many of us to continue pursuing this life-long passion.Moreover, the sense of accomplishment and pride that comes with successfully navigating the high seas and completing a voyage is unparalleled. Each challenge overcome, each obstacle surmounted, serves as a testament to our resilience, our adaptability, and our unwavering determination. It is this spirit of adventure and the thrill of the unknown that continues to draw countless individuals to the seafaring life.In conclusion, the challenges of seafaring are numerous and multifaceted, but they are also what make this way of life so rewarding and fulfilling. From weathering the storms of the open ocean to navigating the treacherous waters, and from overcoming the isolation and loneliness to embracing the beauty and grandeurof the sea, the seafarer's journey is one of resilience, perseverance, and an unwavering love for the open waters. It is a calling that beckons to those who dare to venture beyond the horizon, to explore the unknown, and to embrace the endless possibilities that the high seas have to offer.。
是否支持海洋探索英文作文下载温馨提示:该文档是我店铺精心编制而成,希望大家下载以后,能够帮助大家解决实际的问题。
文档下载后可定制随意修改,请根据实际需要进行相应的调整和使用,谢谢!并且,本店铺为大家提供各种各样类型的实用资料,如教育随笔、日记赏析、句子摘抄、古诗大全、经典美文、话题作文、工作总结、词语解析、文案摘录、其他资料等等,如想了解不同资料格式和写法,敬请关注!Download tips: This document is carefully compiled by theeditor. I hope that after you download them,they can help yousolve practical problems. The document can be customized andmodified after downloading,please adjust and use it according toactual needs, thank you!In addition, our shop provides you with various types ofpractical materials,such as educational essays, diaryappreciation,sentence excerpts,ancient poems,classic articles,topic composition,work summary,word parsing,copyexcerpts,other materials and so on,want to know different data formats andwriting methods,please pay attention!The ocean is a vast and mysterious place, full of wonders waiting to be explored. From the depths of the sea to the hidden treasures beneath the waves, there is so much to discover and learn. Whether it's diving into the coral reefs or studying marine life, there are countless reasons why we should support ocean exploration.Firstly, exploring the ocean allows us to better understand the diverse ecosystems that exist beneath the surface. From the smallest plankton to the largest whales, each creature plays a vital role in maintaining thedelicate balance of marine life. By studying these ecosystems, scientists can gain valuable insights into how they function and how they are being affected by human activities such as pollution and climate change.Another reason to support ocean exploration is the potential for new discoveries and advancements in various fields. The ocean holds many secrets and unknowns, and byexploring it, we can uncover new species, resources, and even potential solutions to global challenges. For example, the study of deep-sea organisms has led to the development of new medicines and technologies that have benefited human health and industry.Furthermore, ocean exploration can also contribute to our understanding of Earth's history. By examining the geological formations and fossils found in the ocean floor, scientists can piece together the puzzle of our planet's past. This knowledge not only helps us understand how Earth has evolved over millions of years but also provides insights into how it may change in the future.Moreover, supporting ocean exploration can have economic benefits as well. The ocean is a vast source of natural resources, including oil, gas, minerals, and fish. By exploring and responsibly exploiting these resources, we can create jobs, stimulate economic growth, and improve the livelihoods of coastal communities. However, it is crucial to ensure that these activities are carried out in a sustainable and environmentally friendly manner to avoidcausing harm to marine ecosystems.In conclusion, there are numerous reasons why we should support ocean exploration. From gaining a better understanding of marine ecosystems to making new discoveries and advancements, exploring the ocean has the potential to benefit both science and society. By investing in research, conservation, and responsible resource management, we can ensure that future generations can continue to explore and enjoy the wonders of the ocean.。
int.j.remote sensing,2001,vol.22,no.7,1285±1303Validation of coastal sea and lake surface temperature measurements derived from NOAA/AVHRR dataX.LI²,W.PICHEL ,P.CLEMENTE-COLO N ,V.KRASNOPOLSKY§and J.SAPPERResearch and Data Systems Corporation,Room102,E/RA3,WWBG,NOAAScience Center,5200Auth Road,Camp Springs,Maryland20746-4304,USA;e-mail:xiaofeng.li@NOAA/NESDIS,Room102,E/RA3,WWBG,5200Auth Road,CampSprings,Maryland20746-4304,USA§General Sciences Corporation,6100Chevy Chase Drive,Laurel,Maryland20707,USA(Received11January1999;in nal form20December1999)Abstract.An interactive validation monitoring system is being used at theNOAA/NESDIS to validate the sea surface temperature(SST)derived from theNOAA-12and NOAA-14polar orbiting satellite AVHRR sensors for the NOAACoastWatch program.In1997,we validated the SST in coastal regions of theGulf of Mexico,Southeast US and Northeast US and the lake surface temper-atures in the Great Lakes every other month.The in situ temperatures measuredby24NOAA moored buoys were used as ground data.The non-linear SST(NLSST)algorithm was used for all AVHRR SST estimations except during theday in the Great Lakes where the linear multichannel SST(MCSST)algorithmwas used.The buoy±satellite matchups were made within one image pixel in space(1.1km at nadir)and1h in time.For the NOAA-12satellite,the validation results for the three coastal regions (Gulf of Mexico,Southeast US and Northeast US)showed that the mean temper-ature di V erence between satellite and buoy surface temperature(bias)was about0.4C during the day and0.2C at night.The standard deviation was about1.0C.Great Lakes validation results showed a bias less than0.3C during the day.However,due to the early morning fog situation in the summer months in theGreat Lakes region,the NLSST night algorithm yielded a fairly large bias ofabout1.5C.The same statistics were computed for the NOAA-14satellite measurements.For the coastal regions,the bias was less than0.2C with a standard deviationabout1.0C.For the Great Lakes region,the bias was about0.4C for both dayand night with a standard deviation about1.0C.Our study also showed that the NLSST algorithm provides the same order of SST accuracy over all study regions and under a wide range of environmentalconditions.1.IntroductionThe derivation of sea surface temperature(SST)from satellite measurements has been a focus of numerous studies since the early1970s(Anding and Kauth1970, McMillin1975,McMillin et al.1975,Barton1983,Llewellyn-Jones et al.1984,International Journal of Remote SensingISSN0143-1161print/ISSN1366-5901online2001Taylor&Francis Ltd/journals1286X.L i et al.McMillin and Crosby1984,McClain et al.1985,Walton1988,Barton et al.1989, Minnett1990,Emery et al.1994,Walton et al.1998).The Advanced Very High Resolution Radiometer(AVHRR/2)onboard the NOAA series of Polar-orbiting Operational Environmental Satellites(POES)is primarily designed for SST retrieval and cloud detection.POES satellites known as Advanced Television Infrared Observation Satellites(TIROS-N or ATN)operate as a pair to ensure that the data, for any region of the earth,are no more than6h old.AVHRR has ve channels, two visible channels(channels1and2at0.6and0.9m m,respectively),one short-wavelength infrared channel(channel3at3.7m m),and two long-wavelength infrared channels,the split window channels(channels4and5at11and12m m,respectively). The wavelengths of the three infrared channels are selected in a range of the electro-magnetic spectrum in which the radiation from the earth’s surface and clouds is only weakly attenuated.To determine the actual SST from the AVHRR radiation measure-ments,one must correct for absorption and reemission of radiation by atmospheric gases,predominately water vapour.The split window method,which uses the channel 4and5brightness temperatures to calculate SST,is widely used for atmospheric correction.A summary and comparison of di V erent split window algorithms are given in Barton(1995).NOAA’s National Environmental Satellite,Data,and Information Service (NESDIS)produces two main types of SST products;i.e.global SST and CoastWatch SST.The global SST suite of products are generated from AVHRR Global Area Coverage(GAC)4km data recorded on-board the POES satellites and downlinked to NESDIS acquisition stations at Wallops Station,Virginia and Fairbanks,Alaska. Global SST measurements are produced at8km resolution with variable spacing from8to25km in cloud-free areas twice per day from each of the two operational POES satellites.The global satellite SST measurements are validated by comparing them with drifting buoy(and TOGA moored buoys in the tropical Paci®c)SST measurements matching within4h and25km.These global satellite SST measure-ments are used to produce SST analyses at grid resolutions from14to100km. CoastWatch SST products are generated from a di V erent data stream,the AVHRR High Resolution Picture Transmission(HRPT)data,broadcast continuously by the POES satellites.The HRPT data have a resolution of1.1km at nadir and are mapped to almost full resolution in the production of CoastWatch AVHRR visible, infrared and SST images.The CoastWatch products are validated by comparison with NOAA moored buoy SST reports using techniques described herein.Figure1 shows the time lines of di V erent operational algorithms used at NOAA/NESDIS. Based on the split window theory,the multichannel SST(MCSST)algorithm was developed and used operationally at NOAA/NESDIS in the early1980s.This algo-rithm assumes that there is a linear relationship between the di V erence of the actual SST and a satellite measurement in one channel and the di V erence of satellite measurements in the split window channels(channel4and5).Therefore,the actual SST can be estimated using brightness temperatures measured with channels4and 5.Walton(1988)considered a non-linear term in the further development of MCSST and developed the cross-product SST(CPSST)algorithm.A simple version of the CPSST algorithm,called the non-linear SST(NLSST)algorithm,was implemented at NESDIS for operational use in April1991.The coe cients for these algorithms are routinely obtained by performing a regression between satellite retrievals and buoy data soon after each satellite’s launch.Satellite-derived SST imagery has been widely used in studying atmospheric andAVHRR/SST accuracy for NOAA-12and-14satellites1287Figure1.Time lines of NOAA series of polar orbiting satellites used for SST and the operational sea surface temperature algorithms used at NOAA/NESDIS.(a)NOAA Global Operation,(b)NOAA CoastWatch Operation.GOSSTCOMP:Global Operational Sea Surface Temperature Computation.MCSST:Multichannel Sea Surface Temperature,the MCSST product started on17November1981.CPSST: Cross-product sea surface temperature,beginning2March1990.NLSST:Non-linear Sea Surface Temperature,NLSST product,starting on10April1991in the global operation and on3June1992in the CoastWatch operation.oceanic problems.For some applications,relatively low absolute SST accuracy is required as long as high relative accuracy is achieved,i.e.for front and edge detection (Cayula and Cornillon1992,Kahru et al.1995),and in feature tracking and motion detection(Emery and Fowler1991,Breaker et al.1994).However,in some other studies,i.e.climate studies(Harries et al.1983,Yates et al.1985,Cornillon1989),a more stringent absolute SST accuracy,normally less than0.3C,is required.To understand the satellite-derived SST accuracy,scientists have performed various validation e V orts by comparing the AVHRR measurements with moored buoy, drifting buoy and ship measurements in the global ocean as well as in di V erent coastal regions.For the global GAC SST validation,Strong and McClain(1984)used the data between November1981and February1982and found that the root mean square (rms.)error of the temperature di V erence between satellite and in situ measurement was between0.6and1.8C.Pichel(1991)used3months of a NOAA-11satellite and buoy matchup dataset between March and May1990to validate the NLSST algo-rithm,and found the accuracy had been improved.The global mean satellite±buoy di V erence(or bias)was less than0.3C with a standard deviation of about0.7C. Walton et al.(1998)analysed a9-year time series of satellite±buoy matchups between 1989and1997.They showed that the bias has stayed between0.2and0.4C over the9-year period,while the scatter of the di V erence between the satellite and buoy1288X.L i et al.SSTs improved from0.8to0.5C for the daytime algorithm but remained about 0.5C for the night-time algorithm.In their study,satellite±buoy matches were constrained to25km and4h.The largest di V erences resulted from the volcanic aerosols from the Mt Pinatubo eruptions in October1992,with a positive bias in the night-time SST measurements observed from the month of the eruptions until June1993.The matchups made within4h in the global SST validation can be less accurate when a diurnal warming e V ect is considered(Cornillion and Stramma1985,Bo hm et al.1991,Hawkins et al.1993).For regional validations,one needs to set up satellite±buoy matchup datasets at higher spatial and temporal resolutions than are used in global validation studies.So far,there have been only a few studies concerning regional AVHRR SST validation.Pearce et al.(1989)validated the NOAA-7and NOAA-9satellite-derived SST using in situ boat measurements as ground data in the coastal waters o V Western Australia.They compared seven published split window algorithm derived SSTs and found that all algorithms yielded reasonably good results.The rms.error between SSTs calculated with two of the algorithms and their corresponding ship measurements was about0.6C.The bias was between 0.1and0.2C.Robinson and Ward(1989)compared NOAA-7SSTs calculated with the Llewellyn-Jones et al.(1984)split window algorithm with cruise data in the north-east Atlantic Ocean.The ship and satellite measurement agreement was within 1C.Yokoyama and Tanba(1991)compared14published split window algorithms using a matchup dataset in Mutsu Bay in northern Japan for the NOAA-9satellite. They showed that the regional split window algorithm had rms.errors in the range of0.55±0.75C.In their more recent paper,Yokoyama et al.(1993)found that larger satellite retrieval errors appeared to occur when the air±sea temperature di V erence was large.May and Holyer(1993)noticed the satellite SST retrieval error can be as large as1C when the air sea temperature di V erence changes10±12C from the mean conditions in their global dataset.Topliss(1995)reviewed split window algorithms for the NOAA-7,NOAA-9and NOAA-11satellites and developed new regional split window algorithms for the Canadian coastal region.All the above regional SST algorithms are linear SST algorithms.NOAA/NESDIS uses NLSST rather than regional algorithms for the measure-ment of SST.This avoids the problems of possible discontinuities at the regional boundaries as well as any need for seasonal adjustments within regions(Walton et al.1998).In this study,we use a long-term validation system developed for the NOAA CoastWatch program to validate the accuracy of AVHRR SSTs in the Northeast,Southeast,and Gulf of Mexico coastal regions and lake surface temper-atures in the Great Lakes area for NOAA-12and NOAA-14in1997.In§2, CoastWatch AVHRR data preparation is presented,followed by a description of the validation procedure in§3.In§4,we present validation results.Analysis and discus-sion are in§5,and the conclusions are in§6.2.NOAA CoastWatch AVHRR data preparation2.1.Satellite mapped data for CoastWatchCoastWatch is a NOAA program managed by NESDIS with CoastWatch Nodes located at NOAA laboratories and o ces in eight coastal states.The goal of CoastWatch is to provide satellite and other environmental data and products for near real-time monitoring of US coastal waters in support of environmental science, management and hazard response.The CoastWatch Nodes generate products orAVHRR/SST accuracy for NOAA-12and-14satellites1289 receive them from NESDIS and make them available to a diverse and growing user community of Federal and state environmental resource managers,research scientists, educators,shermen,and marine enthusiasts.Products include polar and geostation-ary satellite infrared,visible,and SST images,as well as ocean colour and Synthetic Aperture Radar(SAR)imagery.Started in1990,with all eight Nodes operating by 1993,CoastWatch had over2100registered users in1997.Input data for the production of CoastWatch imagery are HRPT1b datasets. These consist of AVHRR detector output from the ve channels of the AVHRR with appended calibration and earth location information.For US east coast,Great Lakes and Gulf of Mexico regions,datasets are received from every satellite pass over the Wallops Station,Virginia reception mask.During1997,the two operational polar orbiting satellites were NOAA-12and NOAA-14.NOAA-12was launched on14May1991,into a sun-synchronous polar orbit with equator crossing times early in the morning at07:09am descending and in the evening at19:09pm ascending.NOAA-14was launched on30December 1994,into a similar orbit with equator crossing times ascending in the afternoon at 13:43pm local time and descending at night at01:ually,each CoastWatch region receives satellite coverage four times per day.The local satellite overpass times for NOAA-12and NOAA-14are given in table1.Satellite data from Wallops are transmitted to the NESDIS Central Environmental Satellite Computer System (CEMSCS)in Suitland,Maryland as soon as each satellite overpass is completed. Processing into1b data proceeds automatically as soon as the complete pass has arrived,followed by CoastWatch mapping over each region covered by the satellite pass.2.2.CoastWatch mappingThe AVHRR NOAA level1b data are mapped to Mercator projection`region’maps covering entire CoastWatch regions.All ve channels,as well as the satellite and solar zenith angles,are mapped at1.1km resolution at nadir.The zenith angle is the angle at a point on the earth between the local normal at that point and a line connecting the point on the earth and the satellite or the sun.The satellite zenith angle is computed using the relation:sin(h)=(1+H/R)sin(a)(1) where h is the satellite zenith angle,H is the height of the satellite,R is the radius of the earth and a is the scan angle.The scan angle,which is also called the nadir angle,is de®ned as the angle between the line connecting the satellite with the subsatellite point and a line connecting the satellite to a viewed spot on the earth Table1.NOAA-12and NOAA-14local(US east coast)overpass times. Satellite Time GMT Local time(EST) NOAA-12Day21±23Z4:00±6:00pmNight11±12Z6:00±7:00am NOAA-14Day18±19Z1:00±2:00pmNight06±07Z1:00±2:00am1290X.L i et al.scan.For AVHRR scans,the scan angle ranges from0to55.4.The scan angle,a, is computed using the relation:a=(55.4/N)|M N|(2) where M is any given spot number and N is the spot number of nadir.For NOAA POES satellites,the range of satellite zenith angles can be shown using equation(1)to be from0to68.4.The factor H/R in equation(1)is hardcoded in the image processing programs as0.13,since the NOAA satellite height is about 825km.If there is a signi®cant variation in satellite height,the satellite zenith angles generated are expected to be o V at high zenith angles by1%for every50km di V erence in altitude.At larger satellite zenith angles,the larger atmospheric path length leads to greater attenuation of surface infrared emissions and thus the need for greater correction of AVHRR channel temperatures when calculating SST.Also, since the eld of view increases with satellite zenith angle,there is a greater chance of cloud contamination as zenith angle increases.These e V ects should lead to a decrease in accuracy of SST measurement at high satellite zenith angles.To maintain high accuracy,no SST measurements are attempted at satellite zenith angles above 53.The exception to this rule is in the Gulf of Mexico CoastWatch region where spatial coverage was determined to be more important than absolute accuracy.Each satellite pixel is calibrated to albedo or equivalent blackbody temperature (correcting for non-linearity in the calibration of channel4and5,see Planet1998) and transformed to a map pixel.Any map pixels left un®lled after all satellite data have been mapped are lled with an average of all the pixels in a55array about the un®lled pixel.To retain the full radiometric precision of the AVHRR instrument, 11bits are used to store the calibrated satellite values(Pichel et al.1991).2.3.Operational nonlinear SST(NL SST)and multichannel SST(MCSST) algorithmsOnce the data have been mapped,then the multiple channels and angles are combined with multichannel algorithms to produce SST and cloud mask imagery. SST imagery is generated with the non-linear NLSST split window algorithm in the US coastal regions.This algorithm utilizes the di V erence between the11and12m m infrared channels to correct for the e V ects of water vapour.Since infrared radiation is absorbed by atmospheric moisture more within the12m m channel than within the11m m channel,the temperature di V erence between these channels is proportional to the amount of water vapour in the atmosphere.The equations also contain a correction for atmospheric path length variation with satellite zenith angle.The linear MCSST split window equation is used to obtain an estimate of the surface temperature for the non-linear term of the NLSST equation.Separate equations are used for day and night data and the equations are satellite dependent.These equations are generated after satellite launch by matching a month’s worth of satellite data with global drifting buoy observations.All matches within25km and4h are used in a regression analysis in order to derive the equations.Because of the global nature of the matchup dataset,the regression equations are usually independent of season, geographic location,or atmospheric moisture content.However,adjustments to the equations have been necessary when instrument or spacecraft environmental changes have e V ected the calibration,and when volcanic stratospheric aerosols cover largeAVHRR/SST accuracy for NOAA-12and-14satellites1291 regions of the Earth.The NLSST and MCSST equations used in CoastWatch are given below:NLSST=A1(T11)+A2(T11T12)(MCSST)+A3(T11T12)(sec h1)A4(3)MCSST=B1(T11)+B2(T11T12)+B3(T11T12)(sec h1)B4(4)where T11and T12are the AVHRR11and12m m channel temperatures in Kelvin;sec h is the secant of the satellite zenith angle h;NLSST and MCSST are the non-linear and linear multichannel SST retrieval algorithms,respectively,in Centigrade;A1A4and B1B4are constant coe cients.A1A4and B1B4coe cients forthe NOAA-12and NOAA-14day and night algorithms are given in table2.Recently,Walton et al.(1998)showed a9-year time series of NOAA-14satellite±buoy monthly bias(i.e.mean satellite±buoy SST di V erence)and scatter(i.e.standard deviation of satellite±buoy SST di V erence)between1989and1998.Their results show that the improvement in the scatter from0.8to0.5C is partly due to improved SST algorithms(from MCSST to NLSST),and partly to the improvements in the cloud detection algorithms.Shenoi(1999)accessed the MCSST and NLSST algo-rithms performance for NOAA-9and NOAA-11satellites.Their results showed that the mean and RMSD values of SST residuals estimated by NLSST are better than those estimated by MCSST for both satellites.The CoastWatch equations di V er from the global SST equations in three respects:1.The CoastWatch equations use the MCSST value in the non-linear term rather than an a priori SST estimate obtained from an analysis of past satellite SST data. This means that there is somewhat more noise in the CoastWatch observations. Both the global operation and CoastWatch constrain the value of the a priori SST or the MCSST to the range0±28C.2.In the Great Lakes,the MCSST value is used as the nal SST value during the day;i.e.a linear equation is used as the operational equation rather than a non-linear equation.In earlier accuracy studies,it was found that the MCSST equations consistently gave slightly more accurate SST measurements than did the NLSST algorithm during the day.3.The NLSST split-window equation is used for CoastWatch at night rather than the triple-window equation(employing all three infrared channels)which is used in the global operation.For NOAA-12,the3.7m m channel is not used for Table2.NOAA-14and NOAA-12NLSST and MCSST algorithm coe cients used inCoastWatch SST measurements.NL SST coe cientsA1A2A3A4NOAA-14day0.9398130.0760660.801458255.165 NOAA-14night0.9331090.0780950.738128253.428 NOAA-12day0.8769920.0831320.349877236.667 NOAA-12night0.8887060.0816460.576136240.229MCSST coe cientsB1B2B3B4NOAA-14day 1.017342 2.1395880.779706278.430 NOAA-14night 1.029088 2.2753850.752567282.240 NOAA-12day0.963563 2.5792110.242598263.006 NOAA-12night0.967077 2.3843760.480788263.940X.L i et al.1292CoastWatch because there is a problem in the calibration of that channel during part of each orbit.For consistency,the NLSST split-window equation is also used for the NOAA-14CoastWatch equations.2.4.CoastWatch image productsOnce SSTs are generated by the NLSST and MCSST algorithms and maps are generated for each CoastWatch region,the CoastWatch mapping system generates a series of`sector’images from the region maps.These sector maps are all512512 pixels in size for selected areas within the region.Sectors are produced at full-resolution for the validation areas shown in gure2.Sector maps can be infrared or visible channels,angles,SST or cloud masks.All the sector products as well as the full-resolution region maps are now being archived.In this study,we use the full resolution images to validate the AVHRR SST product.A cloud-mask image product useful for interpretation of the SST imagery or for automatic multiday composing of cloud-free pixels is also generated.The algorithm employed is the CLouds from AVHRR(CLAVR)algorithm(Stowe et al.1991).With a series of threshold,uniformity,and channel-di V erence or ratio tests,the CLAVR algorithm determines whether each22pixel array in the region map is clear or cloudy.The cloud maps are generated in the same projection as the SST images and used as aids in determining the clear satellite±buoy matches used in the validation procedure.3.NOAA CoastWatch validation procedureThe CoastWatch validation system is an interactive,menu-driven,image and data processing system.The system was developed using the Interactive Data Language(IDL)computer language and can be run on both VAX and UNIXFigure2.CoastWatch high resolution AVHRR data remapped areas used in the CoastWatch validation system.Great Lakes:Lake Huron,Erie and Ontario(GE);Lake Michigan and Huron(GM);Lake Superior(GS).Northeast:Chesapeake Bay(EC);Gulf of Maine(EM);Southern New England(ES).Southeast:East Florida(SE);North Carolina(SN).Gulf of Mexico:Louisiana and Mississippi(ML);Texas(MT);West Florida(MW).AVHRR/SST accuracy for NOAA-12and-14satellites1293 platforms.This system is designed to provide long-term validation for the CoastWatch SST,visible and cloud-mask imagery.The hierarchy chart of the current validation system is presented in gure3.The National Centers for Environmental Predication(NCEP)provides the buoy data used in the matching procedure.These data are placed in the buoy data le four times a day.The buoy data le also gives the current NOAA moored buoy locations,so an analyst can overlay the buoy positions on the AVHRR imagery. AVHRR imagery is in the CoastWatch format and images are archived at the National Oceanographic Data Center(NODC).The main input for this long-term validation system is the Target Match File(TMF).The TMF is generated by extracting1515pixel array targets of the CoastWatch imagery(i.e.mapped full-resolution AVHRR HRPT imagery including all ve channels,cloud masks and SST)centred at NOAA moored buoy positions on the NOAA/NESDIS Central EnvironMental Satellite Computer System(CEMSCS)mainframe computer.The corresponding buoy data are appended to each target.The long-term validation system enables an analyst to(1)preview AVHRRFigure3.NOAA CoastWatch long-term AVHRR SST validation system.1294X.L i et al.images(both infrared and visible channels)to see whether an image contains cloud-free SST measurements at any buoy location,(2)overlay coastlines,grids,buoy locations and AVHRR imagery header information on the images,(3)renavigate the imagery by remapping the image to agree with selected ground control points (Krasnopolsky and Breaker1994),(4)display cloud masks,(5)extract clear33 arrays of CoastWatch SST values centred on each of the buoys in each coastal region,(6)create an output SST match le which contains satellite and buoy SSTs, air temperature,wind and wave information,solar and satellite zenith angles and navigation information,and(7)calculate statistics and make graphic output.Further, cloud screening is done by examining SST and,when necessary,visible imagery.If fog or cloud is suspected,a matchup is not made.Table3shows the locations of the NOAA moored buoys used for validation.4.Validation resultsIn1997,the validation was performed in the Gulf of Mexico,Southeast US and Northeast US coastal regions as well as in the Great Lakes region every other month.Both NOAA-12and NOAA-14satellite images were validated.The centre value of the33arrays of SST measurements in the SST match le was taken as the satellite SST.The mean and standard deviation of all the di V erences in each region were then calculated and stored in the SST match le.During1997,there were a total of1829matchups in the three coastal regions,and693matchups in the Great Lakes.The Great Lakes matchups were usually not available in the winterTable3.NOAA moored buoys used in the AVHRR SST validation.There are a total of24buoys.Buoy ID Region t. 42001Gulf of Mexico88.653325.9283 42002Gulf of Mexico93.567525.8917 42003Gulf of Mexico85.914225.9361 42007Gulf of Mexico88.770030.0900 42019Gulf of Mexico94.999427.8967 42020Gulf of Mexico96.505627.0122 41002South East75.240632.2950 41004South East79.099432.5100 41009South East80.184228.5003 41010South East78.501928.8986 41001North East72.589734.6983 44004North East70.689738.4564 44005North East68.943942.8983 44011North East66.583341.0833 41014North East74.833636.5831 44025North East73.166740.2503 45001Great Lakes87.766448.0481 45002Great Lakes86.418345.3006 45003Great Lakes82.768145.3181 45004Great Lakes86.534247.5458 45005Great Lakes82.398341.6767 45006Great Lakes89.866747.3194 45007Great Lakes87.033342.6833 45008Great Lakes82.415844.2833AVHRR/SST accuracy for NOAA-12and-14satellites1295 when buoy maintenance was performed.In this study,the Great Lakes matchup dataset consists of data from May,July and September1997.Due to a calibration error which occurred in NOAA-12night-time passes from early May to early July of1997,large SST measurement biases were found for NOAA-12night-time SSTs.The NOAA-12night-time SST matchup dataset over this period of time was eliminated.There were a total of124and80bad data points for the three coastal regions and the Great Lakes region,respectively.That reduced our matchup dataset to1705and613matchup points.If the centre value of the33AVHRR SST array was two standard deviations above or below the nine points mean value,this matchup was not used in the statistics calculation.A signi®cant di V erence between the centre and the mean value can occur when there is a thermal front in the33array or some of the33array points are cloud contaminated.After we excluded the matchups beyond two standard deviations,the remaining matchup totals were1602for coastal regions and572for the Great Lakes region,respectively.This means that we included about94%of the matchups from the correctly calibrated dataset in our later analysis.The number of matches,satellite±buoy bias,and standard deviation of the di V er-ence for all coastal regions(Gulf of Mexico,Southeast US and Northeast US)and the Great Lakes region are given in table4.In addition,the linear correlation coe cients(R)between satellite and buoy measurements are given in table4.The scatter plots of satellite vs buoy measurements for NOAA-12and NOAA-14in the Gulf of Mexico,Northeast US,Southeast US and Great Lakes regions are presented in gures4(a)and(b).5.DiscussionFor the three US coastal regions,NOAA-14AVHRR SSTs calculated with the NLSST algorithm had a bias and standard deviation of0.16C and1.03C for daytime,and0.07C and0.84C for night-time.For NOAA-12daytime SST,the NLSST yields SSTs with a bias of0.43C and a standard deviation of1.00C.The Table4.Mean satellite±buoy SST di V erence(bias)and standard deviation for NOAA-12and NOAA-14satellites in1997.All24moored buoys matched within one pixel(1.1km at nadir)and an hour of cloud-free satellite data were used in the validation.For the Great Lakes region,the MCSST algorithm is used for daytime SST retrievals;all other measurements are made with the NLSST algorithm.R is the correlation coe cient between AVHRR-derived SST data and buoy measured SST data.(Satellite±buoy)Number SST bias SDSatellite Time Algorithm of matches(C)(C)R CoastWatch Northeast,Southeast and Gulf of Mexico regionsNOAA-14day NLSST4410.16 1.030.9911 NOAA-14night NLSST5020.070.840.9938 NOAA-12day NLSST3740.43 1.000.9909 NOAA-12night NLSST2850.20 1.070.9896 CoastWatch Great L akes regionNOAA-14day MCSST2150.38 1.010.9958 NOAA-14night NLSST1570.410.800.9861 NOAA-12day MCSST1220.260.830.9930 NOAA-12night NLSST78 1.52 1.270.9942。